
System Design and Validation of a Wireless Sensor Monitoring System in Silage


Abstract
:1. Introduction
- Hardware development (node);
- Connectivity;
- Energy management;
- Data management.
- Pre-testing (sensor validation) in jars (year 1);
- Testing prototype in field conditions (year 1);
- Field testing on TUM research farm (year 2).
2. Literature Review
2.1. Silage Process
2.2. Wireless Sensor Networks in Agriculture
2.3. Technical Fundamentals of Existing Silage Monitoring Tools
3. Materials and Methods
3.1. Module Design Requirements
3.2. Hardware and Connectivity Specification
- Temperature (°C) at surface and in 40 cm depth,
- Oxygen concentration (%),
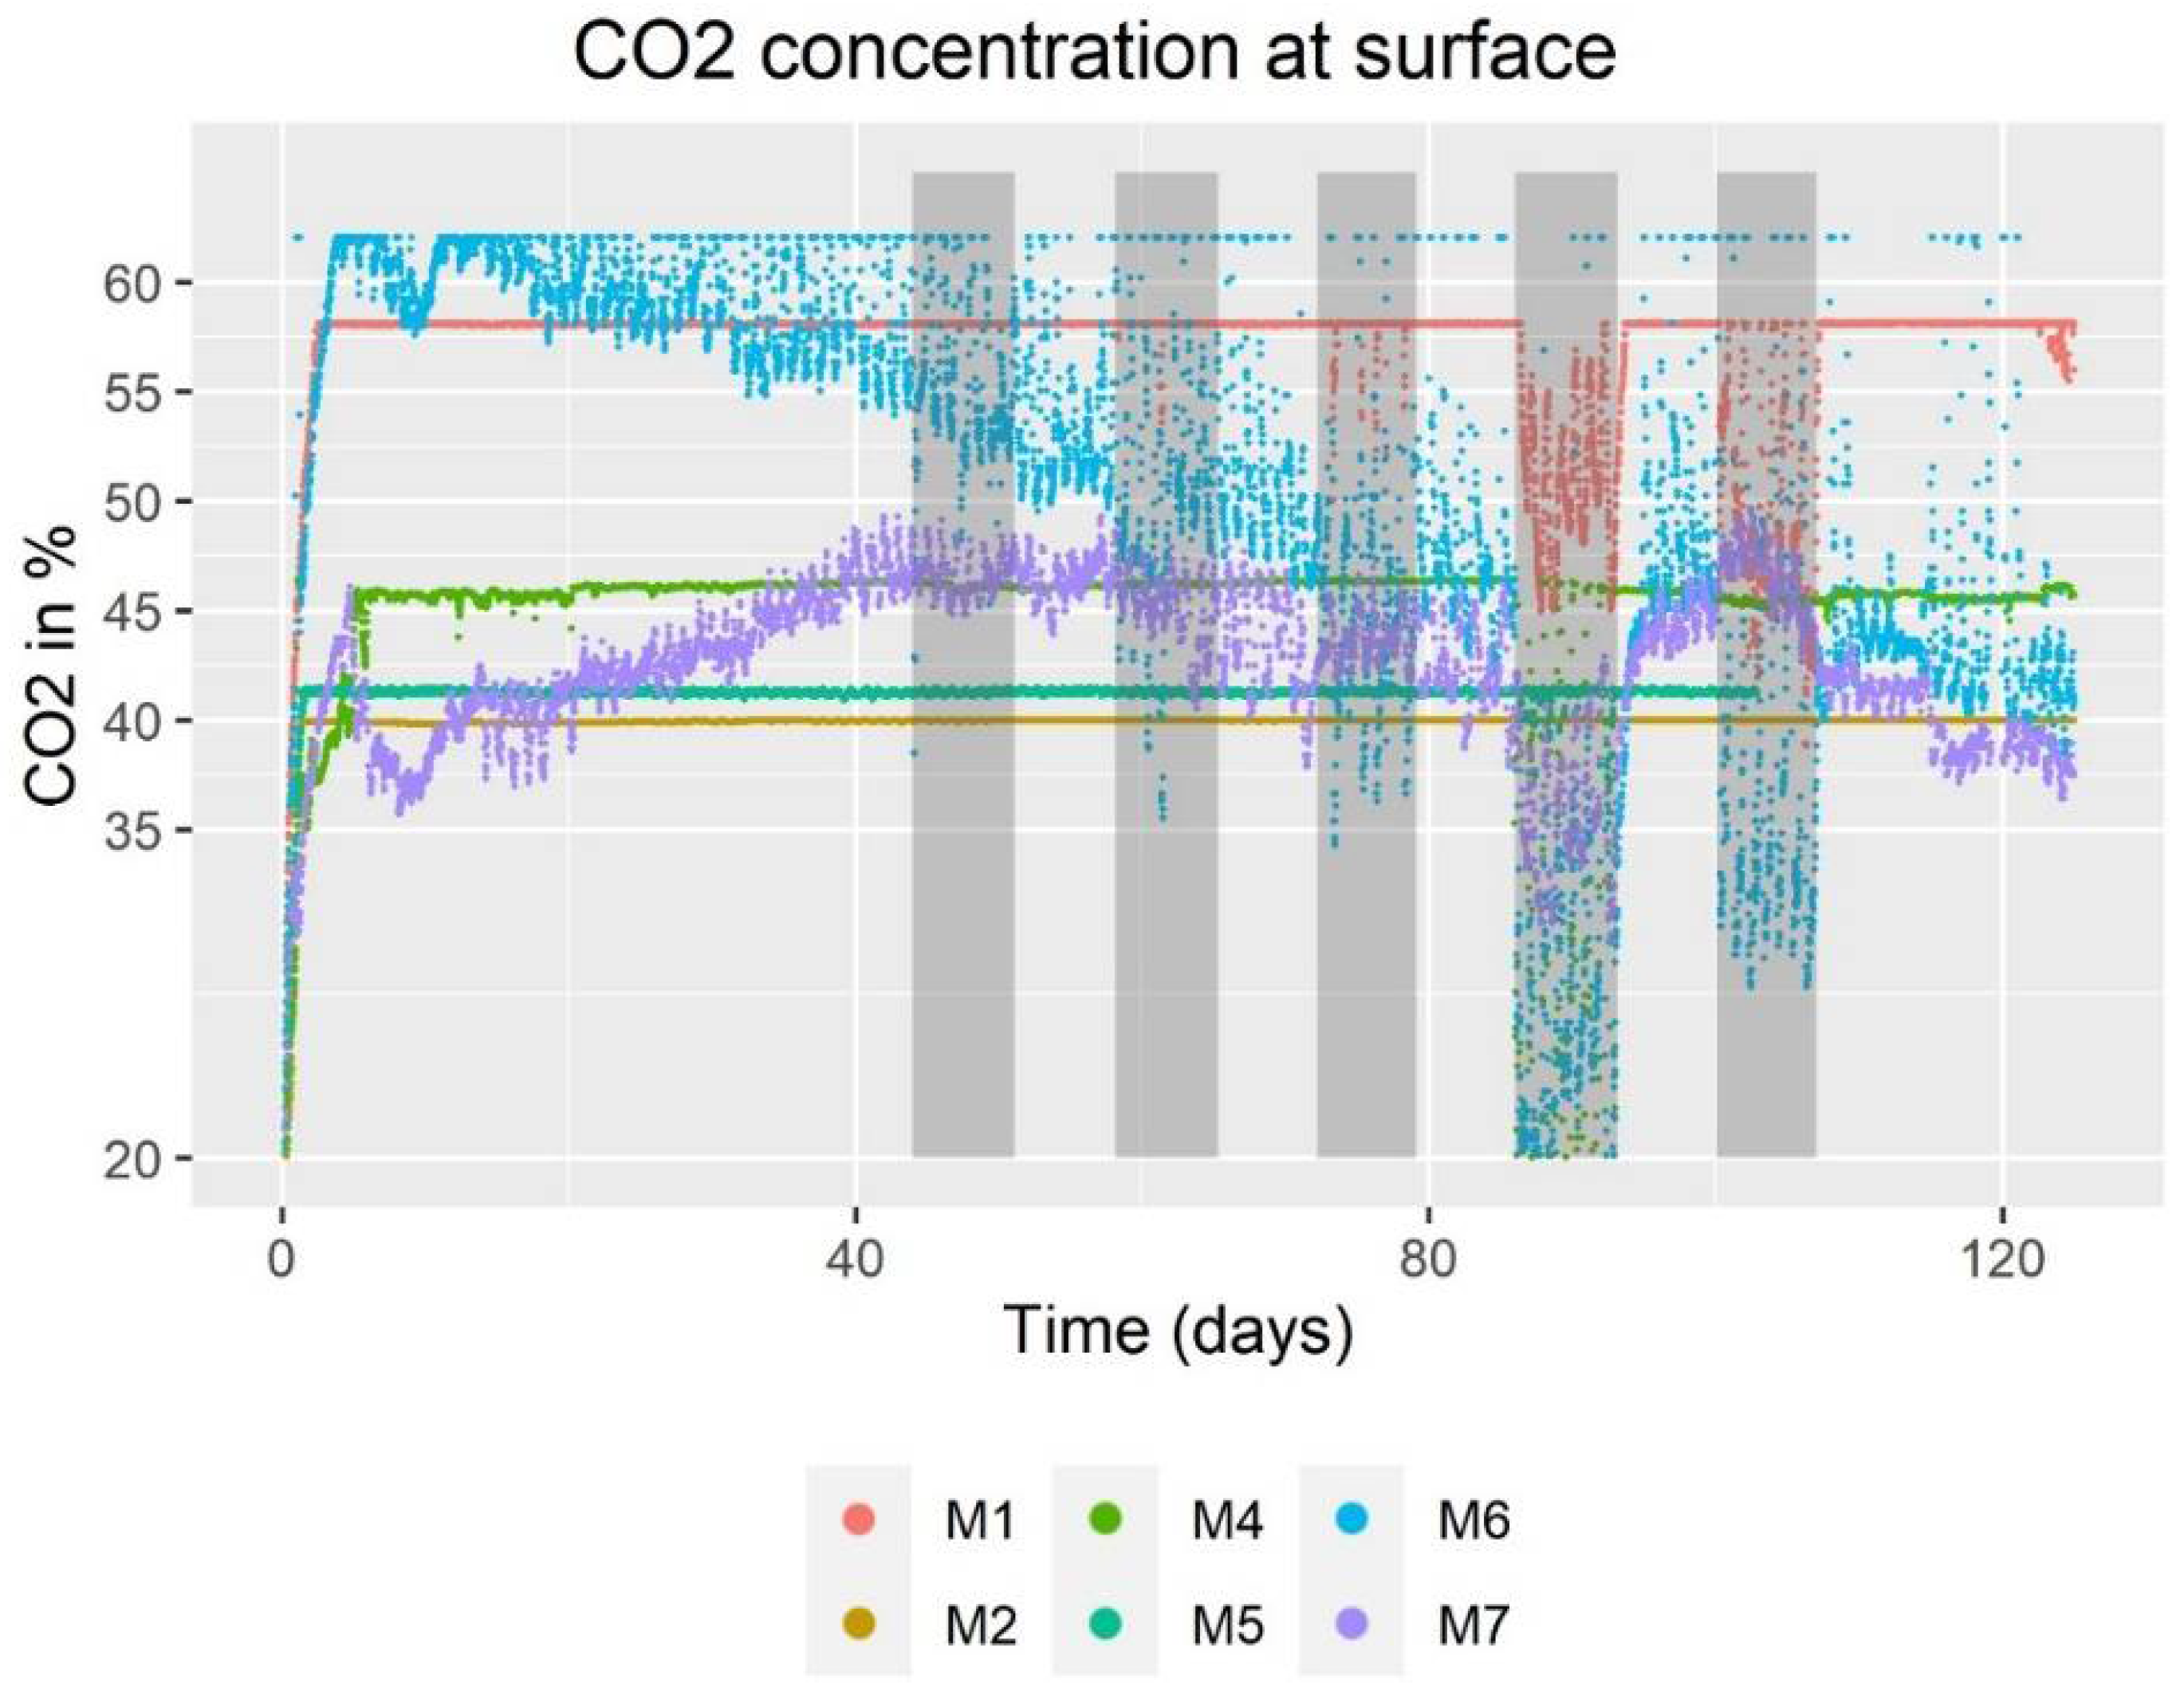
- Carbon dioxide concentration (%),
- Humidity (%),
- Air pressure (hPa).
3.2.1. Sensors and Batteries
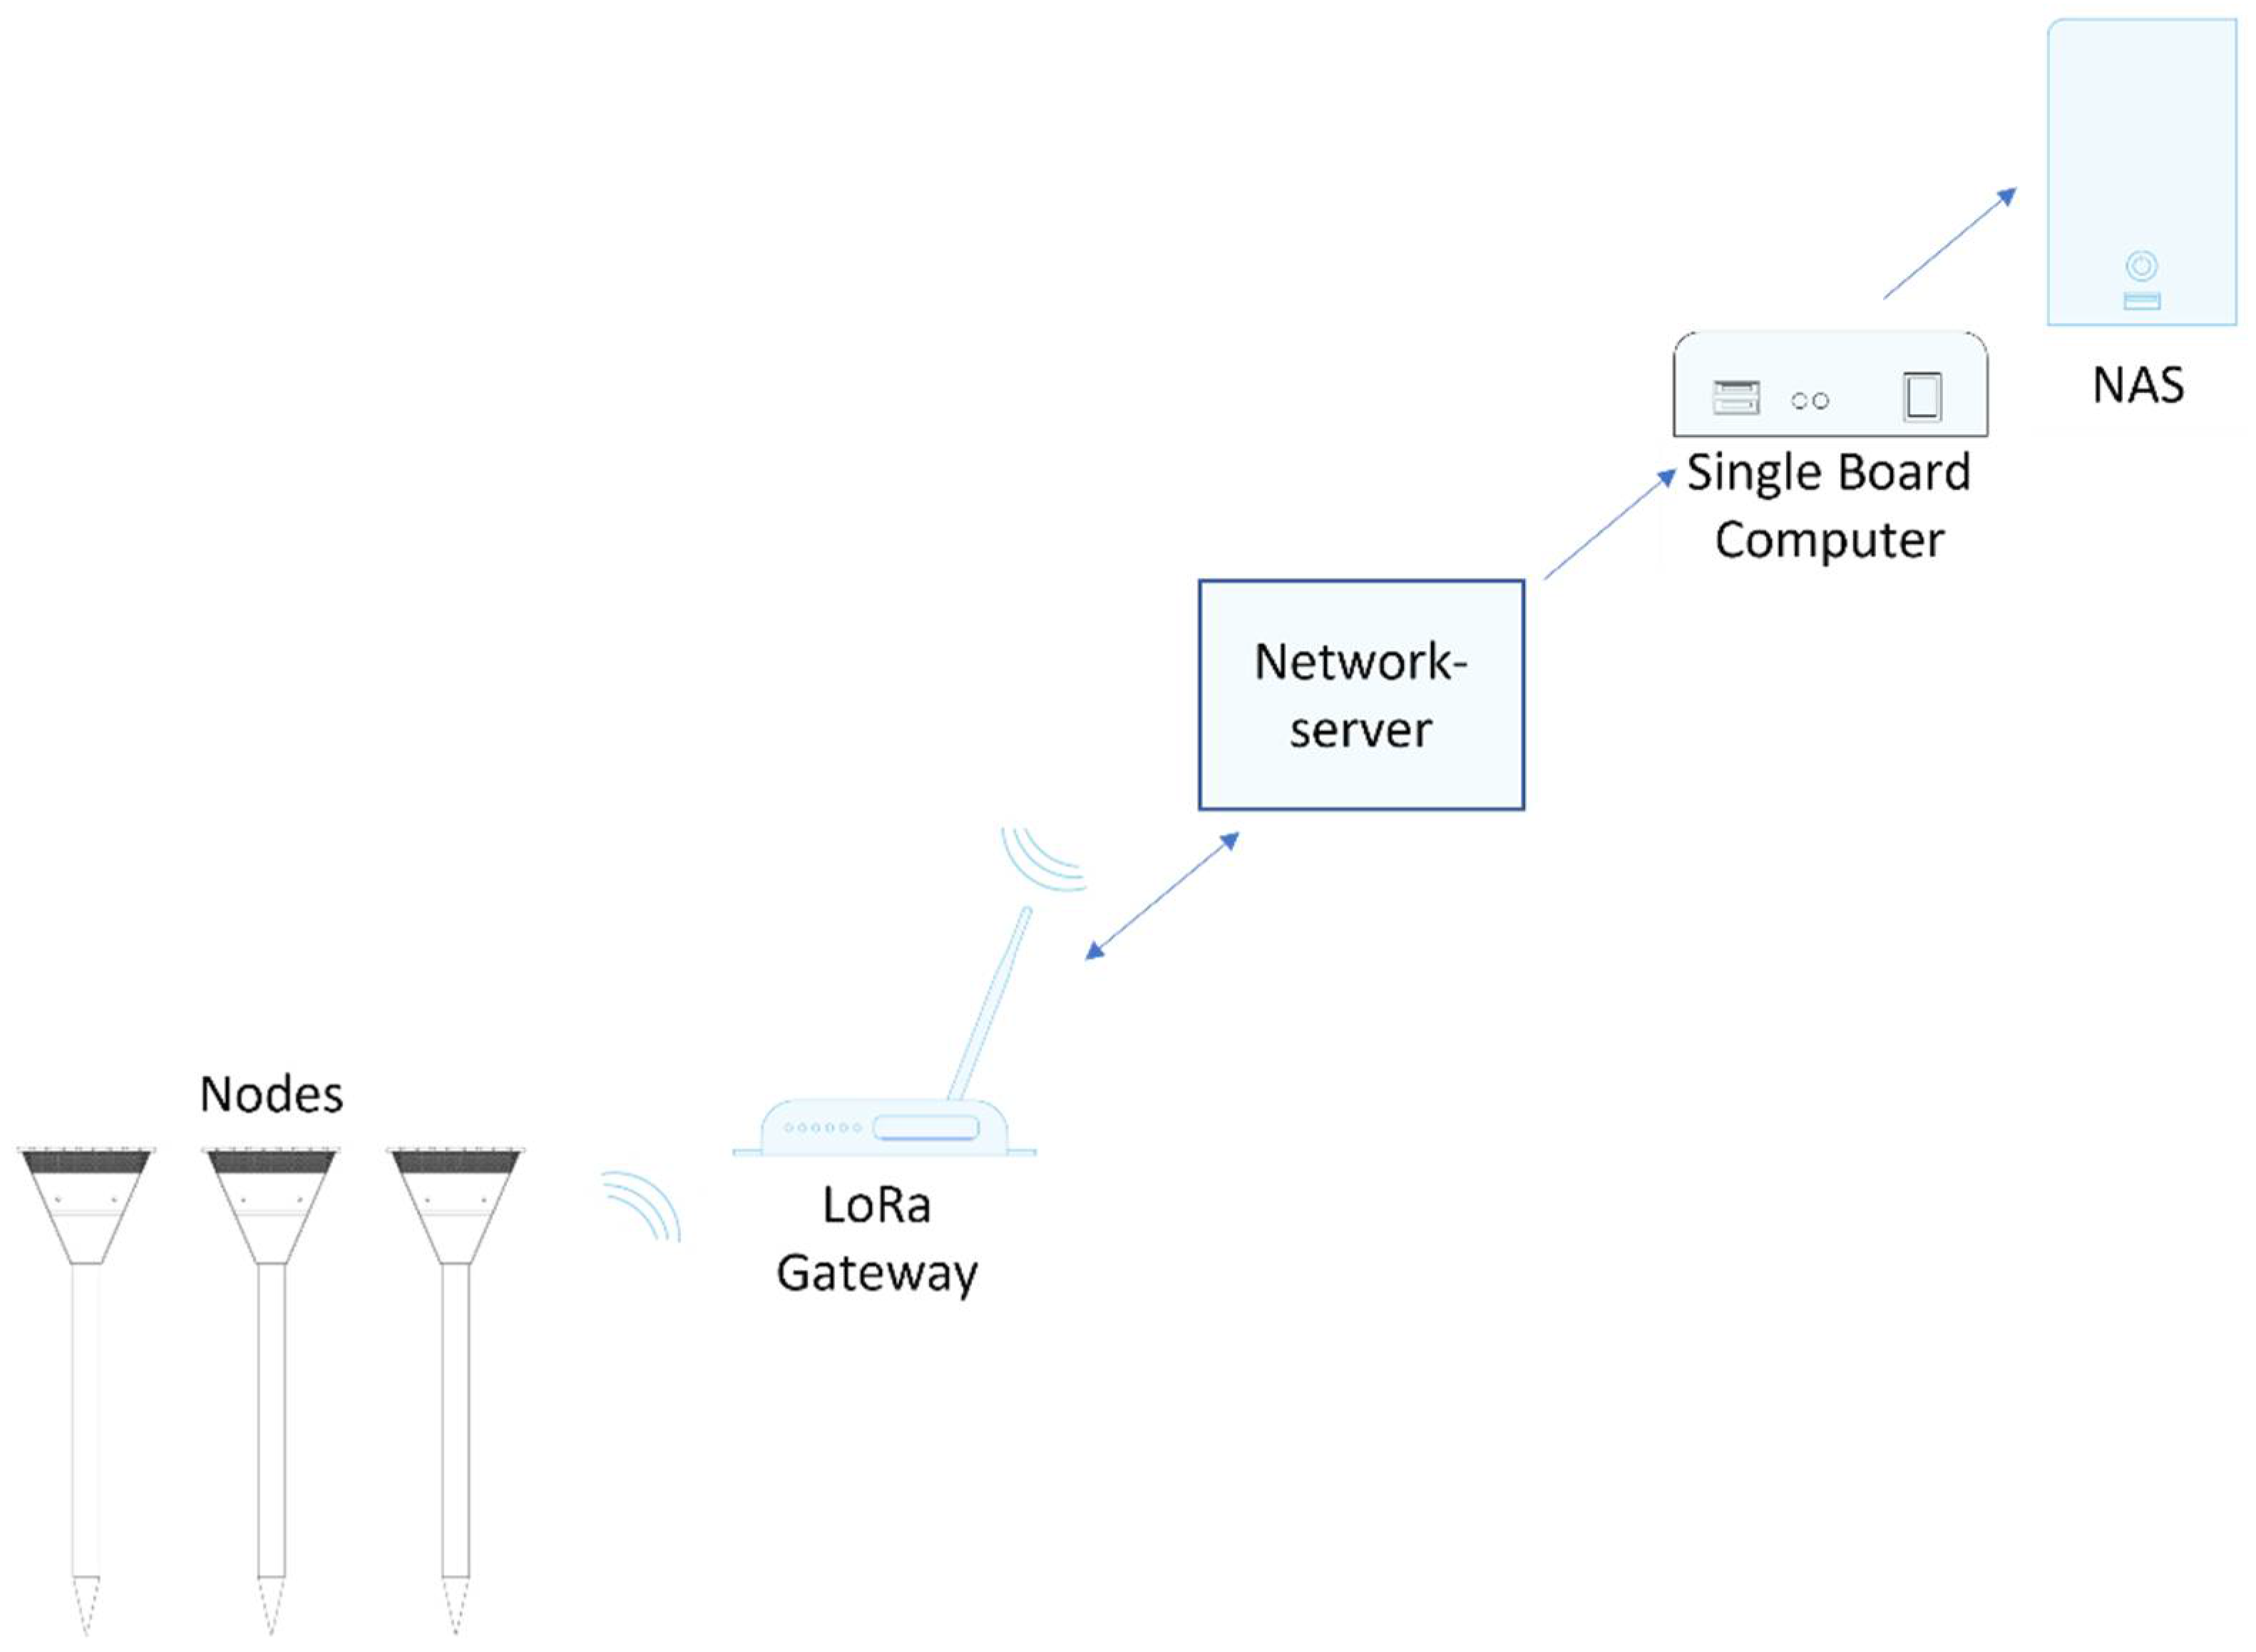
3.2.2. Connectivity and Data Management
3.3. Testing and Validation
3.3.1. Mason Jar Test
3.3.2. Test Silo
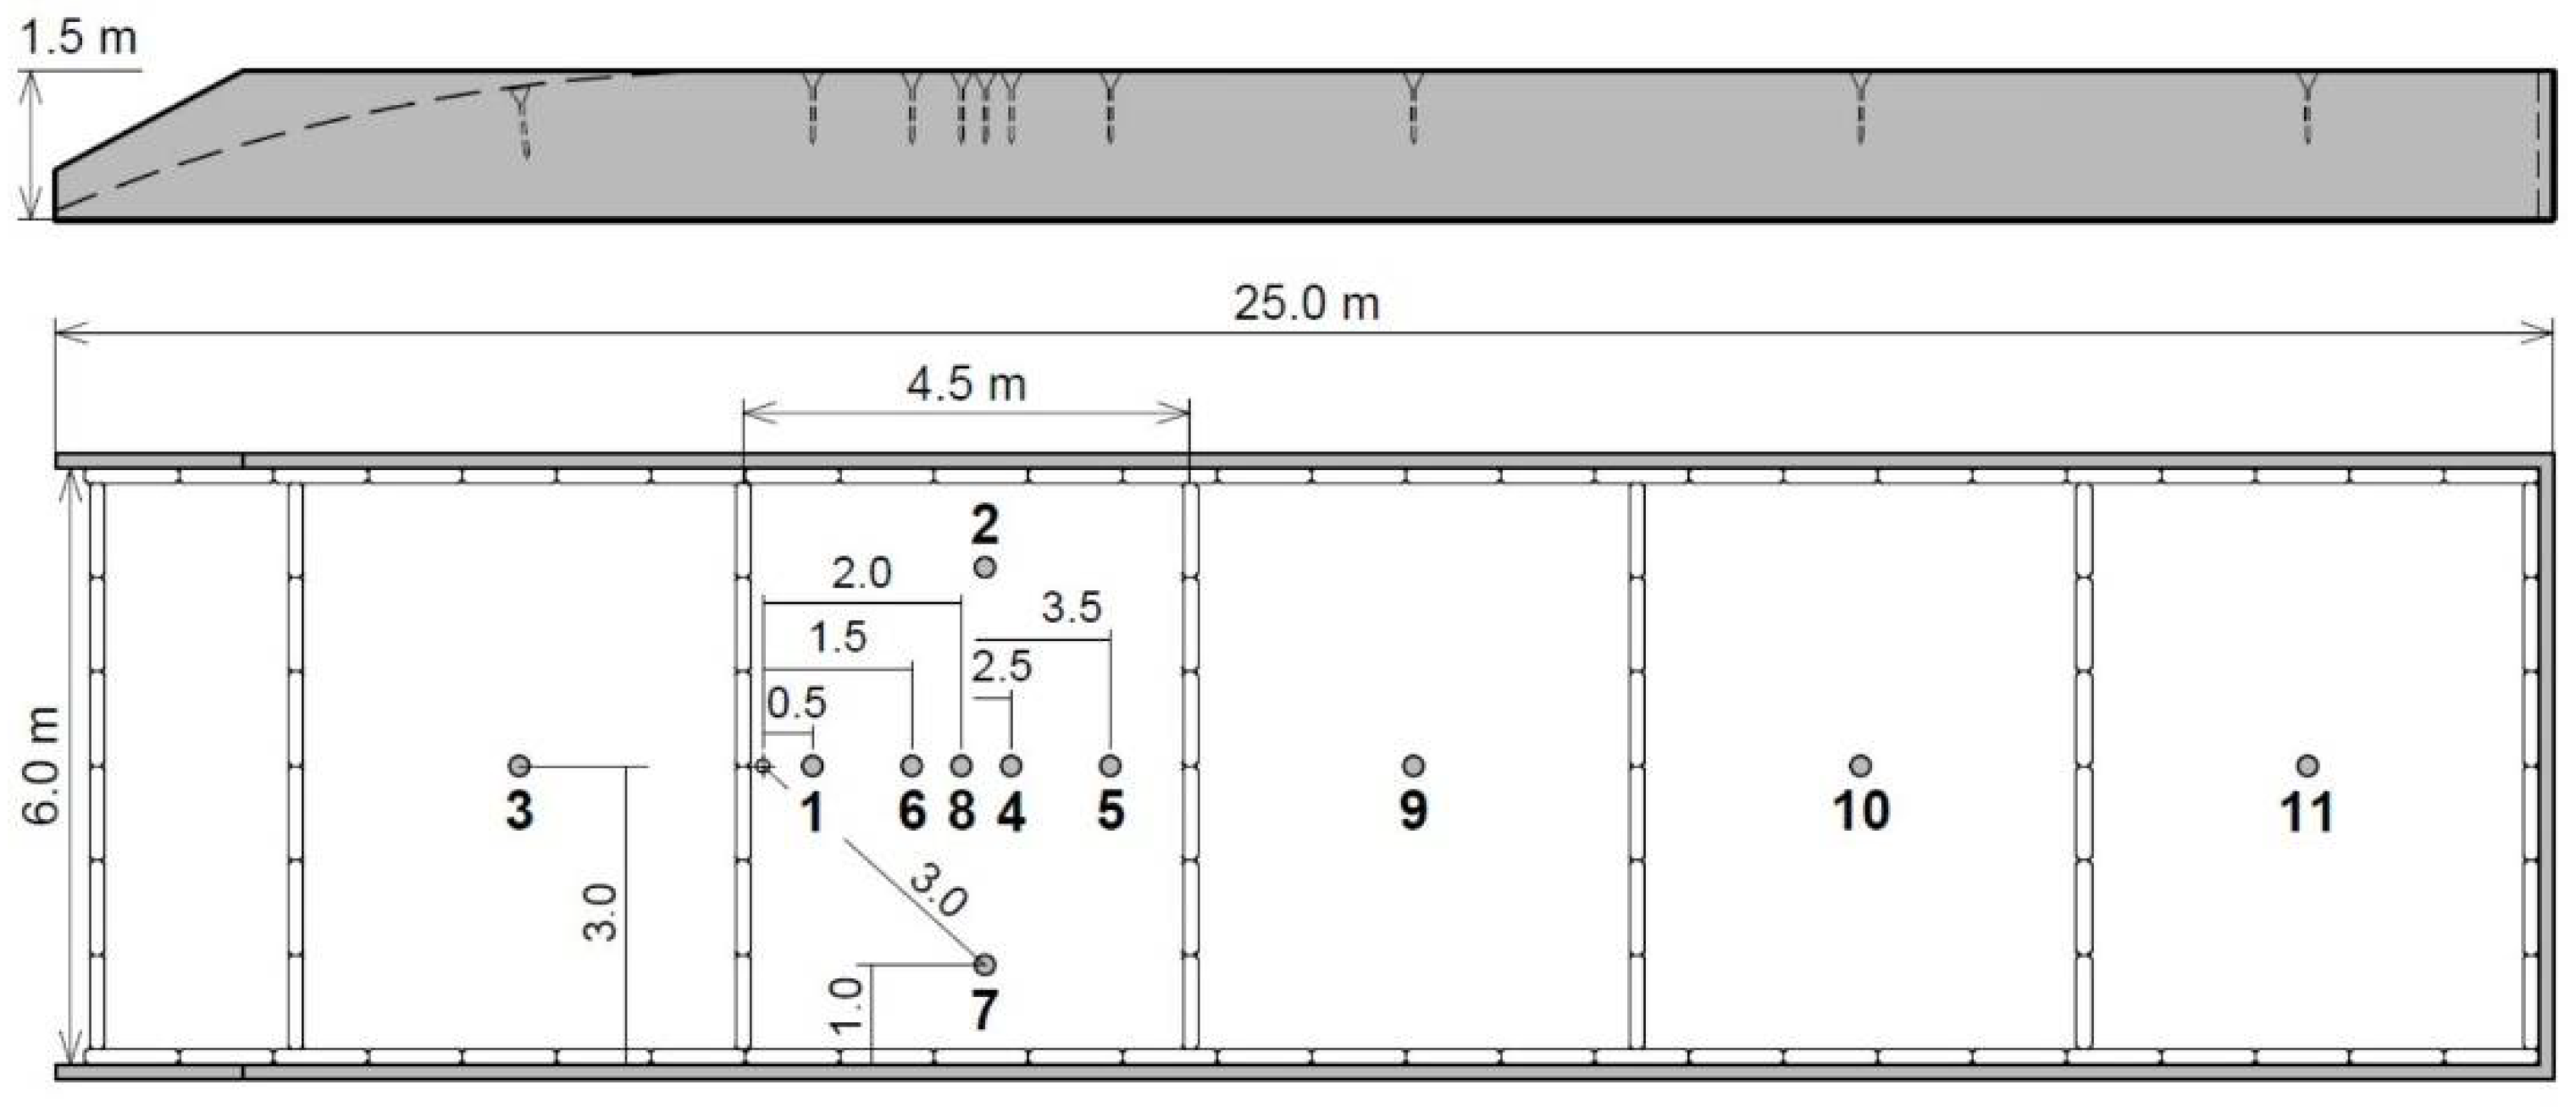
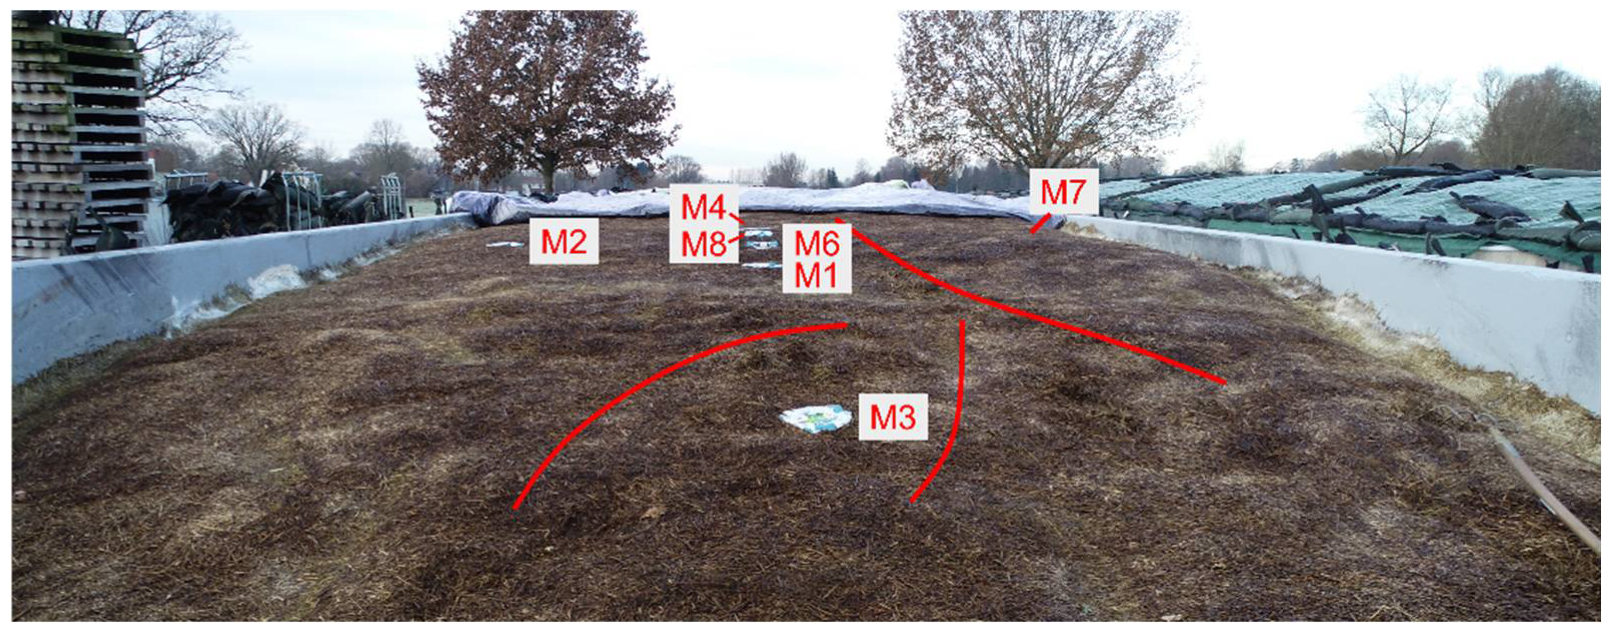
3.3.3. Full Scale Test
4. Results
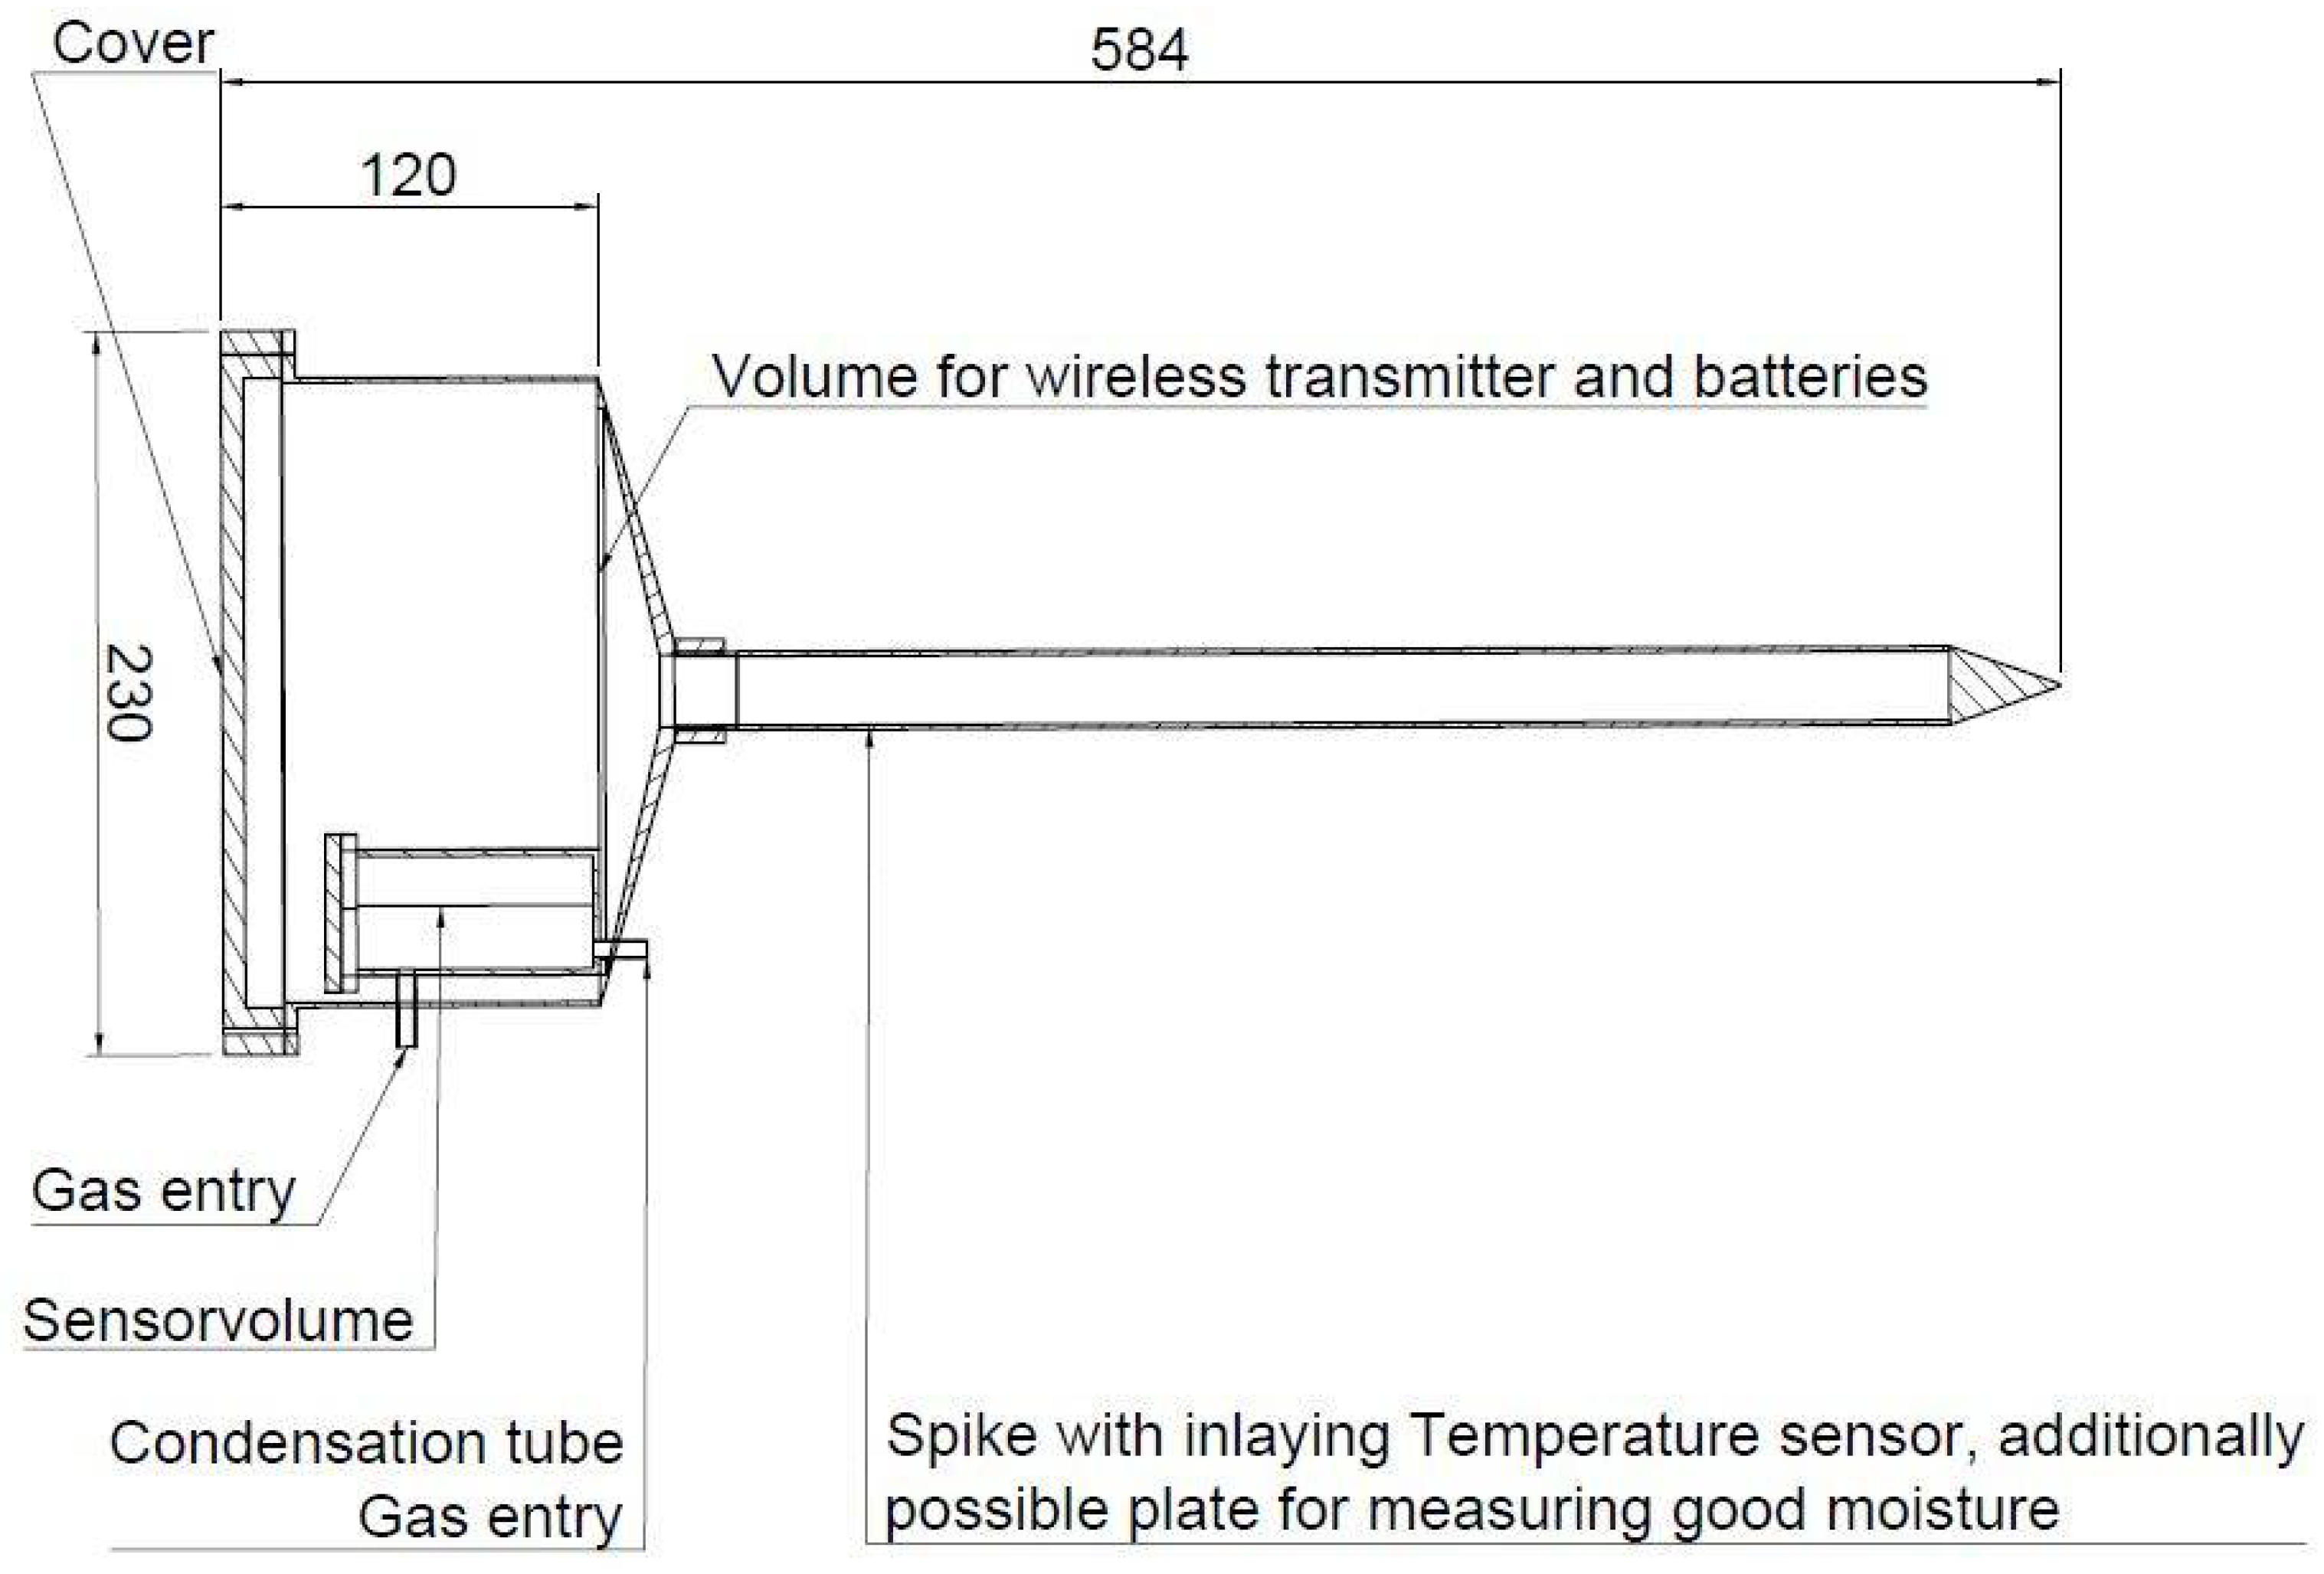
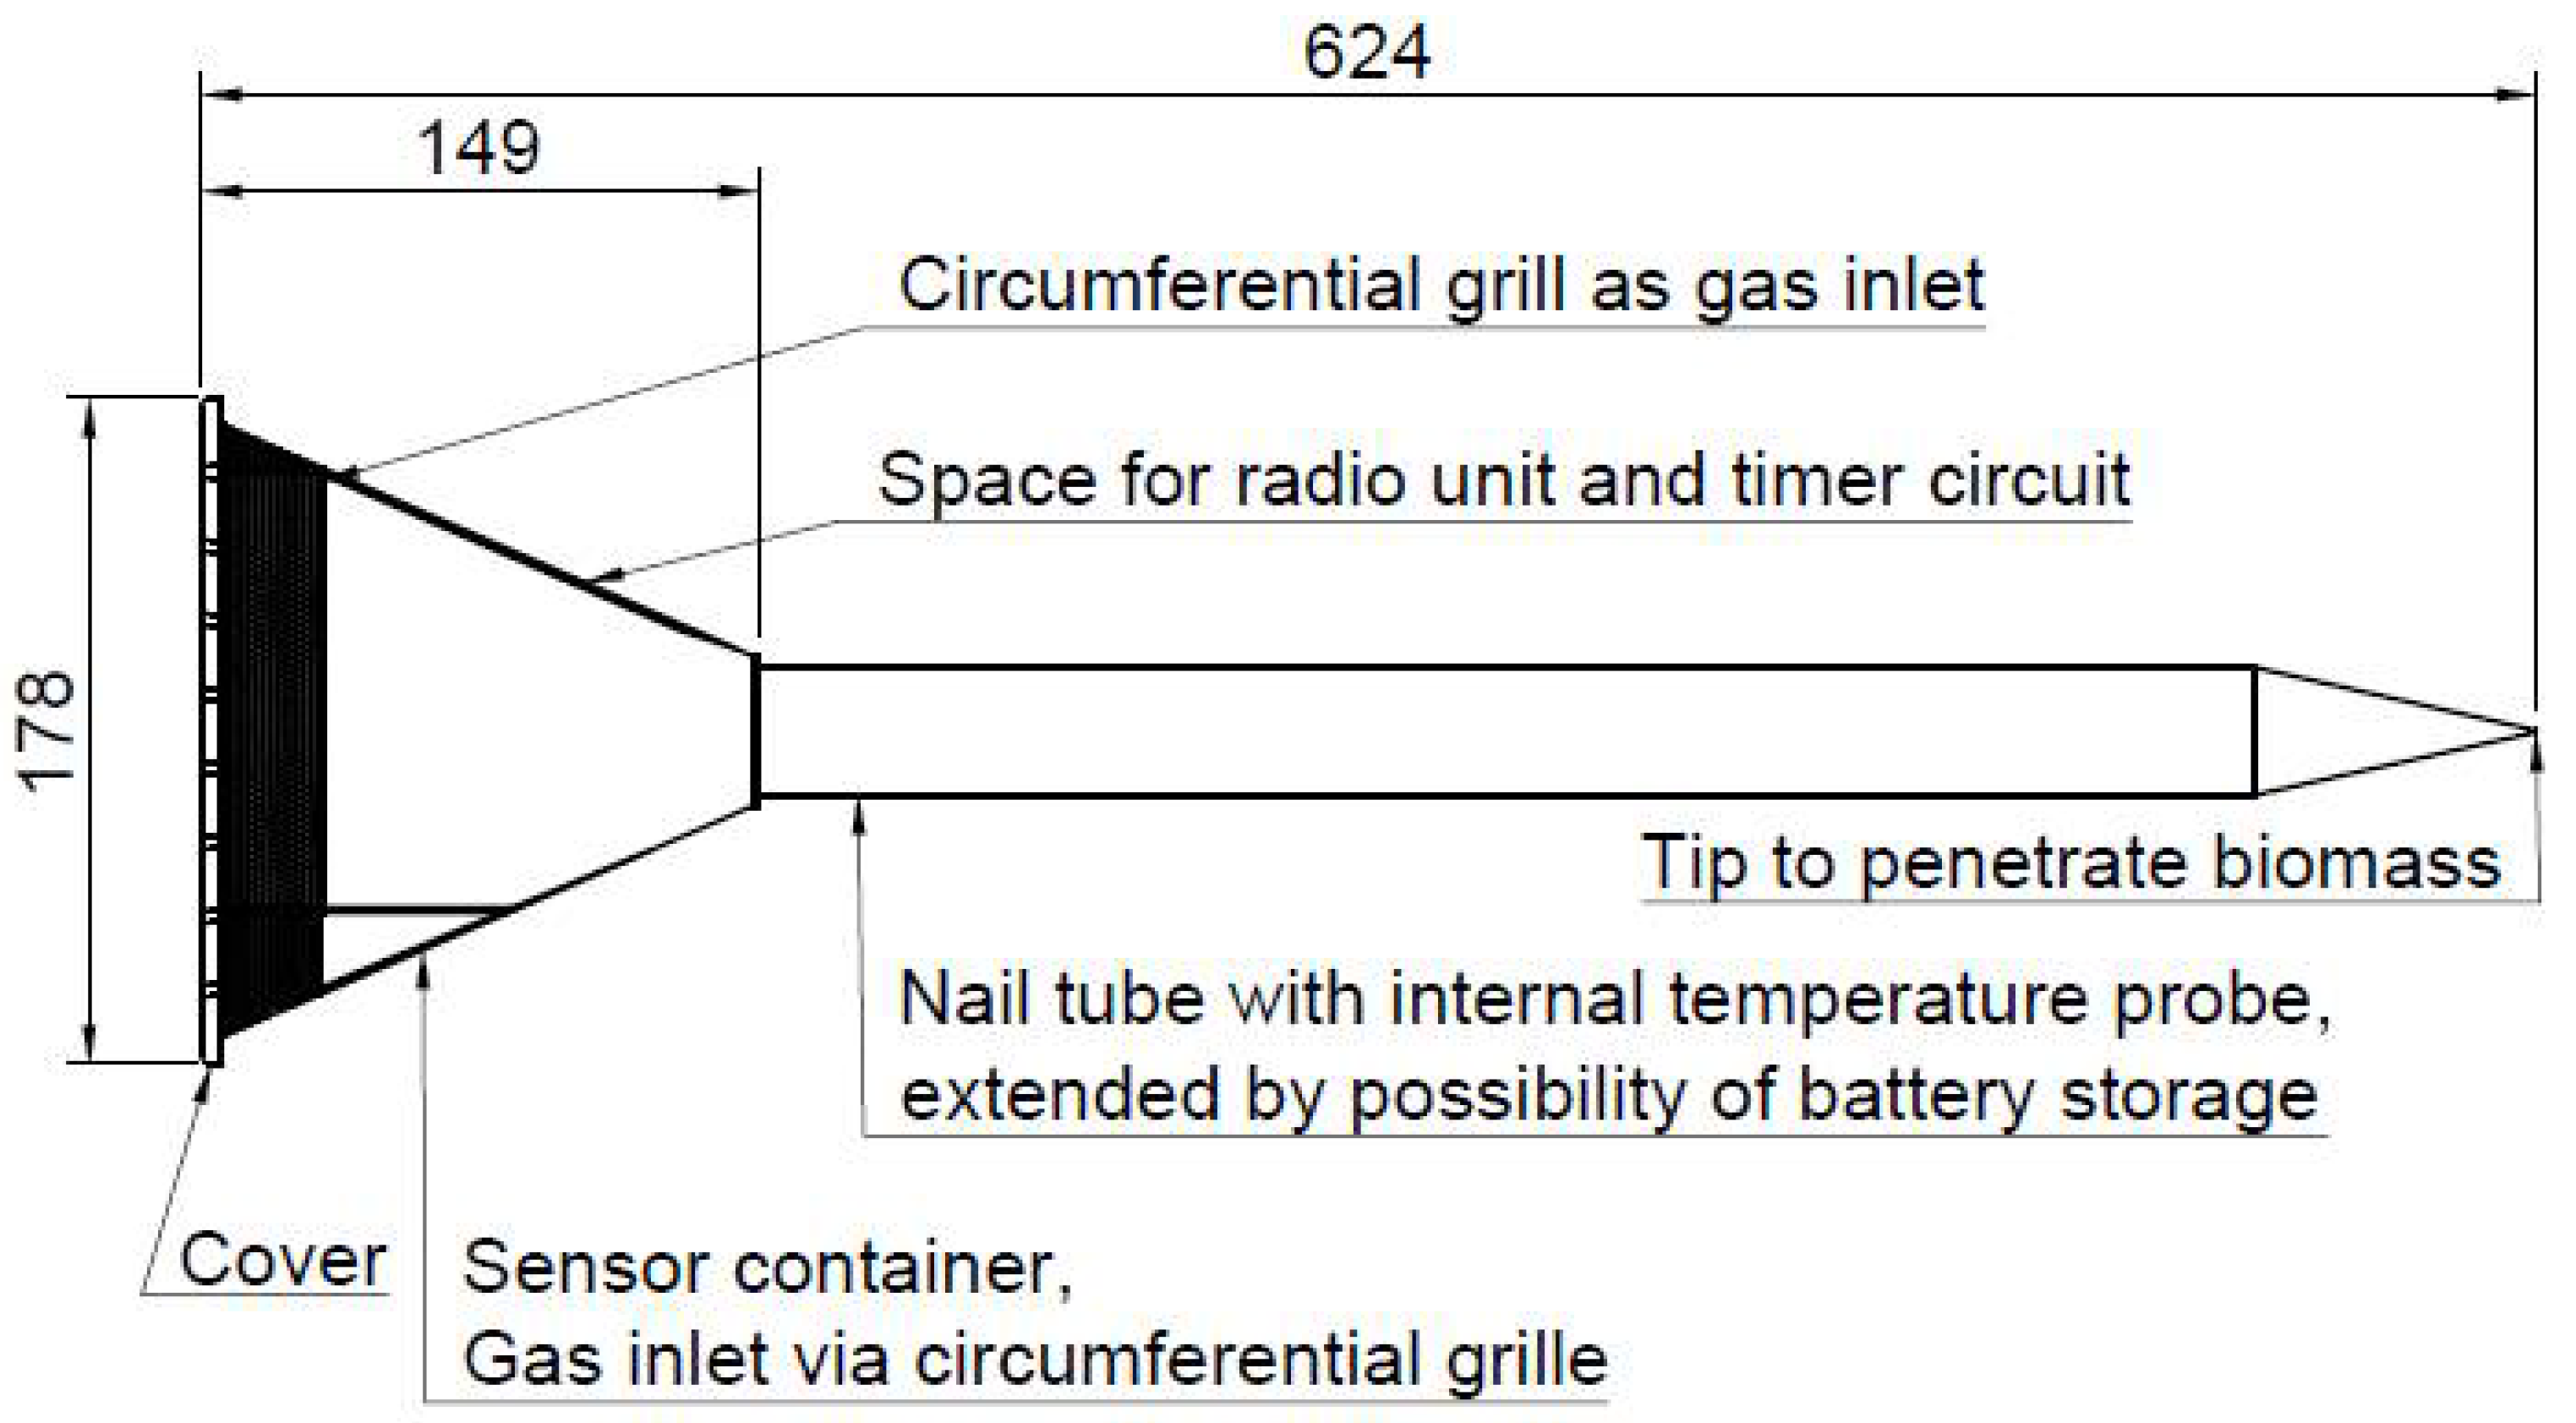
4.1. Module Design
4.2. Hardware and Connectivity Development Results
4.2.1. Sensor Durability
4.2.2. Timer Circuit and Energy Sufficiency
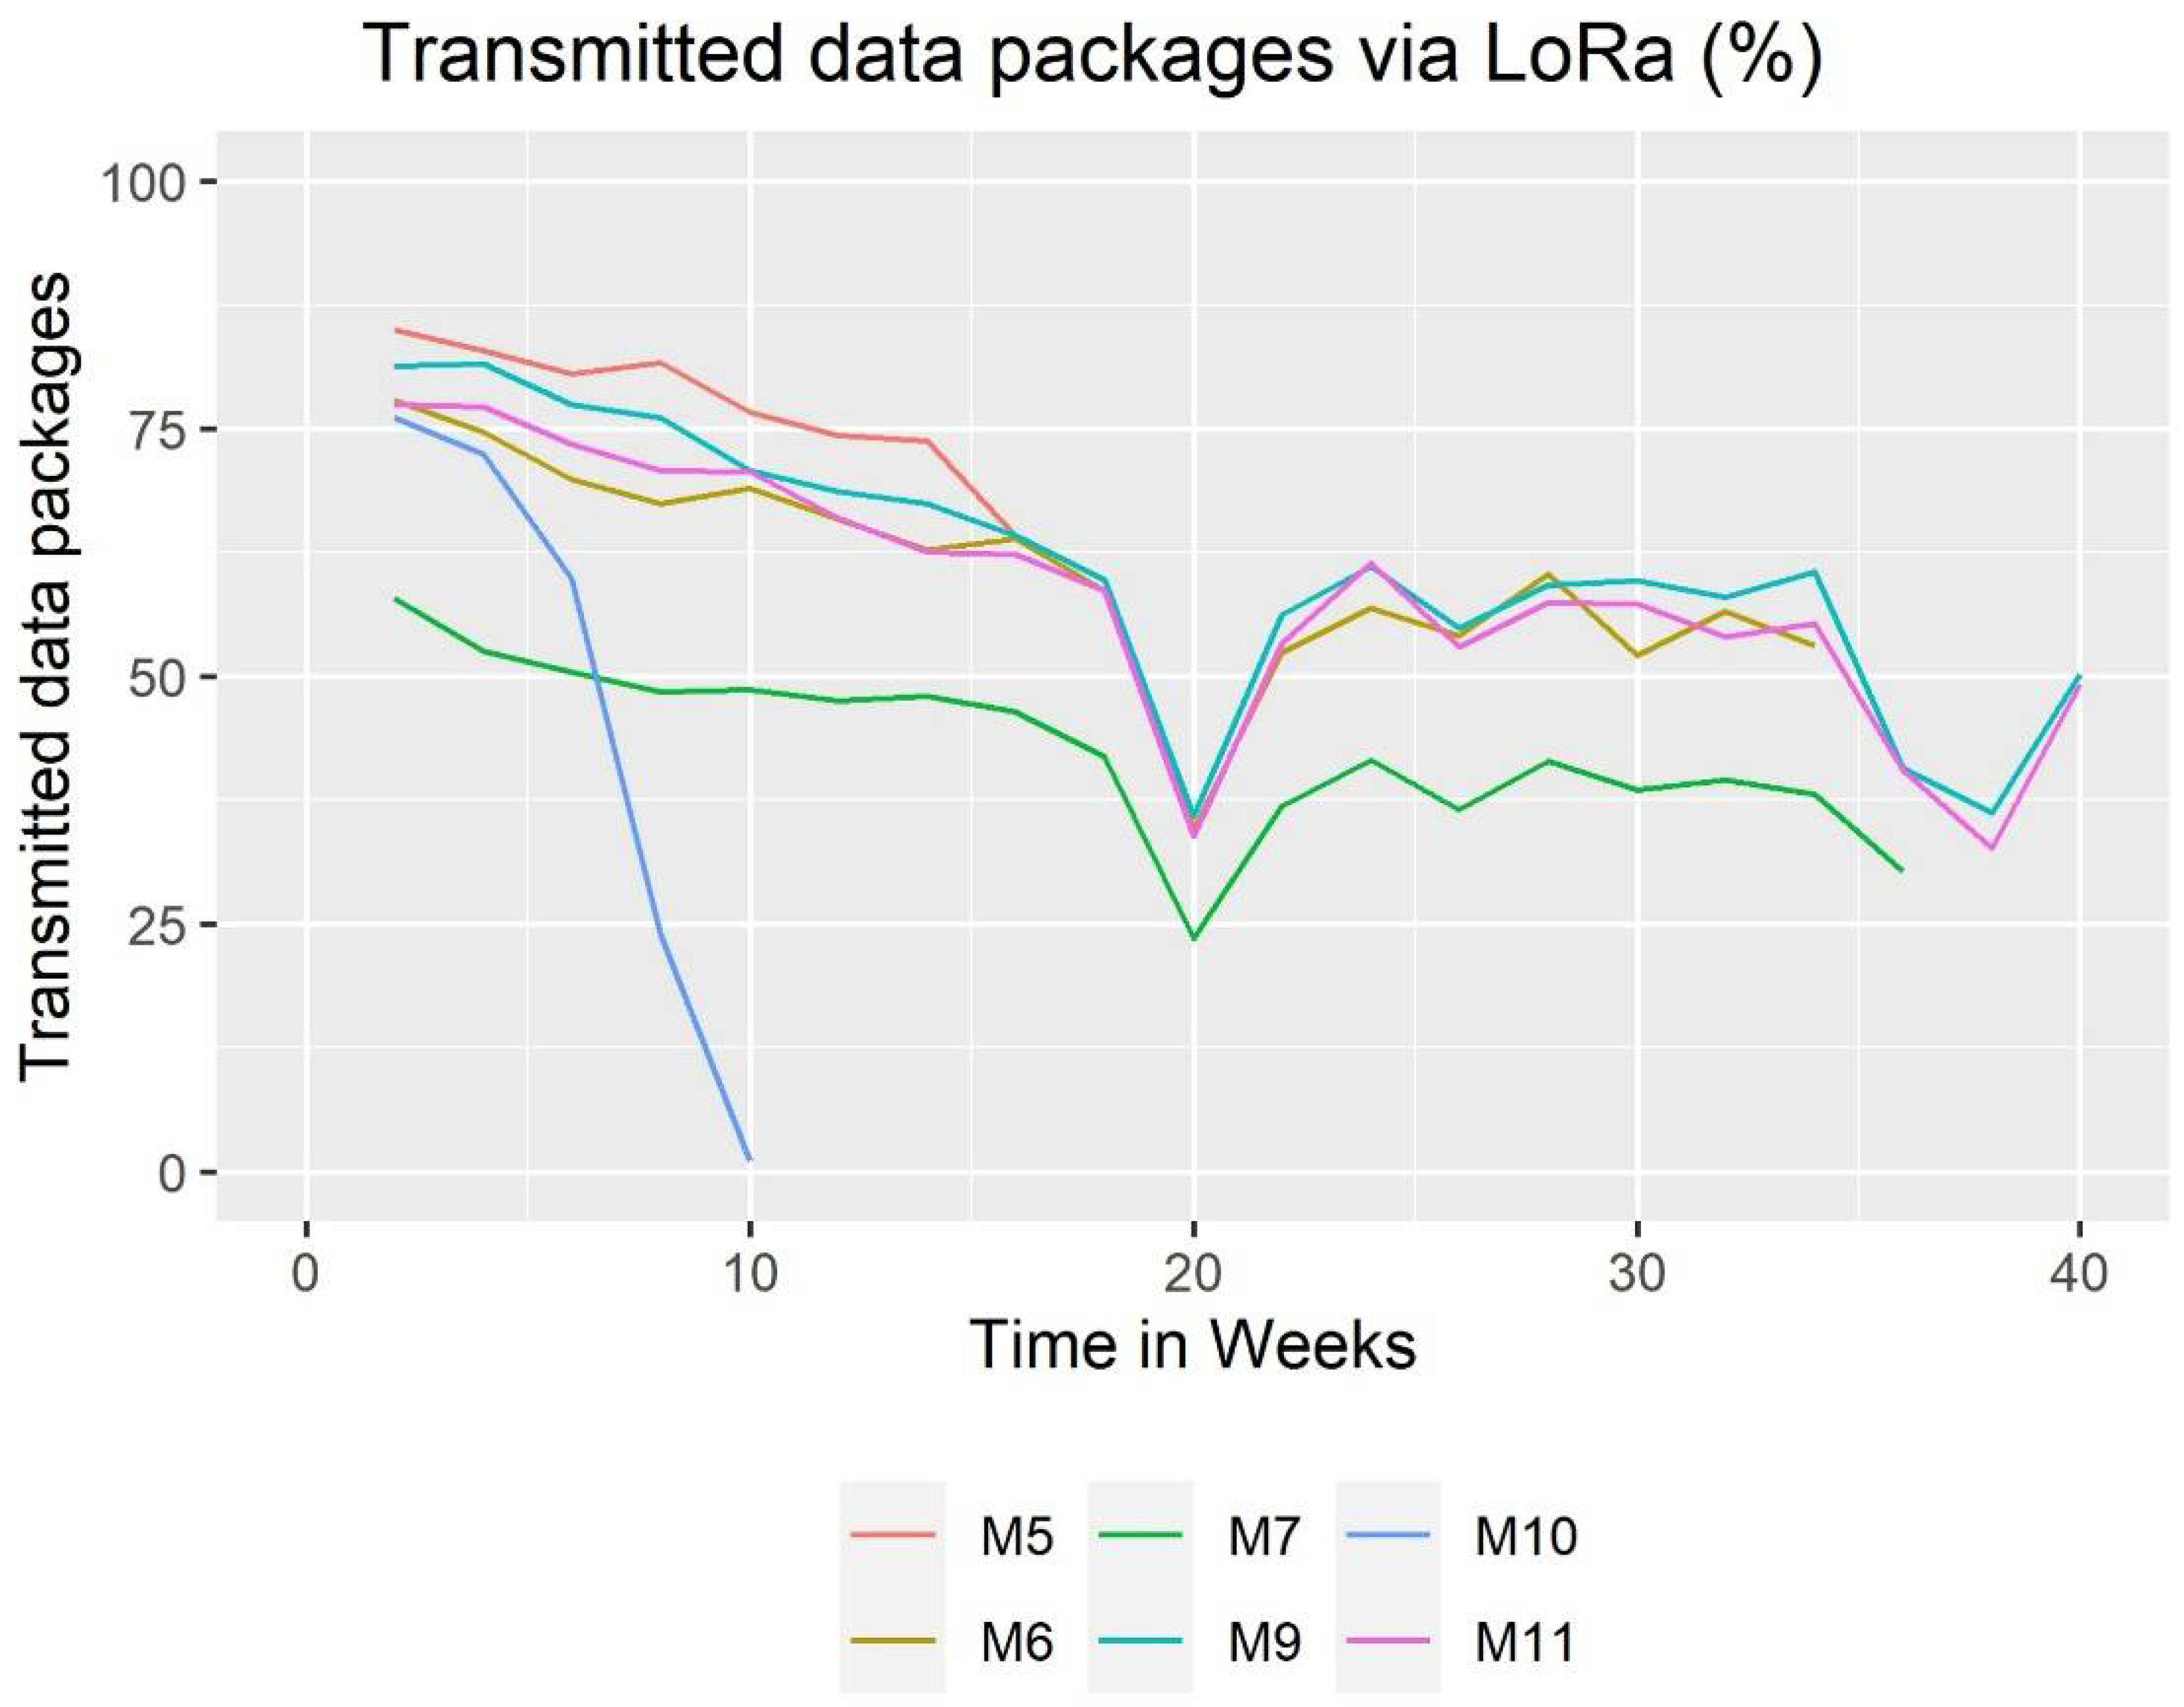
4.2.3. Connectivity
4.3. Testing Results
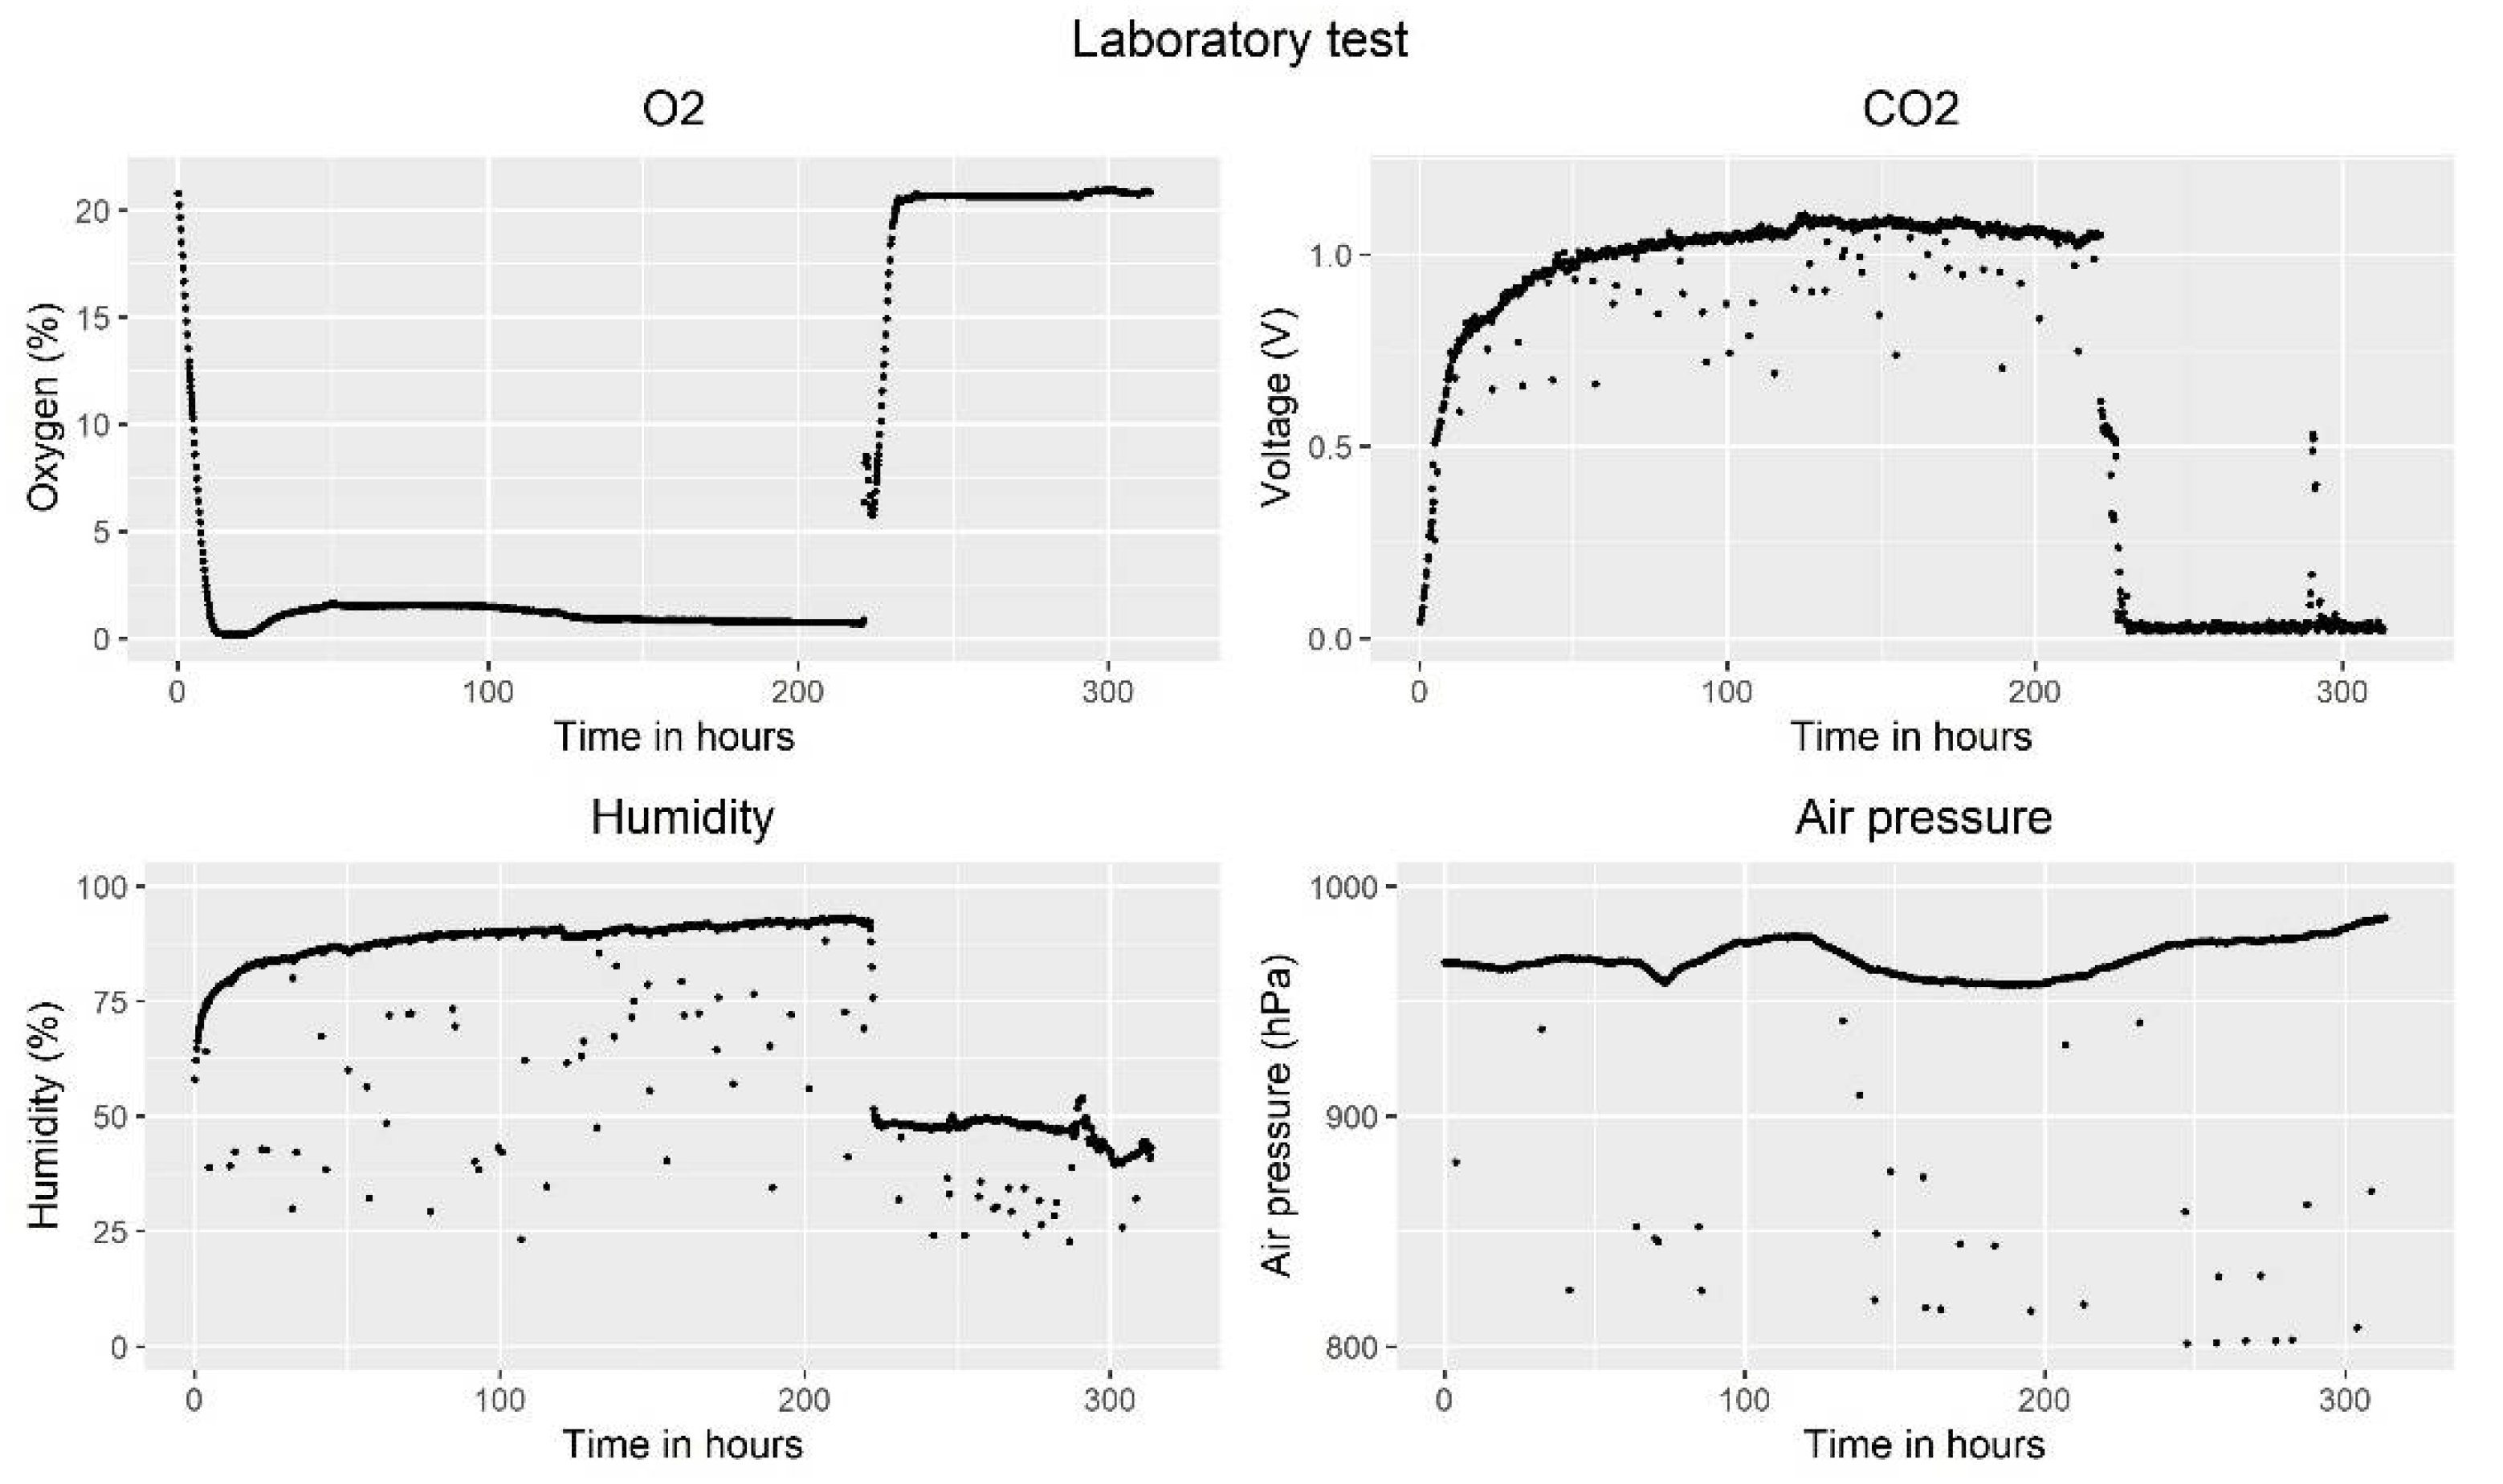
4.3.1. Mason Jar Test
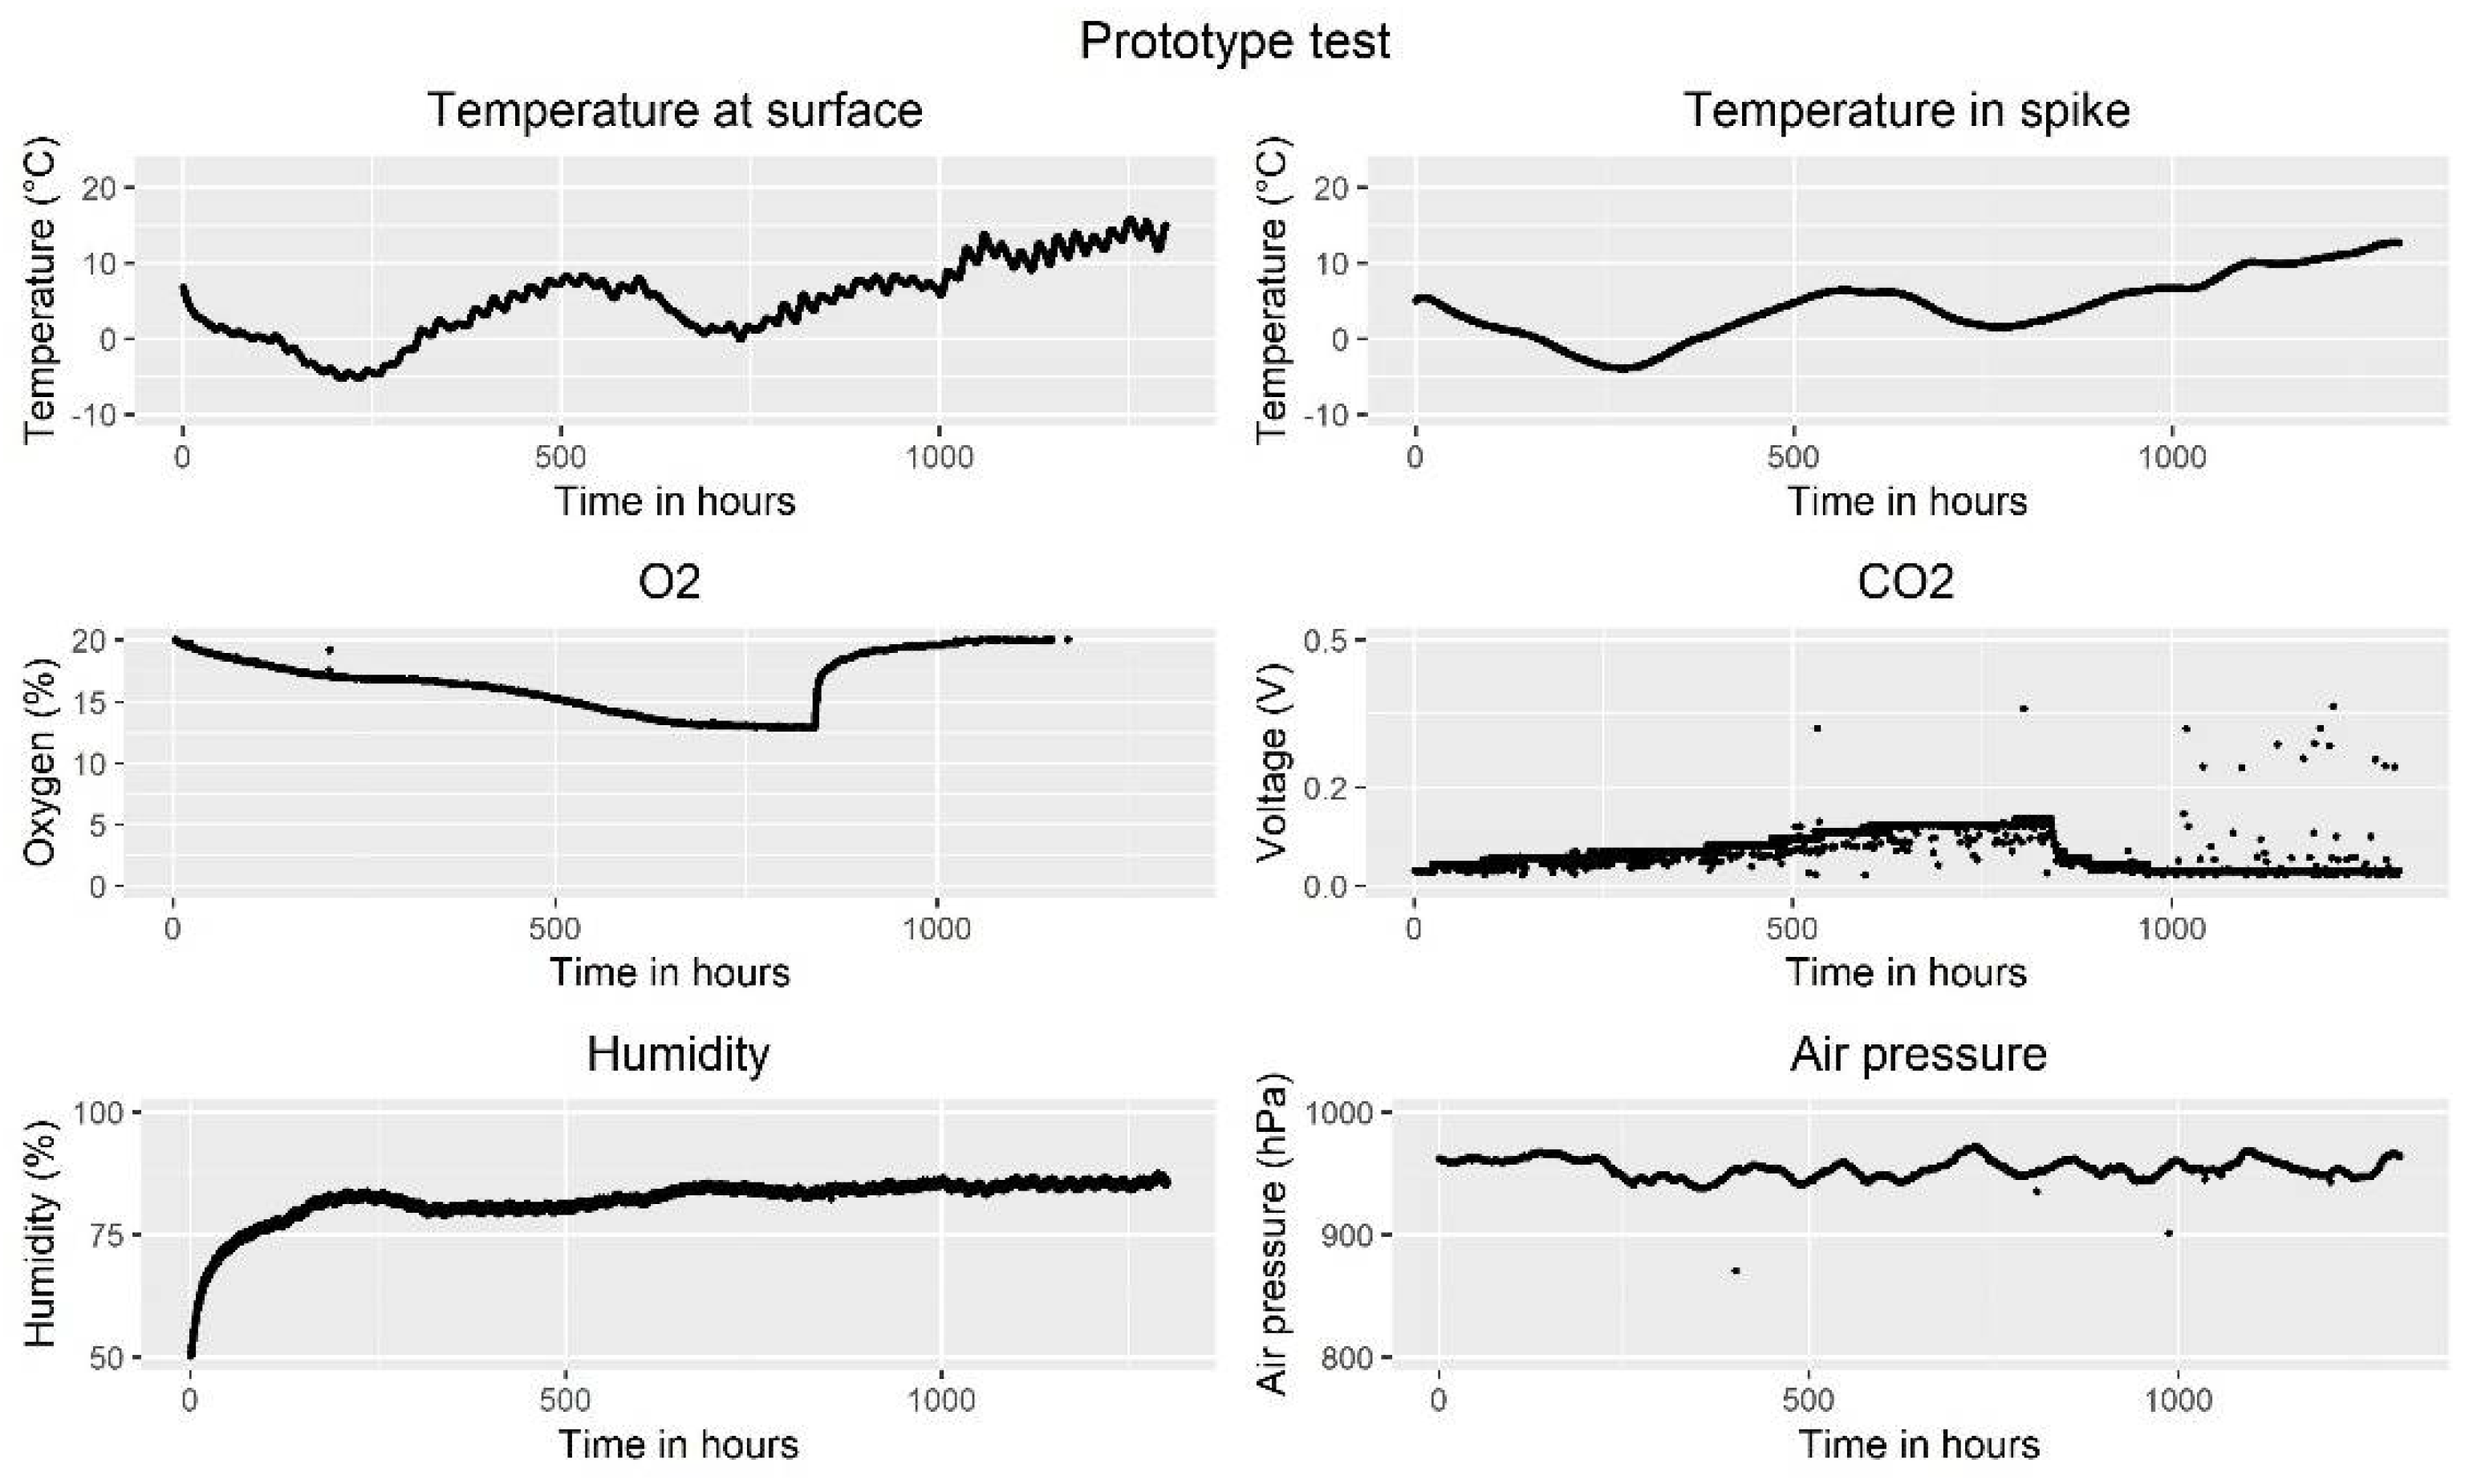
4.3.2. Test Silo
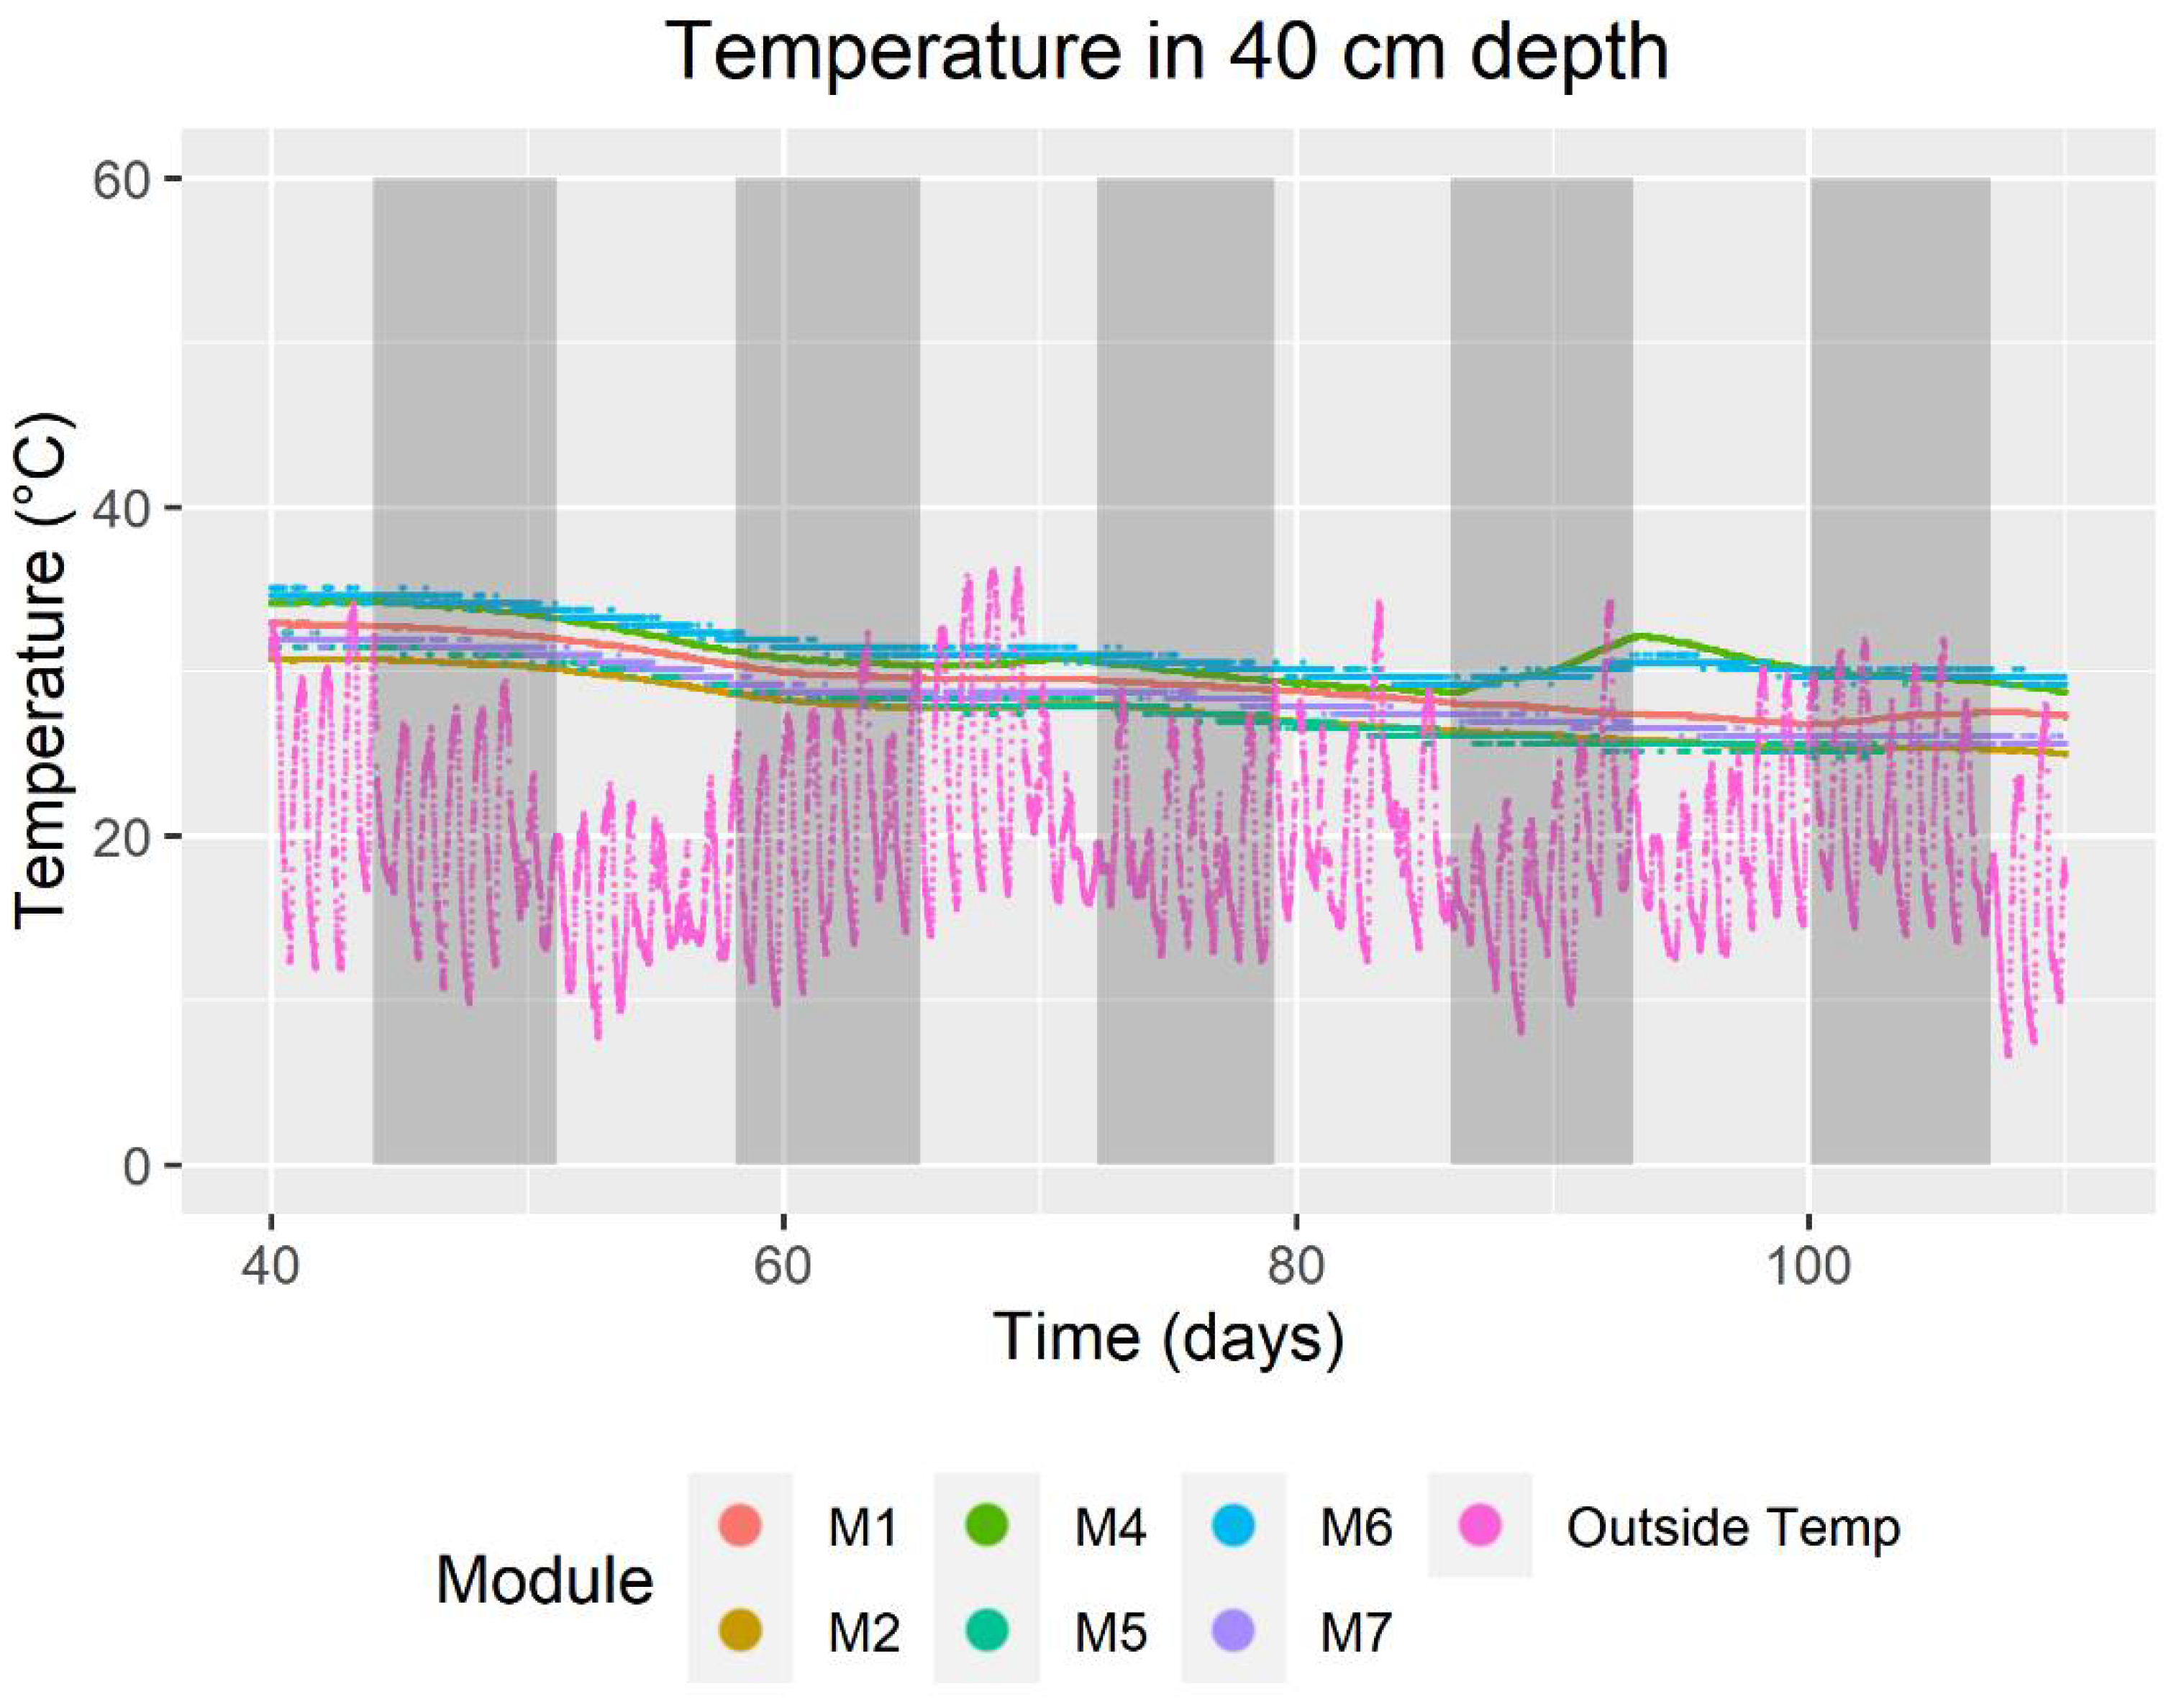
4.3.3. Full-Scale Test
5. Discussion
5.1. Module Design
5.2. Hardware Development and Sensor Protection
5.2.1. Energy Efficiency
5.2.2. Data Transmission
5.3. Testing Validation
6. Conclusions
Author Contributions
Funding
Data Availability Statement
Conflicts of Interest
References
- Wilkinson, J.M.; Muck, R.E. Ensiling in 2050: Some challenges and opportunities. Grass Forage Sci. 2019, 74, 178–187. [Google Scholar] [CrossRef]
- Wilkinson, J.M.; Lee, M.R.F. Review: Use of human-edible animal feeds by ruminant livestock. Animal 2018, 12, 1735–1743. [Google Scholar] [CrossRef] [PubMed]
- Sucu, E.; Kalkan, H.; Canbolat, O.; Filya, I. Effects of ensiling density on nutritive value of maize and sorghum silages. Rev. Bras. Zootec. 2016, 45, 596–603. [Google Scholar] [CrossRef] [Green Version]
- Dunière, L.; Sindou, J.; Chaucheyras-Durand, F.; Chevallier, I.; Thévenot-Sergentet, D. Silage processing and strategies to prevent persistence of undesirable microorganisms. Anim. Feed Sci. Technol. 2013, 182, 1–15. [Google Scholar] [CrossRef]
- Van den Pol-van Dasselaar, A.; Hennessy, D.; Isselstein, J. Grazing of Dairy Cows in Europe—An In-Depth Analysis Based on the Perception of Grassland Experts. Sustainability 2020, 12, 1098. [Google Scholar] [CrossRef] [Green Version]
- Borreani, G.; Tabacco, E.; Schmidt, R.J.; Holmes, B.J.; Muck, R.E. Silage review: Factors affecting dry matter and quality losses in silages. J. Dairy Sci. 2018, 101, 3952–3979. [Google Scholar] [CrossRef] [PubMed] [Green Version]
- Nußbaum, H. Folienlose Abdeckung von NaWaRo-Silagen: Auswirkungen auf die Silagequalität. In Effiziente Nutzung von Grünland als Ressource für die Milch- und Fleischproduktion: 52. Jahrestagung der AGGF vom 28. bis 30. August 2008 in Zollikofen; Thomet, P., Menzi, H., Isselstein, J., Eds.; Schweizerische Hochschule für Landwirtschaft: Zollikofen, Switzerland, 2008; pp. 238–241. ISBN 978-3-033-01702-3. [Google Scholar]
- Thaysen, J. Dichte Controlling- Bedeutung und Instrumente. In 9. Jahrestagung WGM; Futterkamp, 17–18 August 2008; Wissenschaftliche Gesellschaft der Milcherzeugerberater e.V.: Berlin, Germany, 2008. [Google Scholar]
- Köhler, B.; Taube, F.; Ostertag, J.; Thurner, S.; Kluß, C.; Spiekers, H. Dry-matter losses and changes in nutrient concentrations in grass and maize silages stored in bunker silos. Grass Forage Sci. 2019, 74, 274–283. [Google Scholar] [CrossRef]
- Spiekers, H.; Nußbaum, H.; Potthast, V. Erfolgreiche Milchviehfütterung, 5th ed.; DLG-Verlag GmbH: Frankfurt am Main, Germany, 2009; ISBN 9783769007305. [Google Scholar]
- Spiekers, H. Siliersicherheit. In Praxishandbuch Futter-und Substratkonservierung, 8th ed.; DLG-Verlag GmbH: Frankfurt am Main, Germany, 2011; pp. 179–185. ISBN 9783769007916. [Google Scholar]
- Jilg, A. Checkliste-Silo-Controlling. Available online: https://docplayer.org/188396104-Checkliste-silo-controlling.html (accessed on 6 September 2019).
- Wilkins, R.; Wilkinson, M. Major Contributions in 45 Years of International Silage Conferences; ISFQC: Piracicaba, Brazil, 2015. [Google Scholar]
- Zehetmeier, M.; Läpple, D.; Hoffmann, H.; Zerhusen, B.; Strobl, M.; Meyer-Aurich, A.; Kapfer, M. Is there a joint lever? Identifying and ranking factors that determine GHG emissions and profitability on dairy farms in Bavaria, Germany. Agric. Syst. 2020, 184, 102897. [Google Scholar] [CrossRef]
- Green, O.; Nadimi, E.S.; Blanes-Vidal, V.; Jørgensen, R.N.; Storm, I.M.D.; Sørensen, C.G. Monitoring and modeling temperature variations inside silage stacks using novel wireless sensor networks. Comput. Electron. Agric. 2009, 69, 149–157. [Google Scholar] [CrossRef]
- Williams, A.G.; Hoxey, R.P.; Lowe, J.F. Changes in temperature and silo gas composition during ensiling, storage and feeding-out grass silage. Grass Forage Sci. 1997, 52, 176–189. [Google Scholar] [CrossRef]
- Bochtis, D.D.; Sorensen, C.G.; Green, O.; Bartzanas, T. A diagnostic system for improving biomass quality based on a sensor network. Sensors 2011, 11, 4990–5004. [Google Scholar] [CrossRef] [PubMed] [Green Version]
- Thünen, T.; Heuer, K.; Rochlitzer, R.; Brockmann, C.; Seifert, S. Effizienzsteigerung im Silageprozess (EiS)—Neue Konzepte zur Minimierung von Energieverlusten; Julius Kühn-Institut, Federal Research Centre for Cultivated Plants: Quedlinburg, Germany, 2019. [Google Scholar]
- Elferink, S.; Driehuis, F.; Gottschal, J.; Spoelstra, S.F. Silage fermentation processes and their manipulation. In Silage Making in the Tropics with Particular Emphasis on Smallholders, Proceedings of the FAO Electronic Conference on Tropical Silage, 1 September–15 December 1999; Food and Agriculture Organization of the United Nations: Rome, Italy, 2000. [Google Scholar]
- McAllister, T.; Hristov, A. The Funadamentals of Making Good Quality Silage. Adv. Dairy Technol. 2000, 12, 381–399. [Google Scholar]
- Pahlow, G.; Hünting, K. Gärungsbiologische Grundlagen und biochemische Prozesse der Silagebereitung. In Praxishandbuch Futter- und Substratkonservierung: [Jetzt auch mit Silagen für Biogasanlagen], 8th ed.; DLG, Ed.; DLG-Verlag GmbH: Frankfurt am Main, Germany, 2011; pp. 73–82. ISBN 9783769007916. [Google Scholar]
- Grothmann, A. Einfluss von Automatischen Fütterungsverfahren in der Milchviehhaltung auf das Tierverhalten und die Futterqualität. Ph.D. Thesis, University of Hohenheim, Hohenheim, Germany, 2015. [Google Scholar]
- Rooke, J.A.; Hatfield, R.D. Biochemistry of Ensiling. In Silage Science and Technology; Buxton, D.R., Muck, R.E., Harrison, J.H., Eds.; American Society of Agronomy: Madison, WI, USA, 2003; pp. 95–139. ISBN 9780891182344. [Google Scholar]
- Wang, L.C.; Burris, R.H. Toxic Gases in Silage, Mass Spectrometric Study of Nitrogenous Gases Produced by Silage. J. Agric. Food Chem. 1960, 8, 239–242. [Google Scholar] [CrossRef]
- Spoelstra, S.F. Nitrate in silage. Grass Forage Sci 1985, 40, 1–11. [Google Scholar] [CrossRef]
- Kaiser, E.; Weißbach, F. Abbauprodukte des Nitrats bei der Grünfuttersilierung: Ammoniak. In Berichte der HUB; Humboldt-Universität zu Berlin: Berlin, Germany, 1988; pp. 29–38. [Google Scholar]
- Jilg, A. Bildung von Gärgasen bei der Silagebereitung. Available online: https://www.landwirtschaft-bw.info/site/pbs-bw-new/get/documents/MLR.LEL/PB5Documents/lazbw_gl/Futterkonservierung/G%C3%A4rgase.pdf?attachment=true (accessed on 19 June 2017).
- Ashbell, G.; Lisker, N. Aerobic deterioration in maize silage stored in a bunker silo under farm conditions in a subtropical climate. J. Sci. Food Agric. 1988, 45, 307–315. [Google Scholar] [CrossRef]
- Rees, D.; Audsley, E.; Neale, M.A. Apparatus for obtaining an undisturbed core of silage and for measuring the porosity and gas diffusion in the sample. J. Agric. Eng. Res. 1983, 28, 107–114. [Google Scholar] [CrossRef]
- Borreani, G.; Tabacco, E. The relationship of silage temperature with the microbiological status of the face of corn silage bunkers. J. Dairy Sci. 2010, 93, 2620–2629. [Google Scholar] [CrossRef]
- Prodanović, R.; Rančić, D.; Vulić, I.; Zorić, N.; Bogićević, D.; Ostojić, G.; Sarang, S.; Stankovski, S. Wireless Sensor Network in Agriculture: Model of Cyber Security. Sensors 2020, 20, 6747. [Google Scholar] [CrossRef]
- García, L.; Parra, L.; Jimenez, J.M.; Parra, M.; Lloret, J.; Mauri, P.V.; Lorenz, P. Deployment Strategies of Soil Monitoring WSN for Precision Agriculture Irrigation Scheduling in Rural Areas. Sensors 2021, 21, 1693. [Google Scholar] [CrossRef]
- Shi, X.; An, X.; Zhao, Q.; Liu, H.; Xia, L.; Sun, X.; Guo, Y. State-of-the-Art Internet of Things in Protected Agriculture. Sensors 2019, 19, 1833. [Google Scholar] [CrossRef] [Green Version]
- Rosero-Montalvo, P.D.; Erazo-Chamorro, V.C.; López-Batista, V.F.; Moreno-García, M.N.; Peluffo-Ordóñez, D.H. Environment Monitoring of Rose Crops Greenhouse Based on Autonomous Vehicles with a WSN and Data Analysis. Sensors 2020, 20, 5905. [Google Scholar] [CrossRef] [PubMed]
- Salleh, A.; Ismail, M.K.; Mohamad, N.R.; Abd Aziz, M.A.; Othman, M.A.; Misran, M.H. Development of Greenhouse Monitoring using Wireless Sensor Network through ZigBee Technology. Int. J. Eng. Sci. Invent. 2013, 2, 6–12. [Google Scholar]
- Khalifeh, A.; Darabkh, K.A.; Khasawneh, A.M.; Alqaisieh, I.; Salameh, M.; AlAbdala, A.; Alrubaye, S.; Alassaf, A.; Al-HajAli, S.; Al-Wardat, R.; et al. Wireless Sensor Networks for Smart Cities: Network Design, Implementation and Performance Evaluation. Electronics 2021, 10, 218. [Google Scholar] [CrossRef]
- Froiz-Míguez, I.; Lopez-Iturri, P.; Fraga-Lamas, P.; Celaya-Echarri, M.; Blanco-Novoa, Ó.; Azpilicueta, L.; Falcone, F.; Fernández-Caramés, T.M. Design, Implementation, and Empirical Validation of an IoT Smart Irrigation System for Fog Computing Applications Based on LoRa and LoRaWAN Sensor Nodes. Sensors 2020, 20, 6865. [Google Scholar] [CrossRef] [PubMed]
- Treiber, M.; Höhendinger, M.; Rupp, H.; Bauerdick, J.J.; Hijazi, O.; Bernhardt, H. Data Transmission and Management for Wireless Sensor Networks in German Dairy Farming Environments. In Proceedings of the XXXVIII CIOSTA & CIGR V International Conference, Rhodes, Greece, 24–26 June 2019. [Google Scholar]
- Croce, S.; Tondini, S. Urban microclimate monitoring and modelling through an open-source distributed network of wireless low-cost sensors and numerical simulations. In Proceedings of the 7th International Electronic Conference on Sensors and Applications, online, 15–30 November 2020; MDPI: Basel, Switzerland, 2020; p. 8270. [Google Scholar]
- Meligy, R.; Lopez Iturri, P.; Astrain, J.J.; Picallo, I.; Klaina, H.; Rady, M.; Paredes, F.; Montagnino, F.; Alejos, A.; Falcone, F. Low-Cost Cloud Enabled Wireless Monitoring System for Linear Fresnel Solar Plants. In Proceedings of the 7th International Electronic Conference on Sensors and Applications, online, 15–30 November 2020; MDPI: Basel, Switzerland, 2020; p. 8173. [Google Scholar]
- Armstrong, K. Emerging Industrial Applications. In Carbon Dioxide Utilisation; Elsevier: Amsterdam, The Netherlands, 2015; pp. 237–251. ISBN 9780444627469. [Google Scholar]
- Aerospace Standards Committee. Space Engineering—Definition of the Technology Readiness Levels (TRLs) and Their Criteria of Assessment (ISO 16290:2013, Modified), German Version EN 16603-11:2019; DIN EN 16603-11; Beuth Verlag GmbH: Berlin, Germany, 2020. [Google Scholar]
- Federal Office for Agriculture and Food. Merkblatt-Technologiereifegrade. Available online: https://www.ble.de/SharedDocs/Downloads/DE/Projektfoerderung/Innovationen/Merkblatt-Technologiereifegrade.pdf?__blob=publicationFile&v=3 (accessed on 3 December 2021).
- Holmes, B.J.; Muck, R.E. Preventing Silage Storage Losses. Available online: https://fyi.extension.wisc.edu/forage/files/2014/01/prevent-silage-storage7.pdf (accessed on 8 July 2021).
- Winsen. ME2-O2-Φ20 Electrochemical Oxygen Sensor. Available online: http://www.winsen-sensor.com/d/files/PDF/Electrochemical%20Gas%20Sensor/Electrochemical%20Oxygen/ME2-O2-D20%200-25%25%20Manual%20(ver1.2).pdf (accessed on 6 June 2018).
- PEWATRON. COZIR Ultra Low Power Carbon Dioxide Sensor. 2016. Available online: https://www.pewatron.com/de/aktuelles/news/artikel/cozir-ultraschwachstrom-kohlendioxid-sensormodul/ (accessed on 7 June 2018).
- Honeywell International, Inc. HIH-4000 Series Humidity Sensors; Honeywell International, Inc.: Charlotte, NC, USA, 2010. [Google Scholar]
- Freescale Semiconductor. MPX4115, Integrated Silicon Pressure Sensor Altimeter/Barometer Pressure Sensor On-Chip Signal Conditioned, Temperature Compensated and Calibrated—Data Sheet. Available online: https://www.nxp.com/docs/en/data-sheet/MPX4115.pdf (accessed on 7 August 2018).
- LoRa Alliance. LoRaWAN: What Is It? Available online: https://lora-alliance.org/wp-content/uploads/2020/11/what-is-lorawan.pdf (accessed on 14 September 2021).
- The Things Industries. ABP vs. OTAA. Available online: https://www.thethingsindustries.com/docs/devices/abp-vs-otaa/ (accessed on 8 March 2022).
- Bauerdick, J.; Treiber, M.; Bernhardt, H. Smart farming and digitization of research farms—A holistic concept for science and teaching. In Bio-Economy and Agri-Production: Concepts and Evidence; Bochtis, D.D., Achillas, C., Banias, G., Lampridi, M., Eds.; Elsevier/Academic Press: Cambridge, MA, USA, 2020; pp. 267–277. ISBN 9780128197745. [Google Scholar]
- Bauerdick, J.J.; Treiber, M.; Höhendinger, M.; Hijazi, O.; Schlereth, N.; Bernhardt, H. Sensorsystems in German dairy Farming—Aspects of hardware design and sustainability. In Proceedings of the ASABE Annual International Meeting, Boston, MA, USA, 7–10 July 2019; American Society of Agricultural and Biological Engineers: St. Joseph, MI, USA, 2019. [Google Scholar]
- Reid, W.S.; Turnbull, J.E.; Sabourin, H.M.; Ihnat, M. Silo gas: Production and detection. Can. Agric. Eng. 1984, 26, 197–208. [Google Scholar]
- Schweda, E. Anorganische Chemie, 17th ed.; Hirzel: Stuttgart, Germany, 2012; ISBN 9783777621340. [Google Scholar]
- Santana Abril, J.; Santana Sosa, G.; Sosa, J.; Bautista, T.; Montiel-Nelson, J.A. A Novel Charging Method for Underwater Batteryless Sensor Node Networks. Sensors 2021, 21, 557. [Google Scholar] [CrossRef]
- Larsen, J.J.; Green, O.; Nadimi, E.S.; Toftegaard, T.S. The effect on wireless sensor communication when deployed in biomass. Sensors 2011, 11, 8295–8308. [Google Scholar] [CrossRef] [Green Version]
- Linnemann, M.; Sommer, A.; Leufkes, R. Einsatzpotentiale von LoRaWAN in der Energiewirtschaft: Praxisbuch zu Technik, Anwendung und Regulatorischen Randbedingungen, 1st ed.; Springer Vieweg: Wiesbaden, Germany, 2019; ISBN 978-3-658-26917-3. [Google Scholar]
- Lam, K.-H.; Cheung, C.-C.; Lee, W.-C. RSSI-Based LoRa Localization Systems for Large-Scale Indoor and Outdoor Environments. IEEE Trans. Veh. Technol. 2019, 68, 11778–11791. [Google Scholar] [CrossRef]
- Arduino Official Store. Dipole Pentaband Waterproof Antenna. Available online: https://store.arduino.cc/products/dipole-pentaband-waterproof-antenna?pr_prod_strat=copurchase&pr_rec_pid=5487963930775&pr_ref_pid=5517873053847&pr_seq=uniform (accessed on 9 December 2021).
- Zhou, G.; He, T.; Krishnamurthy, S.; Stankovic, J.A. Models and solutions for radio irregularity in wireless sensor networks. ACM Trans. Sens. Netw. 2006, 2, 221–262. [Google Scholar] [CrossRef]
- Rongbiao, Z.; Jianguang, G.; Fuhuan, C.; Yongxian, S. Influence of Supply Voltage of Node on RSSI-Based Localization Performance and Calibration Technique. In Proceedings of the 2011, International Conference on Informatics, Cybernetics, and Computer Engineering (ICCE2011), Melbourne, Australia, 19–20 November 2011; Kacprzyk, J., Jiang, L., Eds.; Springer: Berlin/Heidelberg, Germany, 2012; pp. 409–416, ISBN 978-3-642-25184-9. [Google Scholar]
- Pries, M.; Kayser, T. Nacherwärmungen bei Grassilagen Vermeiden. Available online: https://www.landwirtschaftskammer.de/landwirtschaft/tierproduktion/rinderhaltung/fuetterung/archiv/nacherwaermung-grassilage.htm (accessed on 3 November 2017).
- Thaysen, J. Warme Silage: Was ist jetzt noch zu retten? Top Agrar, 1 December 2003; R6–R9. [Google Scholar]
- Bavarian State Research Center for Agriculture. Controlling am Silo—Steuerung der Silagequalität und möglicher Verluste. Available online: https://www.lfl.bayern.de/mam/cms07/ite/dateien/31396_messprotokoll_und_orientierungswerte.pdf (accessed on 8 March 2022).
- Woolford, M.K. The detrimental effects of air on silage. J. Appl. Bacteriol. 1990, 68, 101–116. [Google Scholar] [CrossRef] [PubMed]
- Ashbell, G.; Weinberg, Z.G. Top silage losses in horizontal silos. Can. Agric. Eng. 1992, 34, 171–175. [Google Scholar]


| Used Sensors in This Research | |||
|---|---|---|---|
| RTR–Nodes Iteration 1 | LoRa–Nodes Iteration 2 | ||
| Temperature | RTR-502L by T&D corp. Range: −60 to 155 °C Accuracy: ±0.3 °C at 20 to 80 °C Power source: own battery | Pt100 by B + B Thermo Range: −40 to 180 °C Accuracy type B (±0.3 °C at 0 °C) Power source: 6 × 3.7 V, 4500 mAh | |
| Oxygen | ME2-O2--Φ 20 by Zhengzhou Winsen Electronics Technology Co., Ltd. Range: 0 to 15% O2 Sensitivity: 0.05~0.15 mA | ||
| Power source: 4 × 1.2 V, 13,000 mAh NiMh | Power source: 2 × 1.2 V, 13,000 mAh NiMh | ||
| Carbon dioxide | COZIR Wide Range Sensor by gassensing.co.uk Range: 0–100% CO2 Accuracy: ±5% CO2 | ||
| Power source: 4 × 1.2 V, 13,000 mAh NiMh | Power source: 2 × 1.2 V, 13,000 mAh NiMh | ||
| Humidity | HIH-4000 by Honeywell Range: 0–100% RH Accuracy: ±3.5% TH | ||
| Power source: 2 × 3.7 V, 4500 mAh | Power source: 6 × 3.7 V, 4500 mAh | ||
| Air pressure | MPX4115 by Freescale Semiconductors Range: 15–115 kPa Accuracy: ±3.5% | ||
| Power source: 2 × 3.7 V, 4500 mAh | Power source: 6 × 3.7 V, 4500 mAh | ||
| Energy Consumption of Used Sensor Iterations, Divided by Power Circuits | ||
|---|---|---|
| Iteration | Battery Capacity Total Available and Needed for 365 Days | |
| NiMh (1.2 V, 13,000 mAh Each) | Li-ion (3.7 V, 4500 mAh Each) | |
| RTR Module 4 NiMh, 2 Li-ion | Capacity total: 52,000 mAh Capacity need: 16,619 mAh | Capacity total: 9000 mAh Capacity need: 7705 mAh |
| LoRa Module 2 NiMh 6 Li-ion (two each connected in series = 7.4 V packs) | Capacity total: 26,000 mAh Capacity need: 8866 mAh | Capacity total: 13,500 mAh Capacity need: 8608 mAh |
Publisher’s Note: MDPI stays neutral with regard to jurisdictional claims in published maps and institutional affiliations. |
© 2022 by the authors. Licensee MDPI, Basel, Switzerland. This article is an open access article distributed under the terms and conditions of the Creative Commons Attribution (CC BY) license (https://creativecommons.org/licenses/by/4.0/).
Share and Cite
Bauerdick, J.J.; Spiekers, H.; Bernhardt, H. System Design and Validation of a Wireless Sensor Monitoring System in Silage. Agronomy 2022, 12, 892. https://doi.org/10.3390/agronomy12040892
Bauerdick JJ, Spiekers H, Bernhardt H. System Design and Validation of a Wireless Sensor Monitoring System in Silage. Agronomy. 2022; 12(4):892. https://doi.org/10.3390/agronomy12040892
Chicago/Turabian StyleBauerdick, Josef J., Hubert Spiekers, and Heinz Bernhardt. 2022. "System Design and Validation of a Wireless Sensor Monitoring System in Silage" Agronomy 12, no. 4: 892. https://doi.org/10.3390/agronomy12040892
APA StyleBauerdick, J. J., Spiekers, H., & Bernhardt, H. (2022). System Design and Validation of a Wireless Sensor Monitoring System in Silage. Agronomy, 12(4), 892. https://doi.org/10.3390/agronomy12040892