Article

Effect of the Hopper Angle of a Silo on the Vertical Stress at the Cylinder-to-Hopper Transition

by
Rômulo Marçal Gandia
1,2,*,
Wisner Coimbra de Paula
3,
Estácio Antunes de Oliveira Junior
1,
Gerardo Hernández Rodrigo
2,
Ángel Ruiz Padín
2,
Alberto Tascón Vegas
4,
Francisco Carlos Gomes
1 and
Pedro José Aguado Rodríguez
2
1
Department of Agricultural Engineering, School of Engineering, Federal University of Lavras, Campus Lavras, Lavras 37200-900, Brazil
2
Department of Engineering and Agricultural Sciences, University of León, Av. Portugal 41, 24071 León, Spain
3
Department of Engineering, School of Engineering, Federal University of Lavras, Campus Lavras, Lavras 37200-900, Brazil
4
Department of Agriculture and Food, Faculty of Science and Technology, University of La Rioja, C/Madre de Dios 53, 26006 Logroño, Spain
*
Author to whom correspondence should be addressed.
Agronomy 2022, 12(4), 830; https://doi.org/10.3390/agronomy12040830
Submission received: 20 February 2022 / Revised: 23 March 2022 / Accepted: 27 March 2022 / Published: 29 March 2022
(This article belongs to the Special Issue Selected Papers from 11th Iberian Agroengineering Congress)

Abstract

:
Silos are used worldwide to store granular and powdered materials. Agricultural, food and feed products are commonly stored in silos. However, many questions remain unanswered about how to estimate the pressures applied by the bulk material, which are needed to design and calculate the structure of the silo. The complexity of the laws that govern the mechanical behavior of the stored material along with the low number of experimental stations in the world hinder progress in this field. The aim of this study was to elucidate the relationship of the hopper angle, flow pattern and vertical stress at the cylinder-to-hopper transition in slender silos. Therefore, a set of experiments was conducted on a test station to measure the vertical stress produced by maize at the cylinder-to-hopper transition. Five different hopper angles were used. The experiments comprised the filling, the static phase and the discharge. The results obtained show that the hopper angle influences the vertical stress at the cylinder-to-hopper transition. Some bottom configurations (flat bottom and bottom with an angle of 30°) led to vertical stresses that exceeded the value calculated according to Eurocode 1. It is clear that further experimental studies are still necessary to understand the underlying physical phenomena and the relations between pressures, silo geometry and flow pattern of the stored material.

1. Introduction

Maize and its derivatives are important human food sources, and also have a wide prevalence in animal feed due to their high nutritional index. As an example, Brazil had a maize production of 87 million tons in 2021 [1], and Spain 4.1 million tons in 2020 [2]. This huge amount of maize requires handling and storage in industrial facilities. Silos are normally used for storing maize and other agricultural, food and feed products.
Tower silos have been studied since the 19th century, but many aspects concerning the mechanical behavior of stored products remain poorly understood due to the complexity of the laws that govern the underlying physical phenomena [3,4,5,6,7,8]. Although a review of this literature indicates that structural failures in silos can be attributed to various different causes, the pressures exerted by the stored material are usually a key factor.
The friction angle between the stored product and the hopper wall along with the hopper angle directly influence the flow pattern and, consequently, the behavior of pressures. There are two main flow patterns, mass flow and funnel flow. Mass flow is characterized by the movement of all the stored material at the same speed, and it follows a first-in, first-out pattern; the material generates high dynamic pressures on the walls, particularly at the cylinder-to-hopper transition. On the contrary, funnel flow is associated with the presence of stagnant zones and a first-in, last-out sequence. A third flow pattern, transition flow, is characterized by a distinct change in the type of flow that takes place in a position that depends on the filling height [9]. As mentioned above, the hopper angle and the wall friction coefficient are the two most influential parameters [10,11,12]. However, the relations between flow, pressure and the vertical stresses at the cylinder-to-hopper transition are still poorly understood [7,13,14,15,16,17].
Ding et al. [18] studied the critical hopper angle for achieving a mass flow and also analyzed the effects of double-cone inserts on the flow of particulate solids. The effects of the material type, particle size and moisture content on the static pressure distribution were analyzed in a lab-scale test silo with conical hopper by Chen et al. [19]. Several authors have studied the influence of the hopper angle on the mass flow rate by using lab size cylindrical silos [20,21,22]. Villagrán Olivares et al. performed experiments for different hopper angles in a 2D lab container and proposed a theoretical description to predict the behavior of the flow and the transition zone angle from mass flow to funnel flow [23]. These recent studies indicate that the effect of the hopper angle on pressures and flow patterns is consistently a topic of interest and that further research into these phenomena is still required.
Despite the high cost of construction and instrumentation, experimental stations are considered the best approach to understand what happens inside real silos. Experiments in test silos provide pressure values and reliable information to understand the behavior of the bulk material and the flow patterns [7]. In addition, experimental models are used for validations of numerical models [16,24,25,26].
A pilot-scale test station, which is based on the design proposed by Pieper and Schütz in 1980 [27], is located in the Federal University of Lavras. This experimental station has been previously applied to the study of static and dynamic pressures (friction and normal) after previous calibration and verification of all instrumentation [17,28,29]; these experiments demonstrated that pressures are influenced by the slenderness and angle of the hopper. Furthermore, the DIN 1055-6: Design Basis and Actions on Structures—Part 6 [30] is partly based on studies conducted at the pilot-scale test station used by Pieper and Schütz.
Therefore, the present paper offers new experimental information from this pilot scale test station. The aim was to study the influence of hopper angle and flow pattern on the vertical stress at the cylinder-to-hopper transition, analyzing the maximum pressures during filling, static phase and discharge of maize.

2. Materials and Methods

The experimental station was located at the Federal University of Lavras (Brazil) (Figure 1) and was previously validated by the members of the research group on pressures and flow in silos and stored products [29].
The station consisted of a fully instrumented pilot silo, a storage silo to store the bulk material during the tests and a bucket elevator to transport the material between the silos (Figure 1). All the measuring cells of the pilot silo were connected to the data acquisition system controlled by a portable computer.
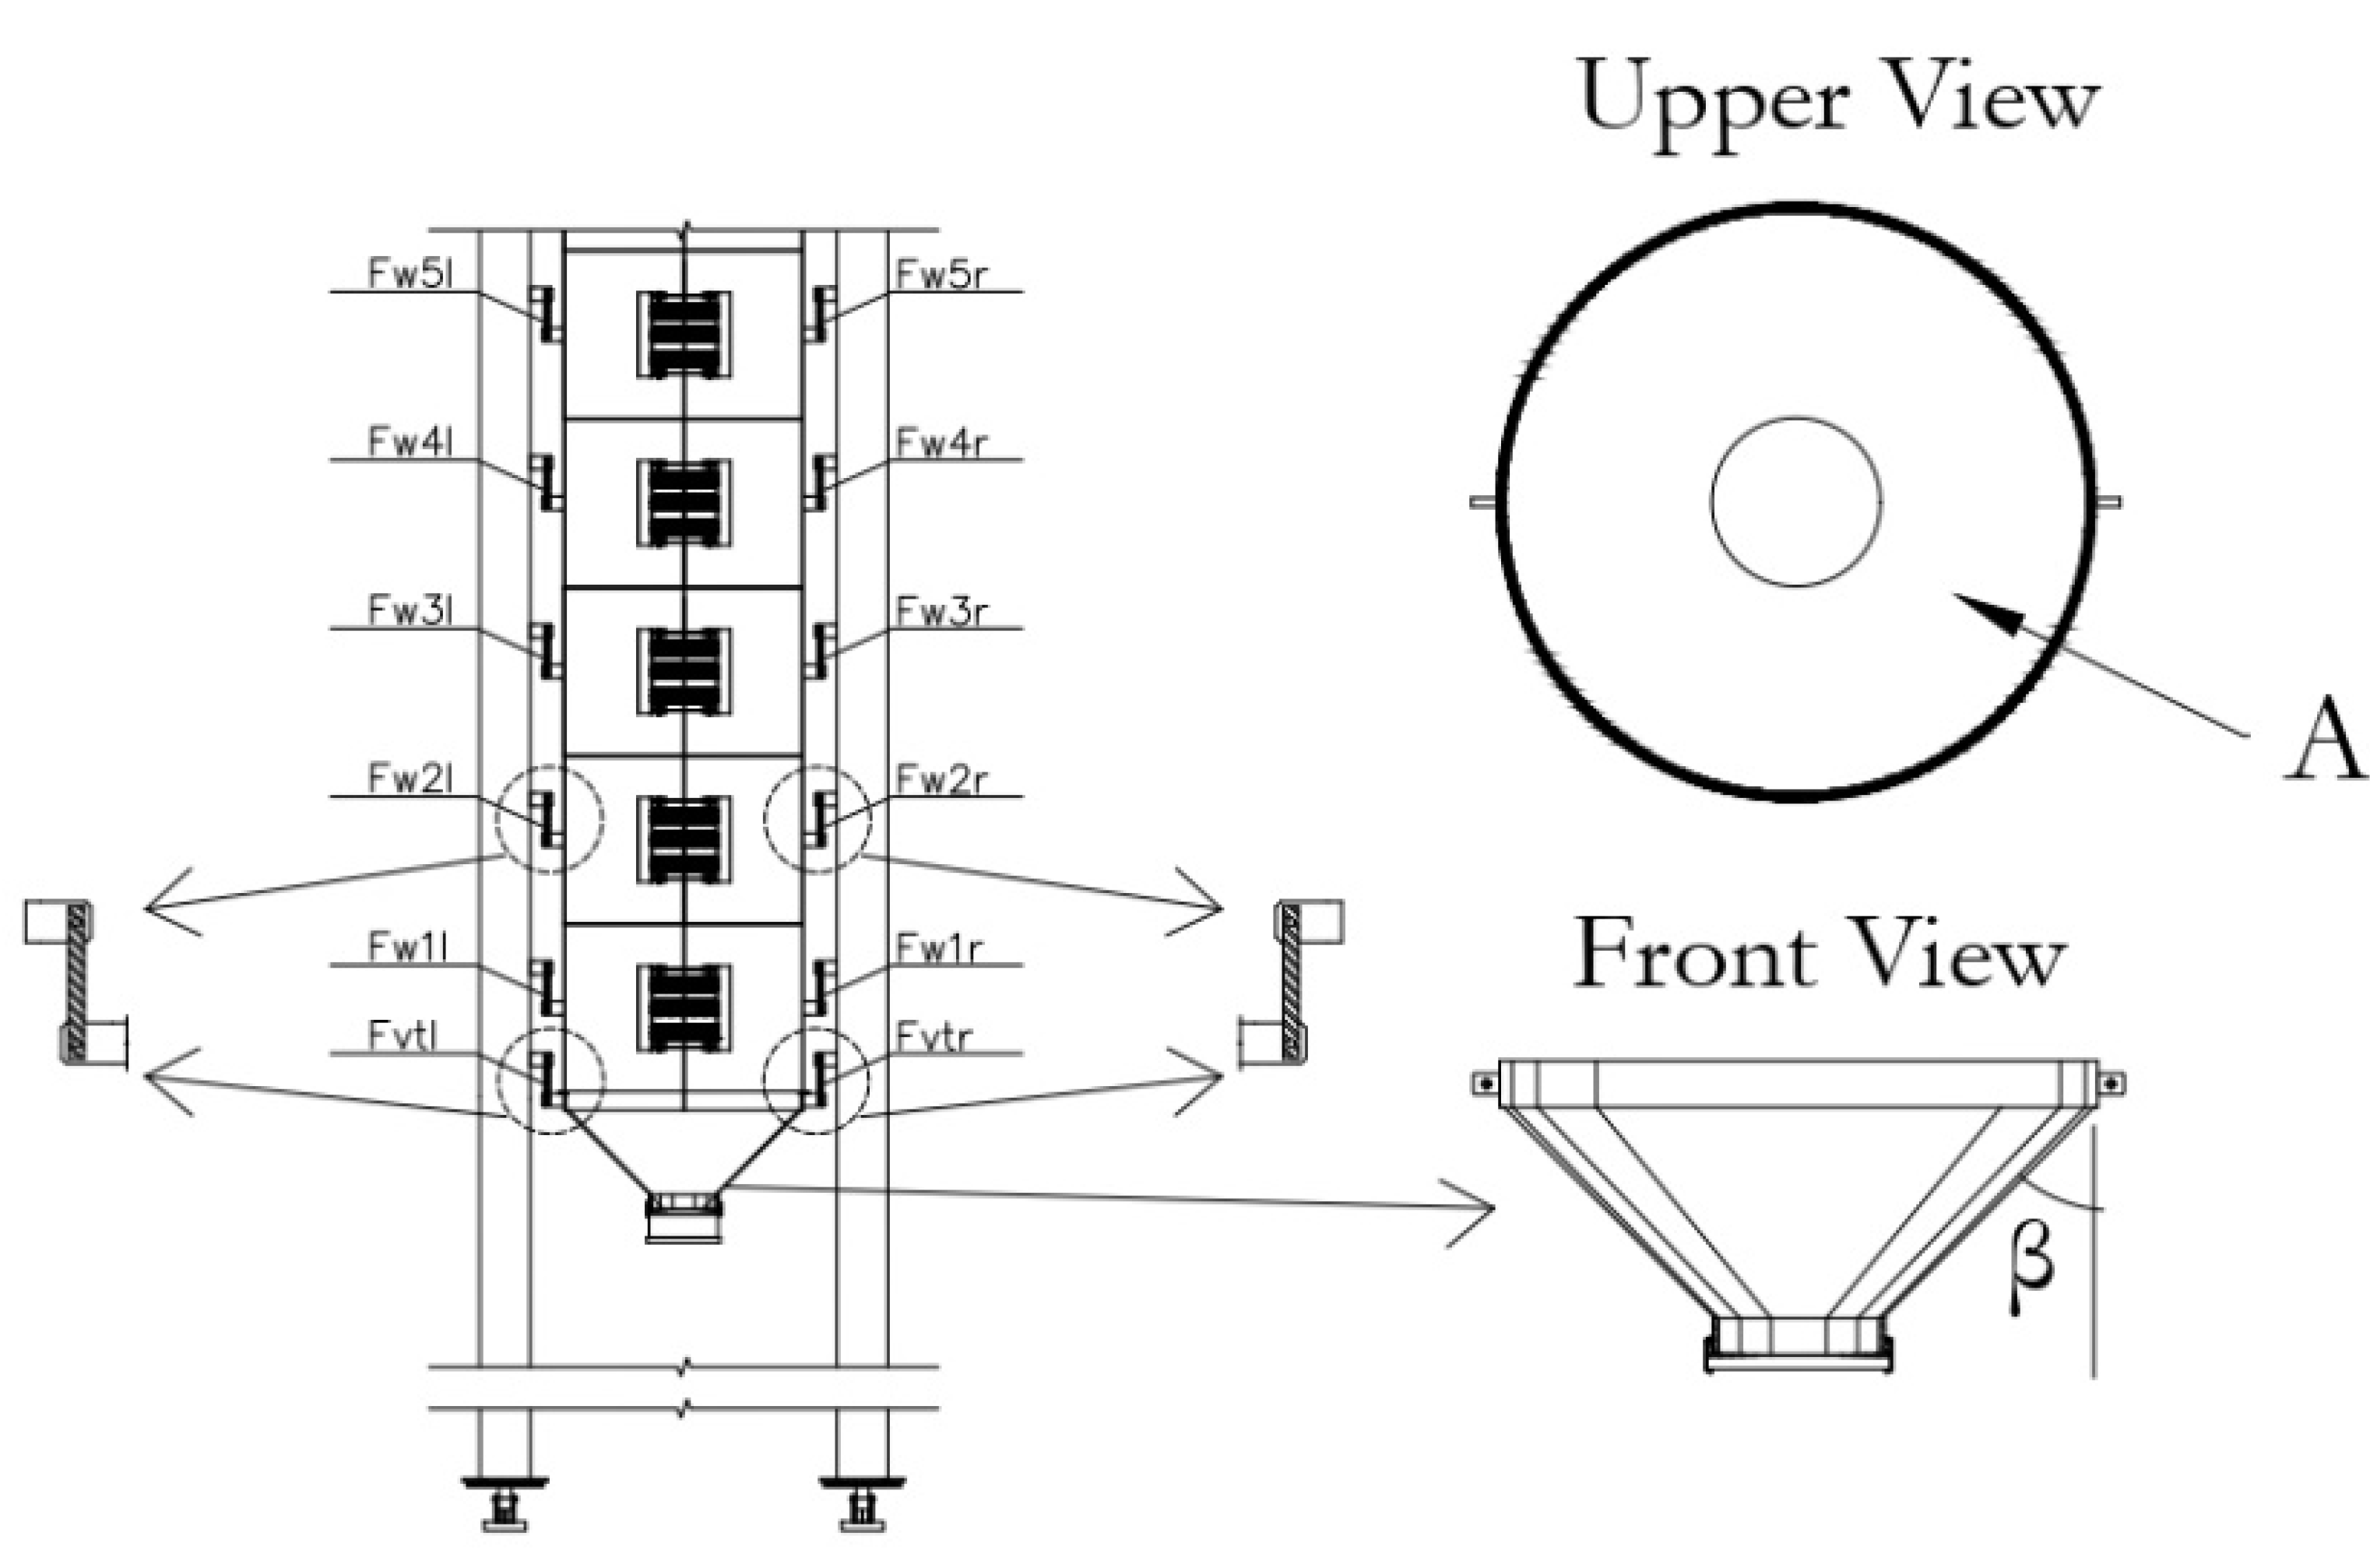
The pilot test silo was cylindrical and metallic. The cylinder was 6 m high and 0.7 m in internal diameter. The cylinder was segmented into 12 structurally independent rings, allowing the forces in each division to be obtained; all rings were connected vertically by a pair of tension load cells. The pair that supported the bottom of the silo was responsible for providing the vertical force at the silo–hopper transition (Figure 2). The pairs that supported each cylinder ring were responsible for providing the frictional wall forces (Figure 2). The silo hoppers can vary depending on the opening angle β (Figure 2).
The measurement of vertical stresses at the silo–hopper transition (Pvt,t) begin once the hopper is filled with the stored material, using Equation (1):
Pvt , t   =   Fvtr , t + Fvtl , t   Whto   A
According to Eurocode 1, part 4 [11], the definitions of the different terms of the equation are:
  • Pvt,t: Value of the vertical stress of the stored product at the silo–hopper transition obtained from the tension load cells positioned on the hopper support, at time t, kPa;
  • Fvtr,t: Value of the force obtained in the tension load cell positioned on the right-hand side of the hopper support, at time t, kN;
  • Fvtl,t: Value of the force obtained in the tension load cell positioned on the left-hand side of the hopper support, at time t, kN;
  • Whto: Weight of stored material between the outlet and the silo–hopper transition, zero in the case of the flat bottom, kN;
  • A: Plan cross-sectional area of vertical walled segment, m2.
The frictional wall stresses (Pw,t) can be determined indirectly by the pair of tension load cells located on the vertical support (positioned 180° apart) of each ring, using Equation (2):
Pw ( 1 , 5 ) , t   =   Fw ( 1 , 5 ) r , t   +   Fw ( 1 , 5 ) l , t   π . di . hr
According toEurocode 1, part 4 [11], the definitions of the different terms of the equation are:
  • Pw(1,5),t: Frictional wall stresses for the cylinder wall from the tension load cells positioned on ring supports—rings 1 to 5, time t, kPa;
  • Fw(1,5)r,t: Force in tension load cell positioned on the right side of the ring support, rings 1 to 5, at time t, kN;
  • Fw(1,5)l,t: Force in tension load cell positioned on the left side of the ring support, rings 1 to 5, at time t, kN;
  • di: Internal cylinder diameter, m;
  • hr: Ring height, m.
The frictional wall stresses for the cylinder wall Pw(1,5) could be determined in the five rings at heights 0.25, 0.75, 1.25, 1.75 and 2.25 m above the silo hopper transition (Figure 2). In this study, only the frictional wall stresses for the cylinder wall at the height 0.25 m above the transition was used, i.e., in the first ring as shown in Figure 2. Therefore, the frictional wall stresses for the cylinder wall at a height of 0.25 is called Pw1.
Vertical stresses in the stored material at the transition (Pvt,t) and frictional wall stresses (Pw,t) were calculated for the filling, static phase and discharge for each of the bottom configurations, and the maximum values were selected. In addition, experimental values were compared with Eurocode 1, part 4 [11]. Figure 3 illustrates the locations of vertical stresses in the stored solid at the transition (base of the vertical walled segment) (Pvft) and the wall frictional traction after filling (Pwf) according to Eurocode 1. The parameter Pvt,t, which is used throughout this paper, has the same meaning as the parameter Pvtf in Eurocode 1. It is noteworthy that Eurocode 1 does not include the hopper angle (β) in the calculation method for Pvft (see Equations (3) and (4) for slender silos); Eurocode 1 determines the vertical stress in the stored solid at the transition after filling (Pvtf) by multiplying the vertical stress in the stored solid (Pvf) at the depth corresponding to the transition by a bottom load magnifier (Cb) to account for the possibility of larger loads being transferred to the hopper or bottom from the vertical walled segment.
Pvft =   Cb   Pvf
Pvf   =   Pho   K Yj ( z )
The definitions for these parameters according to Eurocode 1, part 4, are:
Pvft: vertical stress in the solid after filling at transition;
Pvf: vertical stress in the solid after filling;
Pho: asymptotic horizontal pressure at great depth for the disaggregated solid stored;
Yj: function of Janssen pressure variation with depth;
K: characteristic value of the lateral pressure coefficient;
Cb: coefficient of increase in loads on the bottom.
In this study, Equation (1) was applied to calculate the vertical stresses at the cylinder-to-hopper transition (Pvt,t) as a function of time, i.e., during the filling, static phase and discharge, and the values obtained were compared with the value calculated according to Eurocode 1 following Equations (3) and (4).
The product used in these experimental tests was maize with a minimum purity of 97%. The physical, mechanical and flow properties of maize were obtained following the methodology of the Jenike Shear Test [31], which conforms to Eurocode 1 [11], and are shown in Table 1.
Using the granular material described above, a series of experimental tests was performed with 5 different configurations of the silo hopper and 6 repetitions for each test. Thus, 30 tests were performed in total. The tests were conducted with concentric filling and discharge. The hopper inclinations used in the five different configurations were: β = 15° (β15°); β = 30° (β30°); β = 45° (β45°); β = 60° (β60°) and β = 90°, named flat bottom (FlatB).
The reason of using this hopper inclinations was to encompass the different types of flow included in Eurocode 1 [11]. Eurocode 1 states that the inclination of the hopper in conjunction with the friction coefficient of the wall with the product (μ = 0.24) lead to different types of flow patterns (Figure 4): mass flow for β = 15°; transition flow for β = 30°; and funnel flow for β = 45°, β = 60° and flat bottom. Additionally, following Eurocode 1, the 5 different bottoms can be classified in three groups depending on the geometry of the silo: steep hopper (β15°, β30° and β45°), shallow hopper (β60°) and flat bottom (FlatB).
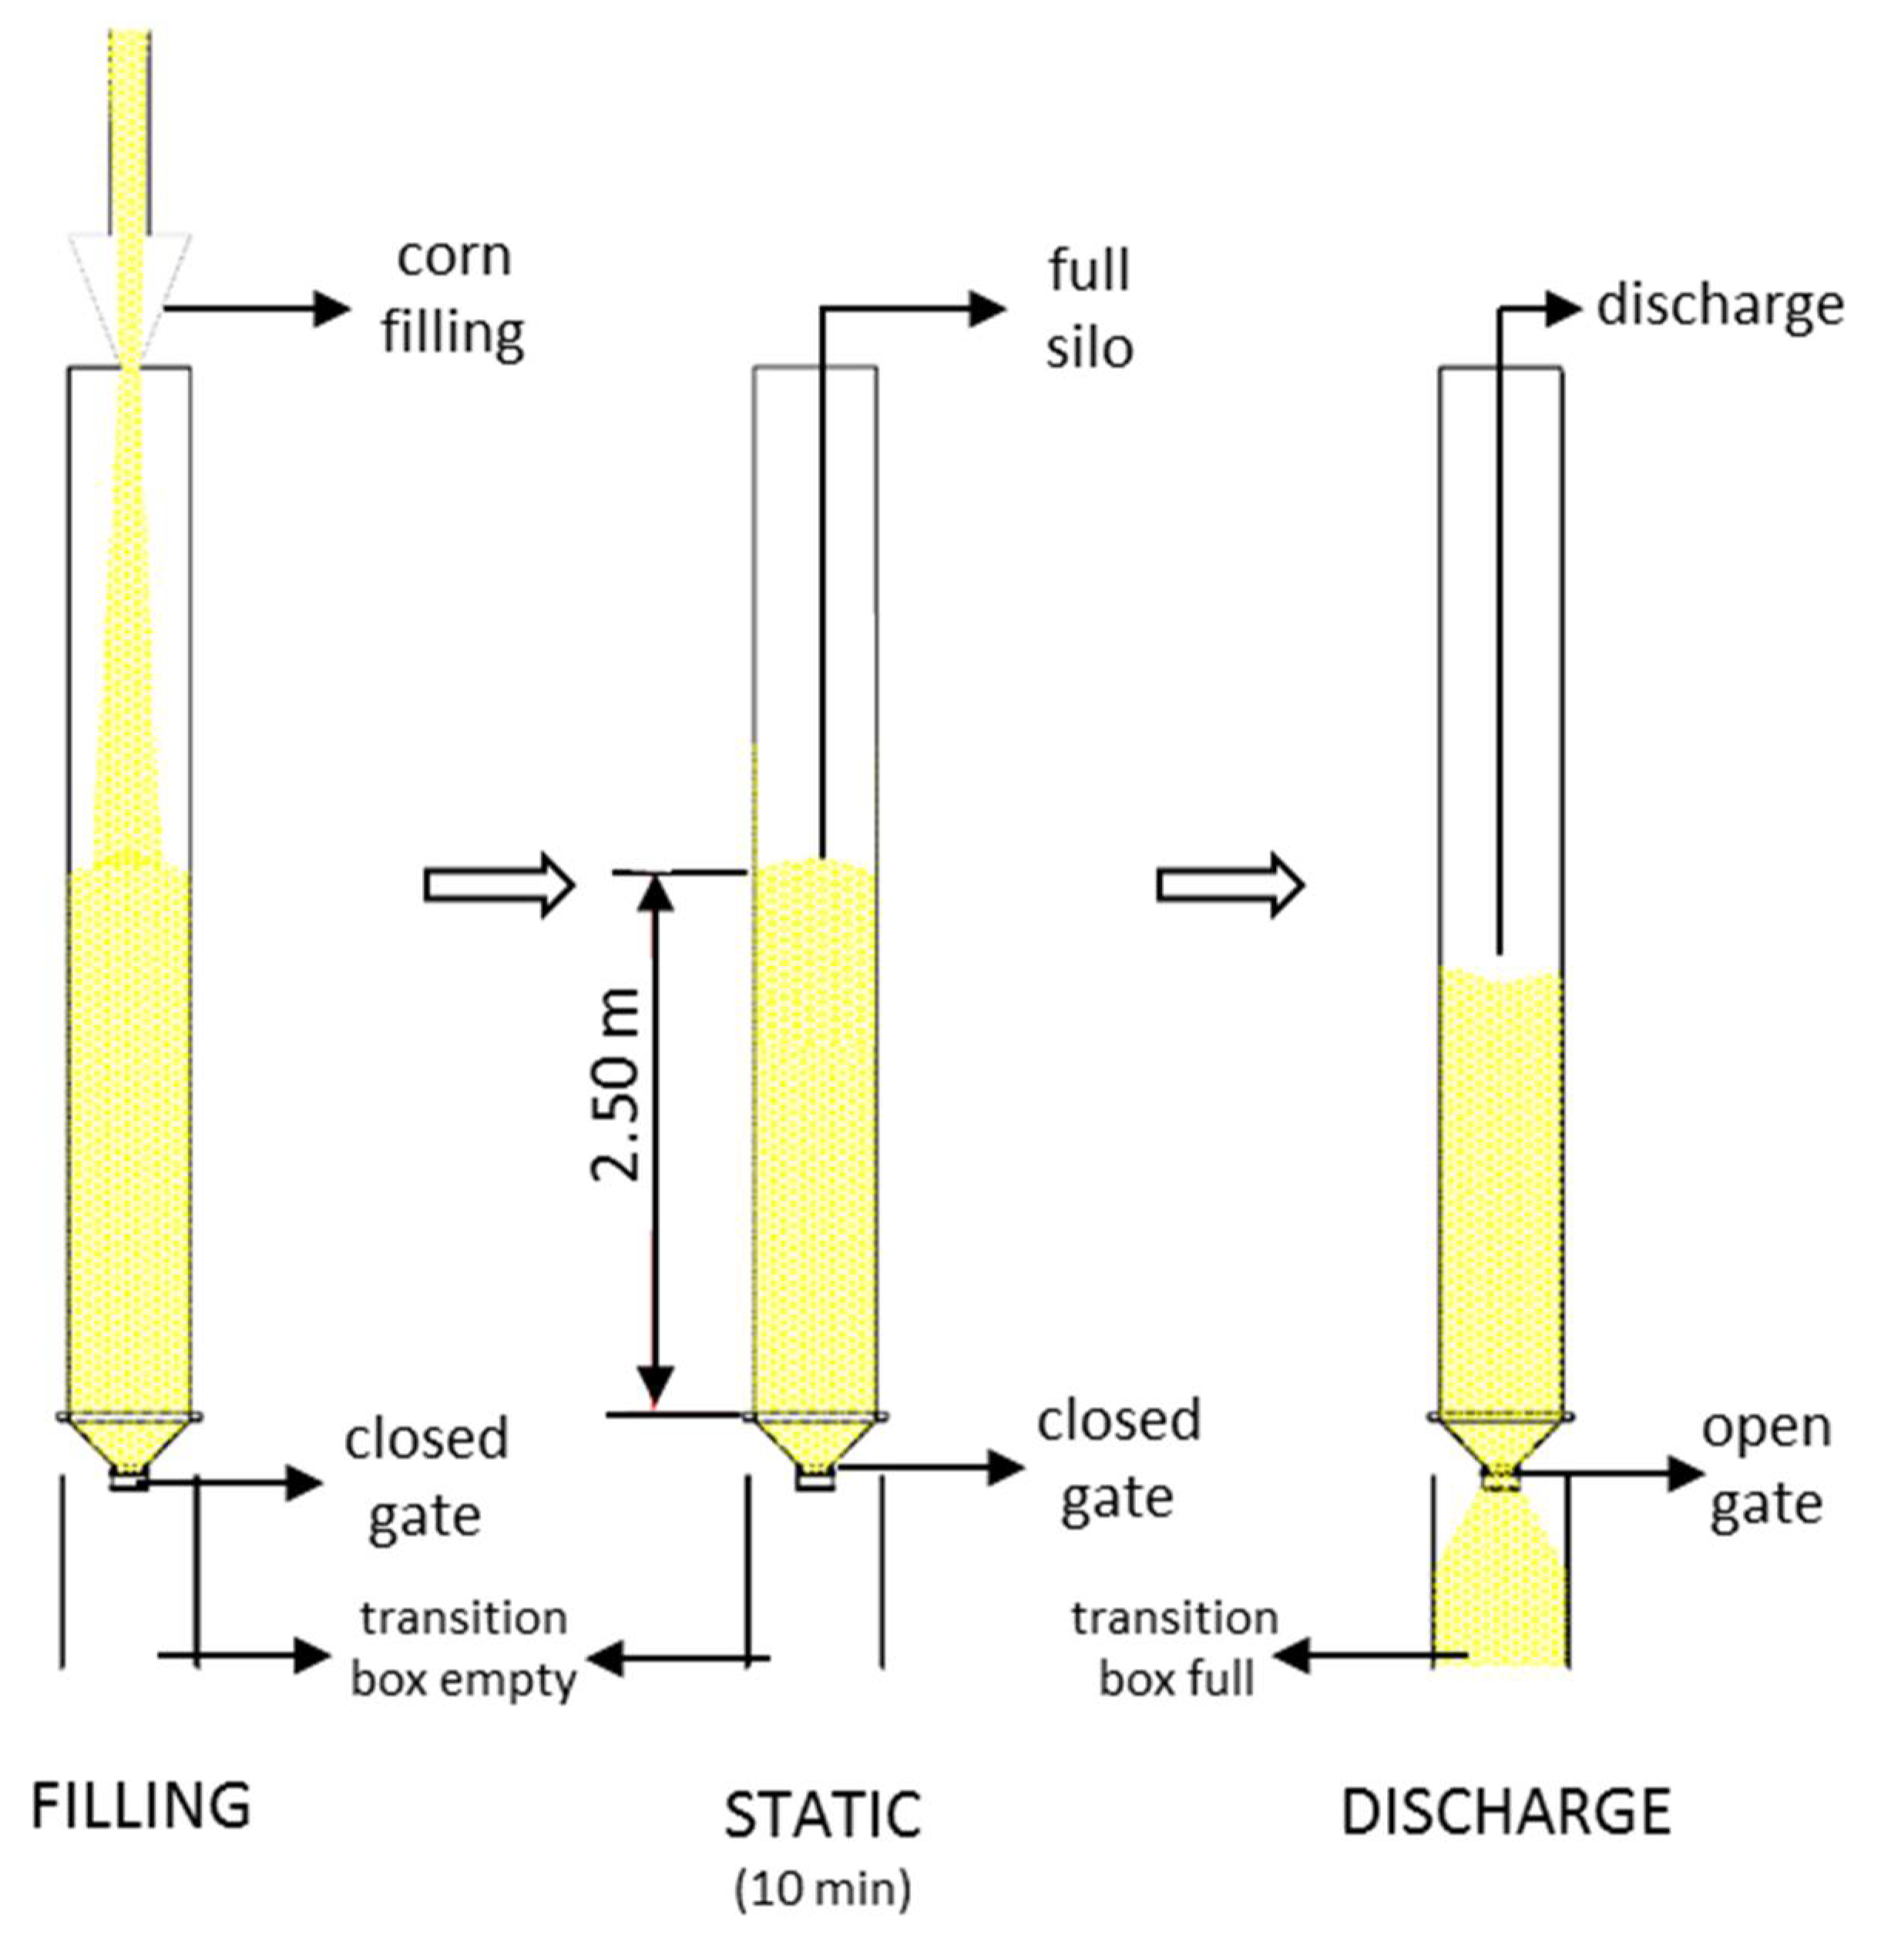
All tests were conducted according to the sequence illustrated in Figure 5: filling the silo to the height of interest (verified by the tension load cell that shows the measurement in the semi-cylinder above the height of interest), static condition (for 10 min), and product discharge. The silo was discharged with the gate (diameter of 0.20 m) 100% opened.

3. Results

The experiments carried out generated a large volume of data. Therefore, to avoid exposing unnecessary data, the values of average and standard deviation in each measurement cell referring to filling and discharge are shown in Table 2. As can be seen, the six repetitions for each test showed a low coefficient of variation. Therefore, for each type of test, one of the six repetitions was chosen randomly to discuss the results.
Table 2 shows that a connection between the type of flow (mass, transition or funnel flow) and the Pvt values exists. During filling, for funnel flow (FlatB, β60° and β45°) the mean values were higher when the beta angle increased, and the transition flow (β30°) presented the highest average value. During discharge, there was no significant difference in comparison to filling for the flat hopper tests, while the shallow hopper (β60°) had the greatest pressure decrease (25%). Again, the transition flow (β30°) presented the highest average value for the discharge phase.
As the weight of the material in the hopper is part of the Equation (1), it is important to note that this weight varies with the volume of the hopper, which depends on the angle β. Table 3 shows the values of the loads for each of the test configurations.
It is noteworthy that the β30° test had a mean value different from that expected and a standard deviation higher than the others. The reason is that two of the six repetitions for the β30° test showed flaws in the filling, resulting in heights of the stored product below that of interest. It should be emphasized that these two repetitions were used for calculating the mean and the standard deviation in Table 3, but they were removed during the random choice of one single repetition for the later analysis of the individual tests presented below.
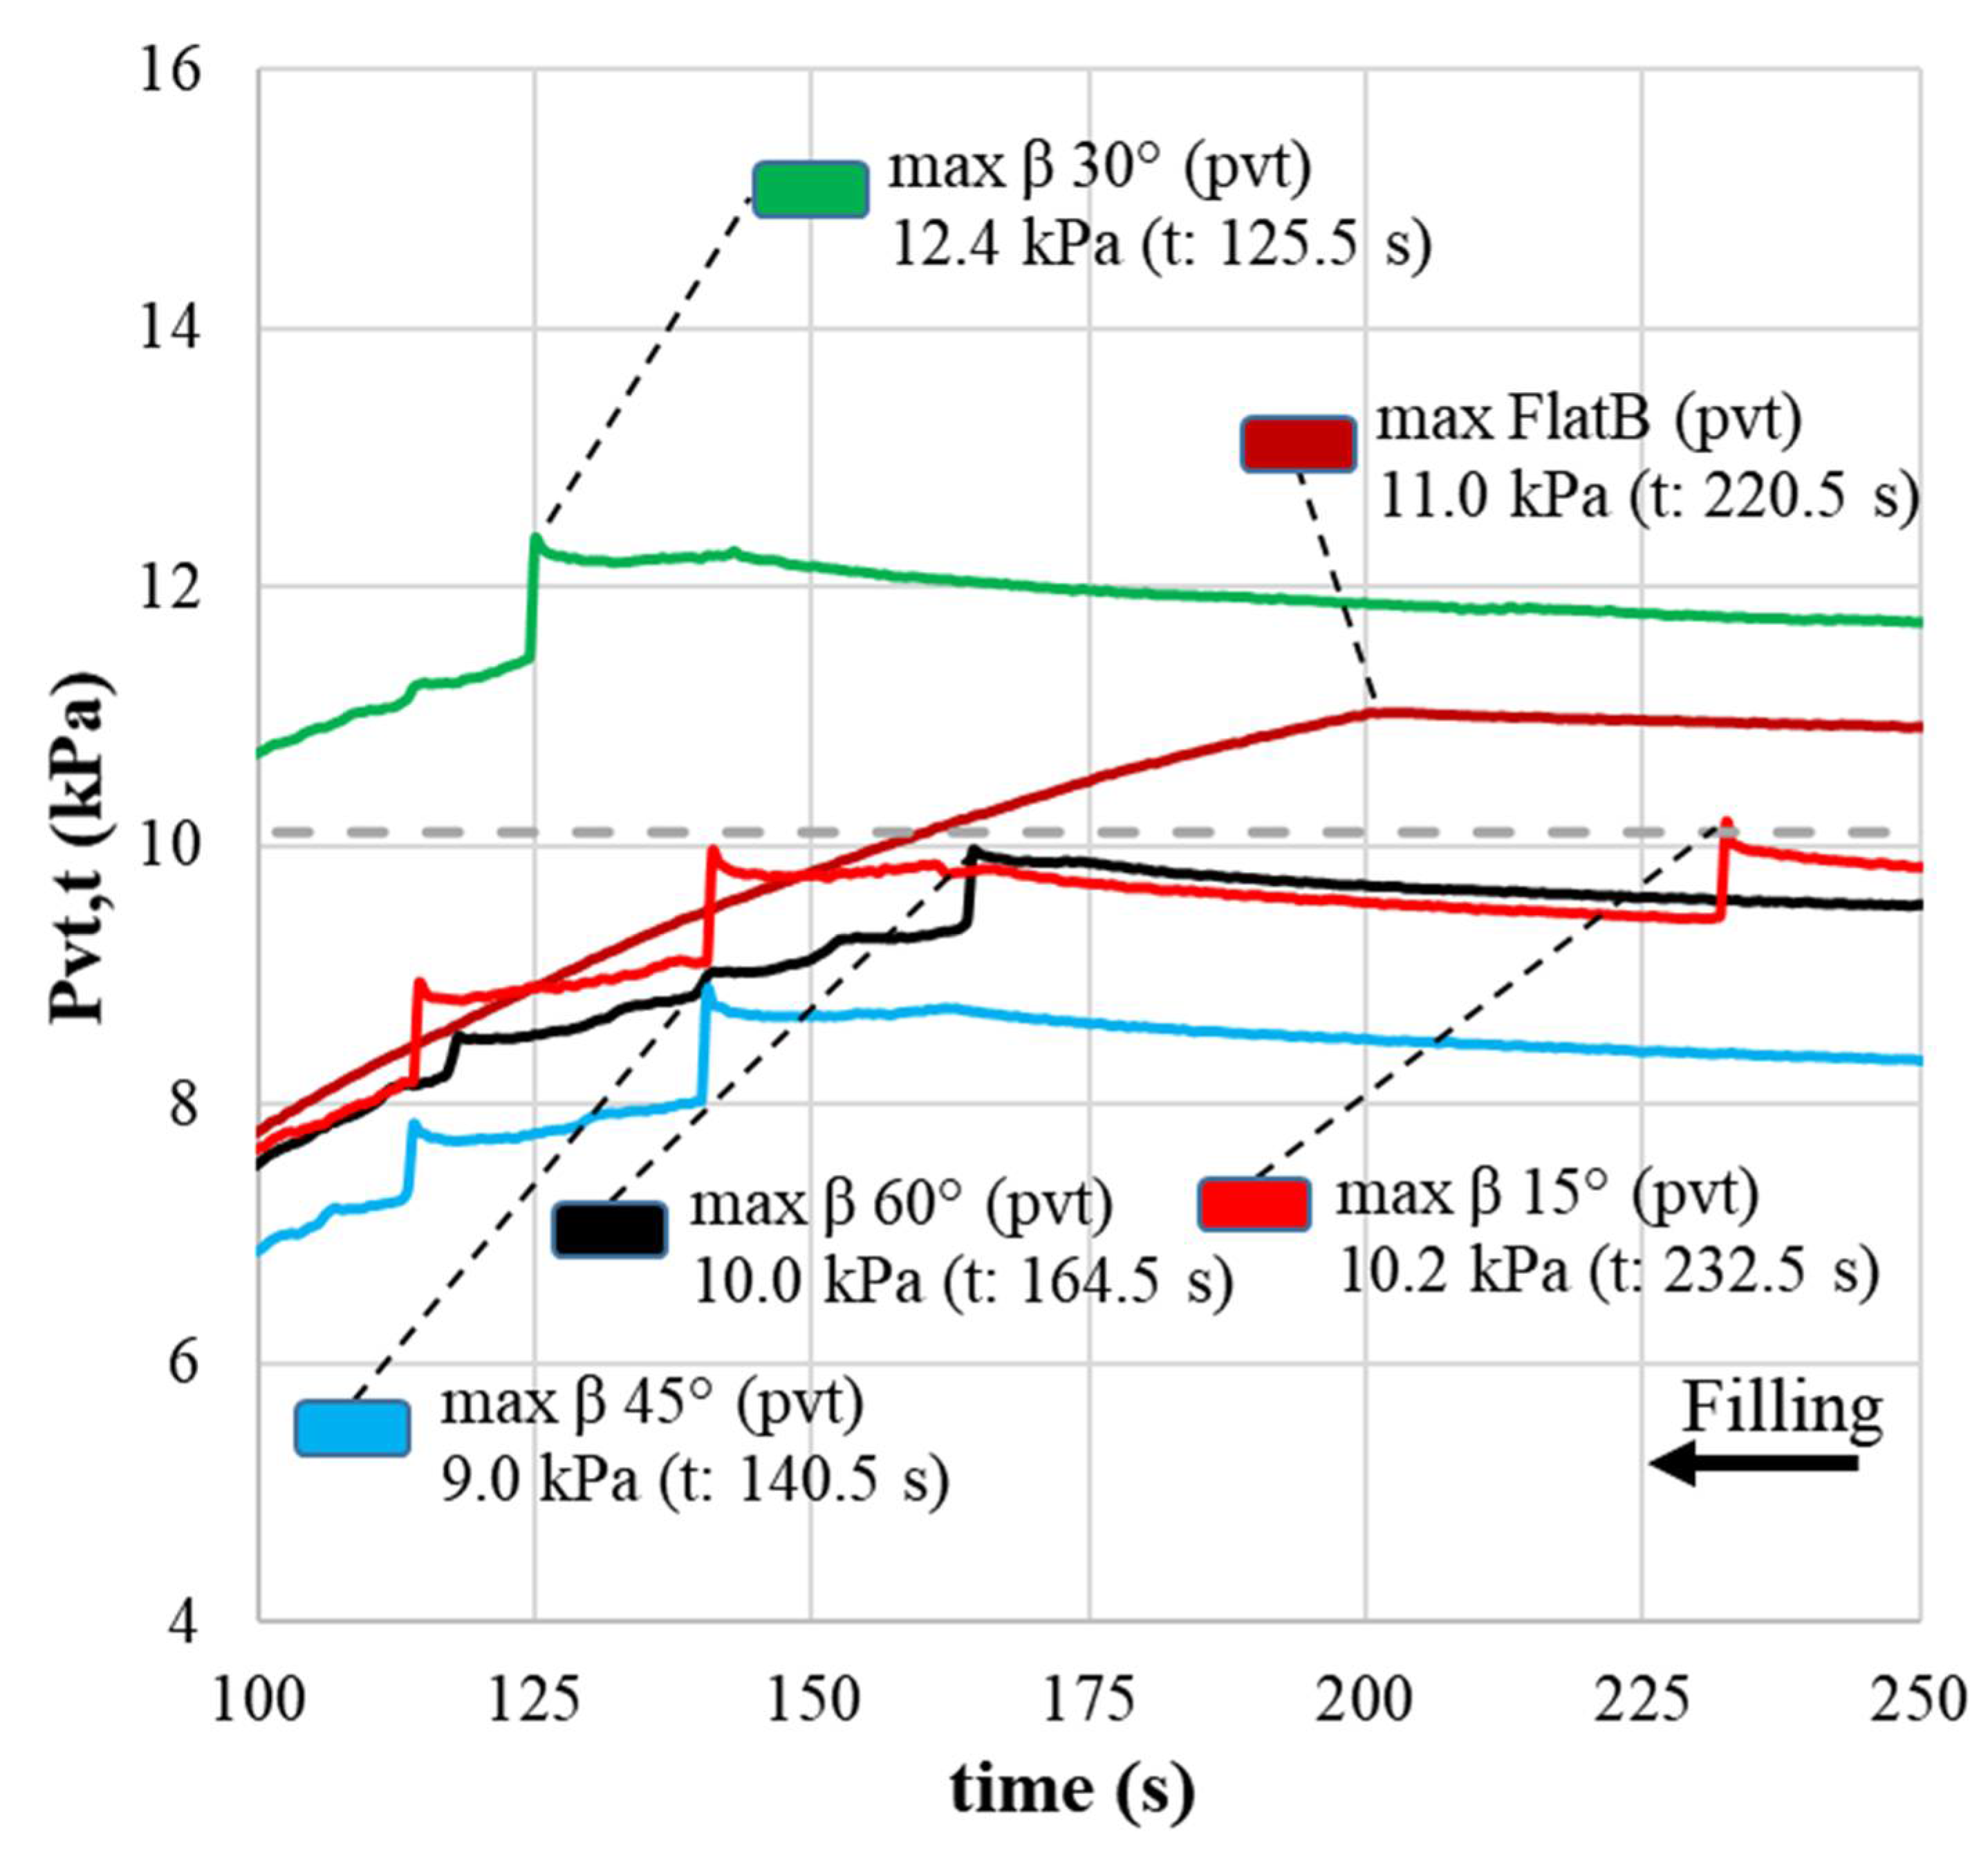
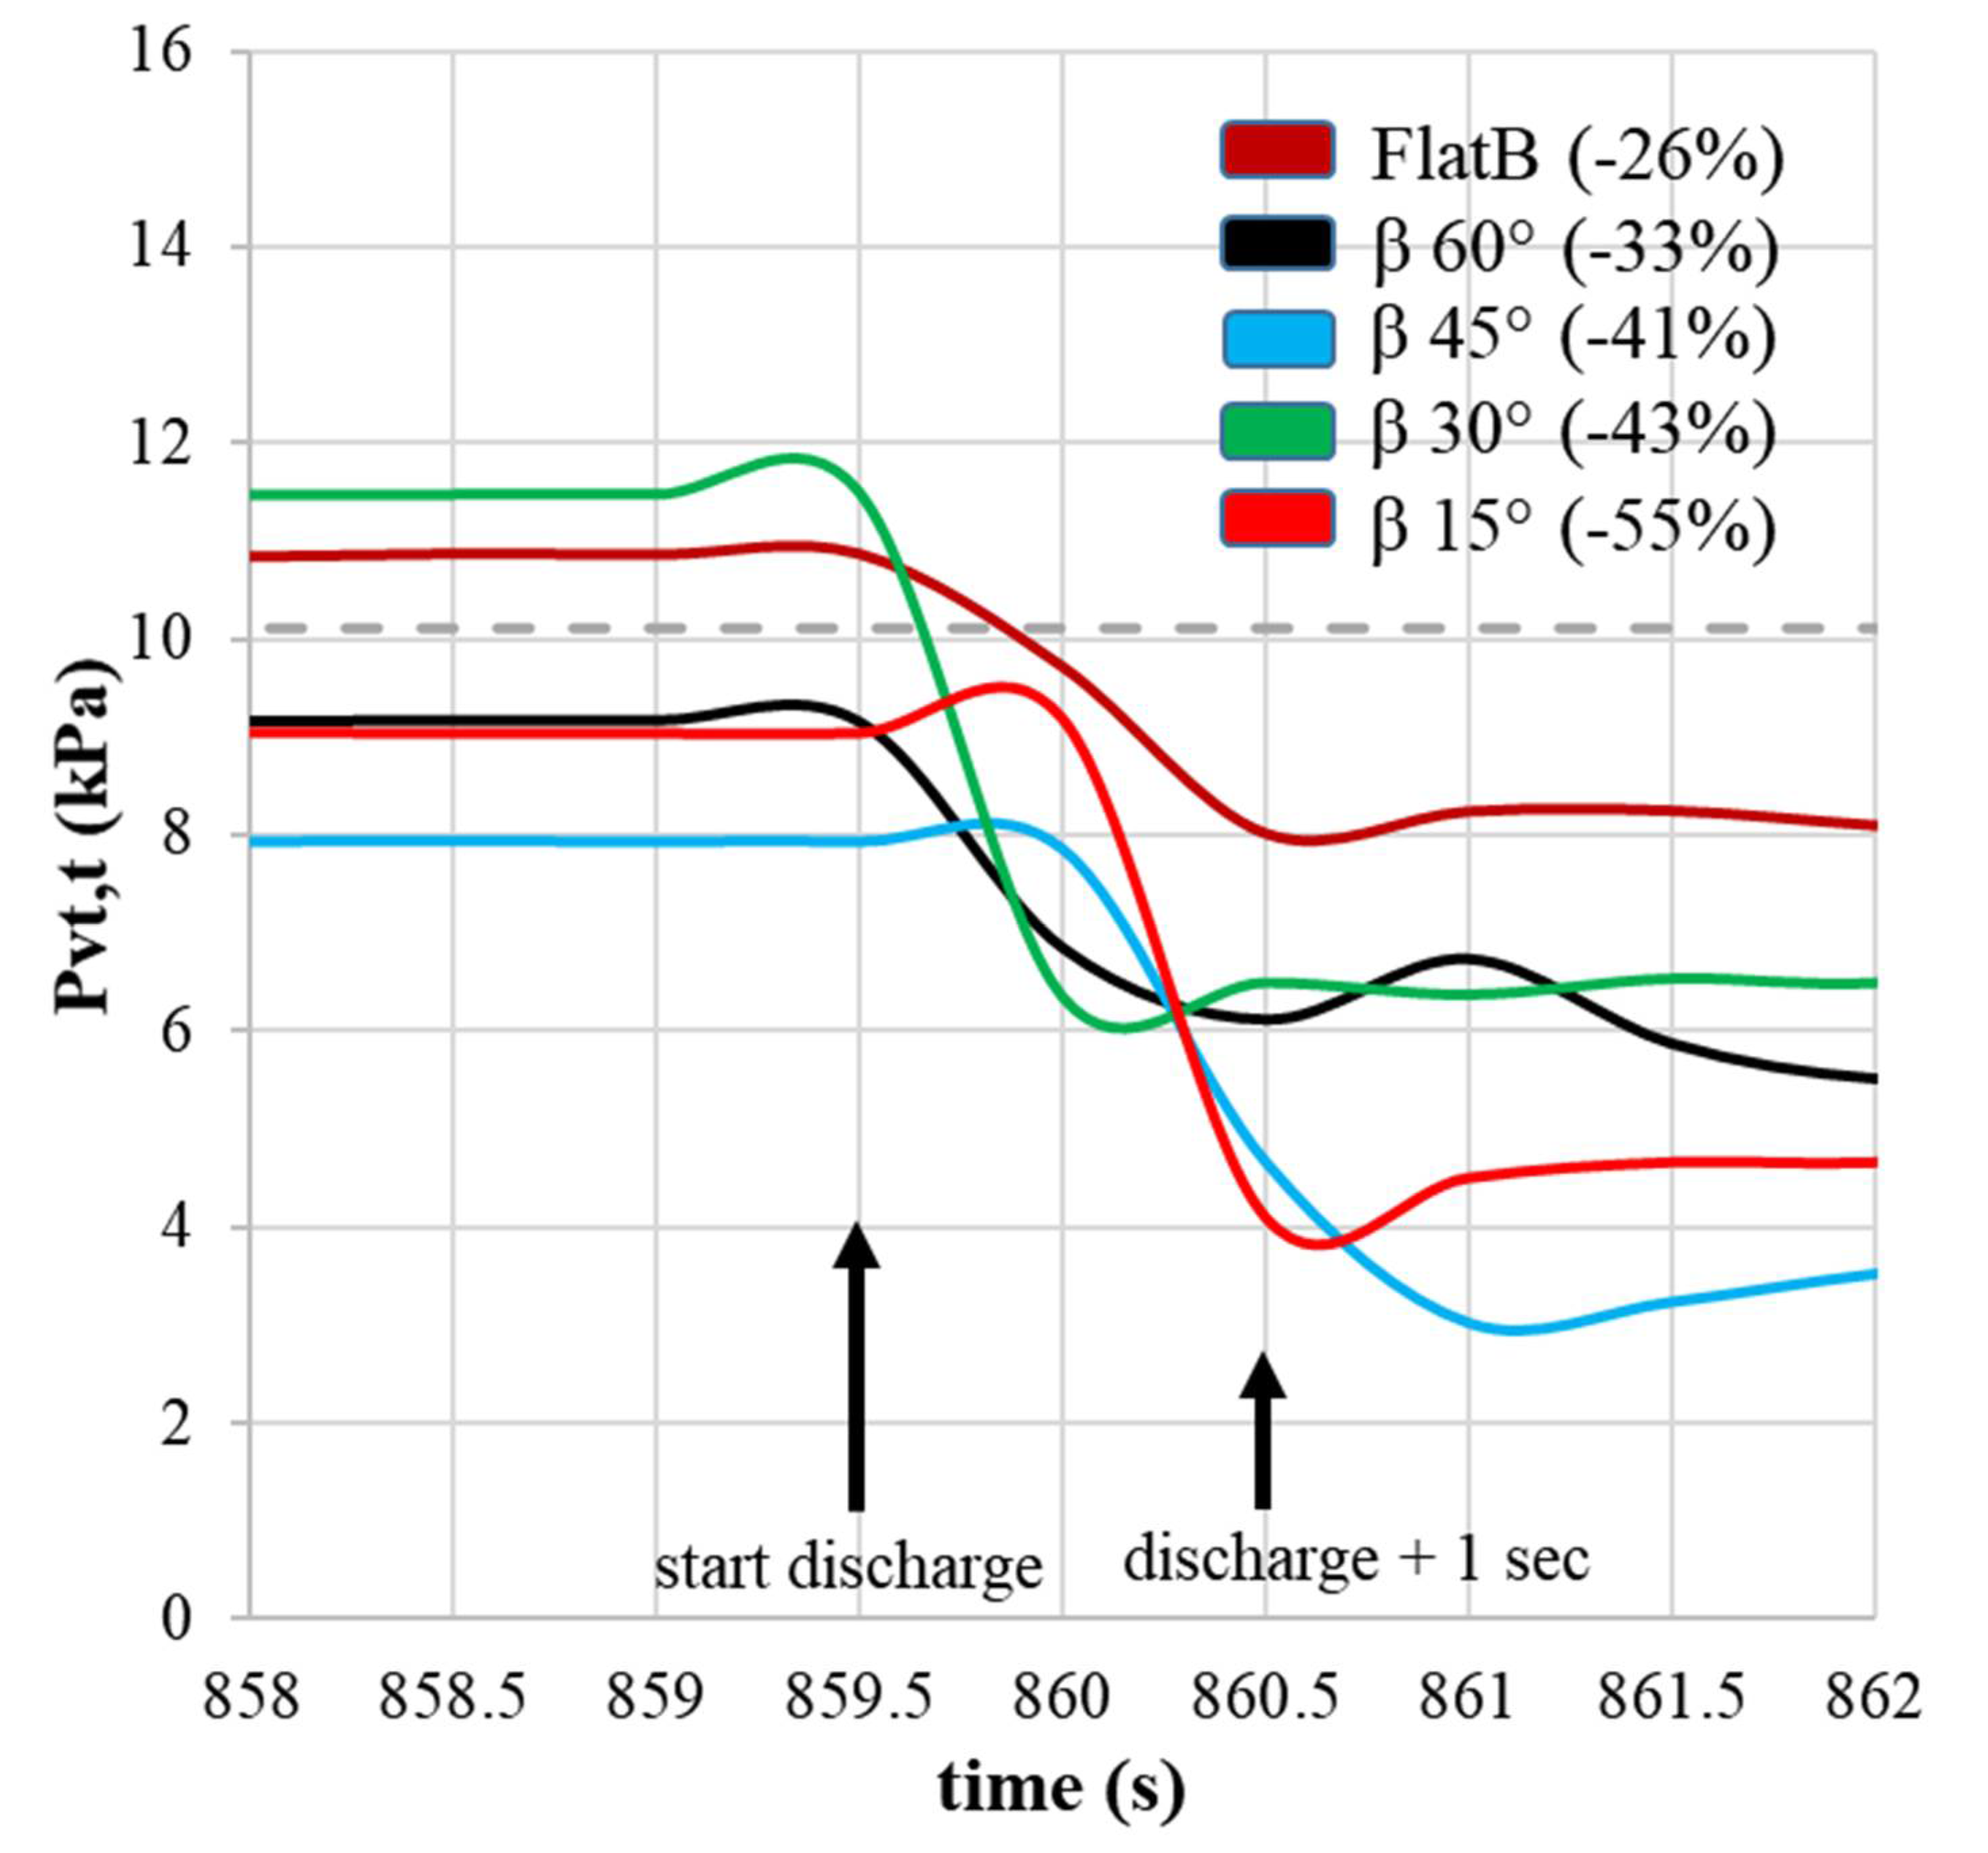
Figure 6 shows the vertical stresses at the transition (Pvt) obtained in the test station for different concentric hopper inclinations during the filling, the static storage phase and the discharge. These measurements were also compared with the value calculated following Eurocode 1 [11]. Figure 7 and Figure 8 show the results of the end of the filling and the beginning of the discharge in detail, respectively.
The vertical stress in the stored material at the transition (Pvt) obtained using Eurocode 1 was influenced only by the size of the silo cylinder, not by the hopper geometry. However, it can be observed that the experimental results were influenced by the geometry of the bottom.
The maximum values of Pvt during filling, as well as the values during discharge (from 859.5 from 860.5 s) are shown in Table 4.
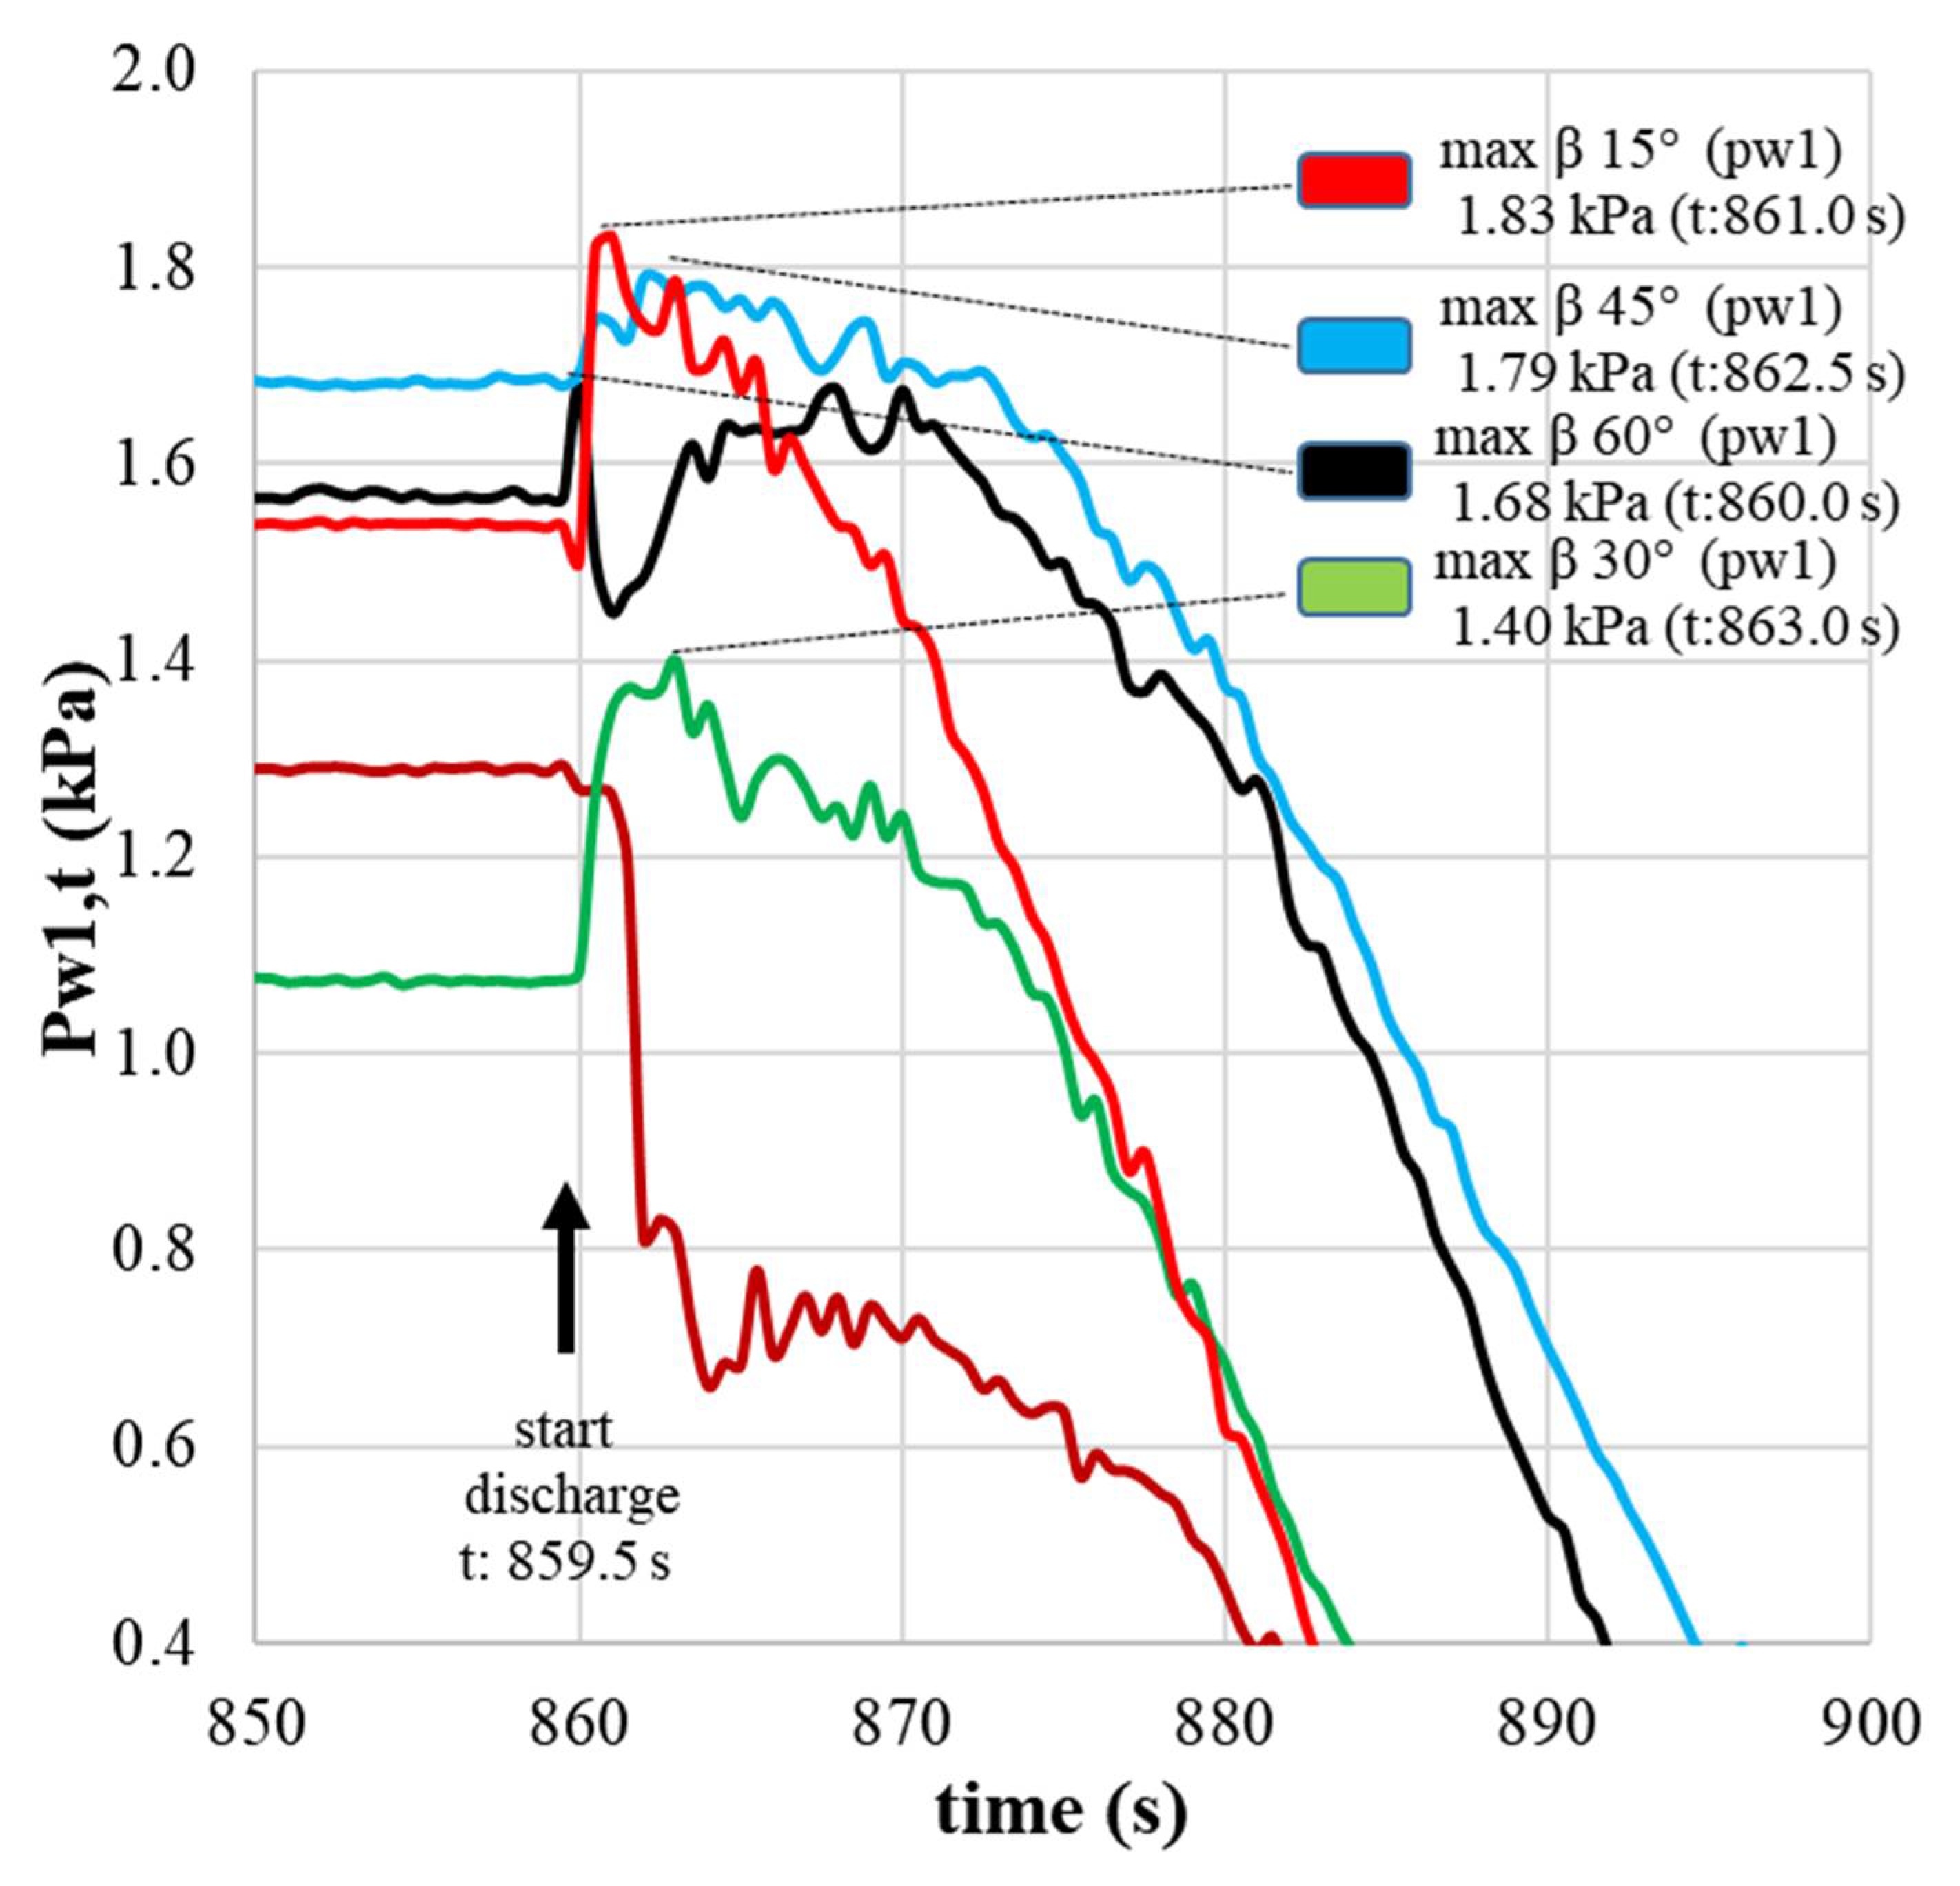
Frictional pressures measured at a height of 0.25 m above the transition (Pw1) are shown in Figure 9. The results of and the trends in these pressures showed a relationship with Pvt.
For the flat bottom and β60° tests, there was a sharp drop in pressure a few seconds after the commencement of the discharge. For the β45°, β30° and β15° tests, the pressure peak occurred at the beginning of the discharge.
It is interesting to note a certain relationship between the Pvt accommodation peaks during filling (Figure 6) and the frictional overpressures at a height of 0.25 m (Pw1). Pvt accommodation peaks were higher for steep hoppers (β15°, β30° and β45°), were lower for the shallow hopper (β60°), and were not present for flat hoppers (FlatB). Pw1, analogously, presented high peaks for steep hoppers (β15°, β30° and β45°), a moderate drop for the shallow hopper (β60°), and a deep pressure drop for the flat hopper (FlatB).
It was also observed (Figure 9) that the lowest friction pressure on the cylinder wall (Pw1) before the discharge corresponded to the steep hopper and funnel flow configuration (β30°). However, the time of occurrence of the maximum pressure was the longest (t = 863 s).
In Figure 9, it can also be seen that in mass flow (β = 15°) the silo is discharged faster, because there are no dead zones. The curves are not fully comparable, since varying the angle of the hopper changes its volume.

4. Discussion

Table 2 shows that for β = 15°, that is, for mass flow, the values are lower both in filling and in discharge; this reveals the influence that flow type has on the Pvt values. This fact is especially interesting since it is known [11] that in mass flow, horizontal overpressures can occur near the transition, which shows that there is a change between the ratio of horizontal and vertical pressures.
It is remarkable that the highest values for Pvt during filling and the static phase were measured for β = 30°. It is believed that this behavior was due to the distribution of pressures in the silo, i.e., the friction pressure at 0.25 m above the transition in the β30° test was the smaller (Figure 9). If the friction was lower, less weight was supported by the walls; therefore, more weight was being transferred to the vertical stresses.
Frictional pressures (Pw) were inversely linked with Pvt. It is observed in Figure 8, at the moment of discharge, that the magnitude of frictional pressures (Pw1) at 0.25 m above the transition was inversely proportional to Pvt. The maximum friction pressure in FlatB occurred during filling (Figure 9). The steep hoppers (β15°; β30° and β45°) presented a friction overpressure at the beginning of the discharge due to the vertical movement of the product stored in the region at 0.25 m above the transition (Pw1); this volume movement caused the grain mass to rub against the wall, creating resistance against the z-axis. On the contrary, in the case of mass flow (β15°), the discharge was faster as there were no dead zones.
It was also observed (Figure 7) that the maximum Pvt in all configurations always occurred at the end of filling, at the last settling peak of the material before entering in the static phase.
In the case of the discharge pressures, the negative peaks (difference between the pressure during the static phase and the lowest pressure that was measured in the initial moment of the discharge phase, specifically from 859.5 s to 860.5 s) were proportional to the β angle. A lower β angle corresponded to a higher negative peak ∆Pvt (Table 4). This can be explained by the change in stress state during discharge, i.e., the packaging of the particles during the discharge increased or decreased in certain areas in relation to the previous static state [14,32]. The flow pattern could also partly explain the behavior of the discharge pressures; for example, in the β15° test there was mass flow and a fast discharge with a peak at the start followed by a considerable drop in the pressures.
The β30° and FlatB configurations had the highest Pvt values, respectively, and exceeded the values proposed by the Eurocode (Figure 6). However, Pvt values for β15° did not exceed the Eurocode ones despite having a higher inclination than the β30° case. This could be explained by the mass flow pattern corresponding to β15° (see Figure 4), which differs from the rest of cases.
Figure 6 shows that the pressures decrease when the hopper angle decreases from β = 0° to β = 45°, but for β = 30° and 15 the trend changes; this is due to the fact that in these last two cases the type of flow rate is mass (β = 15°) and close to the transition zone (β = 30°). In these cases, there is no or very little channel flow, which causes a change in the stress state, as mentioned when discussing Table 2.
It is important to remark that the five hopper configurations applied in this study defined five different volumes, so the volume and the weight of the product stored in the silo also changed. Thus, results are not fully comparable.

5. Conclusions

The relationships between flow pattern, hopper angle, and vertical stress at the cylinder-to-hopper transition have been studied by means of experimental tests in an experimental station located at the Federal University of Lavras (Brazil). Maize was used in all tests.
The maximum values of the vertical stress in the stored material at the transition (Pvt) occurred due to the settlement of the material at the end of the silo filling for all bottom configurations. During the discharge phase, the negative pressure peaks depended on the hopper angle (β); the larger the β angle, the smaller the difference between pressures. There was an inverse relationship between friction pressures and Pvt values near the transition (0.25 m above).
The transition flow (β = 30°) presented the lowest friction pressure in the cylinder (Pw1) 0.25 m above the transition and the highest vertical stress in the stored material at the transition (Pvt).
Some bottom configurations (β 30° and FlatB) exceeded vertical stresses at the transition calculated according to Eurocode 1, part 4. At the moment, this standard does not consider the hopper angle when calculating the vertical stresses. However, the collection of experimental data obtained in this study suggests that the calculation method in the Eurocode should be revised.

Author Contributions

Conceptualization, R.M.G. Methodology, R.M.G. Validation, R.M.G. Formal analysis, R.M.G. Investigation, R.M.G. and E.A.d.O.J. Resources, Á.R.P. Data curation, P.J.A.R. Writing—original draft preparation, R.M.G. Writing—review and editing, W.C.d.P., A.T.V. and P.J.A.R. Visualization, W.C.d.P., G.H.R. and A.T.V. Supervision, F.C.G. and P.J.A.R. Project administration, F.C.G. Funding acquisition, F.C.G. All authors have read and agreed to the published version of the manuscript.

Funding

This research received no external funding.

Data Availability Statement

Not applicable.

Acknowledgments

The authors are very grateful to the Stored Product Flow Properties Laboratory of Federal University of Lavras and to the Department of Engineering and Agricultural Sciences of the University of León.

Conflicts of Interest

The authors declare no conflict of interest.

References

  1. CONAB—Companhia Nacional de Abastecimento. Acompanhamento da Safra Brasileira de Grãos, Brasilia, 2022. Available online: https://www.conab.gov.br/component/k2/item/download/40788_0ee9dd05157257045355d00863c854b0 (accessed on 2 January 2022).
  2. Ministério da Agricultura Pesca y Alimentación. Avances de Superficies y Producciones Agrícolas. Diciembre 2020. Available online: https://www.mapa.gob.es/es/estadistica/temas/estadisticas-agrarias/cuaderno_diciembre2020_tcm30-558173.pdf (accessed on 2 January 2022).
  3. Ayuga, F. Some unresolved problems in the design of steel cylindrical silos. In Structures and Granular Solids from Scientific Principles to Engineering Applicationsl; Chen, J.G., Teng, J.F., Eds.; CRC Press-Taylor & Francis Group: Boca Raton, FL, USA, 2008; pp. 123–133. [Google Scholar]
  4. Dogangun, A.; Karaca, Z.; Durmus, A.; Sezen, H. Cause of damage and failures in silo structures. J. Perform. Constr. Facil. 2009, 23, 65–71. [Google Scholar] [CrossRef]
  5. Nielsen, J. From silo phenomena to load models. In Structures and Granular Solids from Scientific Principles to Engineering Applications; Chen, J.F., Teng, J.G., Eds.; CRC Press-Taylor & Francis Group: Boca Raton, FL, USA, 2008; pp. 49–57. [Google Scholar] [CrossRef]
  6. Teng, J.G. Collapse strength of complex metal shell intersections by the effective area method. J. Press. Vessel Technol. Trans. ASME 1998, 120, 217–222. [Google Scholar] [CrossRef]
  7. Chen, J.F.; Rotter, J.M.; Ooi, J.Y.; Zhong, Z. Correlation between the flow pattern and wall pressures in a full scale experimental silo. Eng. Struct. 2007, 29, 2308–2320. [Google Scholar] [CrossRef]
  8. Morán, J.M.; Juan, A.; Robles, R.; Aguado, P.J. Effects of Environmental Temperature Changes on Steel Silos. Biosyst. Eng. 2006, 94, 229–238. [Google Scholar] [CrossRef]
  9. Benink, E.J. Flow and Stress Analysis of Cohesionless Bulk Materials in Silos Related to Codes; University of Twente: Enschede, The Netherlands, 1989. [Google Scholar]
  10. Jenike, A. Storage and Flow of Bulk Solids Bull. 123; University of Utah: Salt Lake, UK, USA, 1964. [Google Scholar]
  11. CEN, EN 1991-4:2006; Eurocode 1: Actions on Structures. Part 4: Silos and Tanks. AENOR: Brussels, Belgium, 2006.
  12. ISO 11697:2012; Bases for Design of Strutures—Loads Due to Bulk Materials. Internacional Organization for Standardization: Geneva, Switzerland, 2012.
  13. Nielsen, J. Pressures from flowing granular solids in silos. Philos. Trans. R. Soc. A Math. Phys. Eng. Sci. 1998, 356, 2667–2684. [Google Scholar] [CrossRef]
  14. Couto, A.; Ruiz, A.; Aguado, P.J. Experimental study of the pressures exerted by wheat stored in slender cylindrical silos, varying the flow rate of material during discharge. Comparison with Eurocode 1 part 4. Powder Technol. 2013, 237, 450–467. [Google Scholar] [CrossRef]
  15. Sadowski, A.J.; Rotter, J.M. Structural Behavior of Thin-Walled Metal Silos Subject to Different Flow Channel Sizes under Eccentric Discharge Pressures. J. Struct. Eng. 2012, 138, 922–931. [Google Scholar] [CrossRef] [Green Version]
  16. Gandia, R.M.; Gomes, F.C.; de Paula, W.C.; Aguado, P.J.R. Influence of specific weight and wall friction coefficient on normal pressures in silos using the Finite Element Method. Rev. Eng. Na Agric. Reveng. 2021, 29, 192–203. [Google Scholar] [CrossRef]
  17. Gandia, R.M.; Gomes, F.C.; de Paula, W.C.; Rodriguez, P.J.A. Evaluation of pressures in slender silos varying hopper angle and silo slenderness. Powder Technol. 2021, 394, 478–495. [Google Scholar] [CrossRef]
  18. Ding, S.; Li, H.; Ooi, J.Y.; Rotter, J.M. Prediction of flow patterns during silo discharges using a finite element approach and its preliminary experimental verification. Particuology 2015, 18, 42–49. [Google Scholar] [CrossRef]
  19. Chen, Y.; Liang, C.; Wang, X.; Guo, X.; Chen, X.; Liu, D. Static pressure distribution characteristics of powders stored in silos. Chem. Eng. Res. Des. 2020, 154, 1–10. [Google Scholar] [CrossRef]
  20. Méndez, D.; Hidalgo, R.C.; Maza, D. The role of the hopper angle in silos: Experimental and CFD analysis. Granul. Matter. 2021, 23, 1–13. [Google Scholar] [CrossRef]
  21. Darias, J.R.; Gella, D.; Fernández, M.E.; Zuriguel, I.; Maza, D. The hopper angle role on the velocity and solid-fraction profiles at the outlet of silos. Powder Technol. 2020, 366, 488–496. [Google Scholar] [CrossRef]
  22. Mehdizad, M.; Fullard, L.; Galvosas, P.; Holland, D. Quantitative measurements of flow dynamics in 3D hoppers using MRI. Powder Technol. 2021, 392, 69–80. [Google Scholar] [CrossRef]
  23. Olivares, M.C.V.; Benito, J.G.; Uñac, R.O.; Vidales, A.M. Towards a one parameter equation for a silo discharging model with inclined outlets. Powder Technol. 2018, 336, 265–272. [Google Scholar] [CrossRef] [Green Version]
  24. Ayuga, F.; Aguado, P.; Gallego, E.; Ramirez, A. Experimental tests to validate numerical models in silos design. ASABE Annu. Int. Meet. 2006, 1–15. [Google Scholar] [CrossRef]
  25. Gallego, E.; Rombach, G.A.; Neumann, F.; Ayuga, F. Simulations of Granular Flow in Silos with Different Finite Element Programs: Ansys vs. silo. Trans. ASABE 2010, 53, 819–829. [Google Scholar] [CrossRef]
  26. Gallego, E.; Ruiz, A.; Aguado, P.J. Simulation of silo filling and discharge using ANSYS and comparison with experimental data. Comput. Electron. Agric. 2015, 118, 281–289. [Google Scholar] [CrossRef]
  27. Pieper, K.; Schütz, M. Bericht Über das Forschungsvorhaben—Norm-Mess-Silo Für Schüttguteigenschaften; Technische Universität Braunschweig: Braunschweig, Germany, 1980. [Google Scholar]
  28. Gandia, R.M.; Júnior, E.A.D.O.; Gomes, F.C.; de Paula, W.C.; Dornelas, K.C. Experimental Pressures Exerted by Maize in Slender Cylindrical Silo: Comparison with Iso 11697. Eng. Agric. 2021, 41, 576–590. [Google Scholar] [CrossRef]
  29. Gandia, R.M.; Gomes, F.C.; de Paula, W.C.; Junior, E.A.d.; Rodriguez, P.J.A. Static and dynamic pressure measurements of maize grain in silos under different conditions. Biosyst. Eng. 2021, 209, 180–199. [Google Scholar] [CrossRef]
  30. DIN. DIN 1055-6: Basis of Design and Actions on Structures—Part 6: Design 623 Loads for Buildings and Loads in Silo Bins; Verlaz: Berlin, Germany, 2005. [Google Scholar]
  31. WPMPS. Standart Shear Testing Technique for Particulate Solids Using the Jenike Shear Cell; IChemE: Warwickshire, UK, 1989. [Google Scholar]
  32. Couto, A.; Ruiz, A.; Herráez, L.; Moran, J.; Aguado, P.J. Measuring pressures in a slender cylindrical silo for storing maize. Filling, static state and discharge with different material flow rates and comparison with Eurocode 1 part 4. Comput. Electron. Agric. 2013, 96, 40–56. [Google Scholar] [CrossRef]
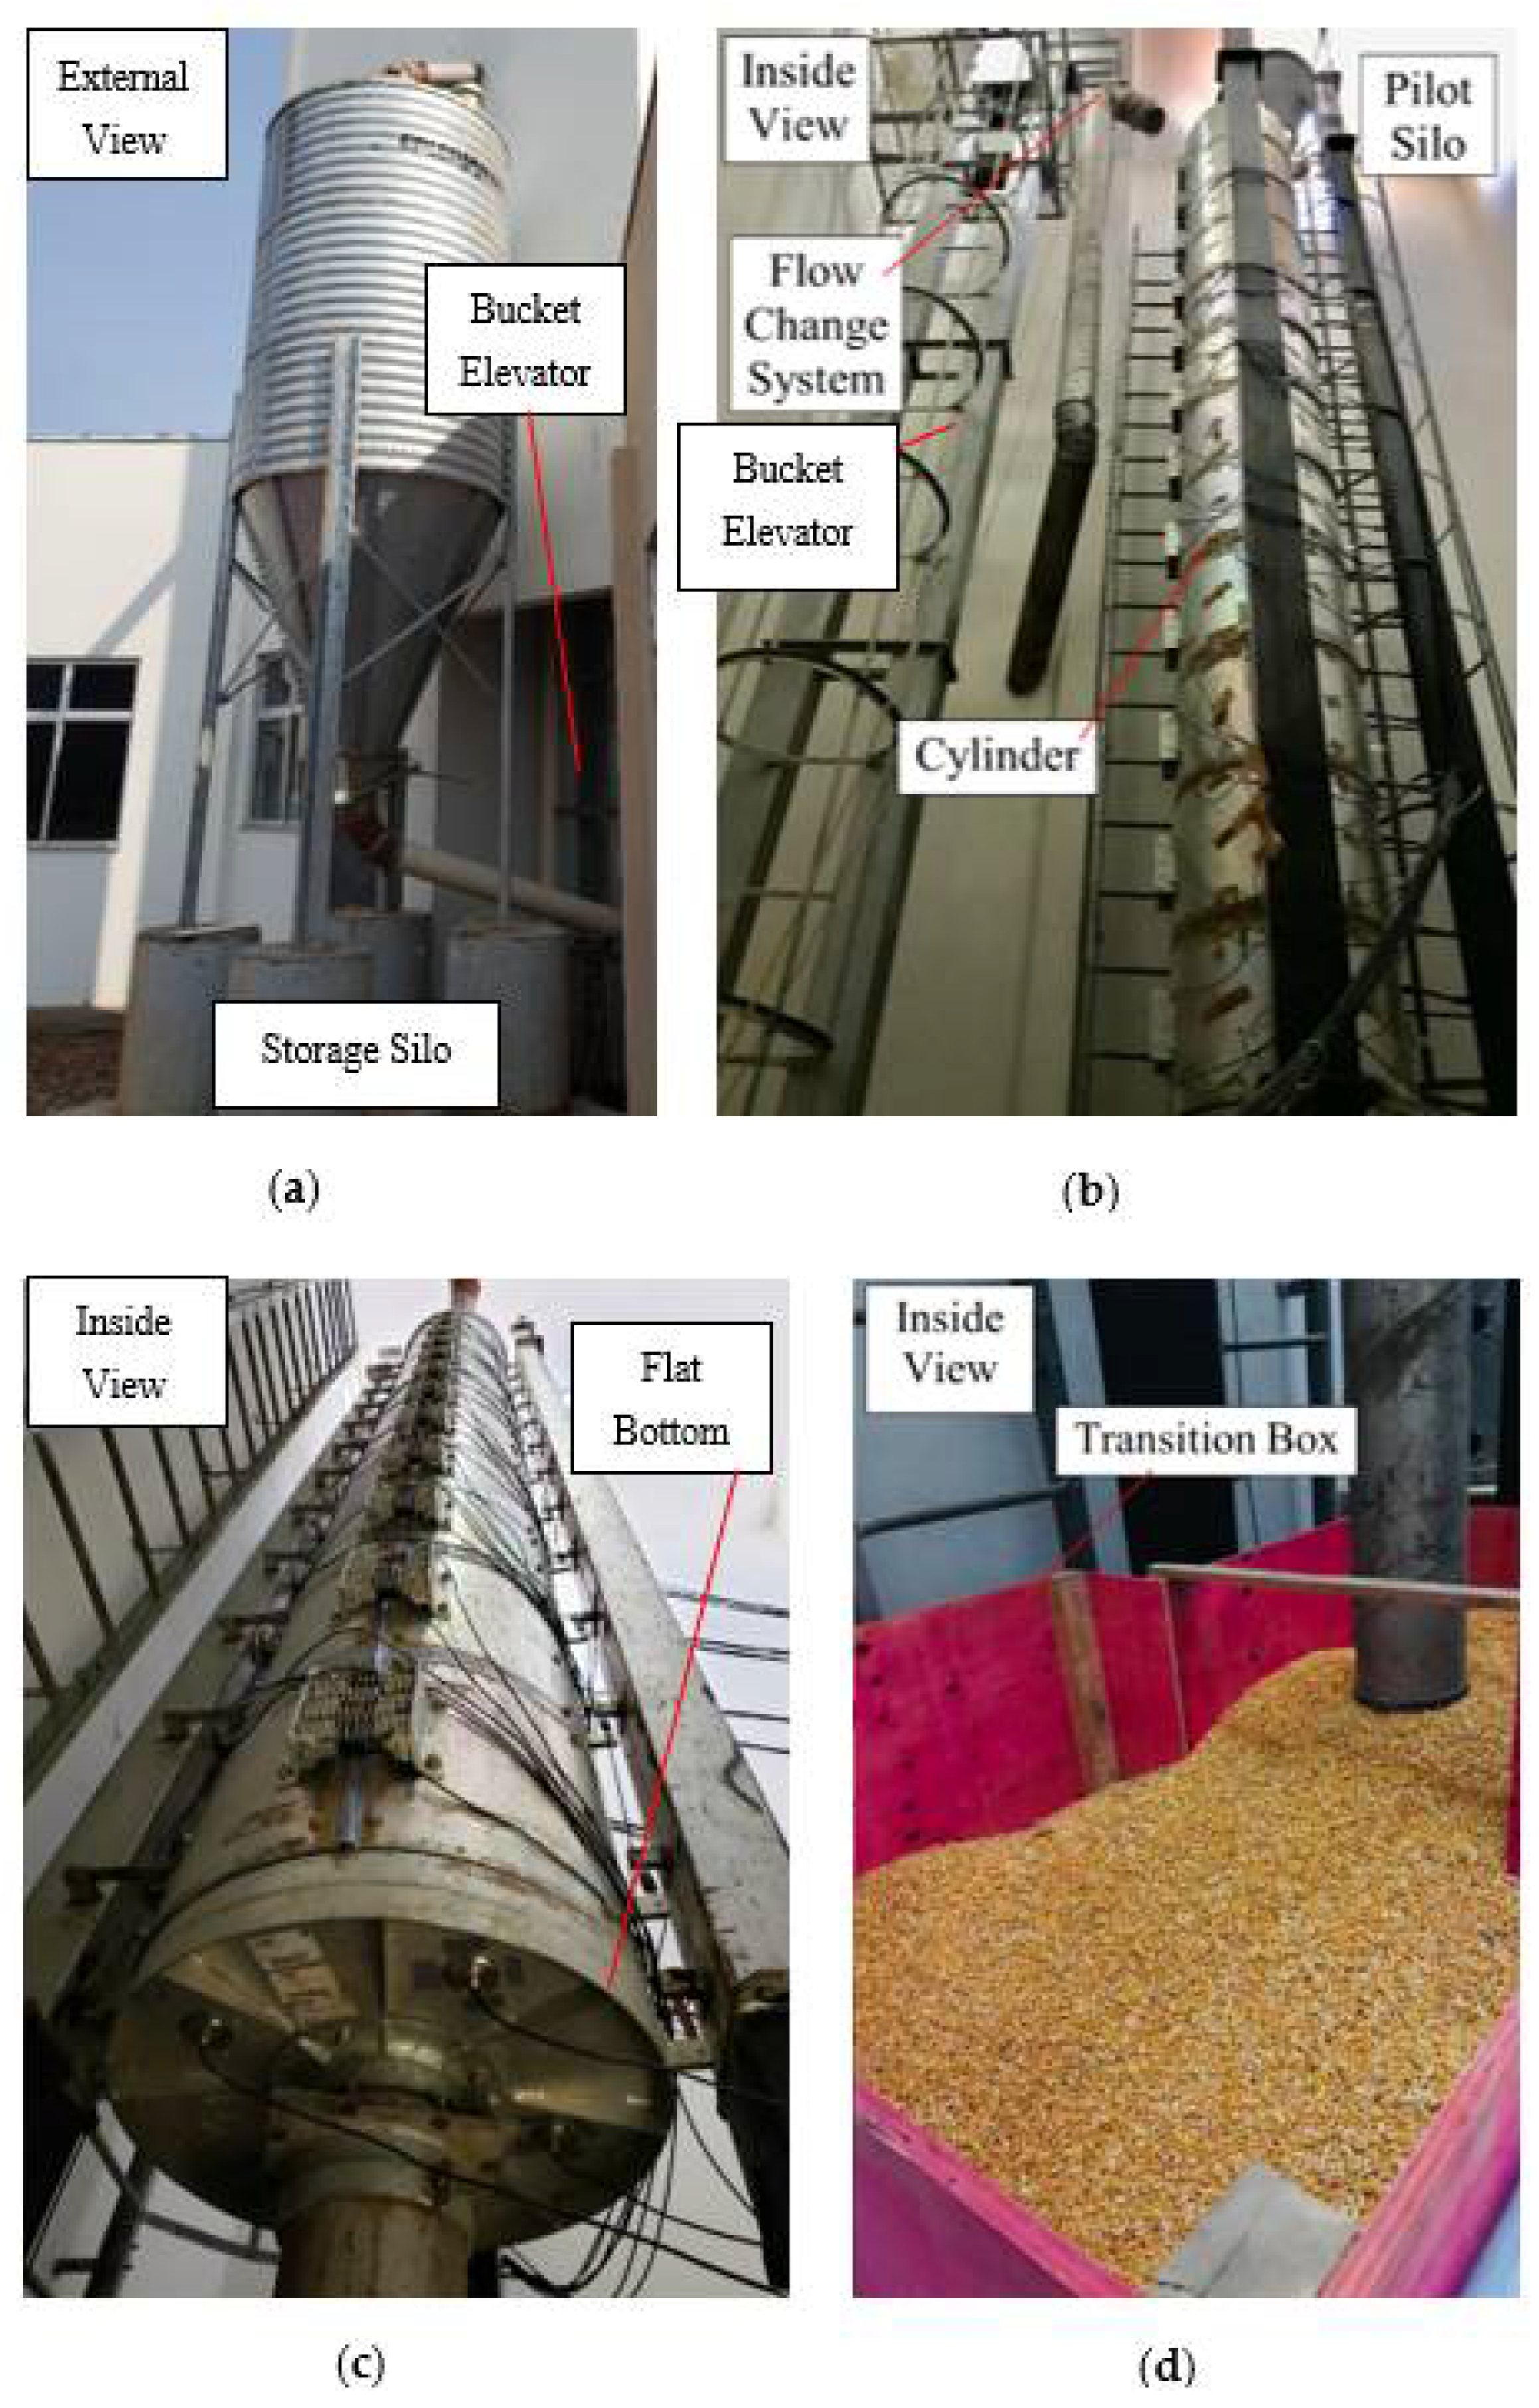
Figure 1. Pilot-scale test station. (a) External view, storage silo; (b) inside view, pilot silo and bucket elevator; (c) inside view, pilot silo; (d) inside view, transition box.
Agronomy 12 00830 g001
Figure 2. Measurement cells for vertical stress at the silo–hopper transition (Pvt,t) and frictional wall pressures (Pw,t).
Agronomy 12 00830 g002
Figure 3. Some symmetrical filling pressures in the vertical-walled segment according to Eurocode 1, part 4.
Agronomy 12 00830 g003
Figure 4. Conditions for flow patterns according to Eurocode 1, part 4 [11].
Agronomy 12 00830 g004
Figure 5. Test configuration. Description of the assays.
Agronomy 12 00830 g005
Figure 6. Vertical stress in the stored material at the transition (Pvt,t) versus time. Complete test from 0 to 900 s.
Agronomy 12 00830 g006
Figure 7. Last stage of the filling operation. Vertical stress in the stored material at the transition (Pvt,t) versus time.
Agronomy 12 00830 g007
Figure 8. First stage of the discharge. Vertical stress in the stored material at the transition (Pvt,t) versus time.
Agronomy 12 00830 g008
Figure 9. Friction stresses in the cylinder (Pw1,t) 0.25 m above the transition at discharge.
Agronomy 12 00830 g009
Table 1. Physical, mechanical and flow properties of maize.
PropertiesLower LimitUpper Limit
specific weight (kN/m3)7.527.83
angle of repose31.3° 37.1°
cohesion (kPa)0.2411.084
steel wall friction angle7.37° 9.02°
steel wall friction coefficient0.130.16
internal friction angle19° 29°
humidity10.62%
Table 2. Maximum values of Pvt after filling and discharge in each test configuration.
After Filling Pressure (kPa)
CellFlatBβ60°β45°β30°β15°
X ¯ σ X ¯ σ X ¯ σ X ¯ σ X ¯ σ
Pvt10.770.439.871.949.380.4711.530.769.910.79
Discharge pressure (kPa)
CellFlatBβ60°β45°β30°β15°
X ¯ σ X ¯ σ X ¯ σ X ¯ σ X ¯ σ
Pvt10.560.487.430.708.320.3310.880.718.211.34
X ¯ : mean value; σ: standard deviation.
Table 3. Average load for each test.
Test X ¯ (kN) σ (kN)
FlatB7.490.53
β60°7.860.45
β45°8.460.15
β30°8.380.81
β15°9.260.19
X ¯ : mean; σ: standard deviation.
Table 4. Average of the maximum vertical stress at the silo–hopper transition for each test.
TestPvt (kPa)
Max (Filling)859.5 s860.5 s∆ Pvt (859.5–860.5 s)
FlatB11.0410.878.022.85
β 60°9.979.156.123.04
β 45° 8.907.934.673.27
β 30° 12.3811.496.495.00
β 15°10.189.044.104.94
Publisher’s Note: MDPI stays neutral with regard to jurisdictional claims in published maps and institutional affiliations.