
Effect of the Hopper Angle of a Silo on the Vertical Stress at the Cylinder-to-Hopper Transition

 , ,
, ,
Abstract
:1. Introduction
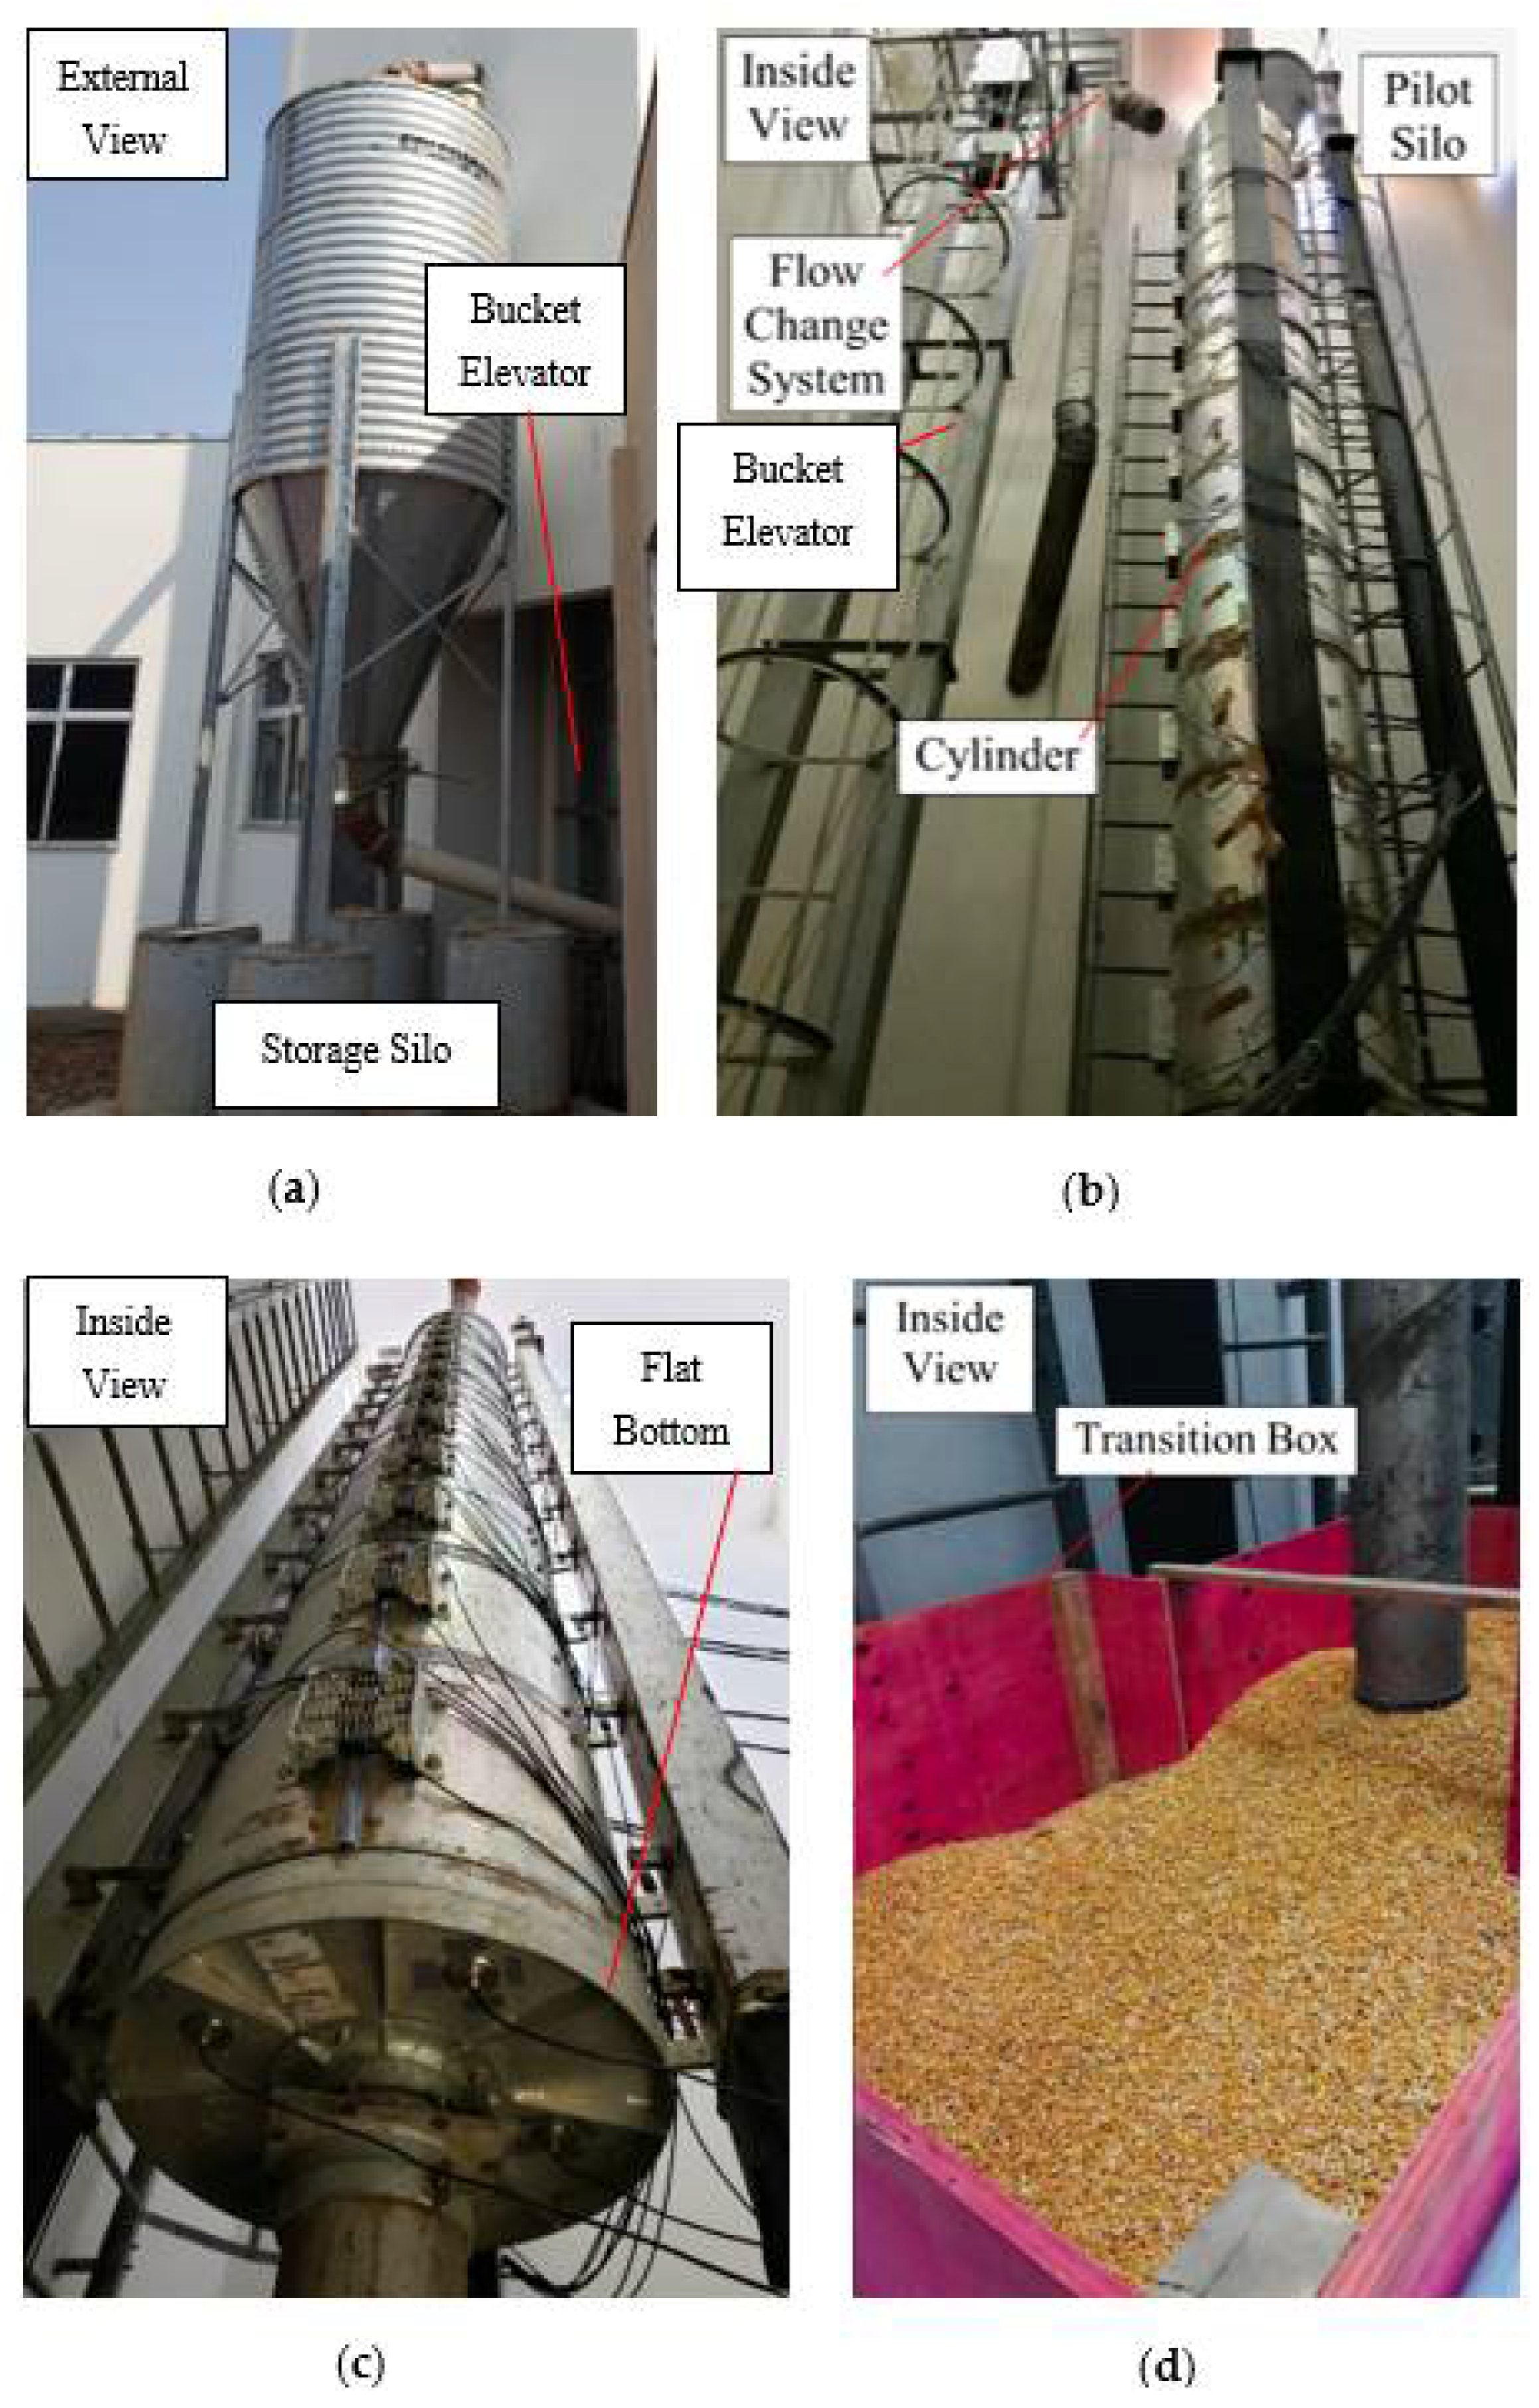
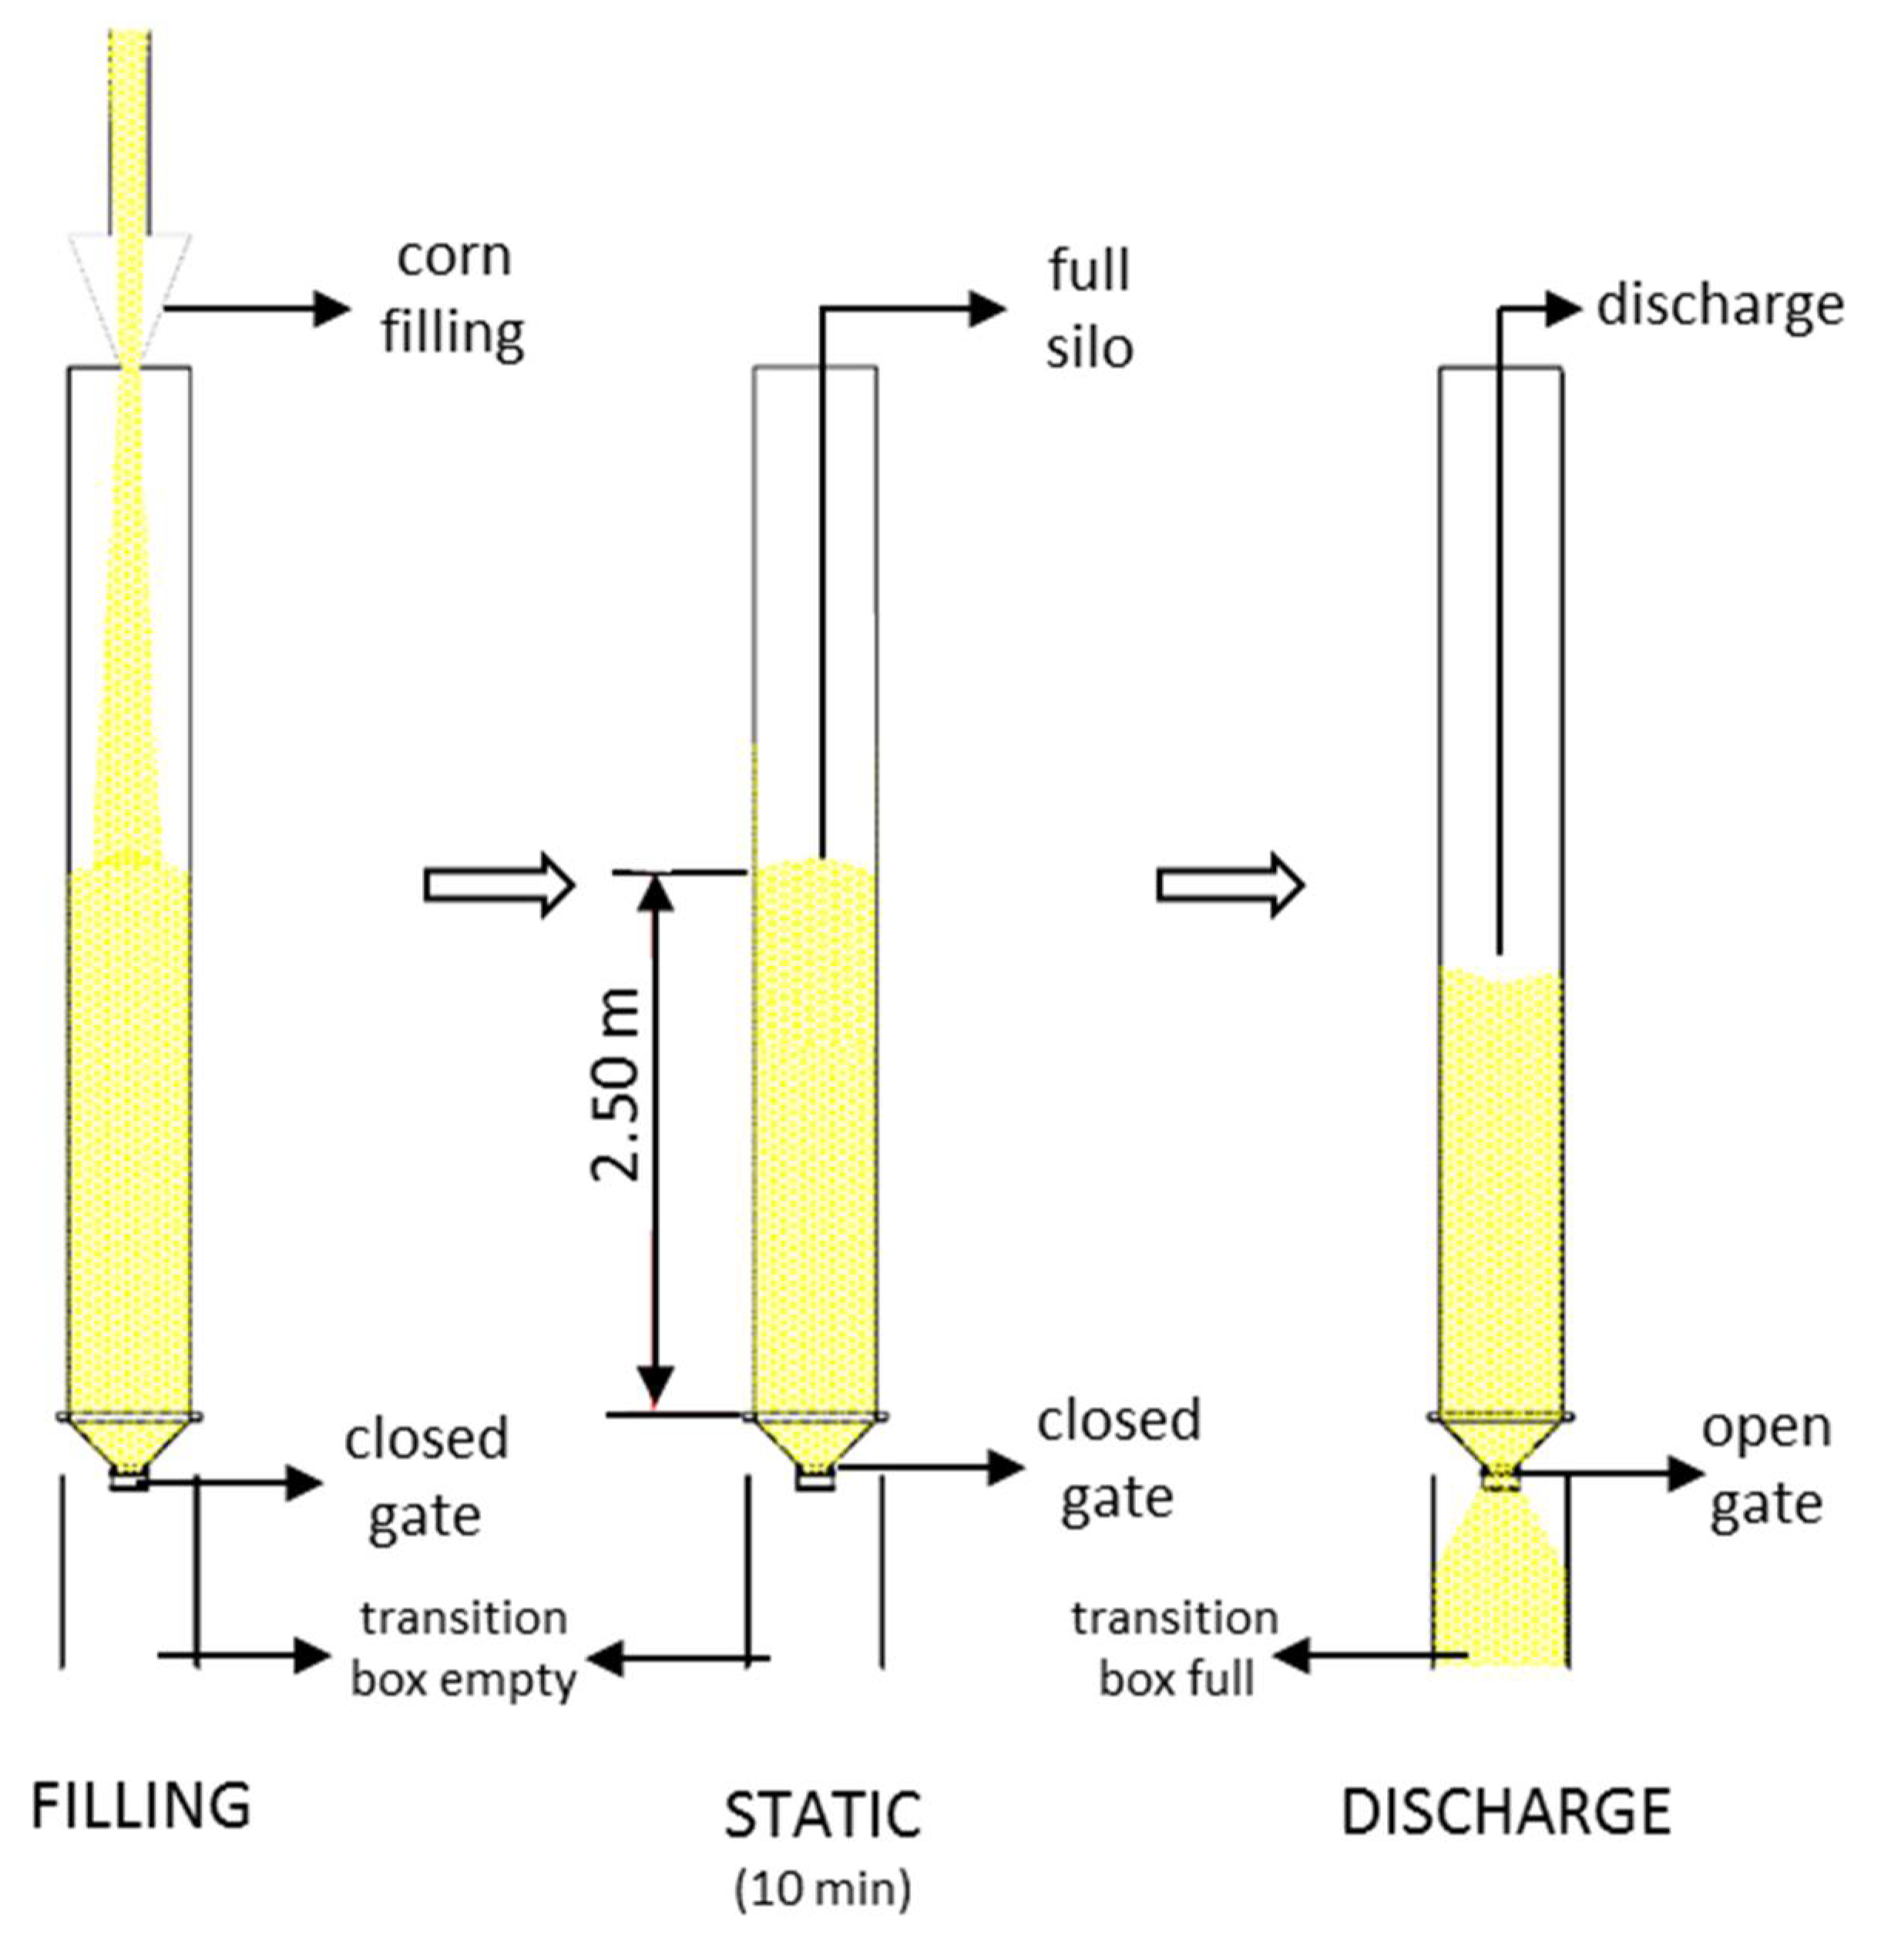
2. Materials and Methods
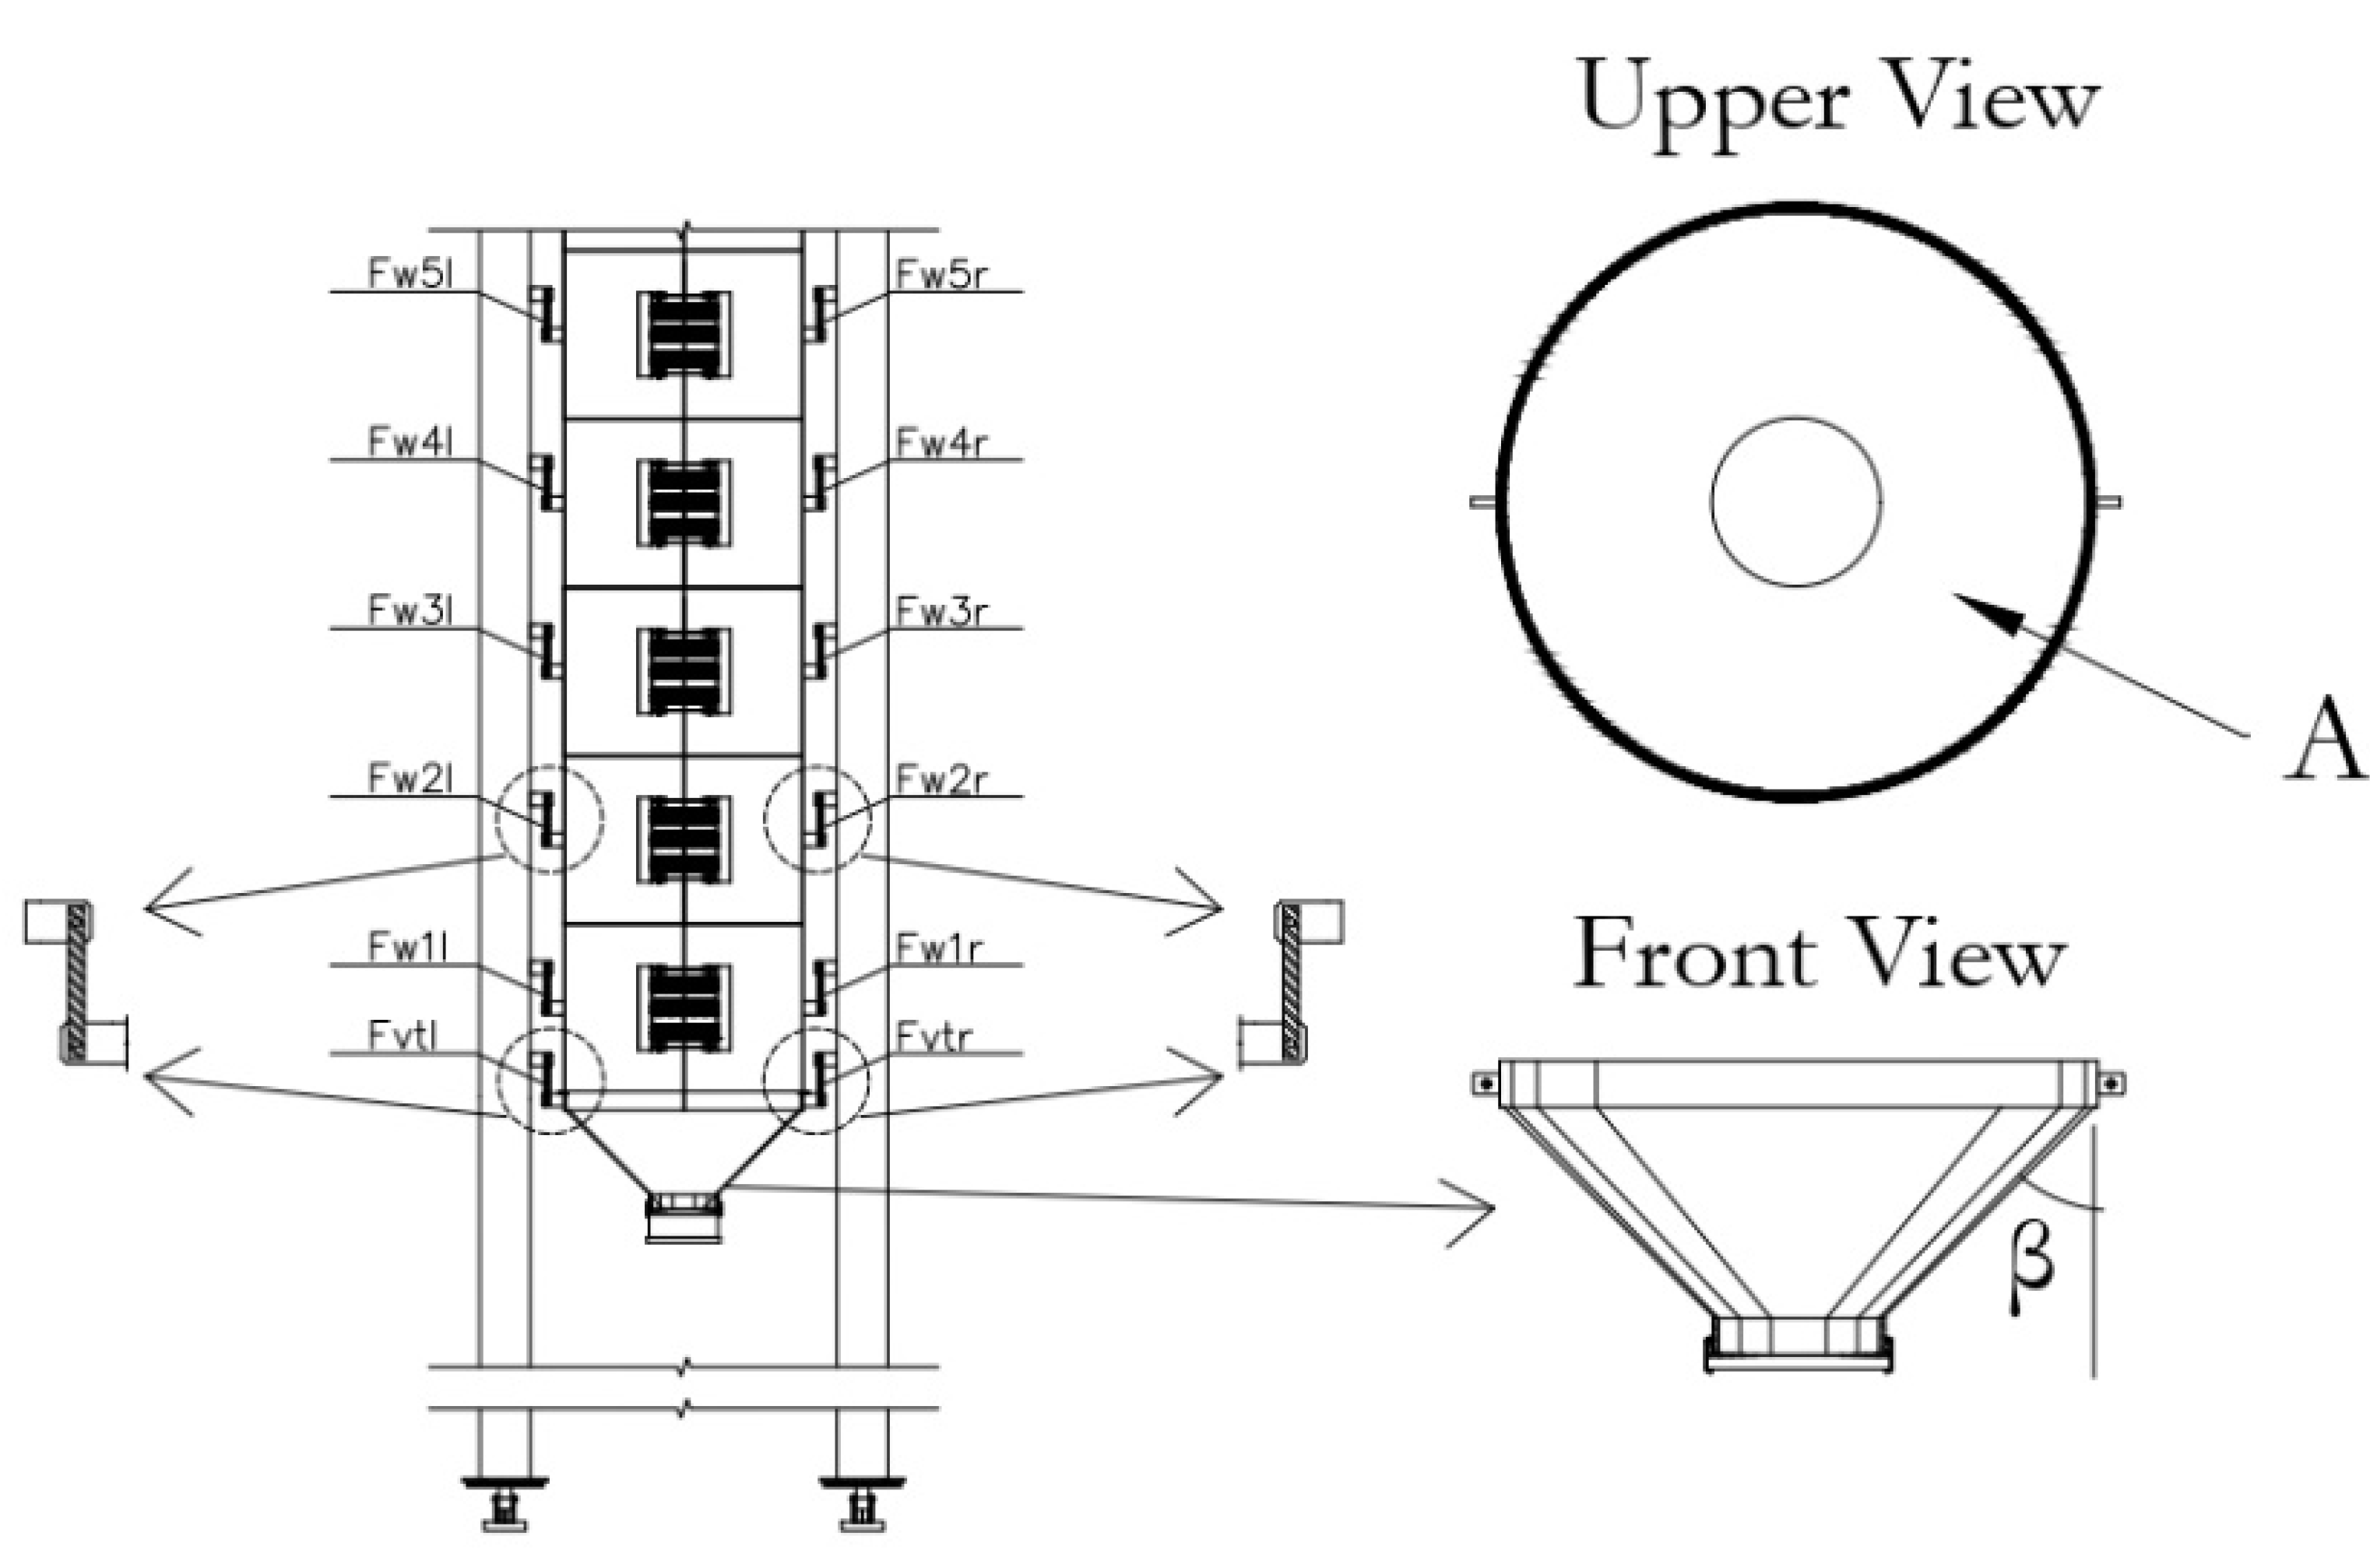
- Pvt,t: Value of the vertical stress of the stored product at the silo–hopper transition obtained from the tension load cells positioned on the hopper support, at time t, kPa;
- Fvtr,t: Value of the force obtained in the tension load cell positioned on the right-hand side of the hopper support, at time t, kN;
- Fvtl,t: Value of the force obtained in the tension load cell positioned on the left-hand side of the hopper support, at time t, kN;
- Whto: Weight of stored material between the outlet and the silo–hopper transition, zero in the case of the flat bottom, kN;
- A: Plan cross-sectional area of vertical walled segment, m2.
- Pw(1,5),t: Frictional wall stresses for the cylinder wall from the tension load cells positioned on ring supports—rings 1 to 5, time t, kPa;
- Fw(1,5)r,t: Force in tension load cell positioned on the right side of the ring support, rings 1 to 5, at time t, kN;
- Fw(1,5)l,t: Force in tension load cell positioned on the left side of the ring support, rings 1 to 5, at time t, kN;
- di: Internal cylinder diameter, m;
- hr: Ring height, m.
3. Results
4. Discussion
5. Conclusions
Author Contributions
Funding
Data Availability Statement
Acknowledgments
Conflicts of Interest
References
- CONAB—Companhia Nacional de Abastecimento. Acompanhamento da Safra Brasileira de Grãos, Brasilia, 2022. Available online: https://www.conab.gov.br/component/k2/item/download/40788_0ee9dd05157257045355d00863c854b0 (accessed on 2 January 2022).
- Ministério da Agricultura Pesca y Alimentación. Avances de Superficies y Producciones Agrícolas. Diciembre 2020. Available online: https://www.mapa.gob.es/es/estadistica/temas/estadisticas-agrarias/cuaderno_diciembre2020_tcm30-558173.pdf (accessed on 2 January 2022).
- Ayuga, F. Some unresolved problems in the design of steel cylindrical silos. In Structures and Granular Solids from Scientific Principles to Engineering Applicationsl; Chen, J.G., Teng, J.F., Eds.; CRC Press-Taylor & Francis Group: Boca Raton, FL, USA, 2008; pp. 123–133. [Google Scholar]
- Dogangun, A.; Karaca, Z.; Durmus, A.; Sezen, H. Cause of damage and failures in silo structures. J. Perform. Constr. Facil. 2009, 23, 65–71. [Google Scholar] [CrossRef]
- Nielsen, J. From silo phenomena to load models. In Structures and Granular Solids from Scientific Principles to Engineering Applications; Chen, J.F., Teng, J.G., Eds.; CRC Press-Taylor & Francis Group: Boca Raton, FL, USA, 2008; pp. 49–57. [Google Scholar] [CrossRef]
- Teng, J.G. Collapse strength of complex metal shell intersections by the effective area method. J. Press. Vessel Technol. Trans. ASME 1998, 120, 217–222. [Google Scholar] [CrossRef]
- Chen, J.F.; Rotter, J.M.; Ooi, J.Y.; Zhong, Z. Correlation between the flow pattern and wall pressures in a full scale experimental silo. Eng. Struct. 2007, 29, 2308–2320. [Google Scholar] [CrossRef]
- Morán, J.M.; Juan, A.; Robles, R.; Aguado, P.J. Effects of Environmental Temperature Changes on Steel Silos. Biosyst. Eng. 2006, 94, 229–238. [Google Scholar] [CrossRef]
- Benink, E.J. Flow and Stress Analysis of Cohesionless Bulk Materials in Silos Related to Codes; University of Twente: Enschede, The Netherlands, 1989. [Google Scholar]
- Jenike, A. Storage and Flow of Bulk Solids Bull. 123; University of Utah: Salt Lake, UK, USA, 1964. [Google Scholar]
- CEN, EN 1991-4:2006; Eurocode 1: Actions on Structures. Part 4: Silos and Tanks. AENOR: Brussels, Belgium, 2006.
- ISO 11697:2012; Bases for Design of Strutures—Loads Due to Bulk Materials. Internacional Organization for Standardization: Geneva, Switzerland, 2012.
- Nielsen, J. Pressures from flowing granular solids in silos. Philos. Trans. R. Soc. A Math. Phys. Eng. Sci. 1998, 356, 2667–2684. [Google Scholar] [CrossRef]
- Couto, A.; Ruiz, A.; Aguado, P.J. Experimental study of the pressures exerted by wheat stored in slender cylindrical silos, varying the flow rate of material during discharge. Comparison with Eurocode 1 part 4. Powder Technol. 2013, 237, 450–467. [Google Scholar] [CrossRef]
- Sadowski, A.J.; Rotter, J.M. Structural Behavior of Thin-Walled Metal Silos Subject to Different Flow Channel Sizes under Eccentric Discharge Pressures. J. Struct. Eng. 2012, 138, 922–931. [Google Scholar] [CrossRef] [Green Version]
- Gandia, R.M.; Gomes, F.C.; de Paula, W.C.; Aguado, P.J.R. Influence of specific weight and wall friction coefficient on normal pressures in silos using the Finite Element Method. Rev. Eng. Na Agric. Reveng. 2021, 29, 192–203. [Google Scholar] [CrossRef]
- Gandia, R.M.; Gomes, F.C.; de Paula, W.C.; Rodriguez, P.J.A. Evaluation of pressures in slender silos varying hopper angle and silo slenderness. Powder Technol. 2021, 394, 478–495. [Google Scholar] [CrossRef]
- Ding, S.; Li, H.; Ooi, J.Y.; Rotter, J.M. Prediction of flow patterns during silo discharges using a finite element approach and its preliminary experimental verification. Particuology 2015, 18, 42–49. [Google Scholar] [CrossRef]
- Chen, Y.; Liang, C.; Wang, X.; Guo, X.; Chen, X.; Liu, D. Static pressure distribution characteristics of powders stored in silos. Chem. Eng. Res. Des. 2020, 154, 1–10. [Google Scholar] [CrossRef]
- Méndez, D.; Hidalgo, R.C.; Maza, D. The role of the hopper angle in silos: Experimental and CFD analysis. Granul. Matter. 2021, 23, 1–13. [Google Scholar] [CrossRef]
- Darias, J.R.; Gella, D.; Fernández, M.E.; Zuriguel, I.; Maza, D. The hopper angle role on the velocity and solid-fraction profiles at the outlet of silos. Powder Technol. 2020, 366, 488–496. [Google Scholar] [CrossRef]
- Mehdizad, M.; Fullard, L.; Galvosas, P.; Holland, D. Quantitative measurements of flow dynamics in 3D hoppers using MRI. Powder Technol. 2021, 392, 69–80. [Google Scholar] [CrossRef]
- Olivares, M.C.V.; Benito, J.G.; Uñac, R.O.; Vidales, A.M. Towards a one parameter equation for a silo discharging model with inclined outlets. Powder Technol. 2018, 336, 265–272. [Google Scholar] [CrossRef] [Green Version]
- Ayuga, F.; Aguado, P.; Gallego, E.; Ramirez, A. Experimental tests to validate numerical models in silos design. ASABE Annu. Int. Meet. 2006, 1–15. [Google Scholar] [CrossRef]
- Gallego, E.; Rombach, G.A.; Neumann, F.; Ayuga, F. Simulations of Granular Flow in Silos with Different Finite Element Programs: Ansys vs. silo. Trans. ASABE 2010, 53, 819–829. [Google Scholar] [CrossRef]
- Gallego, E.; Ruiz, A.; Aguado, P.J. Simulation of silo filling and discharge using ANSYS and comparison with experimental data. Comput. Electron. Agric. 2015, 118, 281–289. [Google Scholar] [CrossRef]
- Pieper, K.; Schütz, M. Bericht Über das Forschungsvorhaben—Norm-Mess-Silo Für Schüttguteigenschaften; Technische Universität Braunschweig: Braunschweig, Germany, 1980. [Google Scholar]
- Gandia, R.M.; Júnior, E.A.D.O.; Gomes, F.C.; de Paula, W.C.; Dornelas, K.C. Experimental Pressures Exerted by Maize in Slender Cylindrical Silo: Comparison with Iso 11697. Eng. Agric. 2021, 41, 576–590. [Google Scholar] [CrossRef]
- Gandia, R.M.; Gomes, F.C.; de Paula, W.C.; Junior, E.A.d.; Rodriguez, P.J.A. Static and dynamic pressure measurements of maize grain in silos under different conditions. Biosyst. Eng. 2021, 209, 180–199. [Google Scholar] [CrossRef]
- DIN. DIN 1055-6: Basis of Design and Actions on Structures—Part 6: Design 623 Loads for Buildings and Loads in Silo Bins; Verlaz: Berlin, Germany, 2005. [Google Scholar]
- WPMPS. Standart Shear Testing Technique for Particulate Solids Using the Jenike Shear Cell; IChemE: Warwickshire, UK, 1989. [Google Scholar]
- Couto, A.; Ruiz, A.; Herráez, L.; Moran, J.; Aguado, P.J. Measuring pressures in a slender cylindrical silo for storing maize. Filling, static state and discharge with different material flow rates and comparison with Eurocode 1 part 4. Comput. Electron. Agric. 2013, 96, 40–56. [Google Scholar] [CrossRef]


| Properties | Lower Limit | Upper Limit |
|---|---|---|
| specific weight (kN/m3) | 7.52 | 7.83 |
| angle of repose | 31.3° | 37.1° |
| cohesion (kPa) | 0.241 | 1.084 |
| steel wall friction angle | 7.37° | 9.02° |
| steel wall friction coefficient | 0.13 | 0.16 |
| internal friction angle | 19° | 29° |
| humidity | 10.62% | |
| After Filling Pressure (kPa) | ||||||||||
|---|---|---|---|---|---|---|---|---|---|---|
| Cell | FlatB | β60° | β45° | β30° | β15° | |||||
| σ | σ | σ | σ | σ | ||||||
| Pvt | 10.77 | 0.43 | 9.87 | 1.94 | 9.38 | 0.47 | 11.53 | 0.76 | 9.91 | 0.79 |
| Discharge pressure (kPa) | ||||||||||
| Cell | FlatB | β60° | β45° | β30° | β15° | |||||
| σ | σ | σ | σ | σ | ||||||
| Pvt | 10.56 | 0.48 | 7.43 | 0.70 | 8.32 | 0.33 | 10.88 | 0.71 | 8.21 | 1.34 |
| Test | (kN) | σ (kN) |
|---|---|---|
| FlatB | 7.49 | 0.53 |
| β60° | 7.86 | 0.45 |
| β45° | 8.46 | 0.15 |
| β30° | 8.38 | 0.81 |
| β15° | 9.26 | 0.19 |
| Test | Pvt (kPa) | |||
|---|---|---|---|---|
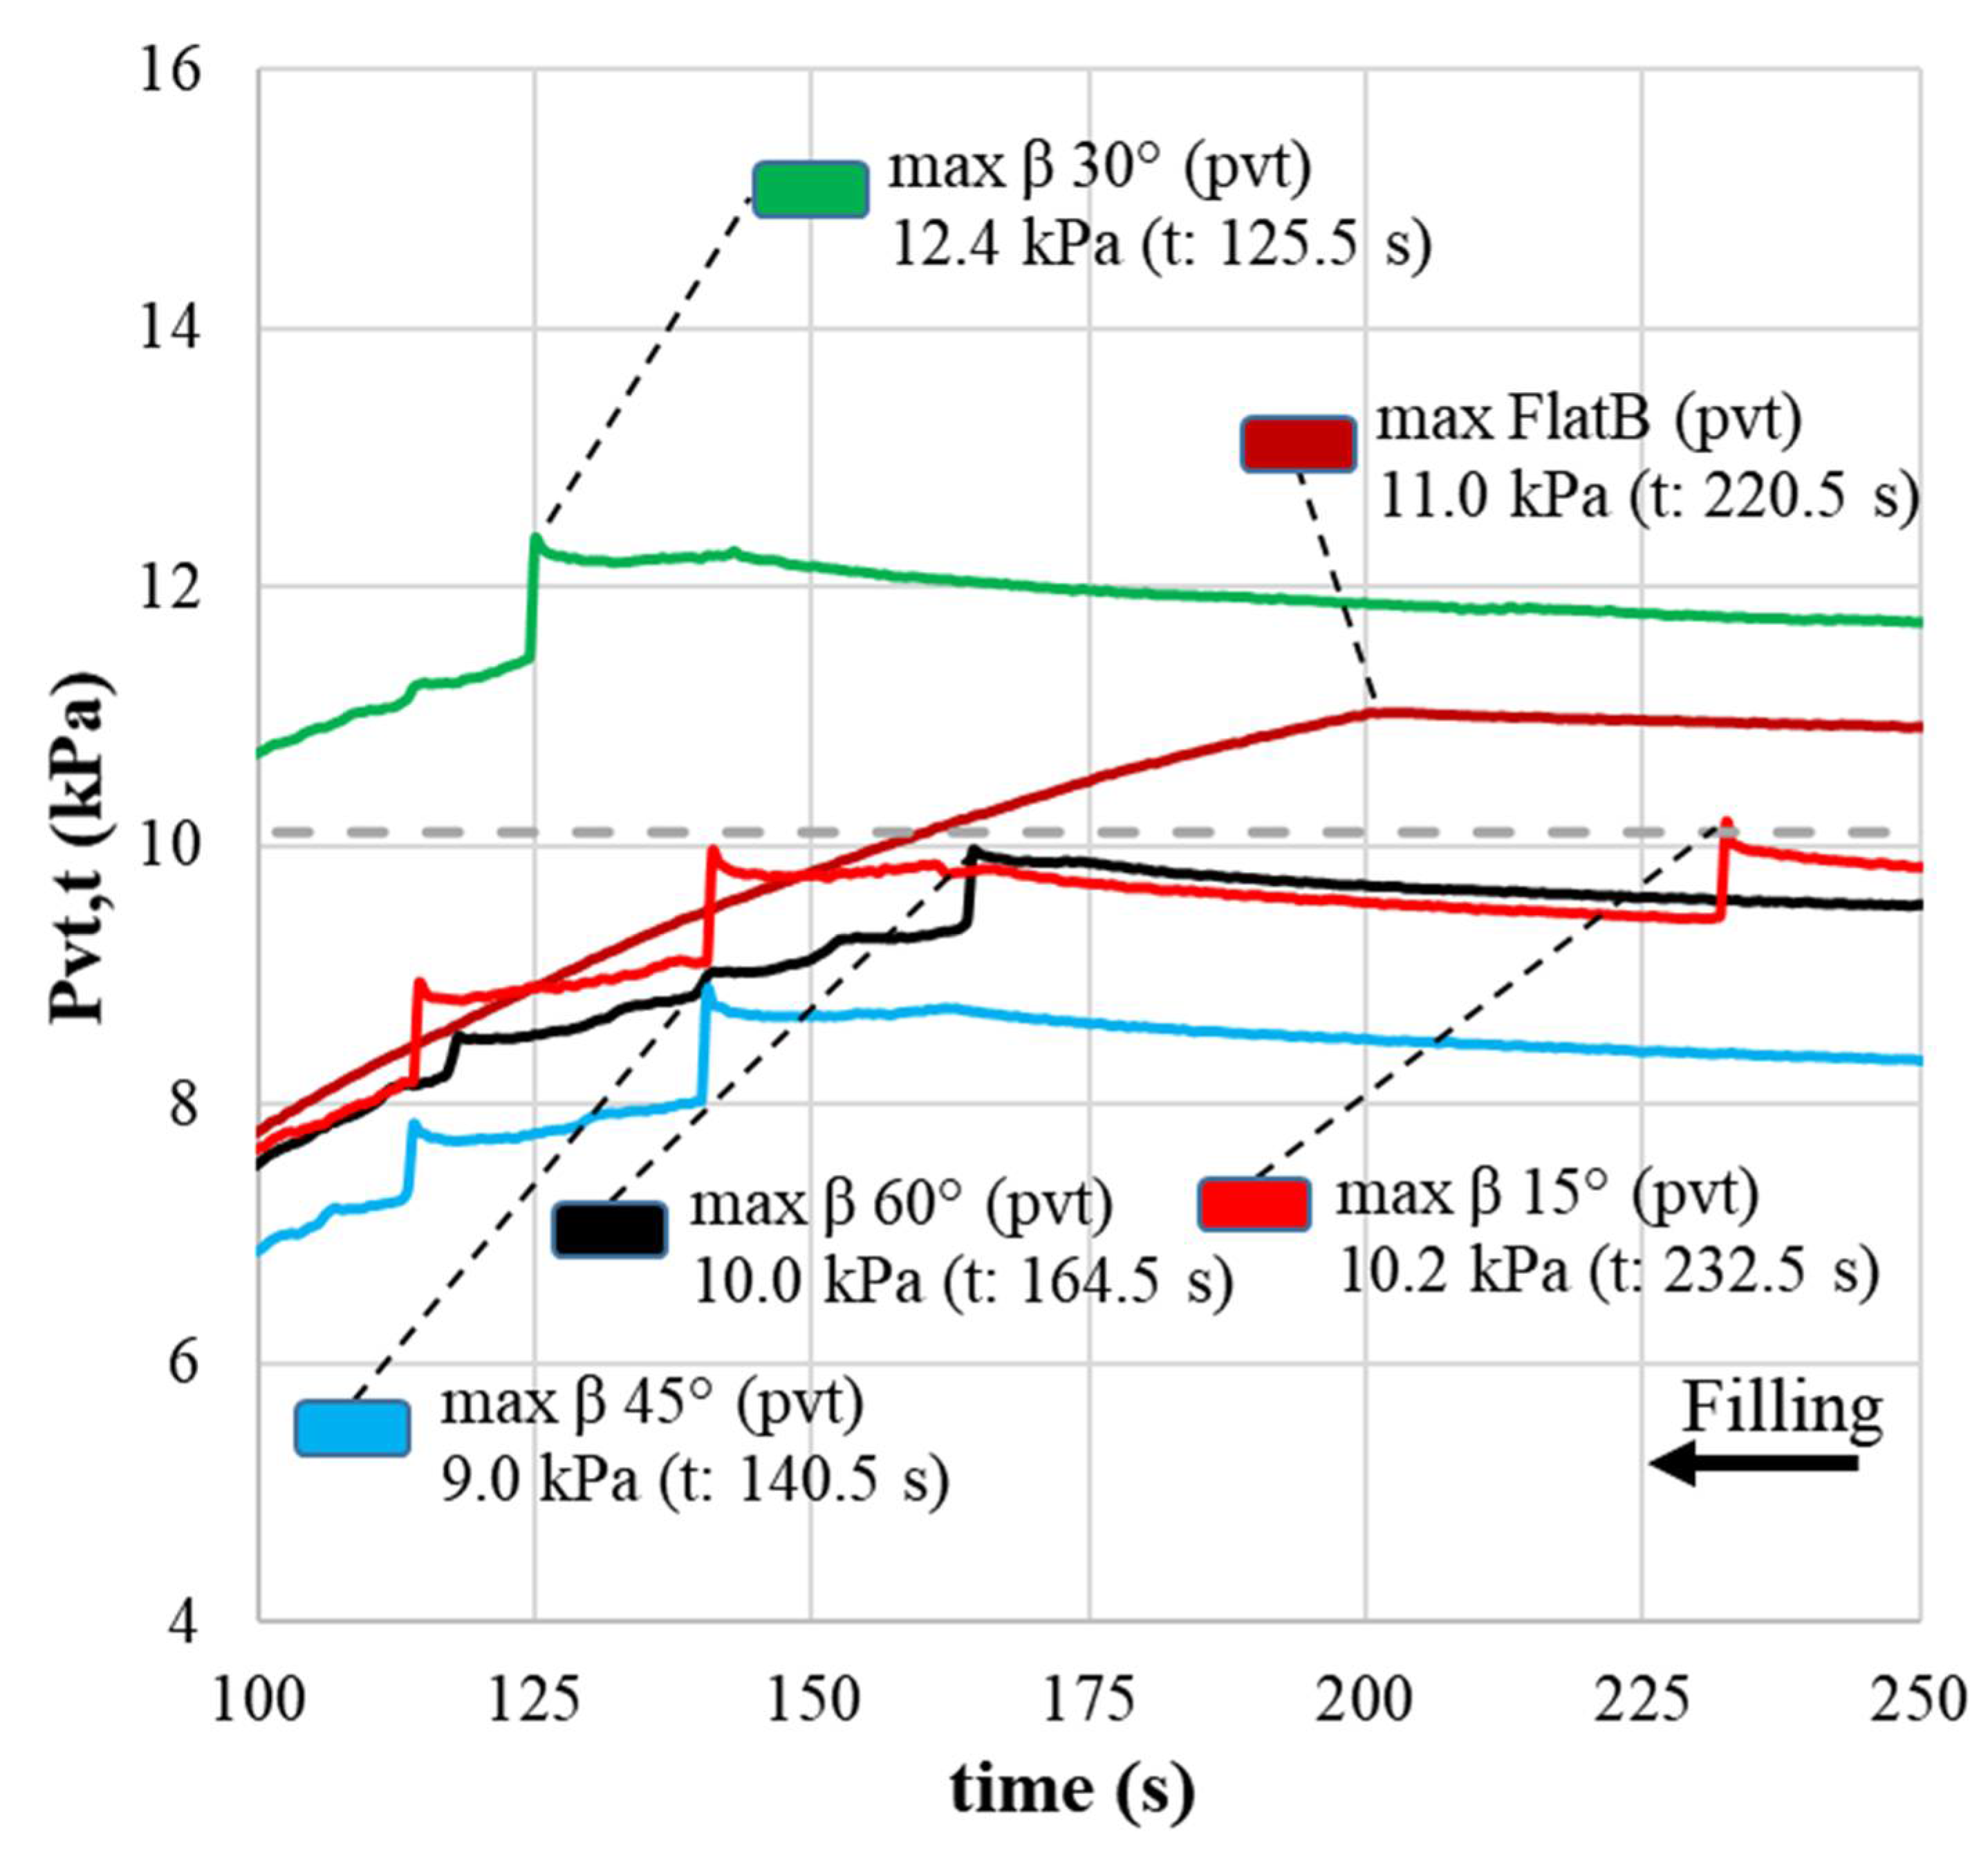
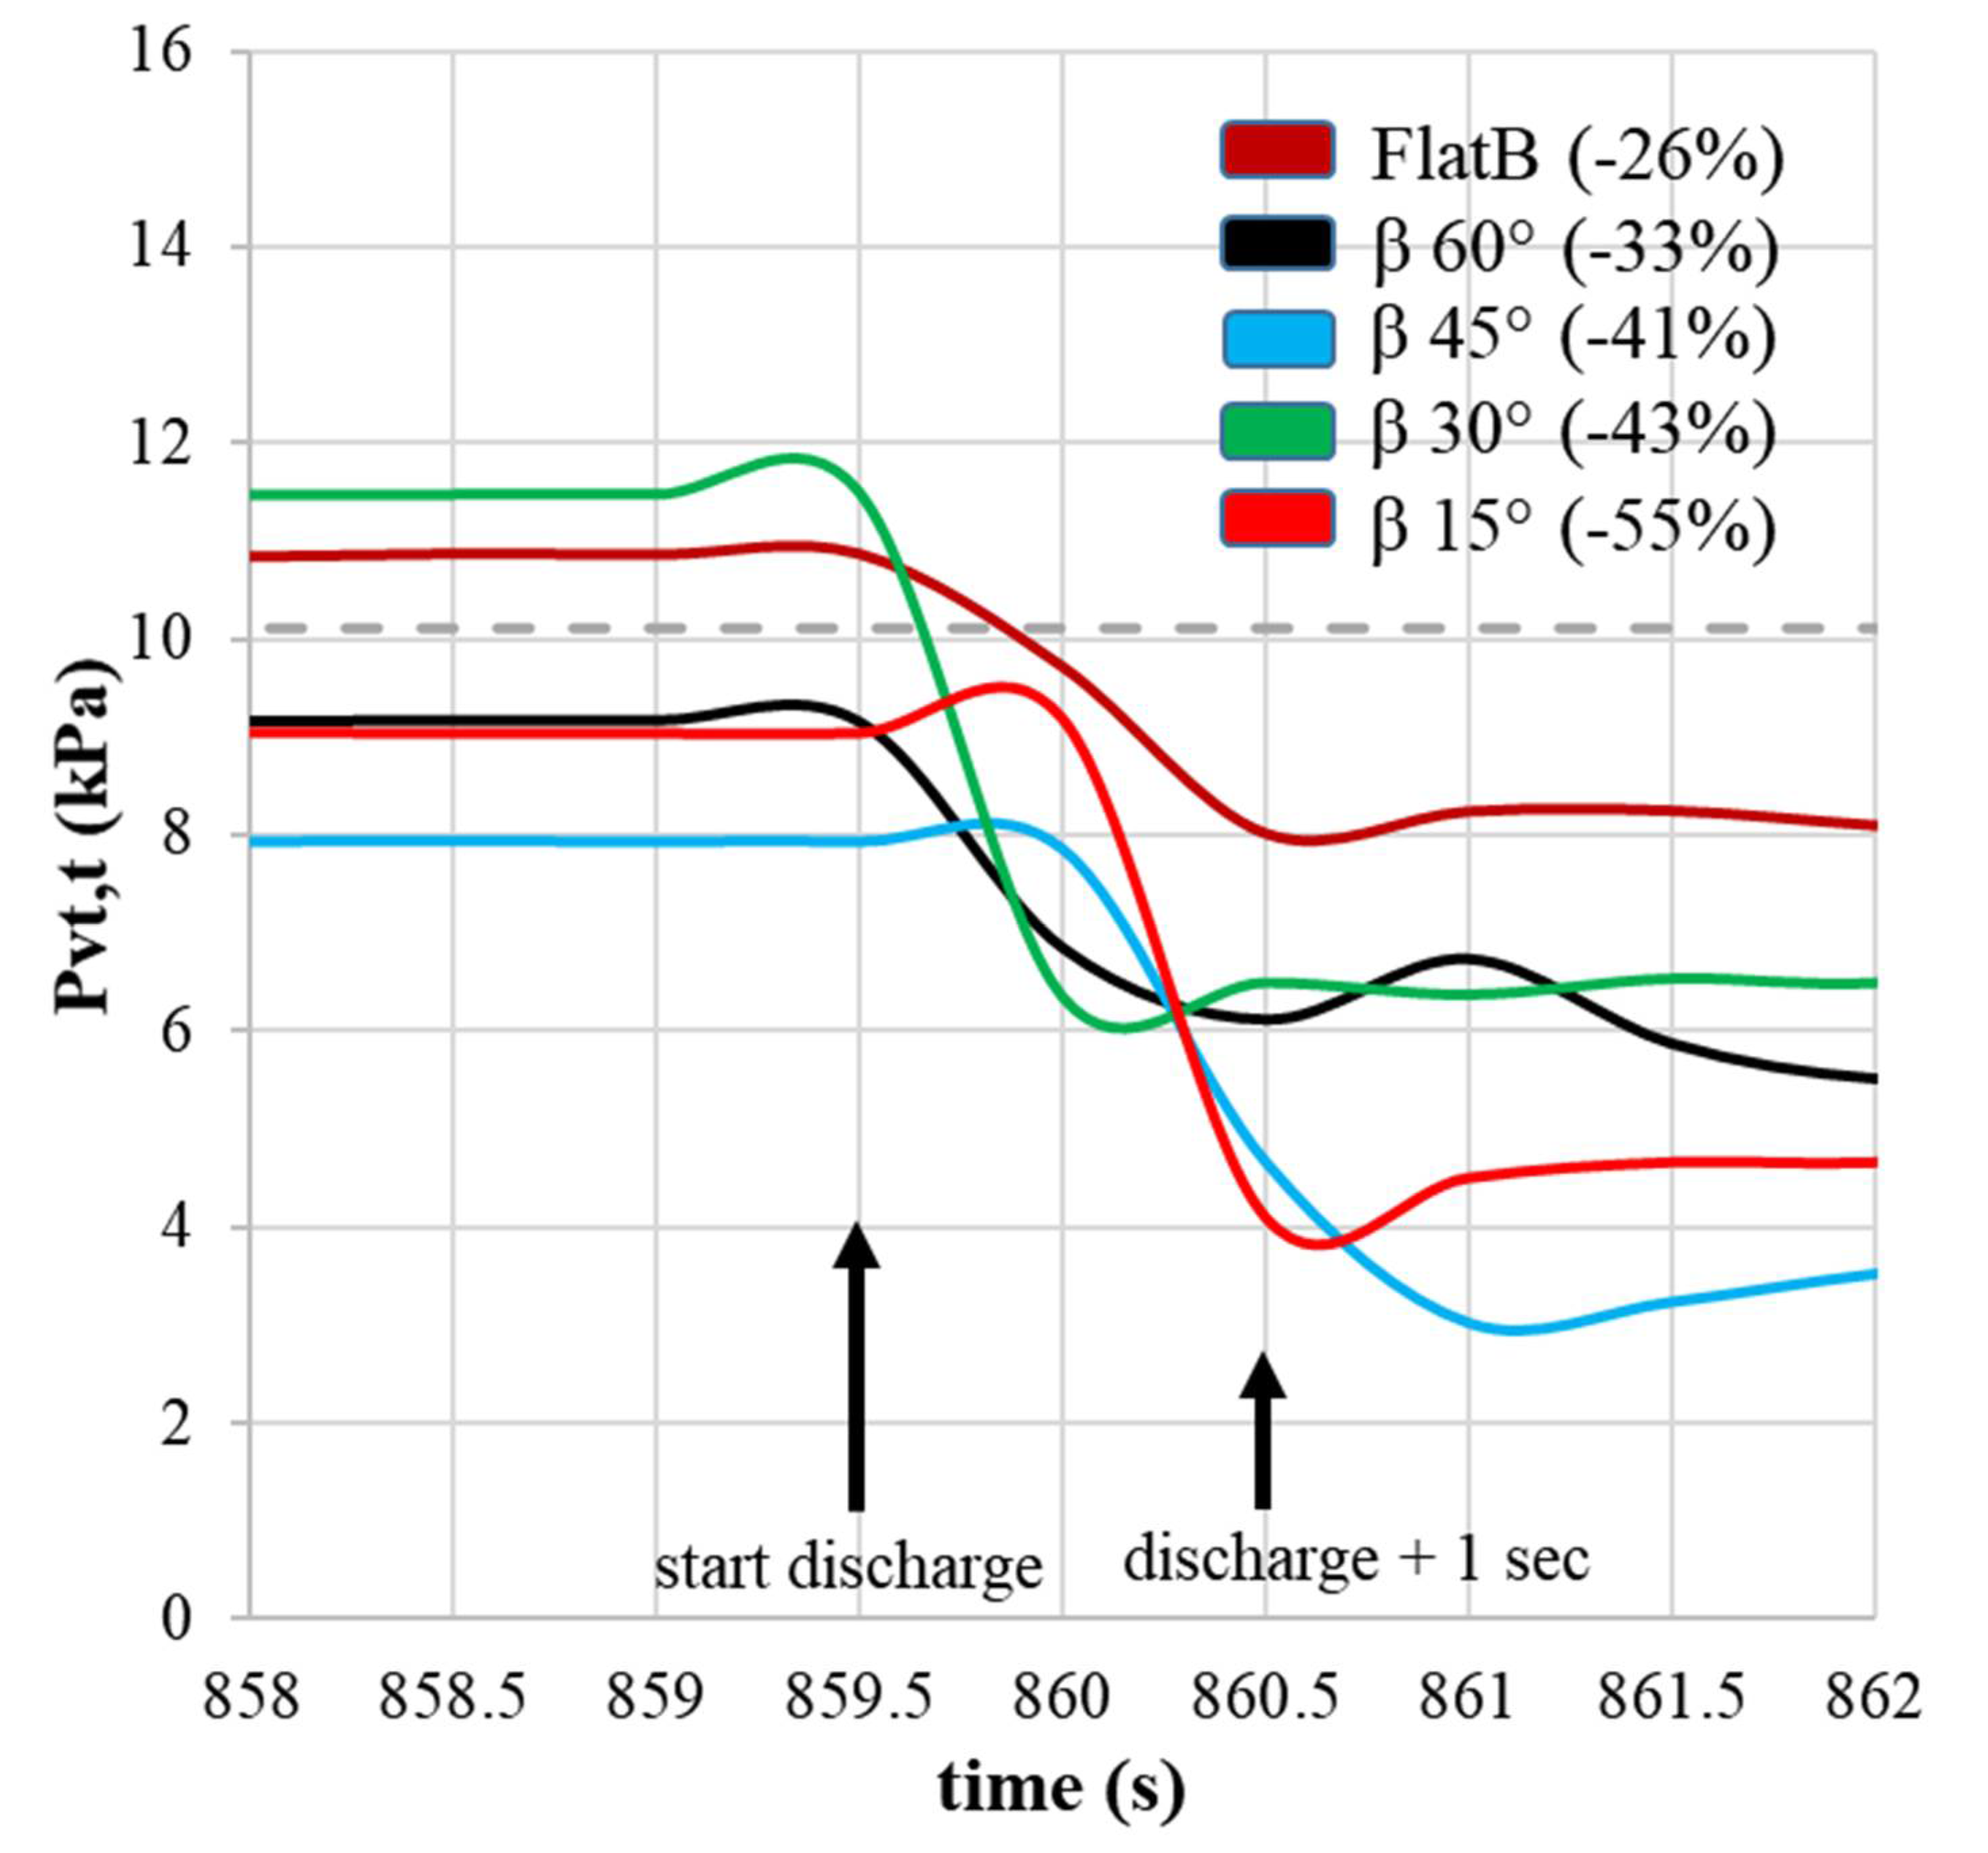
| Max (Filling) | 859.5 s | 860.5 s | ∆ Pvt (859.5–860.5 s) | |
| FlatB | 11.04 | 10.87 | 8.02 | 2.85 |
| β 60° | 9.97 | 9.15 | 6.12 | 3.04 |
| β 45° | 8.90 | 7.93 | 4.67 | 3.27 |
| β 30° | 12.38 | 11.49 | 6.49 | 5.00 |
| β 15° | 10.18 | 9.04 | 4.10 | 4.94 |
Publisher’s Note: MDPI stays neutral with regard to jurisdictional claims in published maps and institutional affiliations. |
© 2022 by the authors. Licensee MDPI, Basel, Switzerland. This article is an open access article distributed under the terms and conditions of the Creative Commons Attribution (CC BY) license (https://creativecommons.org/licenses/by/4.0/).
Share and Cite
Gandia, R.M.; de Paula, W.C.; de Oliveira Junior, E.A.; Rodrigo, G.H.; Padín, Á.R.; Vegas, A.T.; Gomes, F.C.; Rodríguez, P.J.A. Effect of the Hopper Angle of a Silo on the Vertical Stress at the Cylinder-to-Hopper Transition. Agronomy 2022, 12, 830. https://doi.org/10.3390/agronomy12040830
Gandia RM, de Paula WC, de Oliveira Junior EA, Rodrigo GH, Padín ÁR, Vegas AT, Gomes FC, Rodríguez PJA. Effect of the Hopper Angle of a Silo on the Vertical Stress at the Cylinder-to-Hopper Transition. Agronomy. 2022; 12(4):830. https://doi.org/10.3390/agronomy12040830
Chicago/Turabian StyleGandia, Rômulo Marçal, Wisner Coimbra de Paula, Estácio Antunes de Oliveira Junior, Gerardo Hernández Rodrigo, Ángel Ruiz Padín, Alberto Tascón Vegas, Francisco Carlos Gomes, and Pedro José Aguado Rodríguez. 2022. "Effect of the Hopper Angle of a Silo on the Vertical Stress at the Cylinder-to-Hopper Transition" Agronomy 12, no. 4: 830. https://doi.org/10.3390/agronomy12040830
APA StyleGandia, R. M., de Paula, W. C., de Oliveira Junior, E. A., Rodrigo, G. H., Padín, Á. R., Vegas, A. T., Gomes, F. C., & Rodríguez, P. J. A. (2022). Effect of the Hopper Angle of a Silo on the Vertical Stress at the Cylinder-to-Hopper Transition. Agronomy, 12(4), 830. https://doi.org/10.3390/agronomy12040830