Article

Effects of Cultivar, Nitrogen Rate and Biostimulant Application on the Chemical Composition of Perennial Ryegrass (Lolium perenne L.) Biomass

by
Marzenna Olszewska
Department of Agrotechnology and Agribusiness, University of Warmia and Mazury in Olsztyn, 10–719 Olsztyn, Poland
Agronomy 2022, 12(4), 826; https://doi.org/10.3390/agronomy12040826
Submission received: 26 February 2022 / Revised: 22 March 2022 / Accepted: 25 March 2022 / Published: 28 March 2022
(This article belongs to the Section Grassland and Pasture Science)

Abstract

:
The aim of this study was to determine the effects of cultivar, nitrogen (N) rate, and biostimulant application on the chemical composition of the aboveground biomass of perennial ryegrass (Lolium perenne L.). A small-area field experiment was established in the Agricultural Experiment Station in Tomaszkowo (53°42′40.8″ N 20°26′04.7″ E, north-eastern Poland). The experiment had a split-plot design with three replications, and the experimental variables were as follows: (i) perennial ryegrass cultivar: Bajka and Baronka, (ii) N fertilizer rate: 0, 120, 240 kg N ha−1, (iii) application of biostimulants: Blatt Boden-Foliar (BB-F) and Blatt Boden-Foliar + Blatt Boden-Multical (BB-F + BB-M). This study demonstrated that the tetraploid cultivar Baronka had a more desirable chemical composition than the diploid cultivar Bajka. The biomass of cv. Baronka had a higher content of CP, CF, and K, and it was characterized by higher leaf greenness (SPAD) values. Nitrogen fertilization considerably increased the content of CP, P, and K, and leaf greenness (SPAD) values in both cultivars, and the noted increase was higher when N was applied at 240 kg ha−1. The N fertilizer rate of 120 kg ha−1 led to a significant decrease in the average Ca content of plants, whereas the N fertilizer rate of 240 kg ha−1 had no significant effect on Ca concentration. The tested biostimulants significantly affected the chemical composition of perennial ryegrass biomass, and their influence was greater when they were applied in combination. The foliar application of Blatt Boden-Foliar and Blatt Boden-Multical increased the content of CP, P, and chlorophyll in perennial ryegrass leaves, whereas it decreased the accumulation of CF, K, and Ca in plants. The analyzed biostimulants had a positive effect on the chemical composition of perennial ryegrass biomass. This is an important practical consideration because high-quality green fodder for livestock can be produced while minimizing the use of mineral fertilizers and adverse environmental impacts.

1. Introduction

Grasses are a rich source of nutrients for ruminants, and they make up a large proportion of their diets around the year [1,2]. The nutrient content of grasses is affected by numerous factors such as species, cultivar, climatic conditions, the season of the year, harvest date, fertilization, and, in particular, the application of nitrogen (N) [3,4,5]. Perennial ryegrass (Lolium perenne L.) is the most popular forage grass in the temperate climate [1,6,7]. This species has the potential to produce high-quality feed for livestock while maintaining high growth rates and persistence under continuous grazing [8]. Diploid cultivars are more persistent than tetraploid cultivars because the former are more tolerant of grazing and frequent mowing. In turn, tetraploid cultivars are characterized by superior tillering potential and a faster rate of regrowth after defoliation [9]. However, perennial ryegrass requires adequate fertilization to maximize its productivity and nutritional value [10].
In view of environmental concerns, efforts are being made to reduce the use of mineral fertilizers in agriculture without compromising forage quality [11], also with the help of specific studies aimed at preserving the biodiversity of these sensitive agroecosystems, rich in exclusive weed plants [12], including many crop wild relatives (CWRs) which are useful for maintaining the high quality of forage due to the possible crossing between cultivated and wild species [13].
According to the literature, biostimulants can play an important role in this process [14,15,16,17,18,19,20]. Du Jardin [21] defined a plant biostimulant as any substance or microorganism applied to plants, seeds, or in the rhizosphere with the aim to stimulate natural processes in plants, enhance nutrition efficiency and/or abiotic stress tolerance, regardless of its nutrient content, or a mixture of such substances and/or microorganisms. Agricultural biostimulants are a group of compounds, substances (trace elements, enzymes, plant growth regulators, macroalgal extracts), and microorganisms applied to plants or soil in order to regulate and enhance physiological processes in crops, thus making them more efficient [20,22]. By affecting biochemical, morphological, and physiological processes, biostimulants improve nutrient use efficiency in plants [23]. A beneficial influence of biostimulants on root system development, water retention capacity, chlorophyll content, and photosynthetic rate, contributing to increased nutrient uptake by crops, has been reported by Murawska et al. [18], Sharma et al. [20], Kleiber and Markiewicz [24], and Matysiak et al. [25]. The application of products that promote plant growth and development makes it possible to minimize the use of mineral fertilizers, in particular N rates [18]. Godlewska and Ciepiela [14,15,16,17] and Sosnowski et al. [19] observed a positive influence of biostimulants on the feed value of forage grasses. Similar results were reported by Murawska et al. [18], Kleiber and Markiewicz [24], Matysiak et al. [25], Sivasankari et al. [26], and Karr-Lilienthal et al. [27], who analyzed various crop species.
The biostimulants used in the present experiment are biological, environmentally-friendly formulations that support plant growth and development [28,29,30]. Blatt Boden-Foliar is a microbial solution that consists mainly of lactic acid bacteria: Lactobacillus casei (5 × 10⁹ cfu mL−1), Lactobacillus plantarum (5 × 10⁹ cfu mL−1); photosynthetic bacteria: Rhodopseudo-monas palustris (5 × 10⁹ cfu mL−1) and yeasts: Saccharomyces cerevisiae (5 × 10³ cfu mL−1), as well as sugarcane molasses. It contains no genetically modified microorganisms. Blatt Boden-Multical is a powder made of finely ground calcium carbonate. Its main ingredients are calcium and magnesium. Blatt Boden-Multical optimizes nutrient absorption, promotes rapid plant growth, and abundant flowering. It contains no genetically modified microorganisms. According to the supplier’s recommendations Agrosystemy Ltd. (Puławy, Poland [28], Blatt Boden-Multical and Blatt Boden-Foliar should always be applied in combination to improve plant growth and increase plant resistance. The solution also improves photosynthetic efficiency. Calcium carbonate regulates water balance, and effective microorganisms enhance plant tolerance to biotic and abiotic stresses.
Novel biostimulants promoting the growth and development of plants and affecting their chemical composition have been recently placed on the market. However, the efficacy of biostimulants in grass cultivation has not been thoroughly investigated to date. Therefore, the aim of this study was to determine the effects of cultivar, N rate, and biostimulant application on the chemical composition of the aboveground biomass of perennial ryegrass.

2. Materials and Methods

2.1. Field Experiment

A field experiment was conducted in 2016–2017 in the Agricultural Experiment Station in Tomaszkowo (53°42′40.8″ N 20°26″04.7″ E, north-eastern Poland), owned by the University of Warmia and Mazury in Olsztyn. The experiment had a split-plot design with three replications, and the experimental variables were as follows: (i) perennial ryegrass cultivar: Bajka and Baronka, (ii) N fertilizer rate: 0, 120, 240 kg N ha−1, (iii) application of biostimulants: Blatt Boden-Foliar (BB-F) and Blatt Boden-Foliar + Blatt Boden-Multical (BB-F + BB-M). Seeding rates were 27 kg ha−1 (cv. Bajka) and 38 kg ha−1 (cv. Baronka), and harvested plot size was 10 m2. The experiment was established on Haplic Cambisol (Eutric) originating from boulder clay (IUSS Working Group WRB, 2015). Composite soil samples were collected from each plot to a depth of 20 cm to determine the chemical properties of soil. The organic matter content of soil was 26.2 g kg−1. The soil had a neutral pH of 6.6, and it was characterized by a moderate content of available phosphorus (50.6 mg P kg−1) and potassium (120.4 mg K kg−1), and low magnesium content (46.0 mg Mg kg−1). The total N content of soil was 0.93 g kg−1. The soil was moderately abundant in micronutrients (148.0 mg Mn kg−1, 3.0 mg Cu kg−1, 7.8 mg Zn kg−1, and 1400.0 mg Fe kg−1). Soil organic matter content was determined with the use of the Vario Max Cube CN elemental analyzer (Elementar Analysensysteme GmbH, Langenselbold, Germany). The total N content of soil was determined by the Kjeldahl method (Kjeltec 2300, Tecator, Sweden). Soil pH was measured using a digital pH meter with temperature compensation (20 °C), in deionized water and 1 mol dm−3 KCl, at a 5:1 ratio. Plant-available P and K were measured by the Egner–Riehm method. Phosphorus was determined by the colorimetric method (UV-1201V spectrophotometer, Shimadzu Corporation, Kyoto, Japan), and K was determined by atomic emission spectrometry (AES) (BWB Technologies UK Ltd., Flame Photometers, Newbury, UK). Magnesium was determined by atomic absorption spectrophotometry (AAS) (AAS1N, Carl Zeiss, Jena, Germany). Micronutrients (Cu, Zn, Mn, and Fe) were determined by AAS (AA-6800, Shimadzu Corporation, Kyoto, Japan). Before the establishment of the experiment, P fertilizer was applied at 35 kg ha−1 (enriched superphosphate, 40% P2O5), and K fertilizer was applied at 50 kg ha−1 (potassium salt, 60% K2O). In the years of full utilization, the treatments were fertilized with 35 kg P∙ha−1 (enriched superphosphate, 40% P2O5) and 100 kg K∙ha−1 (potassium salt, 60% K2O). Phosphorus was applied at a single rate in early spring (at the beginning of the growing season), and the rate of K fertilizer was split into two equal doses and applied in spring (at the beginning of the growing season) and after the 1st harvest. Nitrogen (ammonium nitrate, 34% N) was applied in spring (before the growing season) and after the 1st and 2nd harvest; the rate of N fertilizer was split into three equal doses. The tested biostimulants were applied as foliar spray, in the doses recommended by the supplier (Agrosystemy Ltd.) [28], i.e., at 3 dm3 ha−1 (BB-F) and 3 kg ha−1 (BB-M), diluted in 300 L of water. Two treatments were performed in each regrowth (a total of six treatments during the growing season). The first treatment was carried out at a plant height of 10–12 cm, and the subsequent treatments were performed at two-week intervals.
In order to determine the variability of weather conditions during the growing seasons, the Selyaninov hydrothermal coefficient was calculated using Equation (1) [31]:
k = P 0.1 t
where:
  • k—Selyaninov hydrothermal coefficient
  • P—total monthly precipitation,
  • ∑t—mean monthly temperature (sum of mean daily temperatures) >0.
Hydrothermal conditions were evaluated based on the classification of index k values, proposed by Skowera and Puła [25]: extremely dry (ed) k ≤ 0.4, very dry (vd) 0.4 < k ≤ 0.7, dry (d) 0.7 < k ≤ 1.0, fairly dry (fd) 1.0 < k ≤ 1.3, optimal (o) 1.3 < k ≤ 1.6, fairly wet (fw) 1.6 < k ≤ 2.0, wet (w) 2.0 < k ≤ 2.5, very wet (vw) 2.5 < k ≤ 3.0, extremely wet (ew) k > 3.0.

2.2. Plant Materials

One-kilogram biomass samples were collected after each harvest to analyze the chemical composition of plants. Dry matter (DM) content of biomass was estimated by drying a subsample of 1 kg at 105 °C in a ventilated oven (FD 53 Binder GmbH, Tuttlingen, Germany) until constant weight. The crude fiber content was determined by the method proposed by Henneberg and Stohmann [32]. After wet mineralization of plant material in sulfuric acid (H2SO4), CP and total N content were determined by the Kjeldahl method (Kjeltec 2300, Tecator, Sweden), P content was determined by colorimetry with ammonium molybdate (UV-1201V spectrophotometer, Shimadzu Corporation, Kyoto, Japan), an K and Ca content was determined by the flame photometric method (BWB Technologies UK Ltd., Flame Photometers). Leaf greenness (SPAD) was measured on the youngest fully developed leaves of five plants selected randomly in each plot, with the use of the SPAD-502 chlorophyll meter (Konica Minolta Sensing, Inc., Osaka, Japan). Two measurements were performed in each regrowth at two-week intervals.

2.3. Statistical Analysis

The results were processed statistically by repeated measures ANOVA using Statistica v. 13.3 software [33]. The grouping factors were cultivar, N rate, and biostimulant application, and harvest was the repeated measures factor. The assumption of sphericity, i.e., the condition where the variances of the differences between all pairs of repeated measures are equal, was validated by Mauchly’s test. When this condition was not met, the univariate analysis was replaced with a multivariate analysis involving Wilks’ Lambda. The significance of differences between treatment means was determined by Tukey’s test at p < 0.05. All calculations were performed using Statistica v. 13.3 software [33].

3. Results and Discussion

3.1. Weather Conditions

During the growing season of 2016, a mild water deficit was noted in April, May, June, and August (Table 1). The Selyaninov hydrothermal coefficient for these months was k = 1.3. September was very dry (k = 0.5), whereas precipitation considerably exceeded the long-term average in July (k = 2.5) and October (k = 5.54). In 2017, weather conditions were optimal only in August (k = 1.6). In the remaining months of the growing season, the distribution of rainfall was uneven. May was very dry (k = 0.7), August was fairly dry (k = 1.2), abundant precipitation was noted in July (k = 2.1), whereas April (k = 3.4), September (k = 4.44) and October (k = 4.34) were extremely wet.

3.2. Crude Protein (CP)

During the two-year study, the average CP content of perennial ryegrass biomass was 139.07 g kg−1 DM (cv. Baronka) and 137.62 g kg−1 DM (cv. Bajka). In the first year, the tetraploid cultivar Baronka accumulated significantly more CP, whereas no significant differences in CP content were found between cultivars in the second year. The CP content of perennial ryegrass biomass was considerably lower in the second year than in the first year of the study (Table 2). Chromosome doubling in tetraploid cultivars leads to numerous morphological changes in plants, including an increase in the cell interior to cell wall ratio. As a result, the content of nutrients, including protein, increases [34,35,36]. Cosgrove et al. [37] and Wims et al. [38] demonstrated that tetraploid cultivars of perennial ryegrass in the vegetative phase had higher CP content than diploid cultivars. It should be stressed, however, that the chemical composition of plants is determined by various environmental factors. Moreover, tetraploids have greater soil requirements and lower water stress tolerance [39]. Balocchi and López [40] found no significant differences in CP content between tetraploid and diploid perennial ryegrass cultivars. According to the cited authors, favorable soil and climatic conditions were conducive to CP accumulation in plants. Rodrigues et al. [41] and Solomon et al. [42] also noted similar CP concentrations in tetraploid and diploid perennial ryegrass cultivars.
In the present study, the CP content of perennial ryegrass biomass was considerably affected by N fertilization, and it increased by around 6% and 39% (DM basis) on average in response to the lower and higher N rate, respectively. This trend was observed in both years of the experiment, but a greater increase was noted in the first year. In 2016, the lower N rate (120 kg ha−1) increased the CP content of biomass by around 7% and the higher N rate (240 kg ha−1)—by around 47%. In 2017, the respective values were approximately 5% and 32% (Table 2). The present results corroborate the findings of Ihtisham et al. [43], who noted an increase in CP concentration in Lolium perenne in response to N fertilization. According to the cited authors, the increase resulted from an enhanced rate of photosynthesis and the fact that proteins associated with photosynthesis (Rubisco and chlorophyll a/b-binding proteins) accumulate to extremely high levels in plants.
In the current study, the tested biostimulants also exerted a significant effect on CP accumulation in perennial ryegrass biomass. Foliar application of BB-F increased CP content by over 3% (DM basis, mean of two years), and the combined application of BB-F and BB-M increased CP content by approximately 5%, compared with the control treatment. However, the tested biostimulants exerted different effects in the first and second years of the study. In 2016, the CP content of perennial ryegrass biomass increased by 4.1% in response to BB-F and by 7.1% in response to BB-F + BB-M. In 2017, the respective values were 2.5% and 2.7%, and the difference was not significant (Table 2). The absence of significant differences between BB-F and BB-F + BB-M treatments could result from highly variable weather conditions during the growing season of 2017. An increase in CP concentration in grasses treated with biostimulants was reported by Sosnowski et al. [19] and Godlewska and Ciepiela [17], and the best result was achieved in unfertilized plots. According to Murawska et al. [18], higher CP content in plants treated with biostimulants indicates that they may affect N uptake and metabolism.
In the current study, the amounts of CP in perennial ryegrass herbage increased significantly with successive harvests, by 35.4% (2nd harvest) and 47.5% (3rd harvest), relative to the first harvest, in the first year, and by 11.2% (2nd harvest) and 53.4% (3rd harvest) in the second year, i.e., by 23.3% and 50.4% on average, respectively (Table 2). Similar results were reported by Schlegel et al. [3] and Pirhofer-Walzl et al. [5]. An increase in CP concentration in grass biomass with successive harvests may be associated with the transition from generative to vegetative growth [3] and foliage development [17].
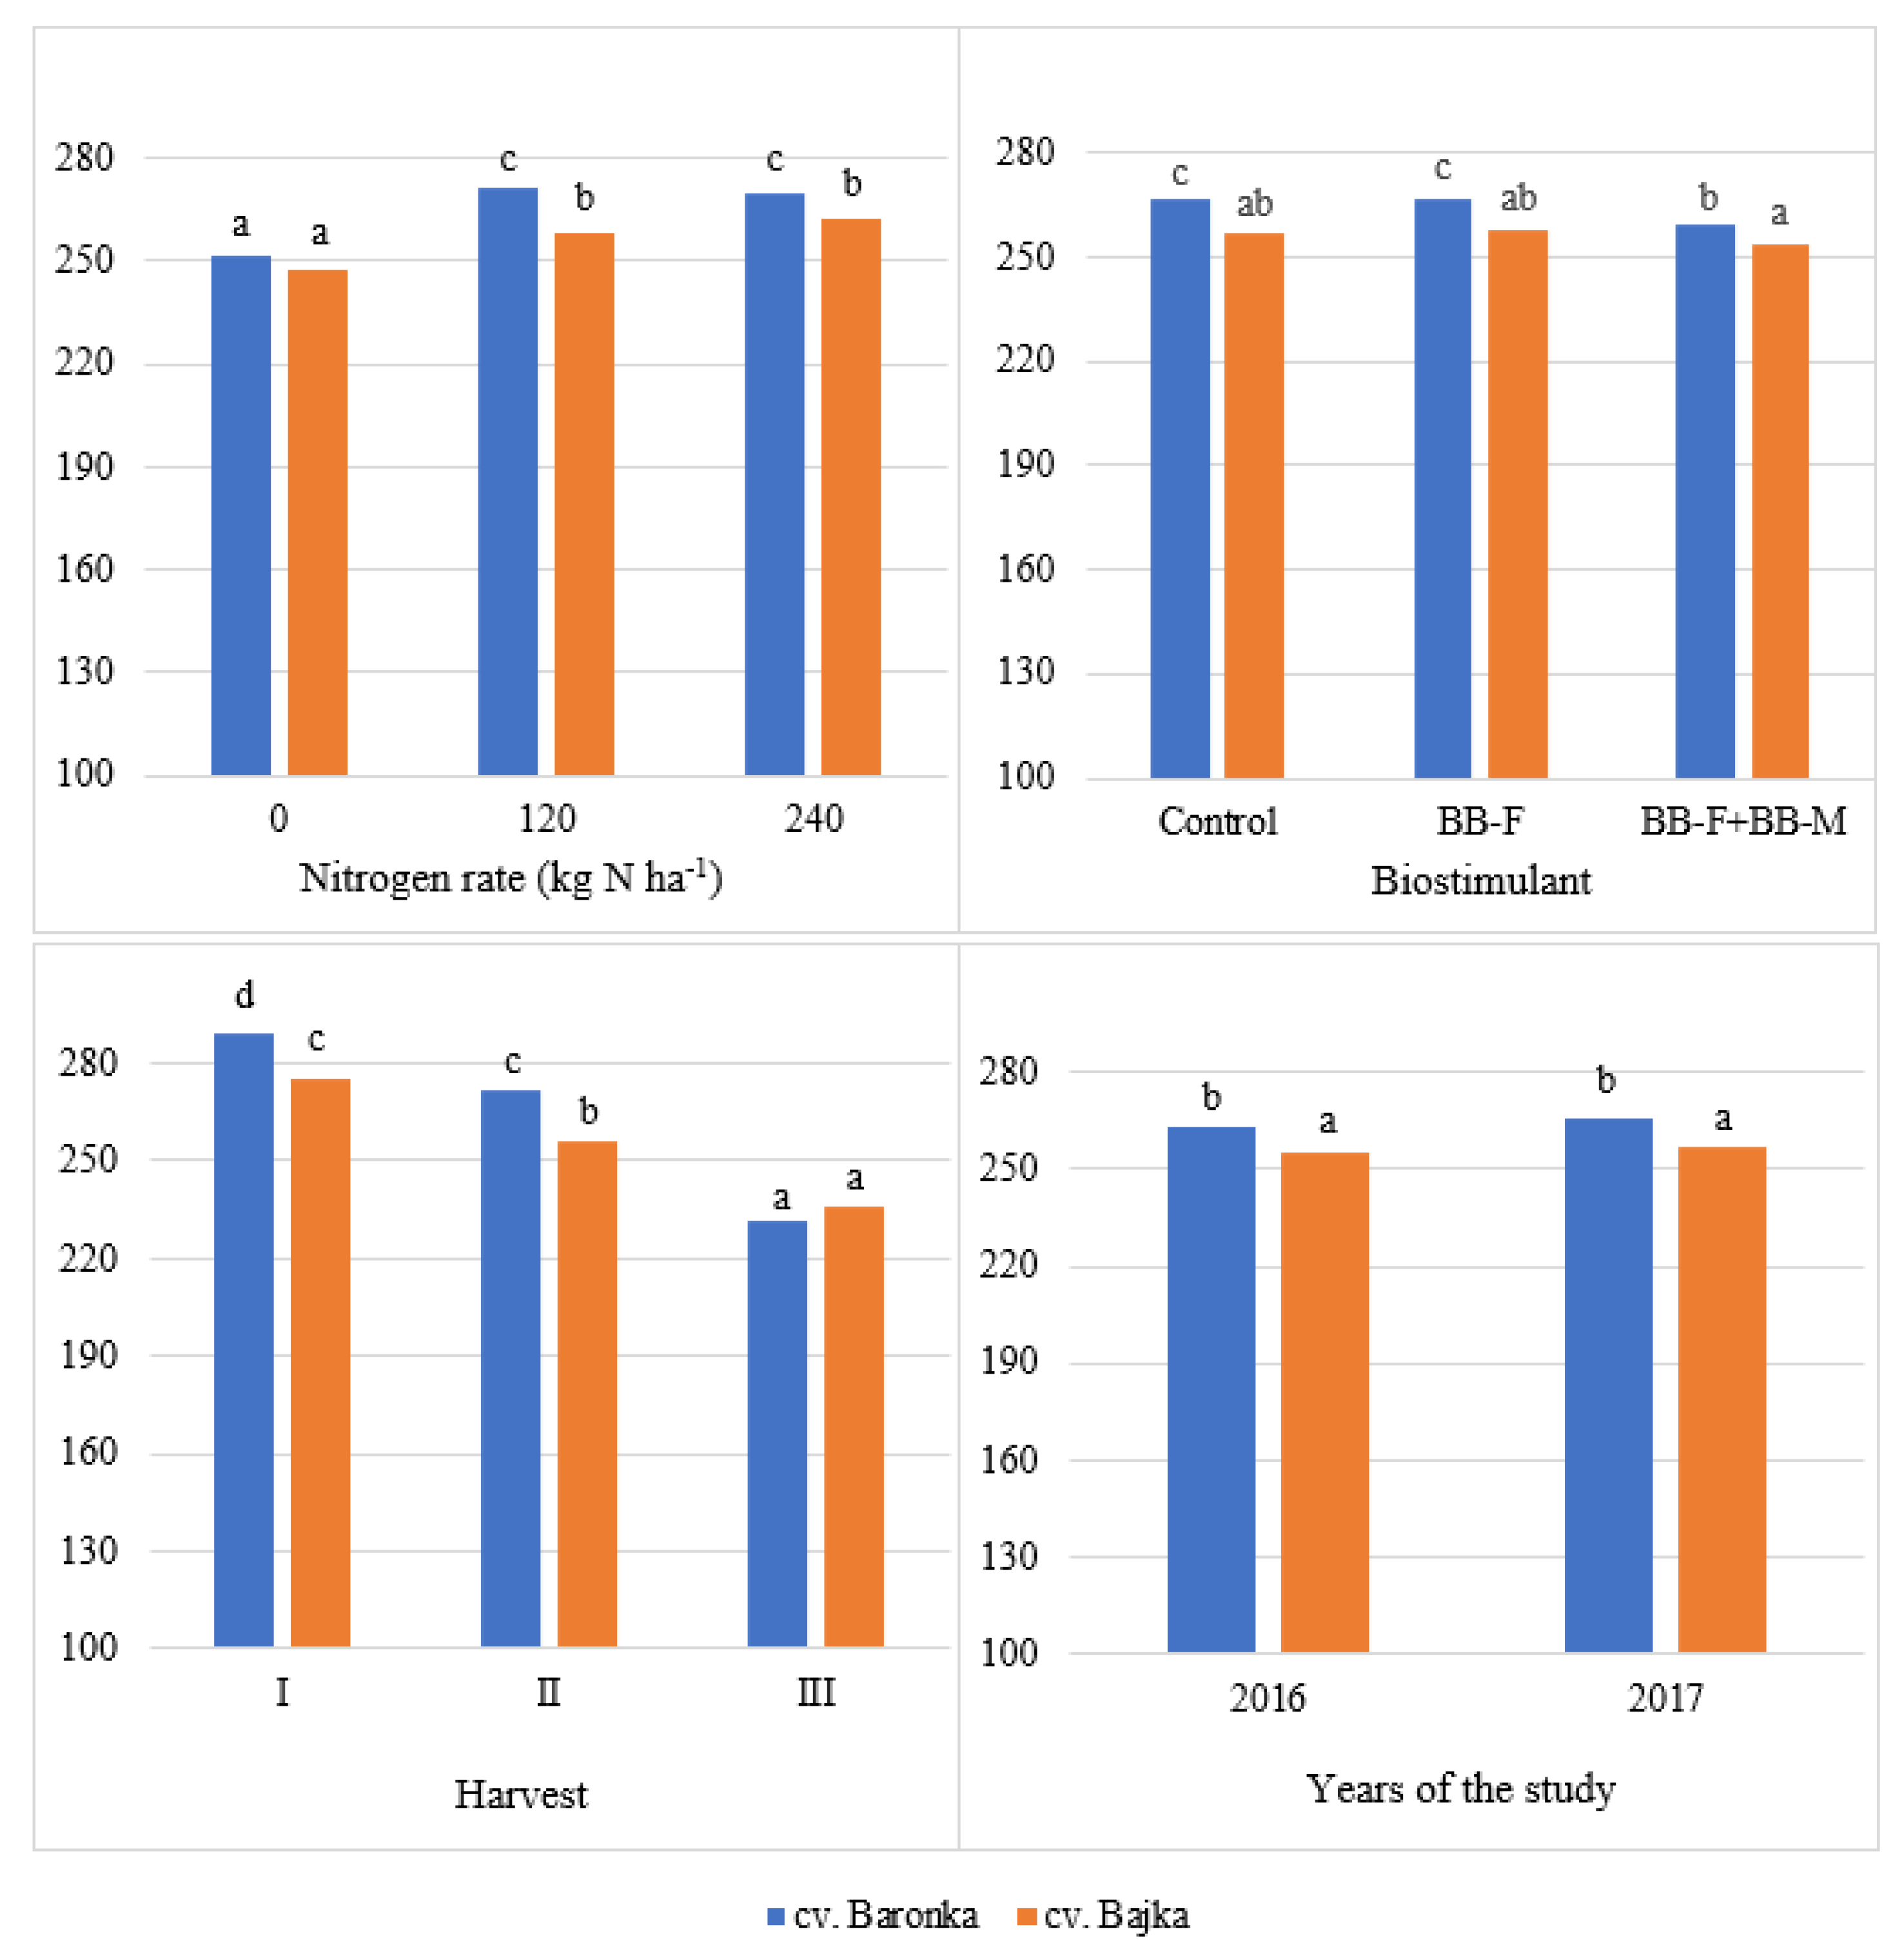
The analyzed perennial ryegrass cultivars responded in a similar manner to N fertilization (Figure 1). The CP content of biomass increased significantly in both Baronka and Bajka in fertilized treatments, by around 5% (cv. Baronka) and 7% (cv. Bajka) in response to the N rate of 120 kg ha−1, and by around 35% (cv. Baronka) and 43% (cv. Bajka) in response to the N rate of 240 kg ha−1. The responses of both cultivars to biostimulant application were similar. The CP content of the biomass was significantly higher in BB-F and BB-F + BB-M treatments than in control treatments. An increase of 2.6% (BB-F) and 5.3% (BB-F + BB-M) was noted in cv. Baronka and the respective values were 4.0% and 4.6% in cv. Bajka (Figure 1). Differences in CP accumulation were also observed between harvests. In both the diploid and tetraploid cultivars, CP concentration was highest in third-cut herbage, by 51% (cv. Baronka) and 56% (cv. Bajka) higher than in first-cut herbage; the difference between first-cut and second-cut herbage reached 36% and 34%, respectively (Figure 1).
The CP content of perennial ryegrass biomass was significantly affected by the cultivar × year interaction. Both cultivars had higher CP content in the first year of the study. The values of this parameter were considerably lower in the second year, which could be caused by adverse weather conditions. It appears that cv. Baronka is more sensitive to unfavorable hydrothermal conditions than cv. Bajka. The decrease in the CP content of the biomass was significantly greater in cv. Baronka than in cv. Bajka (Figure 1).

3.3. Crude Fiber (CF)

Crude fiber is an important component of cattle diets. It is a source of energy for microorganisms, and it regulates digestion and stimulates peristalsis in ruminants. An increase in the proportion of maize silage in the ration for dairy cows may compromise the physical structure of feed and increase the risk of subclinical ruminal acidosis [44]. Dietary fiber affects feed intake, energy values, and digestibility [14,45,46]. It should be stressed that high-fiber plants have high satiety-inducing potential, but they do not fully meet the nutrient requirements of animals due to low energy concentration in feed [47].
An analysis of average values over the two-year study revealed that the CF content of the biomass was around 3% higher in the tetraploid cultivar Baronka than in the diploid cultivar Bajka. In 2016 and 2017, CF concentration was 3% and 3.5% higher, respectively, in cv. Baronka than in cv. Bajka (Table 3).
Nitrogen fertilization contributed to CF accumulation (an increase of 6–6.5%) in the biomass of both cultivars, but no significant differences were found between N rates of 120 kg ha−1 and 240 kg ha−1. Such a relationship was observed in both the first and second years of the study (Table 3).
The application of BB-F had no significant effect on the CF content of plants, whereas BB-F and BB-M applied in combination significantly decreased CF concentration in biomass, by 2% relative to control treatments and by 2.2% relative to BB-F treatments (means of two years). The response of plants to the combined application of biostimulants was stronger in the first year of the experiment. The accumulation of CF in biomass decreased by 2.8% and 3.3%, respectively, in the first year, and by 1.3% and 1.1%, respectively, in the second year (Table 3).
A decrease in the CF content of grasses treated with biostimulants (Algex, Tytanit, Asahi SL) was also reported by Godlewska and Ciepiela [14,15]. In the present study, the CF content of perennial ryegrass biomass (DM basis) varied considerably across harvests. An analysis of average values during the two-year study revealed that CF content was highest in first-cut herbage (285.17 g kg−1 DM), and it was significantly lower in second-cut herbage (by 8.4%) and in third-cut herbage (by 18.1%). Similar trends in CF concentration in plants were observed in each year of the study (Table 3).
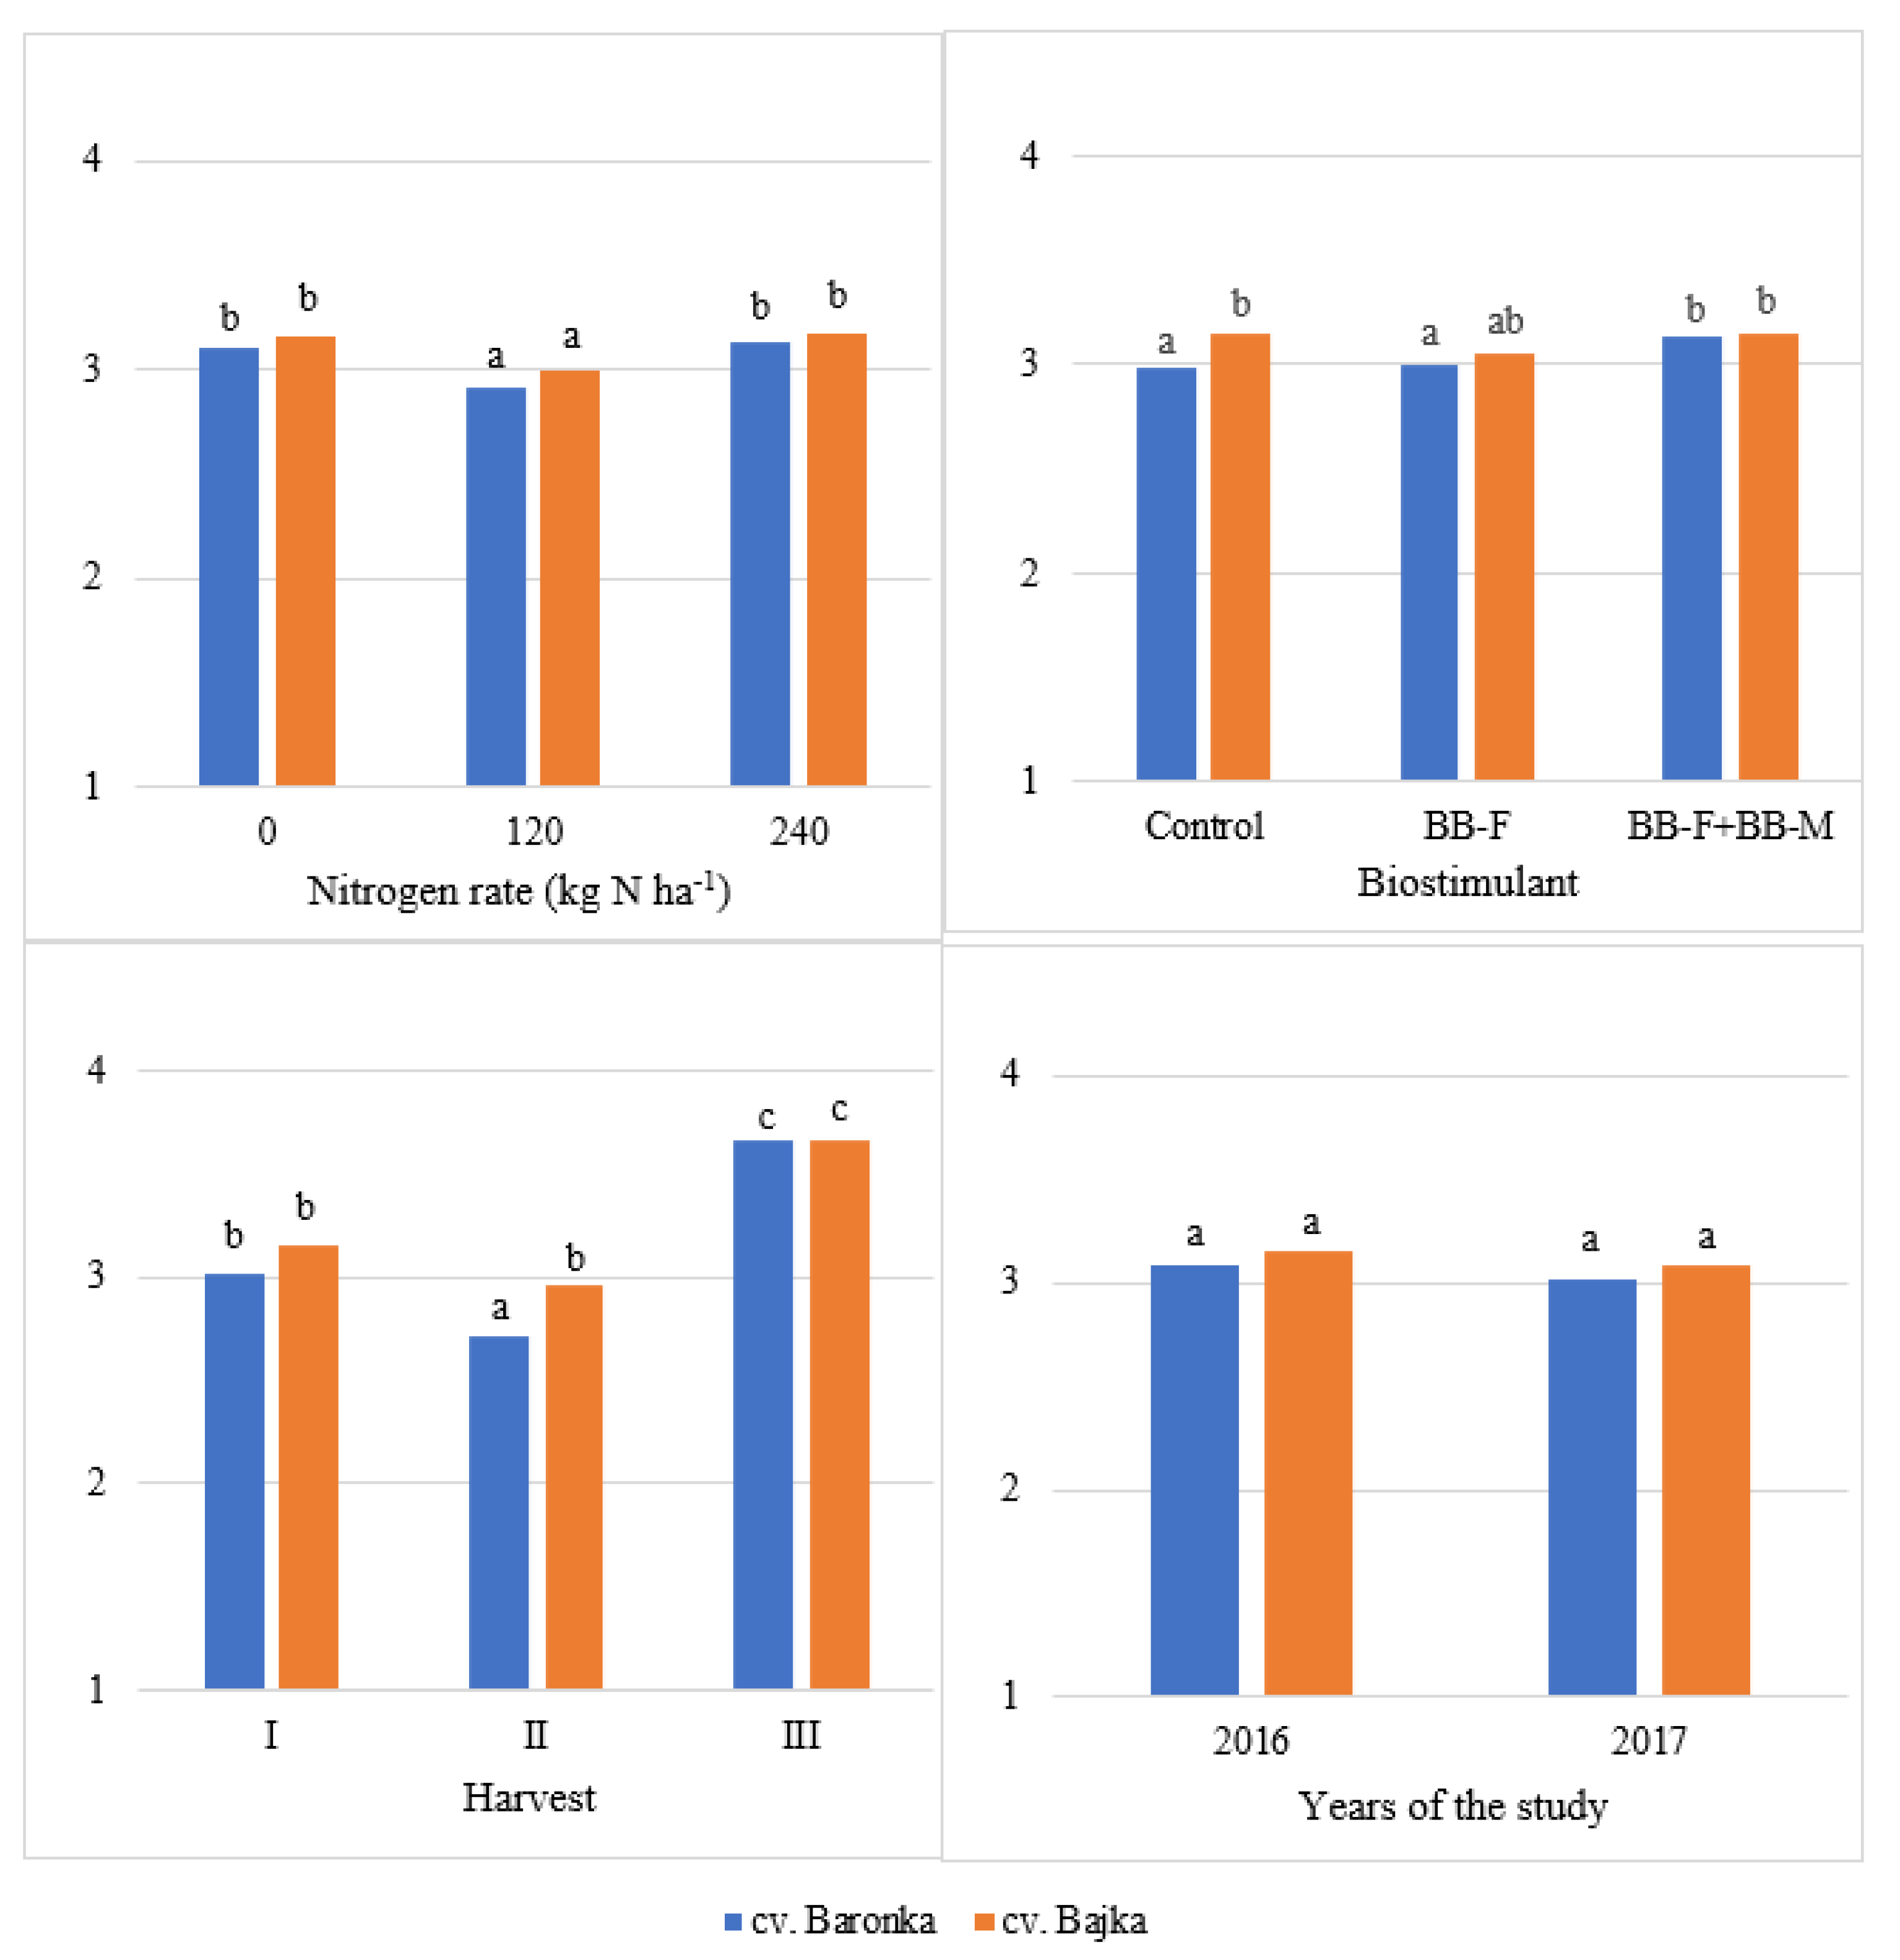
In the current experiment, CF accumulation in perennial ryegrass biomass was affected by cultivar and N fertilization. In both cultivars, CF concentration was higher in fertilized treatments, but no significant differences were found between N rates (Figure 2). Different results were reported by Godlewska and Ciepiela [14]. Szkutnik et al. [48] demonstrated that high N rates decreased the CF content of grasses by 5%, which had a beneficial influence on the nutritional value of feed.
In the current study, foliar application of BB-F had no effect on the CF content (DM basis) of biomass in the analyzed cultivars. However, the combined application of BB-F and BB-M significantly decreased CF accumulation in both cv. Baronka (by 2.7%) and cv. Bajka (by 1.4%).
The cultivar × harvest interaction also significantly affected CF accumulation. In both cultivars, the CF content of biomass decreased gradually with successive harvests. In comparison with first-cut herbage, CF concentration was by around 6% and 20% lower in second-cut and third-cut herbage, respectively, in the tetraploid cultivar Baronka, and by around 7% and 15%, respectively, in the diploid cultivar Bajka (Figure 2).
The CF content of perennial ryegrass biomass did not differ significantly between years of the study, but it was significantly lower in cv. Bajka than in cv. Baronka (Figure 2).

3.4. Leaf Greenness (SPAD)

The chlorophyll content of plants is determined by environmental factors, weather conditions, and anthropogenic factors [49,50,51,52]. The analyzed cultivars differed significantly in leaf greenness expressed as SPAD (Soil Plant Analysis Development) values. This parameter was significantly (by 7.1%) higher in the tetraploid cultivar Baronka (36.28 SPAD) than in the diploid cultivar Bajka (33.88 SPAD) (means of two years). This relationship was noted in both the first and second years of the experiment (Table 4). Higher levels of chlorophyll in tetraploid cultivars of perennial ryegrass were also observed in previous studies by Olszewska and Grzegorczyk [53], Olszewska et al. [54], and Kozłowski and Swędrzyński [55].
Nitrogen fertilization also induced differences in SPAD values, which increased by 7.3% and 18.6% on average, relative to control treatments, in response to the lower and higher N rate (120 kg ha−1 and 240 kg ha−1), respectively. In the second year of the study, SPAD values were lower, but the response of plants to N fertilization was stronger than in the first year. In 2017, leaf greenness increased by 7.9% (120 kg ha−1 N) and 20.4% (240 kg ha−1 N), compared with 6.7% (120 kg ha−1 N) and 16.9% (240 kg ha−1 N) in 2016 (Table 4). Nitrogen is the key component of chlorophyll [56], and one chlorophyll molecule contains four N atoms. Chlorophyll density and the number of chlorophyll molecules in chloroplasts increase with increasing N concentration in leaves [57]. Therefore, N fertilization significantly affects chlorophyll biosynthesis and accumulation in leaves [43]. According to Hudson et al. [58], there is a close correlation between the concentration of N available to plants and the chlorophyll content of leaves, which can be used to optimize N fertilizer application. In turn, N deficiency induces chlorophyll degradation by proteolysis, leading to the release of amino acids, amides, and NH4+ [59].
In the present study, the tested biostimulants significantly increased chlorophyll levels in perennial ryegrass leaves in the first year, by 3.8% (BB-F) and 8.6% (BB-F + BB-M) relative to the control treatment; in the second year, an increase (by 7.3%) was noted only in response to the combined application of BB-F and BB-M. Similar results were reported by Lyu et al. [60], Murawska et al. [18], Sosnowski et al. [19], Kovacik et al. [61], and Ciepiela et al. [62], who found that biostimulants induced an increase in the chlorophyll content of crops.
During the growing season, chlorophyll concentration was highest in first-cut herbage (36.82 SPAD on average) and significantly lower in second-cut herbage (33.40 SPAD on average) and third-cut herbage (35.01 SPAD on average). Identical results were obtained in the first and second years of the experiment (Table 4). In the work of Zielewicz and Kozłowski [63], chlorophyll levels in grasses varied widely during the growing season. Kozłowski et al. [64] noted a decrease in chlorophyll concentration in perennial ryegrass in summer, which resulted from adverse temperature and moisture conditions.
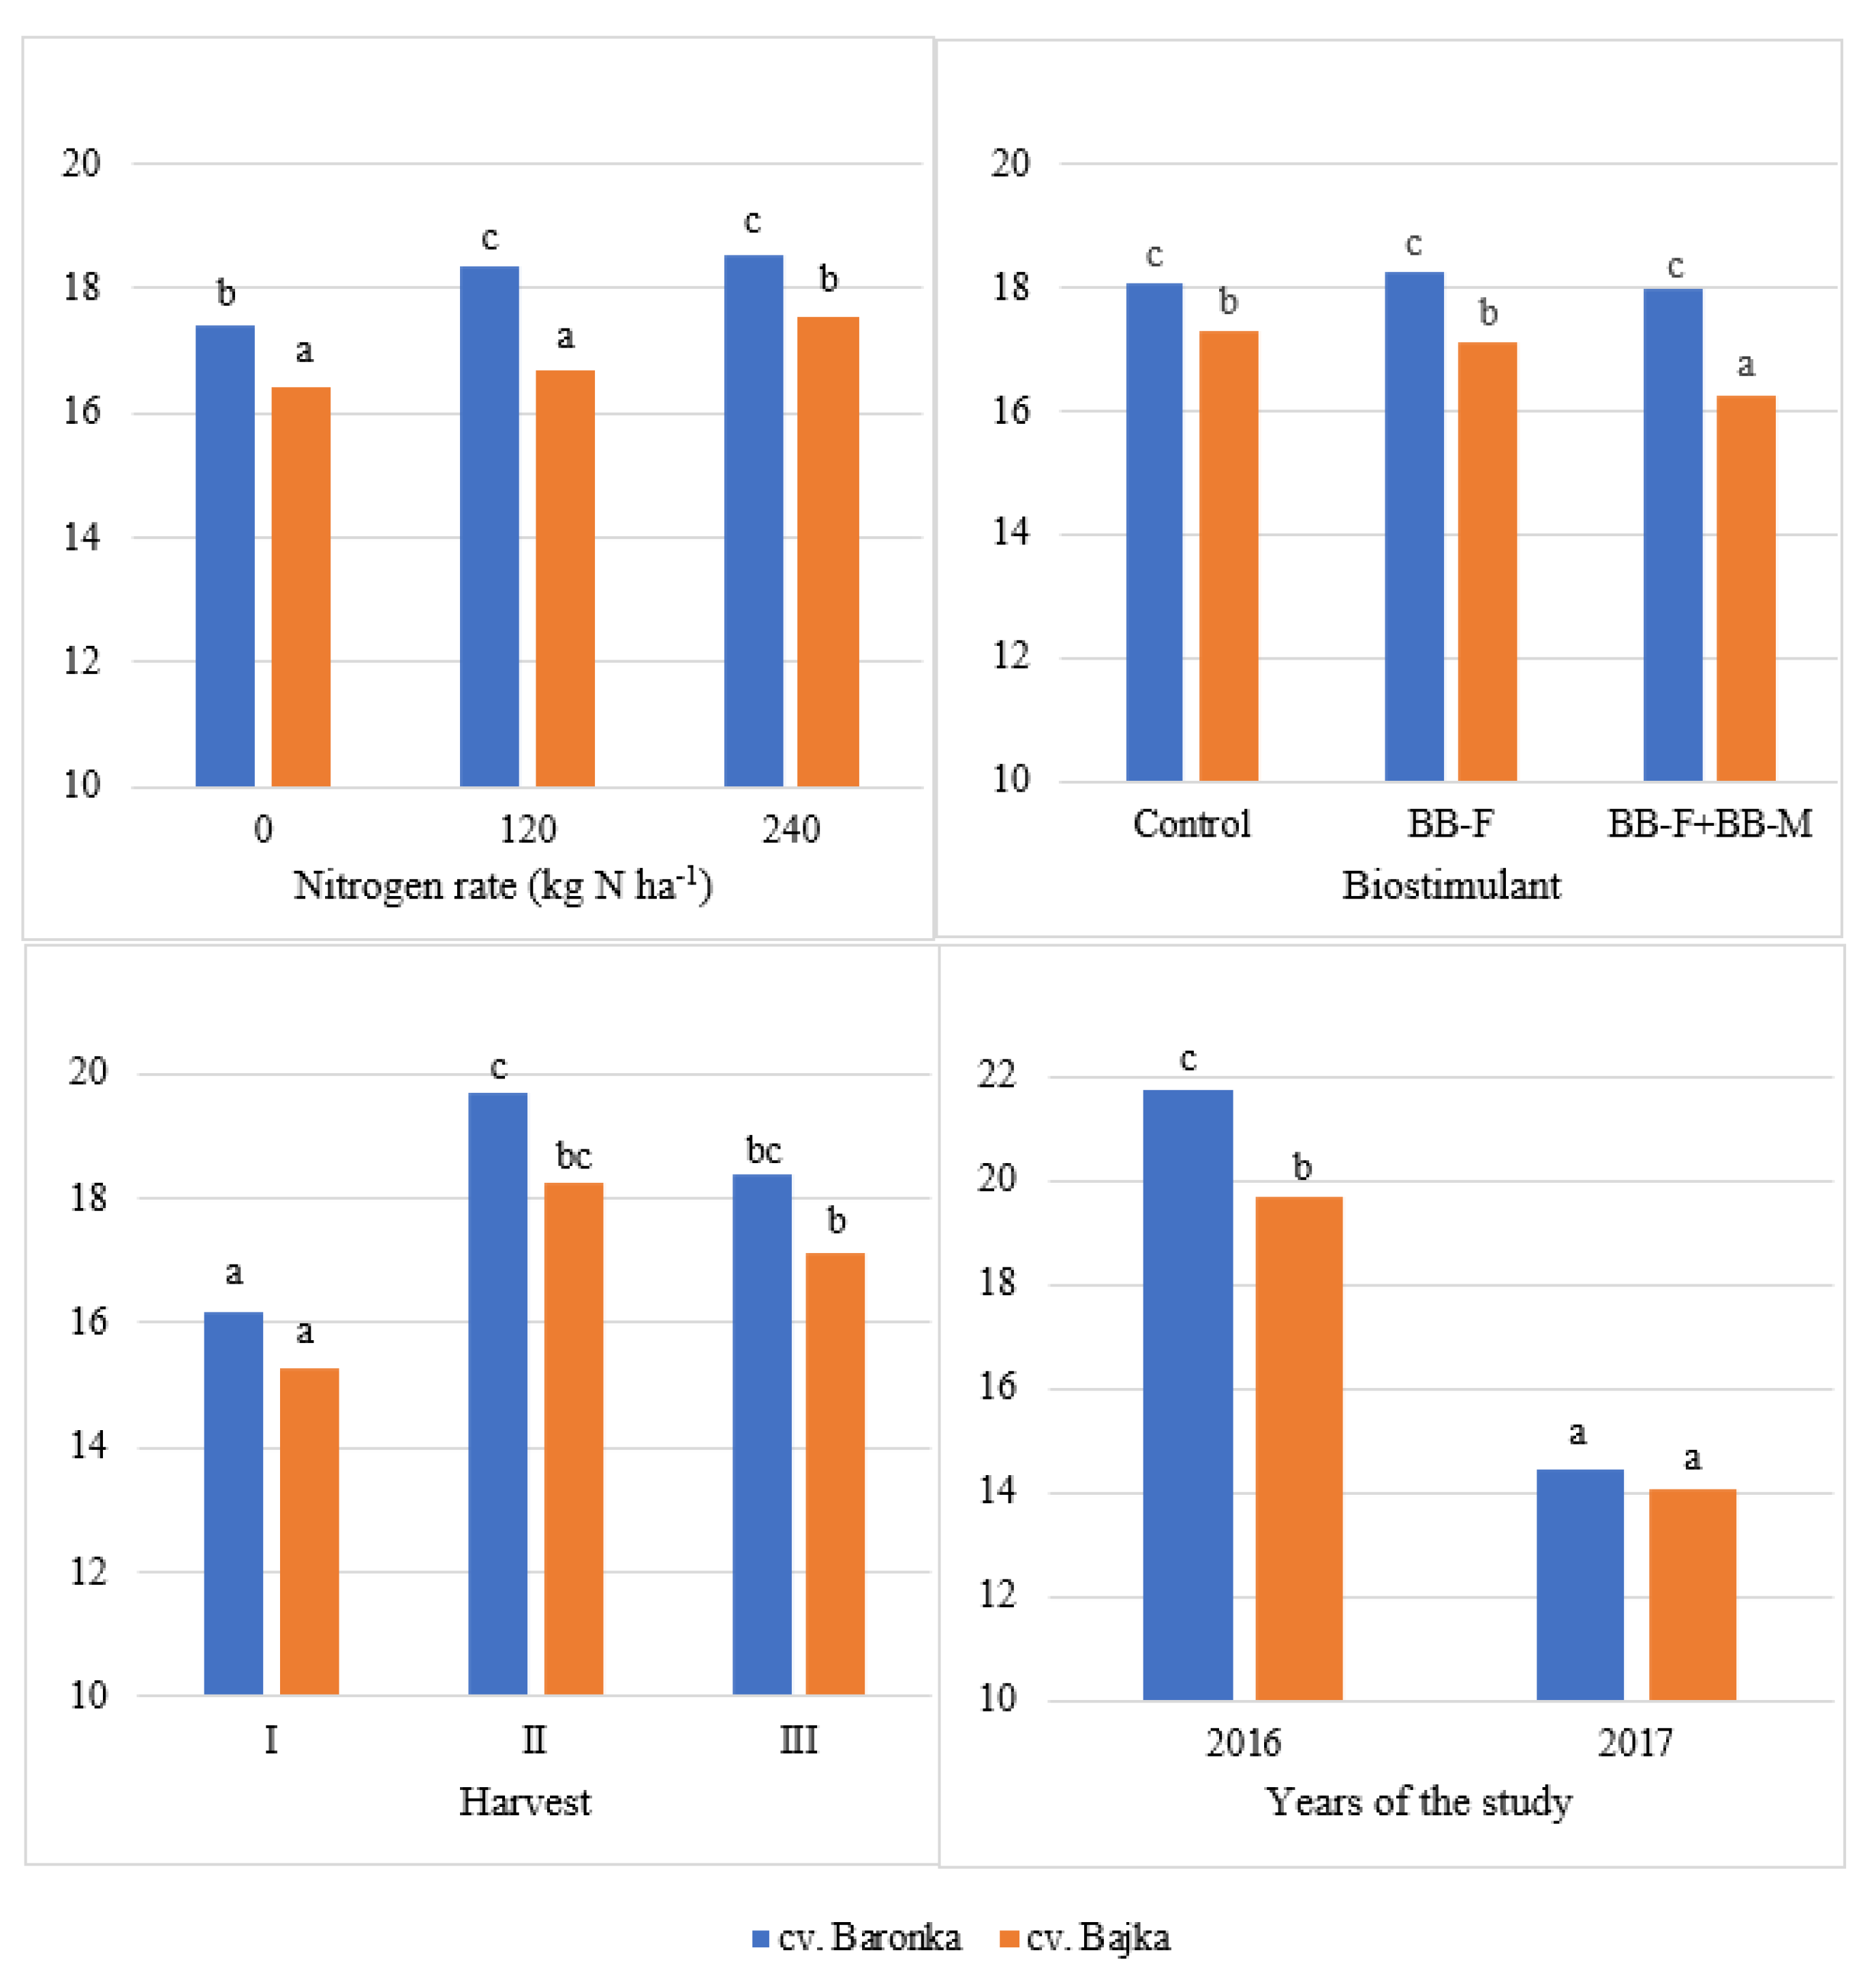
An analysis of the cultivar × fertilization interaction revealed that N fertilizer had a significant effect on leaf greenness in both cultivars of perennial ryegrass. SPAD values increased by 7.6% in cv. Baronka and 7.0% in cv. Bajka in response to the lower N rate (120 kg ha−1), and by over 20% in cv. Baronka and 13% in cv. Bajka in response to the higher N rate (240 kg ha−1) (Figure 3). The analyzed cultivars responded differently to biostimulant application in terms of chlorophyll accumulation in leaves. In cv. Baronka, this parameter increased significantly, by 4.3% (BB-F) and 10.1% (BB-F + BB-M). In cv. Bajka, significant differences were induced only by the combined application of BB-F and BB-M, and chlorophyll concentration increased by 5.7% relative to the control treatment and by 7.0% relative to the BB-F treatment (Figure 3).
Differences in SPAD values were also observed during the growing season. In both cultivars, the amount of synthesized chlorophyll was highest in first-cut herbage and lowest in second-cut herbage (Figure 3). Different results were reported by Jodełka and Sosnowski [65], Gaborcik and Zmetakova [66], and Olszewska [67], who found that chlorophyll levels were lowest in first-cut herbage and increased with successive harvests.
In the current experiment, both the tetraploid and diploid perennial ryegrass cultivars accumulated more chlorophyll in leaves in the first year, which was more conducive to plant growth and development (Figure 3).

3.5. Phosphorus (P)

Phosphorus is an essential macronutrient. The optimal P content of animal feed has been estimated at 3.0 g kg−1 (DM basis) [68]. In the present study, the average P content of biomass in the analyzed perennial ryegrass cultivars ranged from 3.14 to 3.26 g kg−1. The diploid cultivar Bajka had significantly higher P content than the tetraploid cultivar Baronka, by around 2.0% in the first year and by 5.6% in the second year of the experiment (Table 5).
Nitrogen fertilizer applied at 120 kg ha−1 significantly decreased P concentration in plants in both years of the study. The higher N rate (240 kg ha−1) increased P accumulation in biomass, but significant differences were noted only in the second year.
The effect of biostimulants on the P content of plants (DM basis) varied between years. In 2016, the combined application of BB-F and BB-M significantly increased P concentration in biomass, whereas the reverse was observed in 2017. When applied alone, BB-F had no significant influence on the P content of plants (Table 5).
An analysis of average values over the two-year study revealed that P content was lowest in second-cut herbage (2.84 g kg−1 DM). In the first year of the study, P accumulation was also lowest in second-cut herbage, whereas in the second year, first-cut herbage had the lowest P content (Table 5).
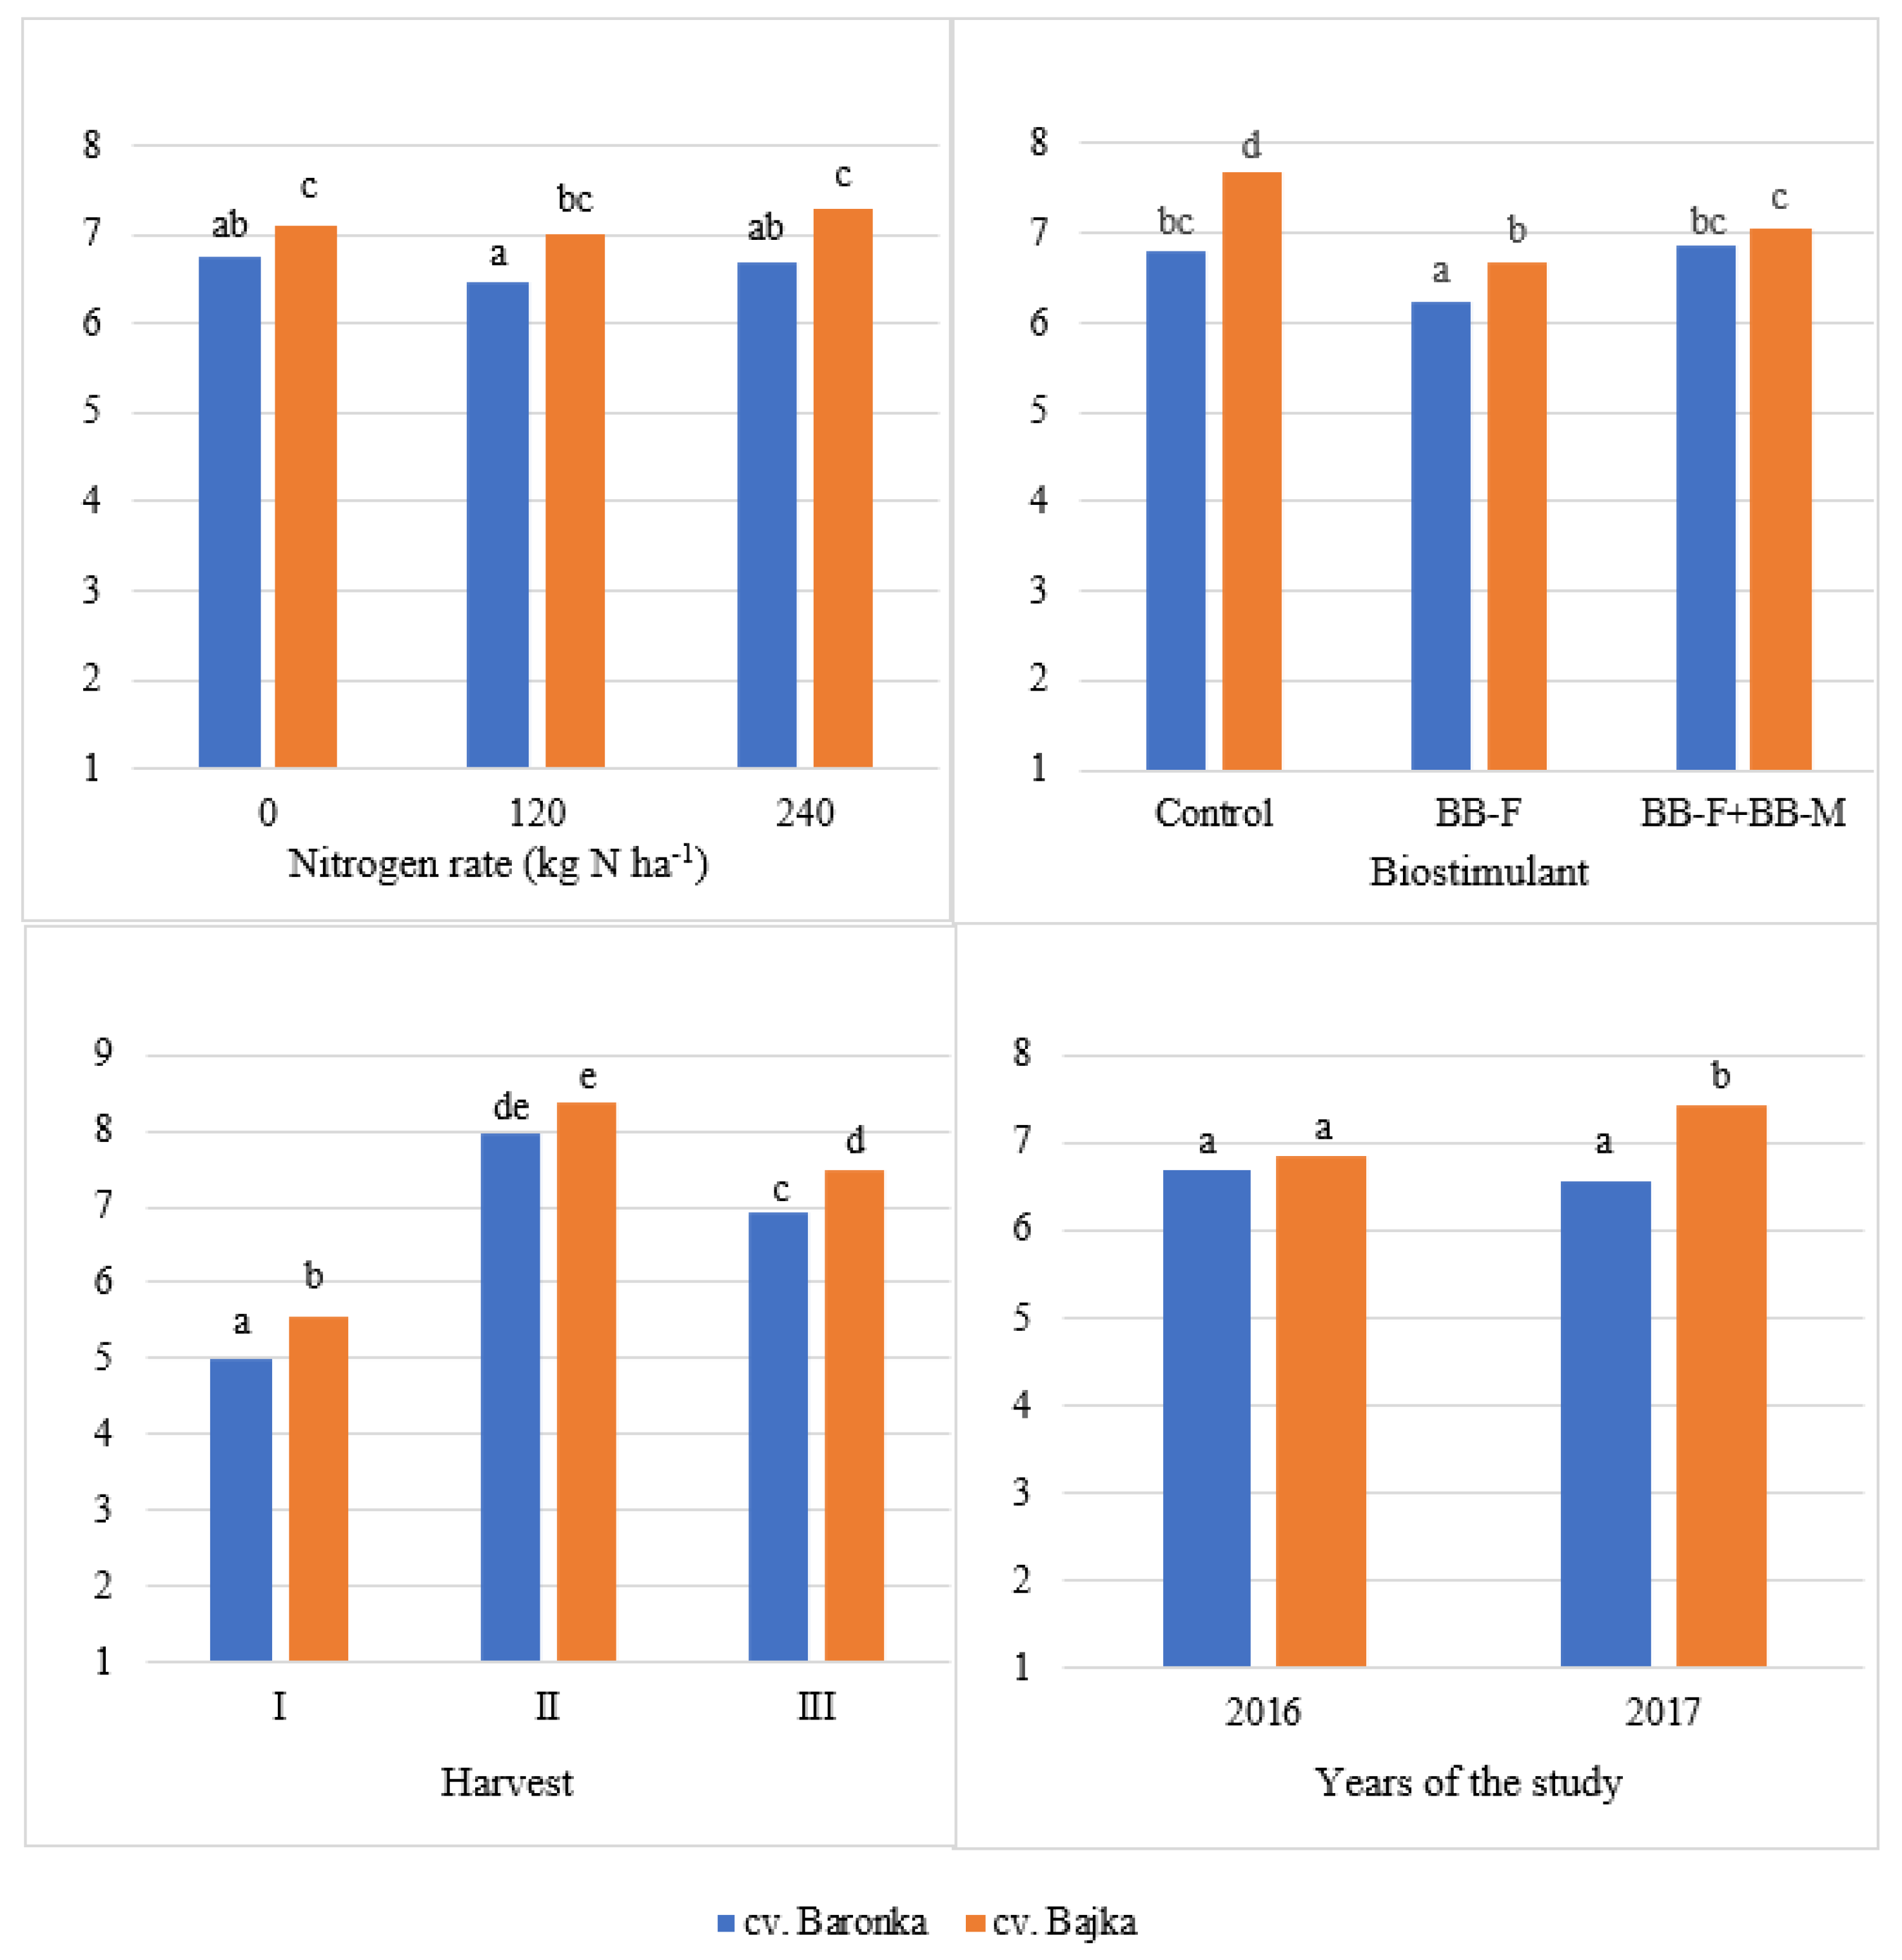
Phosphorus accumulation in plants was significantly affected by the cultivar × fertilization interaction. In comparison with the control treatment, the lower N rate (120 kg ha−1) decreased P content by 5.8% in cv. Baronka and 5.1% in cv. Bajka. The higher N rate (240 kg ha−1) had no significant effect on the P content of biomass in any of the cultivars (Figure 4).
In cv. Baronka, the combined application of BB-F and BB-M increased the P content of biomass by 4.7%, relative to the control treatment. In cv. Bajka, the P content of biomass decreased in response to the application of BB-F, whereas no differences were found between BB-F + BB-M and control treatments.
In both cultivars, third-cut herbage accumulated the greatest amount of P. The noted increase, relative to first-cut and second-cut herbage, reached 18.9% and 27.0%, respectively, in cv. Baronka, and 14.9% and 18.9%, respectively, in cv. Bajka. An increase in the P content of grass biomass with successive harvests was also reported by Wyss and Kessler [69], and Pirhofer-Walzl et al. [5]. No significant differences in P concentration were found between cultivars across years of the study (Figure 4).

3.6. Potassium (K)

Potassium is accumulated by grasses in the highest quantities of all nutrients [70]. Potassium uptake by plants may be limited by factors such as temperature, drought, soil compaction, an insufficient supply of P and N, and too high or too low soil pH [71]. The tetraploid cultivar Baronka accumulated significantly more K in biomass than the diploid cultivar Bajka. Varietal differences in K accumulation were observed in both years of the study. The K content of the biomass was 10.5% (2016) and 2.6% (2017) higher in cv. Baronka than in cv. Bajka (Table 6).
Nitrogen fertilization also positively affected K accumulation in plants. The K content of perennial ryegrass biomass increased by 4.2% (2016) and 2.4% (2017) in response to the lower N rate (120 kg ha−1) and increased significantly by 8.0% (2016) and 4.9% (2017) in response to the higher N rate (240 kg ha−1). A positive linear effect of N fertilizer on the K content of grass leaf blades was also observed by Neto et al. [72]. In contrast, Gaj et al. [70] noted a significant increase in K concentration in grasses only when N fertilizer was applied at 60 kg ha−1, whereas a further increase in N rates had no influence on the K content of grass biomass. According to Staniak and Księżak [47], K accumulation in plants is affected by the form of N fertilizer. Nitrate N, unlike ammonium N, increases the K content of plants.
The average values obtained during the two-year study show that the application of BB-F had no significant effect on K accumulation in the analyzed cultivars of perennial ryegrass, whereas BB-F and BB-M applied in combination significantly decreased the K content of biomass (DM basis), in particular in the first year of the experiment (Table 6).
Potassium accumulation in herbage varied between years of the study. In the first year, K concentration was highest in second-cut herbage (24.88 g kg−1 DM), and in the second year—in third-cut herbage (16.09 kg ha−1).
An analysis of the interactions between the experimental factors revealed that the analyzed cultivars differed in K accumulation under the influence of N fertilization. In cv. Baronka, the K content of plants increased in fertilized treatments, but no differences were found between N rates. In cv. Bajka, no differences were observed between the control treatment and the treatment fertilized with 120 kg N ha−1, whereas the K content of biomass increased significantly in response to the N rate of 240 kg ha−1 N (Figure 5).
Biostimulant application had no significant effect on the K content of biomass in cv. Baronka, whereas the combined application of BB-F and BB-M significantly decreased K concentration in cv. Bajka, by 6.1% and 4.9% relative to control and BB-F treatments, respectively (Figure 5).
Potassium accumulation in plants varied during the growing season. In both cultivars, K concentration was highest in second-cut herbage, and lowest in first-cut herbage; the noted differences reached 17.8% in cv. Baronka, and 16.1% in cv. Bajka (Figure 5). In a study by Gaj et al. [70], K accumulation in grasses was highest in third-cut herbage and lowest in first-cut herbage.
Differences in the K content of biomass were also noted between years of the study. Both the tetraploid cultivar Baronka and the diploid cultivar Bajka accumulated more K in the first year of the study. It should be stressed that K content clearly exceeded the value considered optimal in ruminant nutrition. In the second year of the experiment, the K content of plants (DM basis) decreased considerably, by 33.2% in cv. Baronka and by 28.4% in cv. Bajka (Figure 5).

3.7. Calcium (Ca)

The average Ca content of perennial ryegrass biomass was 6.62 g kg−1 DM in cv. Baronka and 7.13 g kg−1 DM in cv. Bajka. In both the first and second year of the study, cv. Bajka accumulated significantly more Ca. However, greater differences in Ca accumulation were observed in the second year when Ca concentration was by around 13.0% higher in cv. Bajka than in cv. Baronka (Table 7).
The lower N rate (120 kg ha−1) significantly (by 3.0%) decreased the average Ca content of plants relative to control treatments, whereas the higher N rate (240 kg ha−1) had no significant effect on Ca concentration in biomass (Table 7). In a study by Staniak and Księżak [47], a decrease in the Ca content of grass biomass was directly proportional to N rates. In turn, Ciepiela and Godlewska [73] found that Ca concentration increased by 33.4% when N fertilizer was applied at 150 kg ha−1.
An analysis of average values over the two-year study indicates that the Ca content of perennial ryegrass biomass (DM basis) decreased significantly in response to biostimulant application. In BB-F treatments, Ca accumulation decreased by 10.8%.
During the growing season, Ca concentration was lowest in first-cut herbage and highest in second-cut herbage. In comparison with the first harvest, the average Ca content of biomass increased by 54.5% in the second harvest and by 36.4% in the third harvest (Table 7).
An analysis of the cultivar × fertilization interaction revealed that both cultivars were characterized by the lowest Ca content in treatments fertilized with 120 kg N ha−1. An increase in fertilizer rate to 240 kg N ha−1 did not increase Ca concentration in plants (Figure 6).
Foliar application of BB-F negatively affected Ca accumulation in both perennial ryegrass cultivars, which decreased by 8.4% in cv. Baronka and 12.9% in cv. Bajka. The combined application of BB-F and BB-M had no influence on Ca accumulation in cv. Baronka, but it significantly decreased (by 8.2%) Ca concentration in cv. Bajka (Figure 6).
Similar changes in Ca accumulation during the growing season were observed in both cultivars. In the tetraploid cultivar Baronka and the diploid cultivar Bajka, Ca content was lowest in first-cut herbage and highest in second-cut herbage. In comparison with the first harvest, Ca concentration increased by 60.0% (cv. Baronka) and 50.8% (cv. Bajka) in the second harvest, and by 38.0% and 34.6%, respectively, in the third harvest (Figure 6).
In the first year of the experiment, the analyzed cultivars did not differ in terms of Ca content, whereas in the second year, Ca concentration was significantly higher in the diploid cultivar Bajka (Figure 6).

4. Conclusions

The results of this two-year study demonstrated that the tetraploid cultivar Baronka had a more desirable chemical composition than the diploid cultivar Bajka. The biomass of cv. Baronka had a higher content of CP, CF, and K, and it was characterized by higher leaf greenness (SPAD) values. Nitrogen fertilization considerably increased the content of CP, P, and K, and leaf greenness (SPAD) values in both cultivars, and the noted increase was higher when N was applied at 240 kg ha−1. The N fertilizer rate of 120 kg ha−1 led to a significant decrease in the average Ca content of plants, whereas the N fertilizer rate of 240 kg ha−1 had no significant effect on Ca concentration. The tested biostimulants significantly affected the chemical composition of perennial ryegrass biomass, and their influence was greater when they were applied in combination. The foliar application of BB-F and BB-M increased the content of CP, P, and chlorophyll in perennial ryegrass leaves, whereas it decreased the accumulation of CF, K, and Ca in plants. These preliminary results indicate that the analyzed biostimulants had a positive effect on the chemical composition of perennial ryegrass biomass. This is an important practical consideration because high-quality green fodder for livestock can be produced while minimizing the use of mineral fertilizers and adverse environmental impacts. However, further research is needed to validate the present findings.

Funding

The results presented in this paper were obtained as part of a comprehensive study financed by the University of Warmia and Mazury in Olsztyn (grant No. 30.610.014-110). Project financially supported by Minister of Education and Science in the range of the program entitled “Regional Initiative of Excellence” for the years 2019–2022, Project No. 010/RID/2018/19, amount of funding 12.000.000 PLN.

Institutional Review Board Statement

Not applicable.

Informed Consent Statement

Not applicable.

Data Availability Statement

Not applicable.

Acknowledgments

The author would like to thank the staff of the Agricultural Experiment Station in Tomaszkowo for technical support during the experiment.

Conflicts of Interest

The author declare no conflict of interest.

References

  1. Taweel, H.Z.; Tas, T.B.M.; Smit, H.J.; Elgersma, A.; Dijkstra, J.; Tamminga, S. Improving the quality of perennial ryegrass (Lolium perenne L.) for dairy cows by selecting for fast clearing and/or degradable neutral detergent fiber. Livest. Prod. Sci. 2005, 96, 239–248. [Google Scholar] [CrossRef]
  2. Daccord, R.; Arrigo, Y.; Kessler, J.; Jeangros, B.; Scehovic, J.; Schubiger, F.X.; Lehmann, J. Nutritive value of grassland plants. Contents of calcium, phosphorus, magnesium and potassium. Agrarforschung 2001, 8, 264–269. [Google Scholar]
  3. Schlegel, P.; Wyss, U.; Arrigo, Y.; Hess, H.D. Mineral concentrations of fresh herbage from mixed grassland as influenced by botanical composition, harvest time and growth stage. Anim. Feed Sci. Technol. 2016, 219, 226–233. [Google Scholar] [CrossRef] [Green Version]
  4. Wyłupek, T.; Harkot, W.; Czarnecki, Z. The content of selected macroelements in the dry weight of permanent grassland sward, grass yields and its agricultural value. J. Elem. 2014, 19, 853–864. [Google Scholar] [CrossRef]
  5. Pirhofer-Walzl, K.; Søegaard, K.; Høgh-Jensen, H.; Eriksen, J.; Sanderson, M.A.; Rasmussen, J.; Rasmussen, J. Forage herbs improve mineral composition of grassland herbage. Grass Forage Sci. 2011, 66, 415–423. [Google Scholar] [CrossRef] [Green Version]
  6. Delagarde, R.; Peyraud, J.L.; Delaby, L.; Faverdin, P. Vertical distribution of biomass, chemical composition and pepsin-cellulase digestibility in a perennial ryegrass sward: Interaction with month of year, regrowth age and time of day. Anim. Feed Sci. Technol. 2000, 84, 49–68. [Google Scholar] [CrossRef]
  7. Moot, D.J.; Scott, W.D.; Roy, A.M.; Nicholls, A.C. Base temperature and thermal time requirements fir germination and emergence of temperate pasture species. N. Z. J. Agric. Res. 2000, 43, 15–25. [Google Scholar] [CrossRef] [Green Version]
  8. Guy, C.; Hennessy, D.; Gilliland, T.; Coughlan, F.; McCarthy, B. Growth, morphology and biological nitrogen fixation potential of perennial ryegrass-white clover swards throughout the grazing season. J. Agric. Sci. 2018, 156, 188–199. [Google Scholar] [CrossRef]
  9. Nair, R. Developing tetraploid perennial ryegrass (Lolium perenne L.) populations. N. Z. J. Agric. Res. 2004, 47, 45–49. [Google Scholar] [CrossRef] [Green Version]
  10. Olszewska, M. Effects of Cultivar, Nitrogen Rate and Harvest Time on the Content of Carbohydrates and Protein in the Biomass of Perennial Ryegrass. Agronomy 2021, 11, 468. [Google Scholar] [CrossRef]
  11. Shahabivand, S.; Padash, A.; Aghaee, A.; Nasiri, Y.; Rezaei, P.F. Plant biostimulants (Funneliformis mosseae and humic substances) rather than chemical fertilizer improved biochemical responses in peppermint. Iran. J. Plant Physiol. 2018, 8, 2333–2344. [Google Scholar] [CrossRef]
  12. Perrino, E.V.; Calabrese, G. Endangered segetal species in southern Italy: Distribution, conservation status, trends, actions and ethnobotanical notes. Genet. Resour. Crop Evol. 2018, 65, 2107–2134. [Google Scholar] [CrossRef]
  13. Perrino, E.V.; Wagensommer, R.P. Crop Wild Relatives (CWRs) Threatened and Endemic to Italy: Urgent Actions for Protection and Use. Biology 2022, 11, 193. [Google Scholar] [CrossRef] [PubMed]
  14. Godlewska, A.; Ciepiela, G.A. Italian Ryegrass (Lolium multiflorum Lam.) Fiber Fraction Content and Dry Matter Digestibility Following Biostimulant Application against the Background of Varied Nitrogen Regime. Agronomy 2021, 11, 39. [Google Scholar] [CrossRef]
  15. Godlewska, A.; Ciepiela, G. Carbohydrate and lignin contents in perennial ryegrass (Lolium perenne L.) treated with sea bamboo (Ecklonia maxima) extract against the background of nitrogen fertilization regime. Appl. Ecol. Environ. Res. 2020, 18, 6087–6097. [Google Scholar] [CrossRef]
  16. Godlewska, A.; Ciepiela, G.A. The effect of growth regulator on dry matter yield and some chemical components in selected grass species and cultivars. Soil Sci. Plant Nutr. 2016, 62, 297–302. [Google Scholar] [CrossRef] [Green Version]
  17. Godlewska, A.; Ciepiela, G.A. The effect of natural growth regulators obtained from ecklonia maxima and mineral nitrogen on true protein and simple sugar contents of Dactylis glomerata L. and Festulolium braunii (K. Richt.) A. Camus. Turk. J. Field Crop. 2013, 18, 247–253. [Google Scholar]
  18. Murawska, B.; Gabrowska, M.; Spychaj-Fabisiak, E.; Wszelaczyńska, E.; Chmielewski, J. Production and environmental aspects of the application of biostimulators Asahi SL, Kelpak SL and stymulator Tytanit with limited doses of nitrogen. Environ. Protec. Nat. Resour. 2017, 28, 10–15. [Google Scholar] [CrossRef] [Green Version]
  19. Sosnowski, J.; Malinowska, E.; Jankowski, K.; Redzik, P. Morpho-chemical diversity in Festuca pratensis and Lolium perenne depending on concentrations of Ecklonia maxima extract. Appl. Ecol. Env. Res. 2016, 14, 369–379. [Google Scholar] [CrossRef]
  20. Sharma, H.S.S.; Fleming, C.; Selby, C.; Rao, J.R.; Martin, T. Plant biostimulants: A review on the processing of macroalgae and use of extracts for crop management to reduce abiotic and biotic stresses. J. Appl. Phycol. 2014, 26, 465–490. [Google Scholar] [CrossRef]
  21. Du Jardin, P. Plant biostimulants: Definition, concept, main categories and regulation. Sci. Hortic. 2015, 196, 3–14. [Google Scholar] [CrossRef] [Green Version]
  22. Yakhin, O.I.; Lubyanov, A.A.; Yakhin, I.A.; Brown, P.H. Biostimulants in plant science: A global perspective. Front. Plant Sci. 2017, 7, 2049. [Google Scholar] [CrossRef] [Green Version]
  23. Alam, M.Z.; Braun, G.; Norrie, J.; Hodges, D.M. Ascophyllum extract application can promote plant growth and root yield in carrot associated with increased root-zone soil microbial activity. Can. J. Plant Sci. 2014, 94, 337–348. [Google Scholar] [CrossRef] [Green Version]
  24. Kleiber, T.; Markiewicz, B. Application of “Tytanit” in greenhouse tomato growing. Acta Sci. Pol. Hortorum Cult. 2013, 12, 117–126. [Google Scholar]
  25. Matysiak, K.; Kaczmarek, S.; Krawczyk, R. Influence of seaweed extracts and mixture of humic acid fulvic acids on germination and growth of Zea mays L. Acta Sci. Pol. Agric. 2011, 10, 33–45. [Google Scholar]
  26. Sivasankari, S.; Venkatesalu, V.; Anantharaj, M.; Chandrasekaran, M. Effect of seaweed extracts on the growth and biochemical constituents of Vigna sinensis. Bioresour. Technol. 2005, 97, 1745–1751. [Google Scholar] [CrossRef]
  27. Karr-Lilienthal, L.; Kadzere, C.; Grieshop, C.; Fahey, G. Chemical and nutritional properties of soybean carbohydrates as related to nonruminants: A review. Livest. Prod. Sci. 2005, 97, 1–12. [Google Scholar] [CrossRef]
  28. Commission Regulation (EC) No. 1455/1999 of 1 July 1999 as Last Amended by Regulations (EC) No. 2706/2000 and No. 46/2003. Available online: https://eur-lex.europa.eu/ (accessed on 7 March 2022).
  29. Official Website of Agrosystemy, a Supplier of Effective Microorganisms (EM) Products Manufactured by the Austrian Company Multikraft. Available online: https://agrosystemy.com/ (accessed on 7 March 2022).
  30. Majkowska-Gadomska, J.; Dobrowolski, A.; Jadwisieńczak, K.K.; Kaliniewicz, Z.; Francke, A. Effect of biostimulants on the growth, yield and nutritional value of Capsicum annuum grown in an unheated plastic tunnel. Sci. Rep. 2021, 11, 22335. [Google Scholar] [CrossRef]
  31. Skowera, B.; Puła, J. Pluviometric extreme conditions in spring season in Poland in the years 1971–2000. Acta Agroph. 2004, 3, 171–177. (In Polish) [Google Scholar]
  32. Henneberg, W.; Stohmann, F. Über das Ernährungsfutter volljährigen Rindviehs. J. Landwirtsch 1859, 3, 485–551. [Google Scholar]
  33. TIBCO Software Inc. Statistica (Data Analysis Software System, Palo Alto, USA). 2017, Version 13.3. Available online: https://docs.tibco.com/products/tibco-statistica-13-3-0 (accessed on 7 January 2022).
  34. Alende, M.; Fluck, A.C.; Volpi-Lagreca, G.; Andrae, J.G. Chemical composition and in vitro digestibility of annual ryegrass varieties grown in greenhouse conditions. RIA 2020, 46, 50–55. [Google Scholar]
  35. Stewart, A.; Hayes, R. Ryegrass breeding-balancing trait priorities. Ir. J. Agric. Food Res. 2011, 50, 31–46. [Google Scholar]
  36. Smith, K.F.; Simpson, R.J.; Culvenor, R.A.; Humphreys, M.O.; Prud’Homme, M.P.; Oram, R.N. The effects of ploidy and a phenotype conferring a high water-soluble carbohydrate concentration on carbohydrate accumulation, nutritive value and morphology of perennial ryegrass (Lolium perenne L.). J. Agric. Sci. 2001, 136, 65–74. [Google Scholar] [CrossRef]
  37. Cosgrove, G.P.; Burke, J.L.; Death, A.F.; Hickey, M.J.; Pacheco, D.; Lane, G.A. Ryegrasses with increased water soluble carbohydrate: Evaluating the potential for grazing dairy cows in New Zealand. Proc. N. Z. Grassl. Assoc. 2007, 69, 179–185. [Google Scholar] [CrossRef]
  38. Wims, C.M.; Mcevoy, M.; Delaby, T.M.; Boland, T.M.; Donovan, M.O. Effect of perennial ryegrass (Lolium perenne L.) cultivars on the milk yield of grazing dairy cows. Animal 2012, 7, 410–421. [Google Scholar] [CrossRef] [PubMed] [Green Version]
  39. Sugiyama, S. Responses of shoot growth and survival to water stress gradient in diploid and tetraploid populations of Lolium multiflorum and L. perenne. Grassl. Sci. 2006, 52, 155–160. [Google Scholar] [CrossRef]
  40. Balocchi, O.A.; López, I.F. Herbage production, nutritive value and grazing preference of diploid and tetraploid perennial ryegrass cultivars (Lolium perenne L.). Chil. J. Agric. Res. 2009, 69, 331–339. [Google Scholar] [CrossRef] [Green Version]
  41. Rodrigues, A.M.; Veloso, A.; Vaz, E.; Almeida, J.F. Production and nutritional composition of two annual ryegrass cultivars (diploid and tetraploid). Curr. Investig. Agric. Curr. Res. 2019, 7, 914–916. [Google Scholar] [CrossRef] [Green Version]
  42. Solomon, J.K.Q.; Macoon, B.; Lang, D.J.; Vann, R.C.; Ward, S. Cattle grazing preference among tetraploid and diploid annual ryegrass cultivars. Crop Sci. 2014, 54, 430–438. [Google Scholar] [CrossRef]
  43. Ihtisham, M.; Fahad, S.; Luo, T.; Larkin, R.M.; Yin, S.; Chen, L. Optimization of nitrogen, phosphorus and potassium fertilization rates for overseeded perennial ryegrass turfon dormant bermudagrass in atransitional climate. Front. Plant Sci. 2018, 9, 487. [Google Scholar] [CrossRef] [Green Version]
  44. Purwin, C.; Stanek, M.; Lipiński, K.; Wierzbowska, J.; Nogalska, A.; Fijalkowska, M. Effect of a harvest time and cultivar on the chemical composition and in vitro ruminal dry matter degradability of perennial ryegrass (Lolium perenne L.). J. Elem. 2016, 21, 811–822. [Google Scholar] [CrossRef]
  45. Belanger, G.; Virkajarvi, P.; Duru, M.; Tremblay, G.F.; Saarijarvi, K. Herbage nutritive in less—Favoured areas of cool regions. Grassl. Sci. Eur. 2013, 18, 57–70. [Google Scholar]
  46. Baert, J.; Van Waes, C. Improvement of the digestibility of tall fescue (Festuca arundinacea Schreb.) inspired by perennial ryegrass (Lolium perenne L.). Grassl. Sci. Eur. 2014, 19, 172–174. [Google Scholar]
  47. Staniak, M.; Księżak, J. Chemical composition of Festulolium braunii-Trifolium pratense mixtures in relations to nitrogen fertilisation and the share of components. Water-Environ.-Rural Areas 2008, 8, 163–173. (In Polish) [Google Scholar]
  48. Szkutnik, J.; Kacorzyk, P.; Szewczyk, W. The content change of total protein and crude fibre depending on the dose of fertilization and phonological phase of grasses. Grassl. Sci. Pol. 2012, 15, 185–191. [Google Scholar]
  49. Zielewicz, W.; Wróbel, B.; Niedbała, G. Quantification of Chlorophyll and Carotene Pigments Content in Mountain Melick (Melica nutans L.) in Relation to Edaphic Variables. Forests 2020, 11, 1197. [Google Scholar] [CrossRef]
  50. Selzer, L.J.; Busso, C.A. Pigments and photosynthesis of understory grasses: Light irradiance and soil moisture effects. Russ. J. Plant Phys. 2016, 63, 224–234. [Google Scholar] [CrossRef]
  51. Olszewska, M.; Grzegorczyk, S.; Olszewski, J.; Bałuch-Małecka, A. A comparison of the response of selected grass species to water stress. Grassl. Sci. Pol. 2010, 13, 127–136. [Google Scholar]
  52. Golińska, B. Chlorophyll as an indicator of nitrogen status of Poa pratensis (Poaceae) in conditions of repeated defoliation of its sward. Fragm. Florist. Geobot. Pol. 2007, 9, 137–145. (In Polish) [Google Scholar]
  53. Olszewska, M.; Grzegorczyk, S. Effect of manganese deficiency on gas exchange parameters, leaf greenness (SPAD) and yield of perennial ryegrass (Lolium perenne L.) and orchard grass (Dactylis glomerata L.). J. Elem. 2008, 13, 589–596. [Google Scholar]
  54. Olszewska, M.; Grzegorczyk, S.; Olszewski, J.; Bałuch-Małecka, A. Effect of phosphorus deficiency on gas exchange parameters, leaf greenness (SPAD) and yield of perennial ryegrass (Lolium perenne L.) and orchard grass (Dactylis glomerata L.). J. Elem. 2008, 13, 91–99. [Google Scholar]
  55. Kozłowski, S.; Swędrzyński, A. Variability in the occurrence of chlorophyll and carotenoids dyes in Lolium perenne (Poaceae). Fragm. Flor. Geobot. Pol. 2007, 9, 163–171. (In Polish) [Google Scholar]
  56. Çelebi, Z.; Andiç, N.; Yilmaz, H. Determination of proper species mixtures for established turfgrass field in Van region. YYU J. Agric. Sci. 2010, 20, 16–25. [Google Scholar]
  57. Wood, C.W.; Reeves, D.W.; Himelrick, D.G. Relationships between chlorophyll meter readings and leaf chlorophyll concentration, N status, and crop yield: A review. Proc. Agron. Soc. N. Z. 1993, 23, 1–9. [Google Scholar]
  58. Hudson, D.; Guevara, D.; Yaish, M.W.; Hannam, C.; Long, N.; Clarke, J.D.; Bi, Y.M.; Rothstein, S.J. GNC and CGA1 modulate chlorophyll biosynthesis and glutamate synthase (GLU1/Fd-GOGAT) expression in Arabidopsis. PLoS ONE 2011, 6, e26765. [Google Scholar] [CrossRef]
  59. Havé, M.; Marmagne, A.; Chardon, F.; Masclaux-Daubresse, C. Nitrogen remobilization during leaf senescence: Lessons from Arabidopsis to crops. J. Exp. Bot. 2016, 68, 2513–2529. [Google Scholar] [CrossRef]
  60. Lyu, S.; Wei, X.; Chen, J.; Wang, C.; Wang, X.-M.; Pan, D. Titanium as a Beneficial Element for Crop Production. Front. Plant Sci. 2017, 8, 597. [Google Scholar] [CrossRef] [Green Version]
  61. Kovacik, P.; Hudec, J.; Ondrisik, P.; Poliakova, N. The effect of liquid Mg-Titanit on creation of winter wheat phytomass. Res. J. Agric. Sci. 2014, 46, 125–131. [Google Scholar]
  62. Ciepiela, G.A.; Godlewska, A.; Jankowska, J. The effect of biostimulant on yields of mixed grass/red clover stands and chlorophyll kontent in crop plant leaves under different nitrogen fertilisation regimes. Fresenius Environ. Bull. 2013, 22, 3700–3708. [Google Scholar]
  63. Zielewicz, W.; Kozłowski, S. Occurrence of chlorophyll and carotene dyes in forest grasses. Grassld. Sci. Pol. 2011, 14, 161–170. [Google Scholar]
  64. Kozłowski, S.; Kubiak, T.; Swędrzyński, A. Variability of chlorophyll dyes occurrence in leaf blades of Phragmites australis (Cav.) Trin. ex Steud. Grassl. Sci. Pol. 2014, 17, 53–60. (In Polish) [Google Scholar]
  65. Jodełka, J.; Sosnowski, J. Evaluation of nitrogen delivery methods to some grass species depending on the phosphorus and potassium fertilization. Fragm. Agronom. 2010, 27, 53–61. (In Polish) [Google Scholar]
  66. Gaborcik, N.; Zmetakova, Z. Chlorophyll (SPAD readings) and nitrogen concentrations in leaves of some forage grasses and legumes. Grassl. Sci. Pol. 2001, 4, 43–48. [Google Scholar]
  67. Olszewska, M. Effects of magnesium deficiency on gas exchange parameters, leaf greenness index (SPAD) and yields of Lolium perenne and Dactylis glomerata. Grassl. Sci. Pol. 2005, 6, 141–148. (In Polish) [Google Scholar]
  68. Falkowski, M.; Kukułka, I.; Kozłowski, S. Chemical Properties of Meadow Plants; Wydawnictwo Uniwersytetu Przyrodniczego w Poznaniu: Poznań, Poland, 2000; p. 132. (In Polish) [Google Scholar]
  69. Wyss, U.; Kessler, J. The intensity of grassland management influences the mineral contents of the grass. Agrarforschung 2002, 9, 292–297. [Google Scholar]
  70. Gaj, R.; Maciejewski, T.; Rębarz, K. Effect of irrigation and nitrogen fertilization on potassium content in the three grasses cultivated in field cultivation. Zesz. Nauk. Uniw. Przyr. Wroc. 2014, 599, 7–16. (In Polish) [Google Scholar]
  71. Grzebisz, W.; Bandurska, H. Potassium uptake by plants from soil—Mechanisms and conditions. J. Elem. 2004, 9, 27–36. (In Polish) [Google Scholar]
  72. Neto, G.B.; Reis, R.A.; Ruggieri, A.C. Impacts of limestone and nitrogen top dressing application on the potassium content in the soil profile and marandu-grass leaf concentration. Rev. Bras. Zootec. 2009, 38, 1170–1175. [Google Scholar] [CrossRef] [Green Version]
  73. Ciepiela, G.A.; Godlewska, A. The effect of the biostimulant Kelpak SL on selected macroelements in two grass species. Fresenius Environ. Bull. 2017, 26, 2779–2784. [Google Scholar]
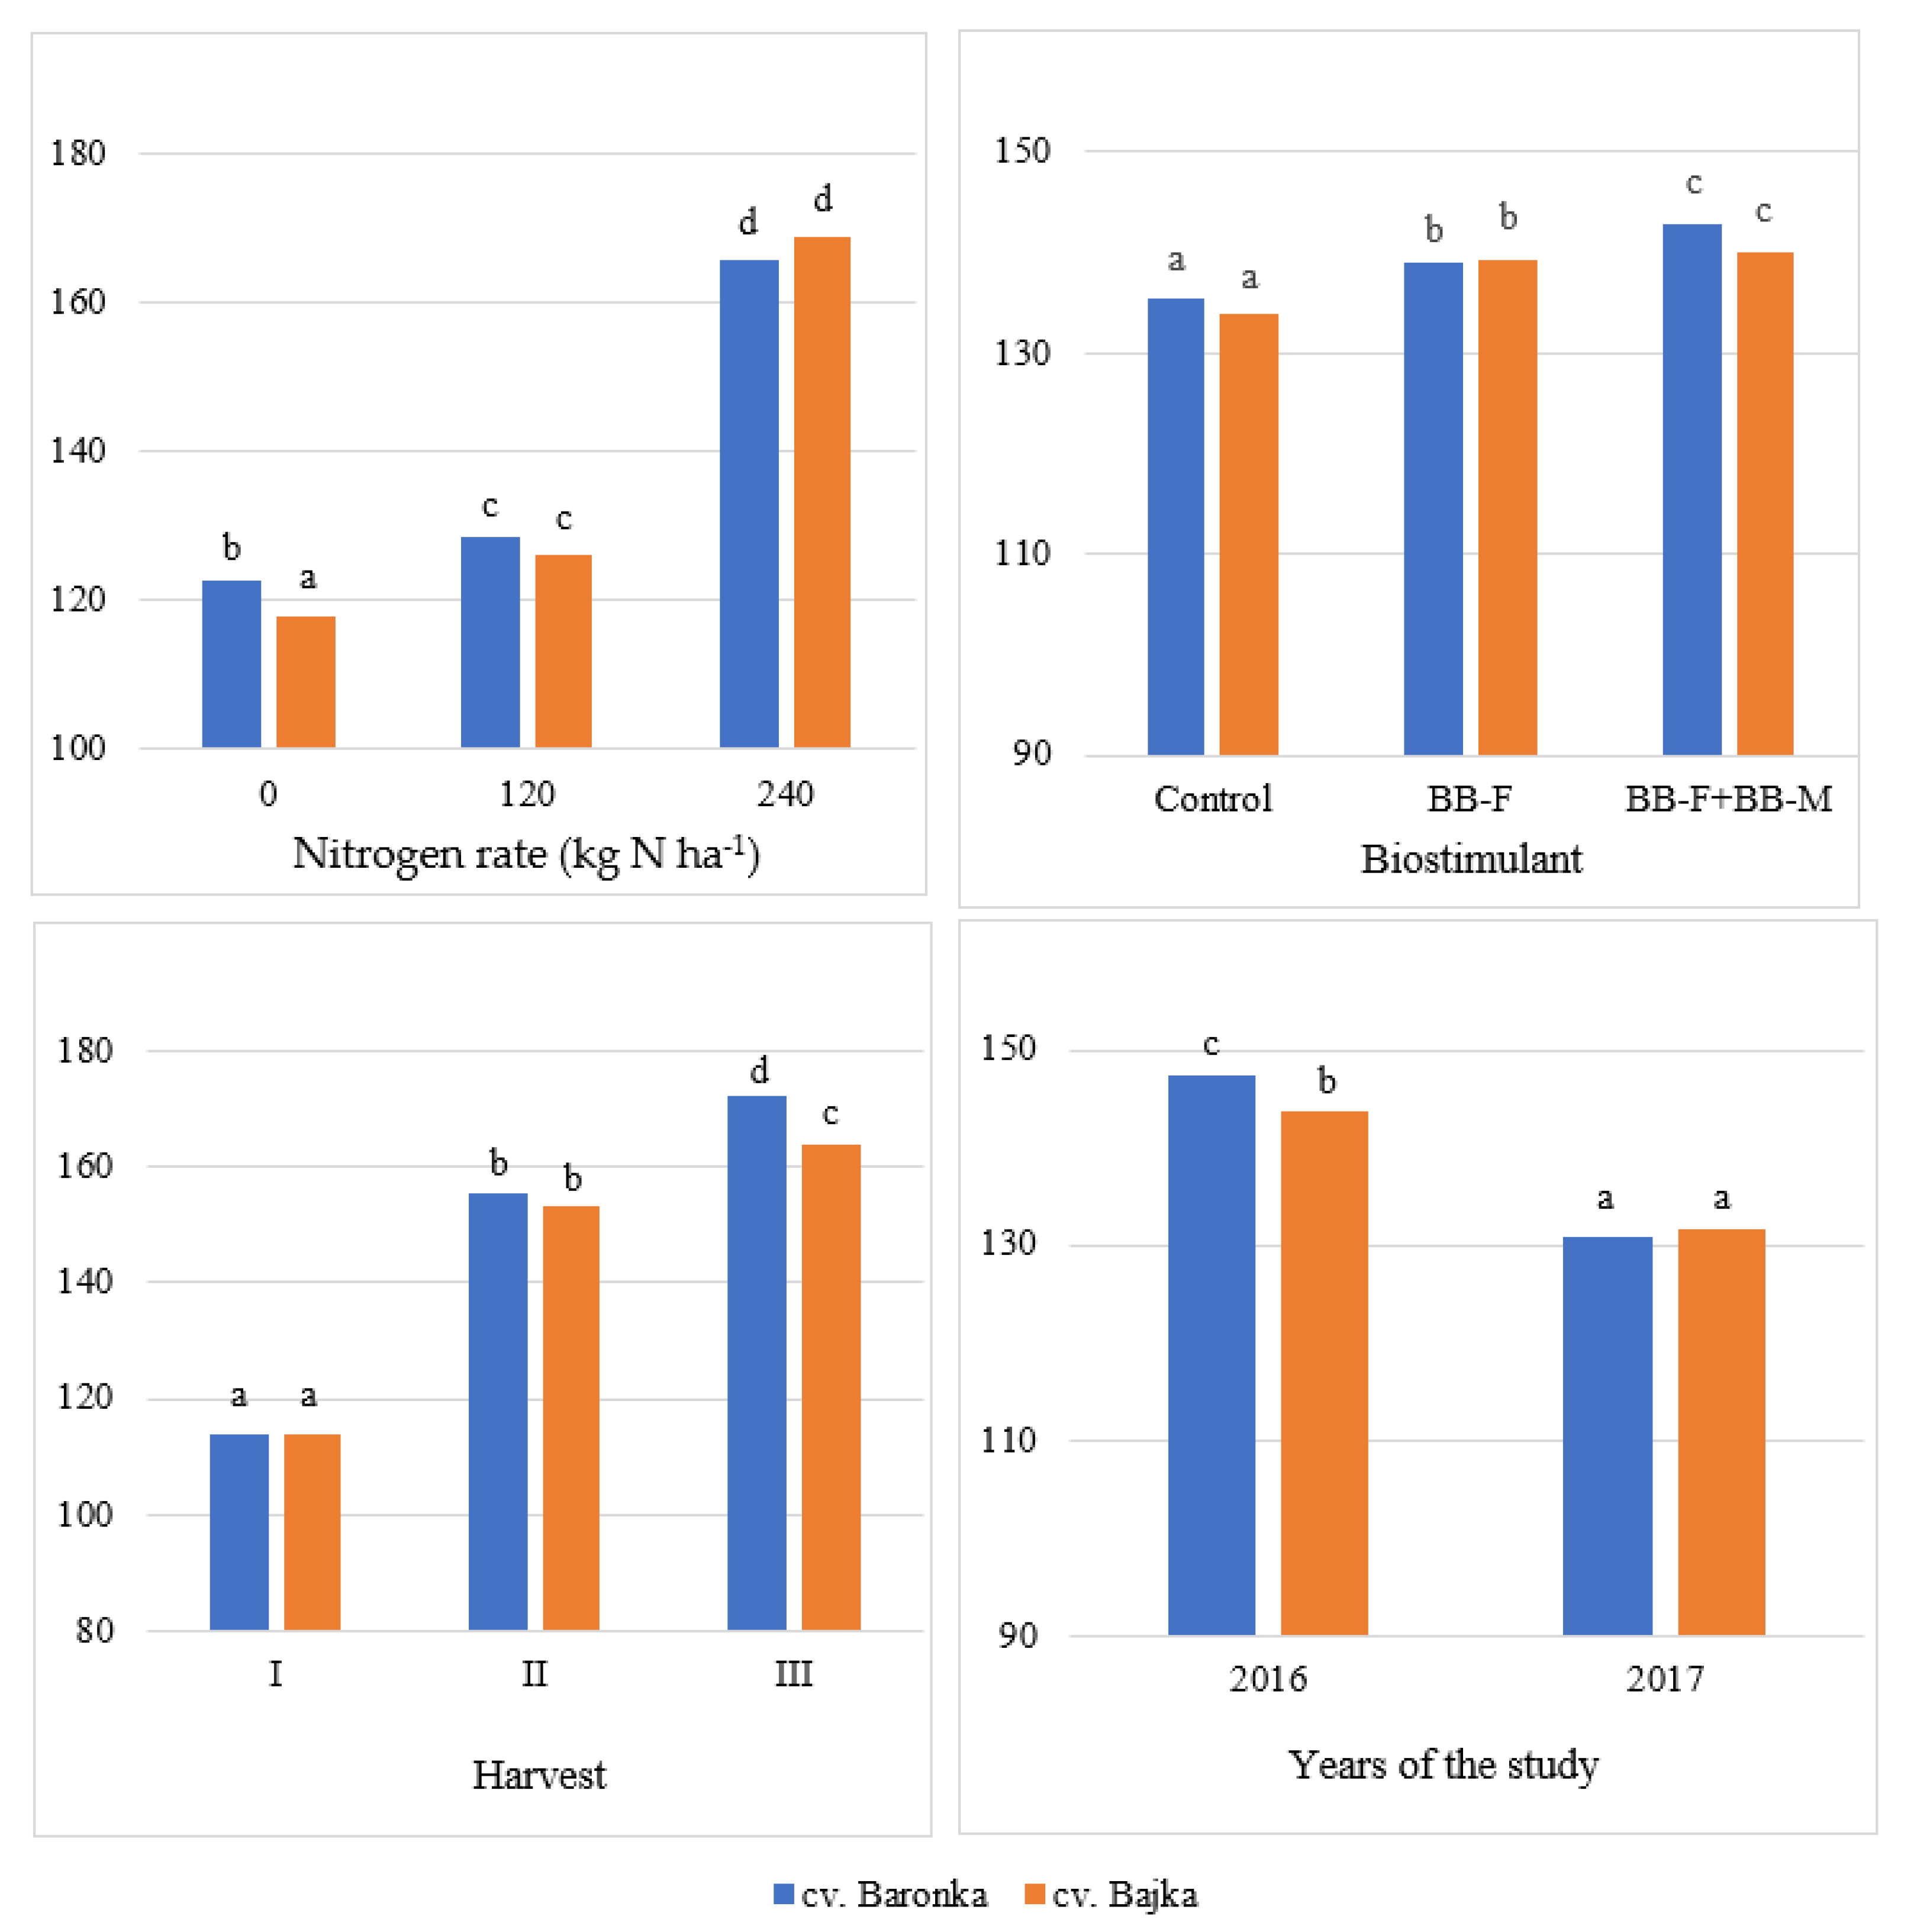
Figure 1. Relationships between the content of crude protein (g kg−1 DM) in the post-harvest biomass of the analyzed perennial ryegrass cultivars vs. nitrogen rate, biostimulant and years of the study (the same letter do not differ significantly at p < 0.05 in Tukey’s HSD test).
Agronomy 12 00826 g001
Figure 2. Relationships between the content of crude fiber (g kg−1 DM) in the post-harvest biomass of the analyzed perennial ryegrass cultivars vs. nitrogen rate, biostimulant and years of the study (the same letter do not differ significantly at p < 0.05 in Tukey’s HSD test).
Agronomy 12 00826 g002
Figure 3. Relationships between the content of chlorophyll (SPAD) in the biomass of the analyzed perennial ryegrass cultivars vs. nitrogen rate, biostimulant and years of the study (the same letter do not differ significantly at p < 0.05 in Tukey’s HSD test).
Agronomy 12 00826 g003
Figure 4. Relationships between the content of phosphorus (g kg−1 DM) in the post-harvest biomass of the analyzed perennial ryegrass cultivars vs. nitrogen rate, biostimulant and years of the study (the same letter do not differ significantly at p < 0.05 in Tukey’s HSD test).
Agronomy 12 00826 g004
Figure 5. Relationships between the content of potassium (g kg−1 DM) in the post-harvest biomass of the analyzed perennial ryegrass cultivars vs. nitrogen rate, biostimulant and years of the study (the same letter do not differ significantly at p < 0.05 in Tukey’s HSD test).
Agronomy 12 00826 g005
Figure 6. Relationships between the content of calcium (g kg−1 DM) in the post-harvest biomass of the analyzed perennial ryegrass cultivars vs. nitrogen rate, biostimulant and years of the study (the same letter do not differ significantly at p < 0.05 in Tukey’s HSD test).
Agronomy 12 00826 g006
Table 1. The Selyaninov hydrothermal coefficient during the growing season.
Years of the StudyMonth
AprilMayJuneJulyAugustSeptember October
20161.3 (fd)1.3 (fd)1.3 (fd)2.5 (w)1.3 (fd)0.5 (vd)5.54 (ew)
20173.4 (ew)0.7 (vd)1.6 (o)2.1(w)1.2 (fd)4.44 (ew)4.34 (ew)
vd—very dry, fd—fairly dry, o—optimal, w—wet, ew—extremely wet.
Table 2. Content of crude protein in perennial ryegrass biomass (g kg−1 DM).
FactorYears of the StudyMean
20162017
Cultivar
Baronka147.37 b130.77 a139.07 b
Bajka143.58 a131.65 a137.62 a
Nitrogen rate (kg ha−1)
0123.45 a117.19 a120.32 a
120131.97 b122.69 b127.33 b
240181.01 c153.76 c167.39 c
Biostimulant
Control140.26 a128.99 a134.63 a
BB-F145.95 b132.23 b139.09 b
BB-F + BB-M150.22 c132.42 b141.32 c
Harvest
I113.97 a107.96 a110.97 a
II154.33 b120.06 b137.20 b
III168.13 c165.62 c166.88 c
Means with the same letter do not differ significantly at p < 0.05 in Tukey’s HSD test.
Table 3. Content of crude fiber in perennial ryegrass biomass (g kg−1 DM).
FactorYears of the StudyMean
20162017
Cultivar
Baronka263.03 b265.64 b264.21 b
Bajka255.17 a256.64 a255.91 a
Nitrogen rate (kg ha−1)
0248.60 a250.60 a249.59 a
120265.00 b264.23 b264.62 b
240263.70 b268.22 b265.96 b
Biostimulant
Control261.06 b262.38 b261.72 b
BB-F262.46 b261.75 b262.11 b
BB-F + BB-M253.78 a258.92 a256.35 a
Harvest
I298.38 c271.96 c285.17 c
II256.39 b266,27 b261.33 b
III222.53 a244.82 a233.68 a
Means with the same letter do not differ significantly at p < 0.05 in Tukey’s HSD test.
Table 4. Leaf greenness index (SPAD).
FactorYears of the StudyMean
20162017
Cultivar
Baronka37.18 b35.37 b36.28 b
Bajka34.81 a32.95 a33.88 a
Nitrogen rate (kg ha−1)
033.37 a31.21 a32.29 a
12035.61 b33.69 b34.65 b
24039.01 c37.58 c38.29 c
Biostimulant
Control34.56 a33.41 a33.99 a
BB-F35.88 b33.22 a34.55 a
BB-F + BB-M37.54 c35.85 b36.70 b
Harvest
I37.18 b36.46 c36.82 c
II35.26 a31.55 a33.40 a
III35.55 a34.47 b35.01 b
Means with the same letter do not differ significantly at p < 0.05 in Tukey’s HSD test.
Table 5. Content of phosphorus in perennial ryegrass biomass (g kg−1 DM).
FactorYears of the StudyMean
20162017
Cultivar
Baronka3.09 a3.19 a3.14 a
Bajka3.15 b3.37 b3.26 b
Nitrogen rate (kg ha−1)
03.18 b3.20 b3.19 b
1202.99 a3.06 a3.03 a
2403.19 b3.57 c3.38 b
Biostimulant
Control3.09 a3.31 b3.20 ab
BB-F3.08 a3.33 b3.21 b
BB-F + BB-M3.18 b3.19 a3.19 a
Harvest
I3.32 b2.86 a3.09 b
II2.64 a3.04 b2.84 a
III3.39 b3.94 c3.67 c
Means with the same letter do not differ significantly at p < 0.05 in Tukey’s HSD test.
Table 6. Content of potassium in perennial ryegrass biomass (g kg−1 DM).
FactorYears of the StudyMean
20162017
Cultivar
Baronka21.74 b14.45 b18.10 b
Bajka19.67 a14.09 a16.88 a
Nitrogen rate (kg ha−1)
019.88 a13.93 a16.90 a
12020.75 b14.27 b17.51 b
24021.48 c14.61 c18.05 c
Biostimulant
Control21.09 b14.29 a17.69 b
BB-F21.03 b14.28 a17.66 b
BB-F + BB-M19.99 a14.24 a17.11 a
Harvest
I17.79 a13.66 b15.73 a
II24.88 c13.06 a18.97 c
III19.44 b16.09 c17.76 b
Means with the same letter do not differ significantly at p < 0.05 in Tukey’s HSD test.
Table 7. Content of calcium in perennial ryegrass biomass (g kg−1 DM).
FactorYears of the StudyMean
20162017
Cultivar
Baronka6.68 a6.57 a6.62 a
Bajka6.84 b7.42 b7.13 b
Nitrogen rate (kg ha−1)
07.03 b6.83 a6.93 b
1206.27 a7.18 b6.72 a
2406.98 b6.99 ab6.99 b
Biostimulant
Control6.88 b7.60 c7.24 c
BB-F6.42 a6.49 a6.46 a
BB-F + BB-M6.98 b6.91 b6.95 b
Harvest
I5.14 a5.42 a5.28 a
II8.46 c7.86 b8.16 c
III6.69 b7.71 b7.20 b
Means with the same letter do not differ significantly at p < 0.05 in Tukey’s HSD test.
Publisher’s Note: MDPI stays neutral with regard to jurisdictional claims in published maps and institutional affiliations.