Article

Simulation and Experiment of the Spiral Digging End-Effector for Hole Digging in Plug Tray Seedling Substrate

1
College of Mechanical and Electronic Engineering, Northwest A&F University, Yangling, Xianyang 712100, China
2
Key Laboratory of Agricultural Internet of Things, Ministry of Agriculture and Rural Affairs, Yangling, Xianyang 712100, China
3
Shaanxi Key Laboratory of Agricultural Information Perception and Intelligent Service, Yangling, Xianyang 712100, China
*
Author to whom correspondence should be addressed.
Agronomy 2022, 12(4), 779; https://doi.org/10.3390/agronomy12040779
Submission received: 26 February 2022 / Revised: 9 March 2022 / Accepted: 22 March 2022 / Published: 24 March 2022
(This article belongs to the Section Agricultural Biosystem and Biological Engineering)

Abstract

:
Usually the planters used in agricultural machinery face two problems: The planters have to spread the soil twice using the tray seed planter, and it is difficult for them to dig the holes before planting. This study has designed a spiral digging end-effector to dig holes in parallel effectively and quickly so that the seeds can be planted in the holes easily. A spiral digging end-effector was designed with five spiral bits, a synchronous belt, a cylinder, a gear motor, and a connecting plate based on the tray size and the pumpkin seed characteristics. Before the optimization of the end-effector’s parameters, the substrate discrete element model parameters were calibrated using the method of “material funneling” applied for the EDEM discrete element model simulation. The contact parameters and model parameters (substrate–substrate static friction coefficient, substrate–substrate rolling friction coefficient, and surface energy) that have significant impacts on the substrate AOR (angle of repose) were selected by applying the Plackett–Burman Design and the path of steepest ascent method, and their respective optimal value range were determined. The optimal parameter values were obtained through the Central Composite Design response surface analysis test, and the parameters of the spiral digging end-effector were optimized combining the substrate particle simulation. The verification test results indicate that the substrate discrete element model parameters were accurate and reliable if the substrate static friction coefficient was 0.427; the substrate rolling friction coefficient was 0.039, and the surface energy was 0.228. When the cone angle is 30°, the spiral angle is 80°, and the rotational speed is 240 r/min, the section width at the hole depth of 13 mm is 23.1 mm, and the particle overflow proportion is about 2.05%. Compared with the protrusions penetrating end-effector, soil porosity is increased, and soil aeration is improved. Therefore, the spiral digging end-effector can effectively and quickly dig holes in the seedling substrate and can sow pumpkin seeds, which provides a research basis for the design and improvement of automatic pumpkin seed sowing equipment.

1. Introduction

The development of agriculture has solved the great problem of insufficient vege-table supply in China from a long time ago, and the green leaf product industry is able to provide sufficient stock for the people all year round. Seedling cultivation is the first and most important link in agricultural production. It is also an important guarantee for the high yield of vegetables and their quality. The precision seed planter with tray is the main equipment used for seedling and production. They can lower the labor intensity of seeding, increase seeding efficiency, prepare well for the subsequent planned production, and improve the seedling quality [1].
Seeds must be buried in the soil so that they can germinate and root better. The commonly used precision seed planter with tray spreads the subsoil first, then sows the seeds on the subsoil and spreads the soil again to cover the seeds [2,3]. This process involves spreading the soil twice and is more complicated. The pointed head in cone shape of some planters will be used to penetrate the substrate to dig a hole in the center of it to put the seeds in and then cover them with soil [4,5,6]. However, when the pointed heads pierce the soil, the seedling substrate would sink into the subsoil, become hardened and suffocate the seeds and thus affect seedling growth. This study proposed a new way to carry out the seeding process: using spiral bits driven by the cylinder and letting it drill into the soil. As the cylinder retracts, the end-effector spirals up out of the soil with the seedling substrate, thus forming a hole.
With the development of computer technology, discrete element simulation, which is a new concept for the virtual simulation of the dynamic behavior of seedling substrate particles, has emerged [7,8,9]. It is helpful to increase the research and development efficiency and provide theoretical support for the equipment design and optimization. Hence, EDEM software was used in the study to simulate and optimize the structural parameters and kinetic parameters of the spiral digging end-effector. The seedling substrate model must be created in the EDEM software with the model parameters defined if the discrete element method is to be used. The reliability of the results depends on the accuracy of those parameters. A large number of studies have been conducted by scholars on the agricultural granular particle discrete element model parameter calibration in the agricultural engineering field [10,11,12], and fewer studies have been carried out on the parameter calibration of seedling substrate discrete element model.
This study designed a spiral digging end-effector for planting pumpkin seeds and other large particle seeds. The simulation test and physical test of AOR (angle of repose) were conducted superlatively to obtain the seedling substrate discrete element model parameters necessary for the simulation and optimization of the spiral digging end-effector and to complete the seedling substrate parameter calibration. In the test, the Plackett–Burman Design (PBD) and the path of steepest ascent method were conducted to select the contact parameters and model parameters that had a significant influence on the AOR. Through a Central Composite Design response surface analysis test and simulation analysis of the structural parameters and kinetic parameters of the spiral digging end-effector, a group of suitable structural parameters and kinetic parameters were obtained, which laid the foundation for the design and improvement of the automatic pumpkin seed planting equipment.

2. The Design of the Spiral Digging End-Effector

2.1. Physical Properties of the Test Materials

The seeding tray used for the test is made of PVC material with 5 × 10 holes in total. The tray size was 540 × 280 × 50 mm in length, width, and height, and the space between the holes was 50 mm. Black pumpkin seeds were used in the study because of their well-developed rooting system and fast growth and good resilience against adversity and diseases. They are often used as grafting rootstock. The vernier caliper with digital display (0.01 mm accuracy) was used for the measurement of 200 seeds, and Figure 1 shows the dimension distribution.

2.2. The Working Principle of the Spiral Digging End-Effector

The pumpkin seeds are usually planted 10 mm~15 mm below the surface of the soil, and a hole needs to be dug in the center of the plug tray substrate for sowing. To avoid the compaction of the substrate during digging and affecting the germination and growth of seeds, the spiral digging end-effector was designed, as shown in Figure 2. The end-effector is composed of the following parts: five spiral bits, a synchronous belt, a cylinder, a gear motor, and a connecting plate. An MGPM20-50 dual-axial cylinder (SMC Corporation, Tokyo, Japan) was connected to the connecting plate; the five spiral bits were fixed on the connecting plate through the bearing with 50 mm of space between each other. Since the electric motor will drive the five spiral bits to rotate simultaneously, and the driving ratio of electric motor gears and the spiral blade gears is 1:6, a high rotation torque of the electric motor is required. It was found during the trial test that the faster the spiral bits rotated, the easier the substrate would lose and fall apart. That’s why the ZGA37RG electric motor (Zhejiang Zhengke Electric Motor Co., Ltd. Yueqing, China) equipped with a ZYTD-32-C deceleration box was selected. It had a loading rotational speed of 60 r/min, and the loading moment was roughly 1 N·m. The electric gear motor was fixed on the connecting plate, and the driving gear would drive one spiral blade to rotate, and the remaining four spiral bits would be driven by the synchronous gear belt.
During digging, the conveyor belt would transport the tray right under the spiral digging end-effector. At this moment, the gear motor would drive the five spiral bits to rotate (Figure 2I), and at the same time, the end-effector would move downwards by pushing the cylinder (Figure 2Ⅱ). The spiral bits would dig into the substrate and keep rotating for several seconds. Finally, the cylinder was retracted, and a hole was formed.

2.3. Spiral Bit Design

The spiral bit includes rotating shaft, drill tip, and spiral blade. During the digging operation, the spiral bit rotated around the rotating shaft. The substrate particles below the rotating shaft were transported to the spiral blade by the drill tip. After that, the substrate particles slid upward along the spiral blade under the cutting and rotating action. Thereby, the substrate was lifted, and the hole was formed.

2.3.1. Drill Tip Design

In order to prevent the rotating shaft from compacting the substrate, and at the same time centering and transporting the substrate particles laterally, the drill tip was set at the end of the rotating shaft. Drill tips include four types: flat triangle, twisted wing triangle, small conical spiral, and fork. Among them, the small conical spiral drill tip has better soil cutting resistance and working stability and has a lifting effect on the particles, while the other three exert downward pressure on the substrate particles. Therefore, the drill tip of small conical spiral was adopted in this paper.
According to the diameter of the rotating shaft, the bottom radius of the drill tip was designed to be 2.5 mm, and the height was 5.0 mm. In order to improve the lateral transport capacity of the drill tip on the substrate particles, 4 spiral blades were evenly distributed and rotated 1/4 circle, and the blades protruded 2.5 mm from the drill tip. The main dimensions of the drill tip are shown in Figure 3.

2.3.2. Spiral Blade Design

Since the shape of sowing holes was the frustum of a cone, the loose substrate collapsed easily after the cylindrical spiral blade dug the holes, and the stability of the groove shape was poor. The screw pitch of the spiral blades increased continuously from bottom to top, which was beneficial to avoid the extrusion and blockage of the substrate between the blades [13,14]. The single-line spiral blade was not easily blocked by the soil. Therefore, the single-line variable pitch conical spiral blade was designed [15]. The helix line of the spiral blade was a conical helix with constant inclination and variable pitch (Figure 4), and its parameter equations were Equation (1) and the polar coordinate Equation (2).
{ x = n e m t cos t y = n e m t sin t z = b e m t
σ = k e m t
where n = a sinγ, b = a cosγ, m = sinγ cosα, k = a tanα, a is a constant, γ is the cone angle (°), t is an independent variable, and α is the spiral angle (°).
Since the sowing holes were the frustum of a cone, the upper diameter D should be smaller than the hole diameter of the plug, and the lower diameter d should be larger than the long axis of the seed. The sowing depth H0 was about 10~15 mm. So, D = 45 mm, d = 22 mm, and H = 15 mm. According to the geometric relationship of the envelope of the conic curve (Equation (3)), the maximum γ was about 37.5°.
D = 2 H tan γ + d

3. Seedling Substrate Particle Discrete Element Model Parameter Calibration

The seedling substrate particle discrete element model parameters were needed for the simulation analysis and optimization of the spiral digging end-effector before the discrete element simulation. However, no particle model parameters available for the test were found in the literature. Hence, a combinational method of simulation test and the physical test was adopted for the first time to calibrate the parameters of the substrate simulation model.

3.1. Test Method

The “Material funneling” method was adopted in the physical test, and the physical AOR was obtained by measuring the substrate particle pile. Then the EDEM software was used for the simulation test. In this procedure, the substrate discrete model parameters were filtered using the Plackett–Burman Design to obtain the parameters that had a significant impact on the AOR. The path of steepest ascent method was carried out to determine the optimal value range of the parameters. The Central Composite Design (CCD) response surface method (RSM) was used to establish the regression model involving the substrate AOR and the significant parameters. The optimal AOR simulation parameters were obtained by solving the regression equation, the target value of which was the physical AOR.

3.2. Physical Test on the Substrate AOR

The substrate used in this study was produced by Shaanxi Qili Agriculture Co., Ltd., and the moisture content was detected at (30.55 ± 0.22%) using the halogen moisture tester (HE53, Mettler-Toledo Company, Zurich, Switzerland). A mixture of substrate and water was created by putting 100 g substrate in the flask and adding V mL distilled water to it. The substrate density of (1.38 ± 0.04 g/cm3) was calculated according to Equation (4). The moisture content and bulk density were measured three times.
ρ s = 100 200 V
A total of 500 substrate particles were measured with vernier caliper with digital display; the particle diameters conform with positive distribution, as shown in Figure 5.
Figure 6 illustrates the device components and the size of each component. About 50 g substrate was poured through the funnel at a constant speed for about 5 s to form the particle pile on the steel plate. The actual measurement of AOR was conducted using the image processing method. The open-source software OpenCV 3.4 based on Python was used for the particle pile image processing. First, the redundant background of the image was eliminated to obtain the original image (Figure 7a). After that, grayscale (Figure 7b) and binarization methods (Figure 7c) were used to process the original image (Figure 7a), followed by the Canny edge detection algorithm to extract the boundary profile (Figure 7d) and then save the file. Last, Digitizer of Origin 2019b software was used to import the processed boundary profile image of the particle pile and obtain its pixel spot coordinates after setting the image pixel and coordinate axis (Figure 7e). The non-linear fitting was used to obtain the Gaussian distribution function. Please refer to the Gaussian function deduction process to obtain the AOR of the substrate particles [16,17]. The test was repeated 20 times for the average value. The ultimate actual substrate AOR was (39.03 ± 3.29°). The measurement error was ±3.29°, which fitted the purpose of this research. The same method was applied for the measurement of the substrate simulation test AOR.

3.3. Simulation Model

3.3.1. Substrate Particle Contact Model

At present, the traditional interparticle contact models are mainly JKR Cohesion, Linear Cohesion, Bradley, DMT, and Hertz–Mindlin with bonding, etc. These contact models cannot describe the stress change process of bonded elastic–plastic particles effectively. The main components of the seedling substrate include peat, grass charcoal, wood chips, etc. The substrate contains some moisture, and there is a complicated interaction between the particles, and they are adhesive. Elastic and plastic deformation will happen to the wet particles during compression. A certain amount of overlap will remain between the particles after the pressure is unloaded, and the contact area between the particles will impact the adhesion intensity directly [18,19]. Hence, the Edinburgh Elasto-Plastic Adhesion (EEPA) model was selected as the contact model of substrate particles and the Hertz–Mindlin no slip model for the contact model of the substrate and the steel cylinder [20,21,22].

3.3.2. Substrate and Funnel Model

The substrate and the funnel shape model must be created before the simulation. The shape of the substrate particle is close to a sphere. The particle size distribution range is normally small, and the Rayleigh time step of the numerical simulation is limited by the smallest particle size in the model. Hence, according to the substrate particle diameter distribution, the particle diameter was set at 1.38 mm and the standard deviation at 0.04 mm. According to the test, the simulation time was reduced by over 90% if the positive distribution simulation was applied compared with multiple distributions of the particle diameter (Figure 5). According to Han et al. [23] and COSMOS material base [24], the substrate particle shearing modulus was in the range of 2.9~10.0 MPa. The Poisson’s ratio of the substrate particles was 0.464, referring to the method of Wang et al. [25].
A 3D model based on the same funnel and steel plate used in the test was created in Solidworks and saved as an STP file and imported into EDEM. The Poisson’s ratio was 0.3; the density was 7.865 g/cm3, and shear modulus was 79,700 MPa after referring to the relevant literature [26].

3.3.3. Setting of Simulation Parameters

In the simulation test, 50 g particles were generated at the rate of 10 g/s. The Rayleigh time step of the simulation test was about 20%; the total simulation time was 5.5 s; the data-saving interval was 0.1 s, and the grid size was 2.5 times the minimum particle radius.

3.4. Simulation Test

3.4.1. Plackett–Burman Design Test for Filtering Significant Parameters

Not all contact parameters and contact model parameters had a significant impact on the AOR. The insignificant parameters cannot be calibrated based on the AOR, or the calibration result would be inaccurate [27]. The parameters to be input in the EDEM of the EEPA model include constant pull-off force (f0), surface energy (Δγ), contact plasticity ratio (λp), slope exp. (n), tensile exp. (X), and tangential stiff multiplier (ktm). In order to reduce the factors that will influence the test, we defined f0 = 0 and n = 1.5, according to the reference [22].
The Design-Expert software was employed for the PBD test design and analysis. The substrate particle shear modulus, contact parameter (substrate–substrate restitution coefficient, substrate–substrate static friction coefficient, substrate–substrate rolling friction coefficient, substrate–steel restitution coefficient, and substrate–steel static friction coefficient), and contact model parameters (surface energy, contact plasticity ratio, tensile exp., and tangential stiff multiplier) were filtered, and the parameters that are influential on the AOR were selected. According to the reference literature [28,29,30,31], the substrate–substrate restitution coefficient range was 0.10~0.70; the static friction coefficient range was 0.30~1.16, and the rolling friction coefficient range was 0.00~0.56. The restitution coefficient range between substrate and steel plate was 0.1~0.6, and the static friction coefficient range was 0.20~0.60. According to the reference of Xie et al. [22], Ma et al. [32], Wang et al. [33], and Thakur et al. [18], the surface energy range was 0.00~1.00 J·m−2; the contact plasticity ratio range was 0.30~0.70; the tensile exp. range was 1.50~5.00, and the tangential stiff multiplier range was 0.05~1.00.
The factors levels of the PBD test are shown in Table 1, and 13 test schemes and results of 10 factors are shown in Table 2.
After the variation analysis on the test result using Design-Expert software, the influential effect and reliability analysis of 10 parameters on AOR are shown in Table 3. The results show that the static friction coefficient and the rolling friction coefficient between the substrate and the surface energy had a significant effect on the AOR (p < 0.05), while the rest of the parameters demonstrated no significant effect on it. The variation coefficient, CV = 3.03%, was less than 15%, indicating that the test results were all normal and worthy of analysis. The calibration determination coefficient Radj2 = 0.9956 was greater than 0.8, indicating a good fitting of the regression model. Precision is the effective signal to noise ratio. This value is normally the bigger the better and should be greater than 4, generally speaking. The precision of this test was 46.4244, indicating good reliability of the test.

3.4.2. Path of Steepest Ascent Method for Determining the Optimal Value Range of the Significant Parameter

Before applying the RSM method to establish the regression model to solve the optimal value, it has to be verified that the optimal value of the factors is within the selected range of the highest and lowest values, and the path of steepest ascent method can be used to determine the optimal value range of the factors. According to the PBD test results, the middle level of the factors that had an insignificant impact on the AOR, namely, the substrate particle shear modulus of 6.45 MPa, substrate–substrate restitution coefficient 0.4, substrate–steel restitution coefficient of 0.35, substrate–steel static friction coefficient of 0.4, contact plasticity ratio of 0.5, tensile exp. of 3.25, and tangential stiff multiplier of 0.525. The path of steepest ascent method on 3 significant parameters (C-substrate–substrate static friction coefficient, D-substrate–substrate rolling friction coefficient, and G-surface energy) was conducted with reference to the PBD test factor level table. Meanwhile, the relevant error of simulative substrate AOR and the actual value were calculated. The test scheme and results are shown in Table 4.
The results showed that as C, D, and G increased; the substrate simulation AOR increased, and the relative error of the simulative and the actual AOR decreased first and then increased. Since the test result of the second group demonstrated the smallest relative error, the optimal range of the 3 significant parameters was selected in the proximity of that selected for the second group. Hence, the levels selected for the 1st, 2nd, and 3rd groups were selected for the RSM test, and a regression model was established to solve the optimal values of the parameters.

3.4.3. Establish the Regression Model Based on the RSM to Solve Significant Parameters

The optimal parameters were determined by adopting the RSM test during the CCD test referring to the path of steepest ascent method results. The middle level was selected for the nonsignificant parameters as in Section 3.4.2., and the simulation factor code for the significant parameters was shown in Table 5. A total of 23 testing spots were included in the CCD test scheme, which included 14 analysis factors and 9 zero-point estimation errors. The test design scheme and the response values are shown in Table 6.
The quadratic regression model was obtained by analyzing the CCD test results using Design-Expert software. Variance analysis results of the quadratic regression model are shown in Table 7. The p value of the regression model was <0.01, indicating a very significant relationship between the AOR and regression equation. The p value of lack of fit was 0.6548 (>0.05), indicating a small percentage of abnormal errors in the actual fitting and the regression equation and a good fitting. The variation coefficient CV = 4.57% indicated good test reliability. The determination coefficient R2 = 0.9227 and the calibration determination coefficient Radj2 = 0.9584 indicated a good regression equation reliability. The precision = 27.1262 indicated a good precision of the regression model. In addition, C, D, G, CD, and C2 had an extremely significant effect on the AOR of the substrate (p < 0.01). The interaction term coefficients CG had a significant effect on the AOR (p < 0.05). DG, D2, and G2 had no significant influence on the AOR (p > 0.05).
The quadratic regression model was optimized by eliminating the items with insignificant impact. The variance analysis results of the optimized regression model are shown in Table 8, including the following: CV = 4.53%, R2 = 0.9378, Radj2 = 0.9590, and Adequate Precision = 32.6773. The fitting, reliability, and accuracy of the regression equation were improved after optimization. The optimized regression equation is as follows:
AOR = 15.02 + 74.47C + 1.14D + 36.48G + 182.14CD − 37.66CG − 85.29C2

3.5. Verification Test of Parameter Calibration

The Design-Expert software was used to solve the optimal value of the optimized regression equation with the angle of 39.03° as the target. Several groups of AOR were simulated and verified, and a group of optimal solutions closest in the shape of the physical test was obtained, namely, the substrate–substrate static friction coefficient was 0.427; the substrate–substrate rolling friction coefficient was 0.039, and the surface energy was 0.228. EDEM software was used for the substrate AOR simulation test, and an intermediate level was selected for the nonsignificant parameters. The other settings were the same as the previous ones. The simulated substrate AOR was 38.51° as tested. The relative error with the actual substrate AOR 39.03° was 1.33%, indicating the reliability of the optimal values of 3 significant parameters. The comparison result between the simulation test and the physical test is shown in Figure 8, from which we can find that the respective substrate particle pile contours are similar.

4. Simulation Analysis and Optimization of the Spiral Digging End-Effector

4.1. Experimentation Method

4.1.1. End-Effector Parameter Optimization

Due to the fact that the planting depth of pumpkin seeds is between 10~15 mm, the digging performance of the spiral digging end-effector means the cross-sectional width W was defined when the planting depth reached 13 mm (as shown in Figure 9) and by particle overflow percentage and dig time. The particle overflow percentage is the percentage of spilling substrate particles in the original particles after spiral digging. The dig time is the time from the spiral bit down to the stable shape of the substrate hole. The smaller the dig time, the higher the digging efficiency.
According to the pre-experimental results, the digging performance of the spiral digging end-effector was mainly influenced by the spiral bit structure parameters and rotational speed of the end effector. The spiral bit structure parameters mainly included the cone angle and the spiral angle. Combined with the pre-experiment results, a single factor test was carried out. Since the maximum γ was 37.5°, the cone angles were 25°, 27.5°, 30°, 32.5°, and 35°, and the spiral angles were 65°, 70°, 75°, 80°, and 85°, and the rotational speeds were 60, 120, 180, 240, 300, and 360 r/min. On the basis of the single factor test, the value range of each factor in the three-factor and three-level orthogonal test was obtained, as shown in Table 9. Each test was repeated three times, and the average value was taken as the test result.

4.1.2. Creating Simulation Model and the Determination of Parameters

According to the seedling substrate calibration results, the EEPA model was selected as the substrate particle contact model and the Hertz–Mindlin no slip model as the contact model between substrate and tray and the spiral bits. Please refer to the above-mentioned values for the particle size, Poisson’s ratio of the model, shear modulus, contact parameters, and contact model parameters.
The spiral bits and the tray were modeled and assembled in SolidWorks, and the file was saved as an STP file and imported into EDEM, and the boundary model was obtained. In EDEM software, the tray was used as a particle generation vessel, and 25,000 particles were generated at a speed of 35,000 piece/s. The Rayleigh time step was roughly 20%, and the grid size was 2.5 times the minimal particle radius.

4.1.3. Method of Measuring the Bulk Density of the Substrate

The greater the soil porosity, the better its air permeability, which is beneficial to the growth of plant roots [34]. At the same time, soil bulk density is negatively correlated with soil porosity [35]. Therefore, the spiral digging end-effector and the traditional protrusions penetrating end-effector (as shown in Figure 10) were used for the digging test. The upper and lower surface area (S1 and S2) and the height (Hs) of the substrate were measured, and the substrate volume of the truncated pyramid (V0) was calculated according to Equation (6).
V 0 = [ S 1 + S 2 + ( S 1 S 2 ) ] × H s / 3
The volume of the hole (the shape of the hole of the spiral end-effector was a cone, and the shape of the traditional protrusions penetrating end-effector was a truncated pyramid) was recorded as V1, and the weight of the substrate (m) was weighed. The bulk density (ρb) of the substrate was calculated according to Equation (7).
ρ b = m V 0 V 1

4.2. Results and Analysis

4.2.1. Simulation Results and Analysis

(1) Single factor test
Figure 11 shows the effects of cone angle, spiral angle, and rotational speed on cross-section width, particle overflow percentage, and dig time under the simulation test.
Figure 11a shows that with the increase of the cone angle, both the cross-section width and the particle overflow percentage increased, while the dig time had no obvious change. When the cone angle was less than 30°, the particle overflow percentage was less than 1.5% due to the small hole. At the same time, the smaller cone angle caused the substrate particles to slip and collapse, which cannot meet the requirement of 22 mm cross-section width. On the contrary, when the cone angle was 35°, the particle overflow percentage was higher than 7.2%. Therefore, considering all the test indicators, the cone angle was 27.5~32.5°.
Figure 11b shows that as the spiral angle increased, the particle overflow percentage decreased. The results show that when the spiral angle was small, the pitch was large, and at the same time, more substrates were cut laterally, and the longitudinal lifting ability of the substrates was poor, resulting in the accumulation and overflow of substrate particles. As the spiral angle increased from 65° to 80°, the cross-section width increased from an average of 21.4 mm to 22.7 mm, and the dig time decreased from 3.00 s to 2.54 s. But when the spiral angle continued to increase to 85°, the section width decreased slightly (21.9 mm), and the dig time increased slightly (2.68 s). Therefore, considering all the test indicators, the spiral angle was 75~85°.
Figure 11c shows that with the increase of the rotational speed of the spiral bit, the cross-section width and particle overflow percentage showed an obvious upward trend, while the dig time gradually decreased. The results show that the greater the rotational speed, the greater the longitudinal lifting force of the particles, the higher the hole digging efficiency, and the greater the kinetic energy of the substrate particles, which easily caused the particles to splash and increase the overflow. However, when the rotational speed was less than 180 r/min, although the particle overflow percentage was very low, the section width could not meet the seeding requirements, and the efficiency was low. Therefore, considering all the test indicators, the rotational speed was 180~300 r/min.
(2) Analysis of variance
Table 10 shows the orthogonal test results of the spiral bits to dig holes. γ, α, and r represent the levels of the cone angle, the spiral angle, and the rotational speed. Table 11 shows the results of variance analysis. The primary and secondary orders of the experimental factors affecting the cross-section width, particle overflow percentage, and dig time were: γ > r > α, γ > α > r, and r > α > γ. When the cone angle was too large, the particle overflow percentage was large. However, if the cone angle was too small, the cross-section width could not meet the requirements of sowing. The spiral angle had no significant effect on the cross-section width. In addition, when the spiral angle was small, the particles overflowed more, and when the intermediate level was taken, the dig time was short. When the rotation speed was small, the dig time was longer, which affects the efficiency of digging. However, the larger the rotational speed, the more particles overflow. Therefore, the best combination of parameters for digging holes was γ2 α2 r2; the cone angle was 30°, the spiral angle was 80°, and the rotational speed was 240 r/min.
Since γ = 30°, α = 80°, and a = 22, the parameter equations of the helix line were Equation (8)
{ x = 11 e 0 . 087 t cos t y = 11 e 0 . 087 t sin t z = 19 . 05 e 0 . 09 t
where t ∈ [0, 450°].

4.2.2. Simulation Test Verification

First of all, the spiral bit model (Figure 12(1)) was designed and imported into EDEM. The substrate particles (Figure 12(2)) were put into the plug tray (Figure 12(3)) through the particles factory (Figure 12a), and the natural settlement of those particles was simulated (Figure 12b). Then the spiral bit rotated at a speed of 240 r/min, spun into the substrate particles (Figure 12c), and rotated for 2.09 s (Figure 12d). Finally, the spiral blade was lifted up (Figure 12e), and a hole was formed (Figure 12f).
The width of cross-section of 23.1 mm at the depth of 13 mm was obtained. And then, an optimized spiral digging end-effector was used, as shown in Figure 13, to carry out the digging test. In order to obtain an accurate hole profile, when the digging was finished, the hole profile was measured by the self-made, small-sized soil profile gauge, as per test method [36,37] and as shown in Figure 14a. According to Table 12, the relative error of the cross-sectional width was less than 13.85%, and the profile of the substrate hole particles from the physical test was almost the same as that of the simulation test, as shown in Figure 14b.

4.2.3. Comparison of the Substrate Bulk Density of Spiral Digging End-Effector with Traditional End-Effector

Through experiments, the bulk density of the substrate excavated by the spiral digging end-effector was 0.622 ± 0.019 g/cm3, and the bulk density of the protrusions penetrating end-effector was 0.688 ± 0.005 g/cm3. The results show that the bulk density of the substrate excavated by the spiral type was reduced by about 9.6% compared with the penetrating type; soil porosity was increased, and soil aeration was improved. Therefore, the spiral digging end-effector helps to reduce the bulk density of the substrate, increase soil porosity, and promote root growth.

5. Conclusions

(1)
A spiral digging end-effector for soil digging before planting pumpkin seeds was designed. It was mainly composed of five spiral bits, a synchronous belt, a dual-axial cylinder, a gear motor, and a connecting plate.
(2)
The EDEM simulation method was applied to calibrate the discrete element model parameters of the substrate, through the method of substrate falling from the funnel. The EEPA model was adopted as the particle contact model. The contact parameters and the model parameters (substrate–substrate static friction coefficient, substrate–substrate rolling friction coefficient, and surface energy) that had a significant impact on the substrate AOR were sorted out by PBD and the path of steepest ascent method, and their optimal value ranges were determined. The optimal values for the parameters were obtained through the Central Composite Design response surface analysis test: 0.427 for the substrate–substrate static friction coefficient, 0.039 substrate–substrate rolling friction coefficient, and 0.228 for surface energy. According to the test verification results, there was no significant difference between the simulative AOR of the substrate and the actual AOR, and the calibrated substrate discrete element model parameters were reliable.
(3)
EDEM software was used to simulate and optimize the parameters of the spiral bit. The analysis showed that when the cone angle was 30°, the spiral angle was 80°, and the rotational speed was 240 r/min; the section width at the hole depth of 13 mm was 23.1 mm, and the particle overflow percentage was about 2.05%. Compared with the traditional end-effector, soil porosity was increased, and soil aeration was improved. This result laid the academic foundation for the design and improvement of automatic pumpkin seed planting equipment.

Author Contributions

Conceptualization, X.D. and Y.W.; methodology, X.D. and Z.Y.; software, D.C.; validation, X.D. and Y.Z.; formal analysis, Y.W. and K.L.; investigation, Z.Y.; resources, D.C.; data curation, Y.Z.; writing—original draft preparation, X.D.; writing—review and editing, X.D. and Y.W.; visualization, D.C. and Z.H.; supervision, Y.C. and Y.Z.; project administration, Y.C.; funding acquisition, Y.C. All authors have read and agreed to the published version of the manuscript.
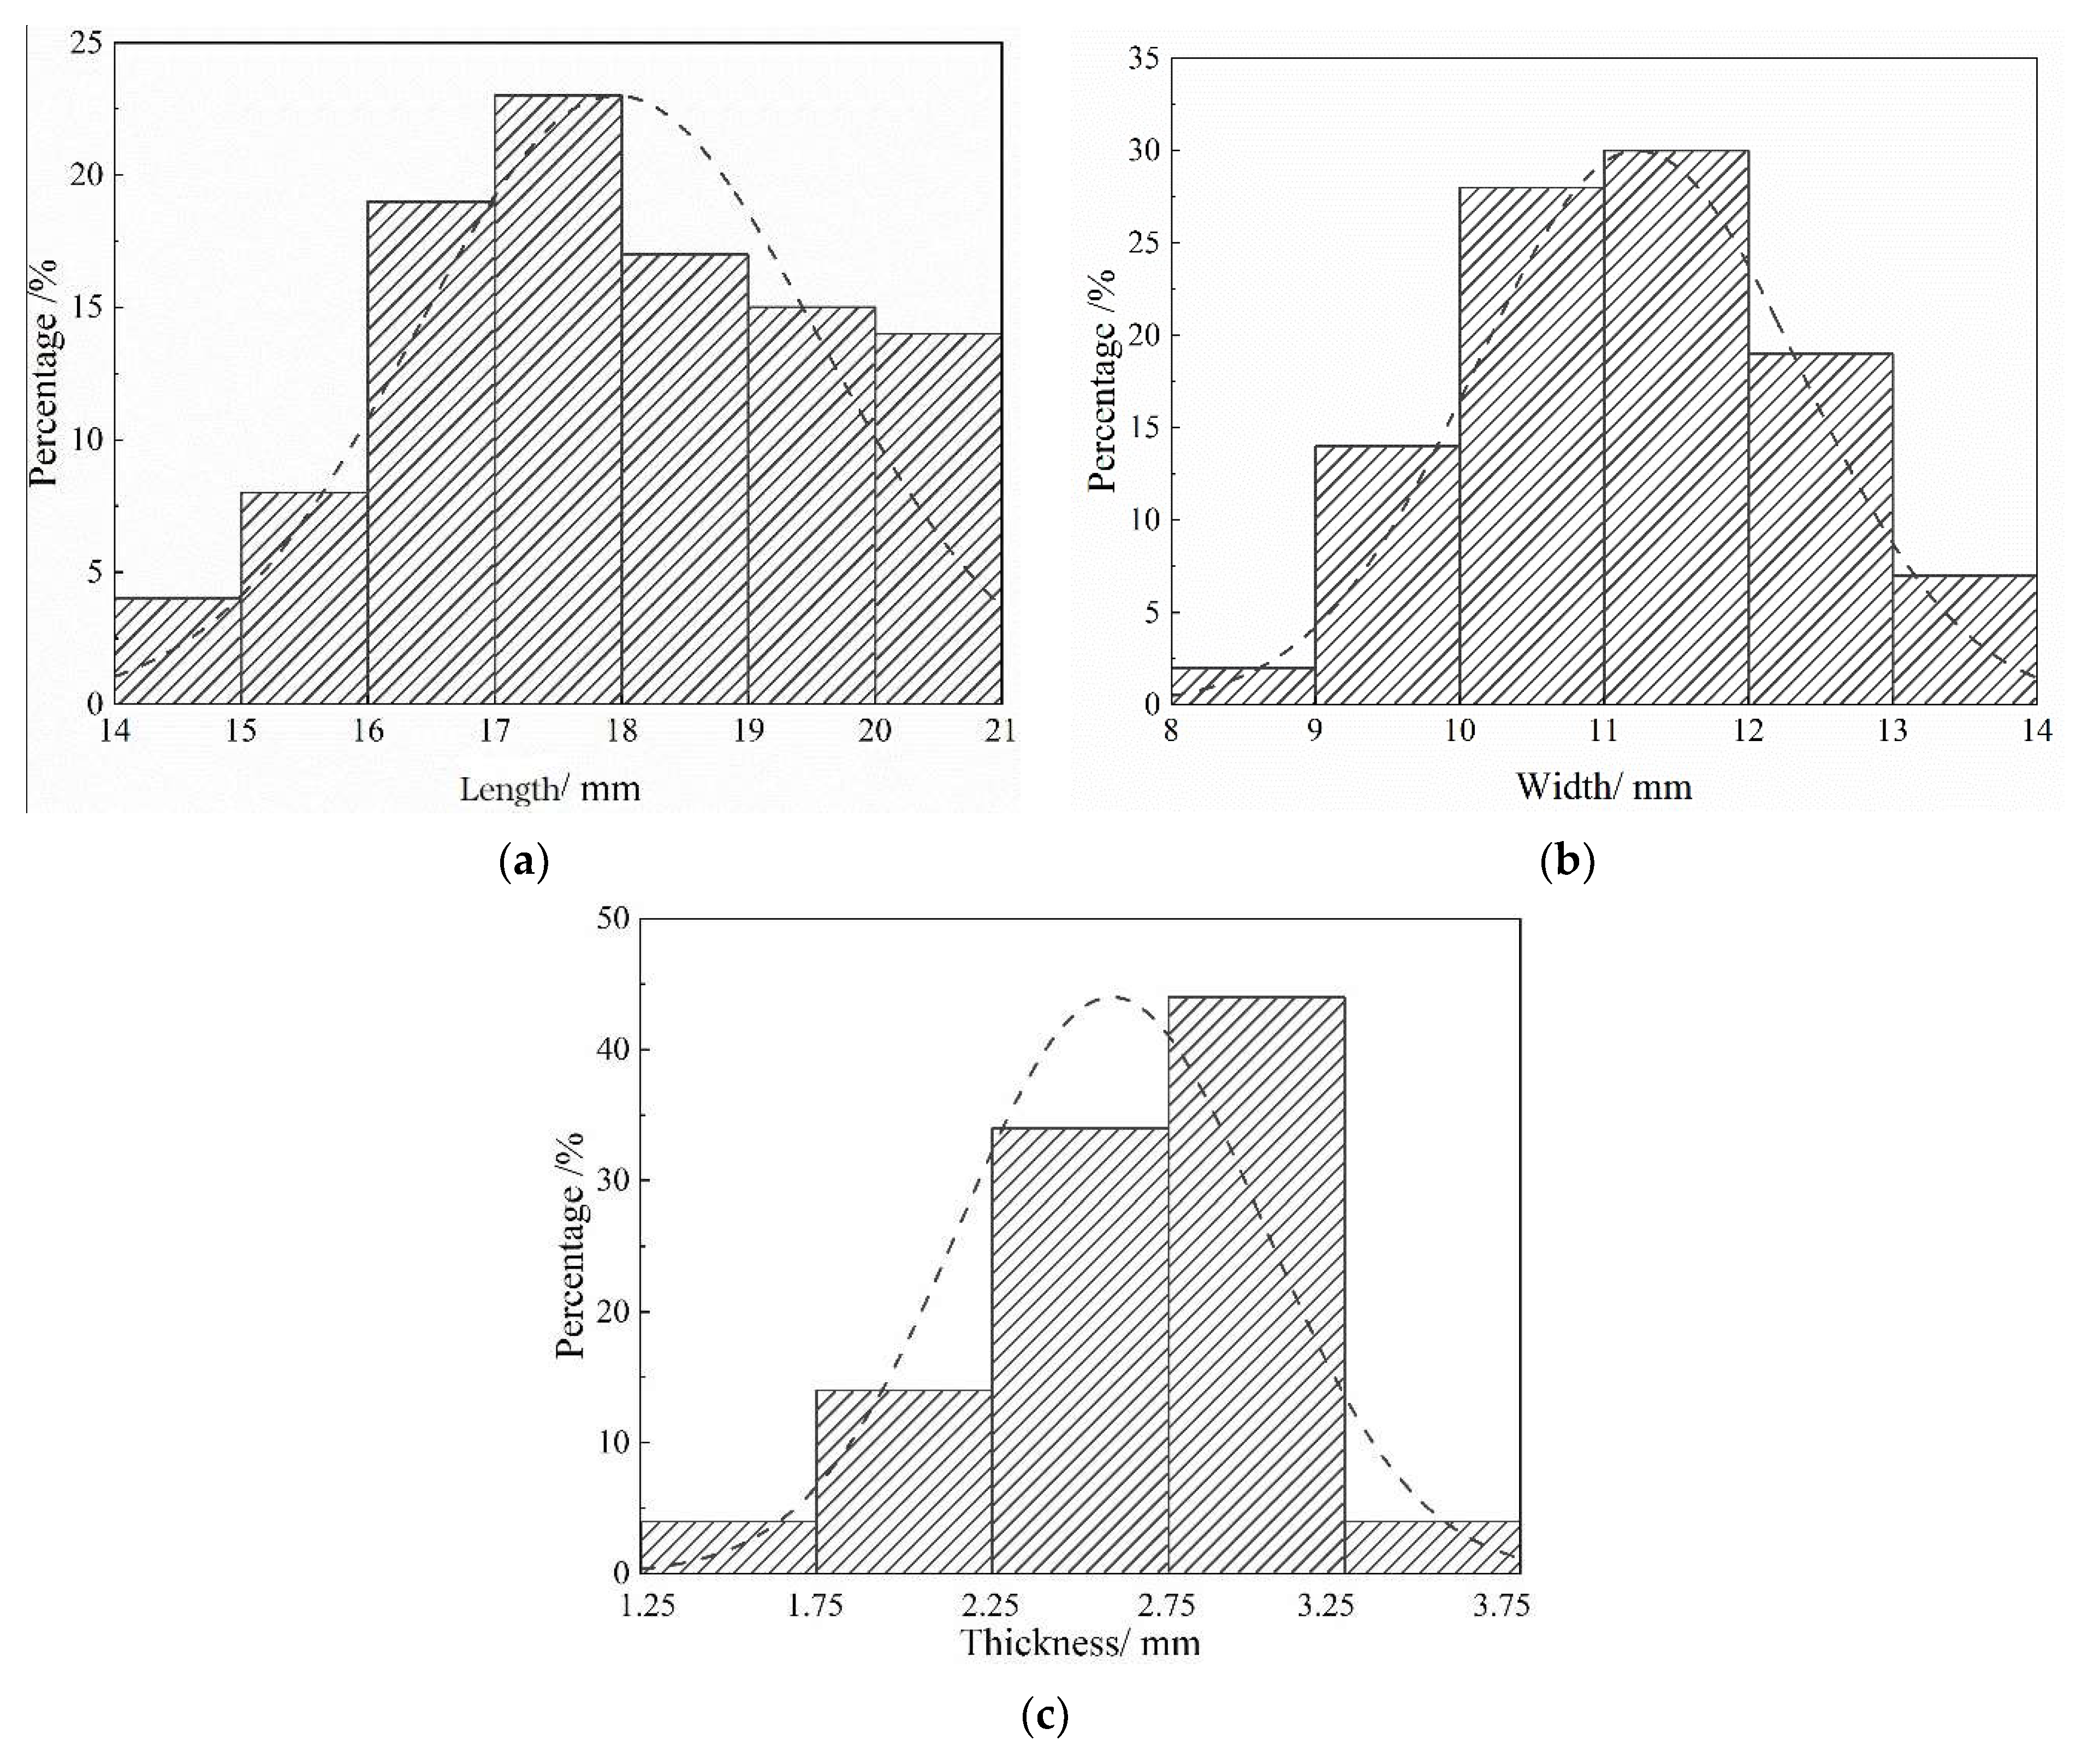
Funding

This research was funded by the Key Research and Development Program in the Shaanxi Province of China, grant number 2019ZDLNY02-04.

Institutional Review Board Statement

Not applicable.

Informed Consent Statement

Informed consent was obtained from all subjects involved in the study.

Data Availability Statement

All data are presented in this article in the form of figures and tables.

Acknowledgments

This study was conducted in the College of Mechanical and Electronic Engineering, Northwest A&F University.

Conflicts of Interest

The authors declare that they have no conflict of interests.

References

  1. Yang, Y.L.; Gu, S.; Li, K.; Liu, K.; Zhang, Q.; Zhong, L.X.; Jia, D.D.; Liu, X.L. Parameters optimization of directing precision seeder for large cucurbitaceous seeds. Trans. Chin. Soc. Agric. Eng. 2013, 29, 15–22. [Google Scholar]
  2. Yi, S.J.; Liu, Y.F.; Wang, C.; Tao, G.X.; Liu, H.Y.; Wang, R.H. Experimental study on the performance of bowl-tray rice precision seeder. Int. J. Agric. Biol. Eng. 2014, 7, 17–25. [Google Scholar]
  3. Mao, X.; Yi, S.J.; Tao, G.J.; Yang, L.; Liu, H.Y.; Ma, Y.C. Experimental study on seed-filling performance of maize bowl-tray precision seeder. Int. J. Agric. Biol. Eng. 2015, 8, 31–38. [Google Scholar]
  4. Chen, S.F.; Zhang, S.P.; Li, Y.M. Design and experiment of piezoelectric type vibration air-suction precision seeder with holey tray. Trans. Chin. Soc. Agric. Eng. 2012, 28 (Suppl. 1), 15–20. [Google Scholar]
  5. Liu, Y.Q.; Zhao, M.Q.; Liu, F.; Yang, T.J.; Zhang, T.; Li, F. Simulation and optimization of working parameters of air suction metering device based on discrete element. Trans. Chin. Soc. Agric. Mach. 2016, 47, 65–72. [Google Scholar]
  6. Zhu, P.A.; Li, J.P.; Lou, J.Z.; Han, Z.Y. Design and test of portable automatic vegetable seeding machine. Trans. Chin. Soc. Agric. Mach. 2016, 47, 7–13. [Google Scholar]
  7. Liu, Z.Z.; Hou, J.L.; Xin, J.; Shao, Y.Y.; Shao, J.H.; Wang, Y. Design and experiment of intelligent facilities seedling machine. Trans. Chin. Soc. Agric. Mach. 2016, 47, 136–142. [Google Scholar]
  8. Dai, F.; Zhang, S.L.; Song, X.F.; Zhao, W.Y.; Ma, H.J.; Zhang, F.W. Design and test of combined operation machine for double width filming and covering soil on double ridges. Trans. Chin. Soc. Agric. Mach. 2020, 51, 108–117. [Google Scholar]
  9. Wang, X.Z.; Li, P.; He, J.P.; Wei, W.Q.; Huang, Y.X. Discrete element simulations and experiments of soil-winged subsoiler interaction. Int. J. Agric. Biol. Eng. 2021, 14, 50–62. [Google Scholar] [CrossRef]
  10. Xing, J.J.; Zhang, R.; Wu, P.; Zhang, X.R.; Dong, X.H.; Chen, Y.; Ru, S.F. Parameter calibration of discrete element simulation model for latosol particles in hot areas of Hainan Province. Trans. Chin. Soc. Agric. Eng. 2020, 36, 158–166. [Google Scholar]
  11. Ma, S.; Xu, L.M.; Yuan, Q.C.; Niu, C.; Zeng, J.; Chen, C.; Wang, S.S.; Yuan, X.T. Calibration of discrete element simulation parameters of grapevine antifreezing soil and its interaction with soil-cleaning components. Trans. Chin. Soc. Agric. Eng. 2020, 36, 40–49. [Google Scholar]
  12. Ma, Y.H.; Song, C.D.; Xuan, C.Z.; Wang, H.Y.; Yang, S.; Wu, P. Parameters calibration of discrete element model for alfalfa straw compression simulation. Trans. Chin. Soc. Agric. Eng. 2020, 36, 22–30. [Google Scholar]
  13. Zhou, B. Research on Performance of Workingparts Cutting Soil of Dual-Axle Vertical Ditcher. Master’s Thesis, Huazhong Agricultural University, Wuhan, China, 2012. [Google Scholar]
  14. Ding, Q.; Zhang, G.A.; Shen, J.Y. The forming principle of spire line and blade on auger. J. Northeast Agric. Univ. 2004, 35, 55–57. [Google Scholar]
  15. Xue, Z.X. Design and Optimization of Working Parts in Upright Screw Ditcher. Master’s Thesis, Northwest A&F University, Xianyang, China, 2011. [Google Scholar]
  16. Luo, S.; Yuan, Q.X.; Guoda, S.; Yang, L.Y. Parameters calibration of vermicomposting nursery substrate with discrete element method based on JKR contact model. Trans. Chin. Soc. Agric. Mach. 2018, 49, 343–350. [Google Scholar]
  17. Xie, C.; Yang, J.W.; Wang, B.S.; Zhuo, P.; Li, C.S.; Wang, L.H. Parameter calibration for the discrete element simulation model of commercial organic fertilizer. Int. Agrophys. 2021, 35, 107–117. [Google Scholar] [CrossRef]
  18. Thakur, S.C.; Morrissey, J.P.; ·Sun, J.; Chen, J.F.; Ooi, J.Y. Micromechanical analysis of cohesive granular materials using the discrete element method with an adhesive elasto-plastic contact model. Granul. Matter. 2014, 16, 383–400. [Google Scholar] [CrossRef]
  19. Cui, Y.J.; Wei, Y.Z.; Ding, X.T.; Cui, G.P.; He, Z.; Wang, M.H. Design and experiment of adjustable spacing end-effector based on cylindrical cam. Trans. Chin. Soc. Agric. Mach. 2022, 53, 104-114+122. [Google Scholar]
  20. Sun, J.F.; Chen, H.M.; Wang, Z.M.; Ou, Z.W.; Yang, Z.; Zhu, L.; Duan, J.L. Study on plowing performance of EDEM low-resistance animal bionic device based on red soil. Soil Till. Res. 2020, 196, 104336. [Google Scholar] [CrossRef]
  21. Zheng, K.; Li, Y.F.; Xia, J.F.; Liu, G.Y.; Cheng, J.; Kang, Q.X. Design and experiment of land leveling blade roller of ditching and rotary tiller with gradual spiral angle. Trans. Chin. Soc. Agric. Mach. 2021, 52, 63–73. [Google Scholar]
  22. Xie, F.P.; Wu, Z.Y.; Wang, X.S.; Liu, D.W.; Wu, B.; Zhang, Z.Z. Calibration of discrete element parameters of soils based on unconfined compressive strength test. Trans. Chin. Soc. Agric. Eng. 2020, 36, 39–47. [Google Scholar]
  23. Han, B.; Shen, D.S.; Guo, C.; Liu, Q.; Wang, X.; Song, C. Design and experiment of adjustable end-effector of cabbage seedlings. Trans. Chin. Soc. Agric. Mach. 2019, 50, 111–120. [Google Scholar]
  24. Sun, G.X.; Wang, X.C.; He, G.M.; Zhou, T.; Wang, C.; Qiao, X.J. Design of the end-effector for plug seedlings transplanter and analysis on virtual prototype. Trans. Chin. Soc. Agric. Mach. 2010, 41, 48–53+47. [Google Scholar]
  25. Wang, X.Z.; Yue, B.; Gao, X.J.; Zheng, Z.Q.; Zhu, R.X.; Huang, Y.X. Discrete element simulations and experiments of disturbance behavior as affected by mounting height of subsoiler’s wing. Trans. Chin. Soc. Agric. Mach. 2018, 49, 124–136. [Google Scholar]
  26. Ucgul, M.; Fielke, J.M.; Saunders, C. Three-dimensional discrete element modelling (DEM) of tillage: Accounting for soil cohesion and adhesion. Biosys. Eng. 2015, 129, 298–306. [Google Scholar] [CrossRef]
  27. Han, Y.L.; Jia, F.G.; Tang, Y.R.; Liu, Y.; Zhang, Q. Influence of granular coefficient of rolling friction on accumulation characteristics. Acta Phys. Sin. 2014, 63, 174501. [Google Scholar] [CrossRef]
  28. Tong, J.H.; Shi, H.F.; Wu, C.Y.; Ding, Y.H.; Zhao, X.; Wang, R.Y. Simulation and test of seedling pot grabbing by spade end-effector. Trans. Chin. Soc. Agric. Mach. 2019, 50, 107–116. [Google Scholar]
  29. He, Y.M.; Xiang, W.; Wu, M.L.; Quan, W.; Chen, C.P. Parameters calibration of loam soil for discrete element simulation based on the repose angle of particle heap. J. Hunan Agric. Univ. 2018, 44, 216–220. [Google Scholar]
  30. Wu, T.; Huang, W.F.; Chen, X.S.; Ma, X.; Han, Z.Q.; Pan, T. Calibration of discrete element model parameters for cohesive soil considering the cohesion between particles. J. South China Agric. Univ. 2017, 8, 93–98. [Google Scholar]
  31. Xu, Q.C.; Li, S.J.; Zhang, Y.L.; Meng, L.; Lu, H.A.; Xie, L. Design and test of seedling pot filling and transporting machine for citrus. Trans. Chin. Soc. Agric. Eng. 2020, 36, 66–72. [Google Scholar]
  32. Ma, Y.J.; Wang, A.; Zhao, J.G.; Hao, J.J.; Li, J.C.; Ma, L.P.; Zhao, W.B.; Wu, Y. Simulation analysis and experiment of drag reduction effect of convex blade subsoiler based on discrete element method. Trans. Chin. Soc. Agric. Eng. 2019, 35, 16–23. [Google Scholar]
  33. Wang, X.L.; Hu, H.; Wang, Q.J.; Li, H.W.; He, J.; Chen, W.Z. Calibration method of soil contact characteristic parameters based on DEM theory. Trans. Chin. Soc. Agric. Mach. 2017, 48, 78–85. [Google Scholar]
  34. Reichert, J.M.; Albuquerque, J.A.; Solano Peraza, J.E.; Costa, A. Estimating water retention and availability in cultivated soils of southern Brazil. Geoderma Reg. 2020, 21, e00277. [Google Scholar] [CrossRef]
  35. Sekucia, F.; Dlapa, P.; Kollár, J.; Cerdá, A.; Hrabovský, A.; Svobodová, L. Land-use impact on porosity and water retention of soils rich in rock fragments. Catena 2020, 195, 104807. [Google Scholar] [CrossRef]
  36. Wang, X.Z.; Gao, P.Y.; Yue, B.; Shen, H.; Fu, Z.L.; Zheng, Z.Q.; Zhu, R.X.; Huang, Y.X. Optimisation of installation parameters of subsoiler’ wing using the discrete element method. Comput. Electron. Agric. 2019, 162, 523–530. [Google Scholar] [CrossRef]
  37. Wang, X.Z.; Zhang, S.; Pan, H.B.; Zheng, Z.Q.; Huang, Y.X.; Zhu, R.X. Effect of soil particle size on soil-subsoiler interactions using the discrete element method simulations. Biosys. Eng. 2019, 182, 138–150. [Google Scholar] [CrossRef]
Figure 1. Dimension distribution of the seeds: (a) length, (b) width, and (c) thickness.
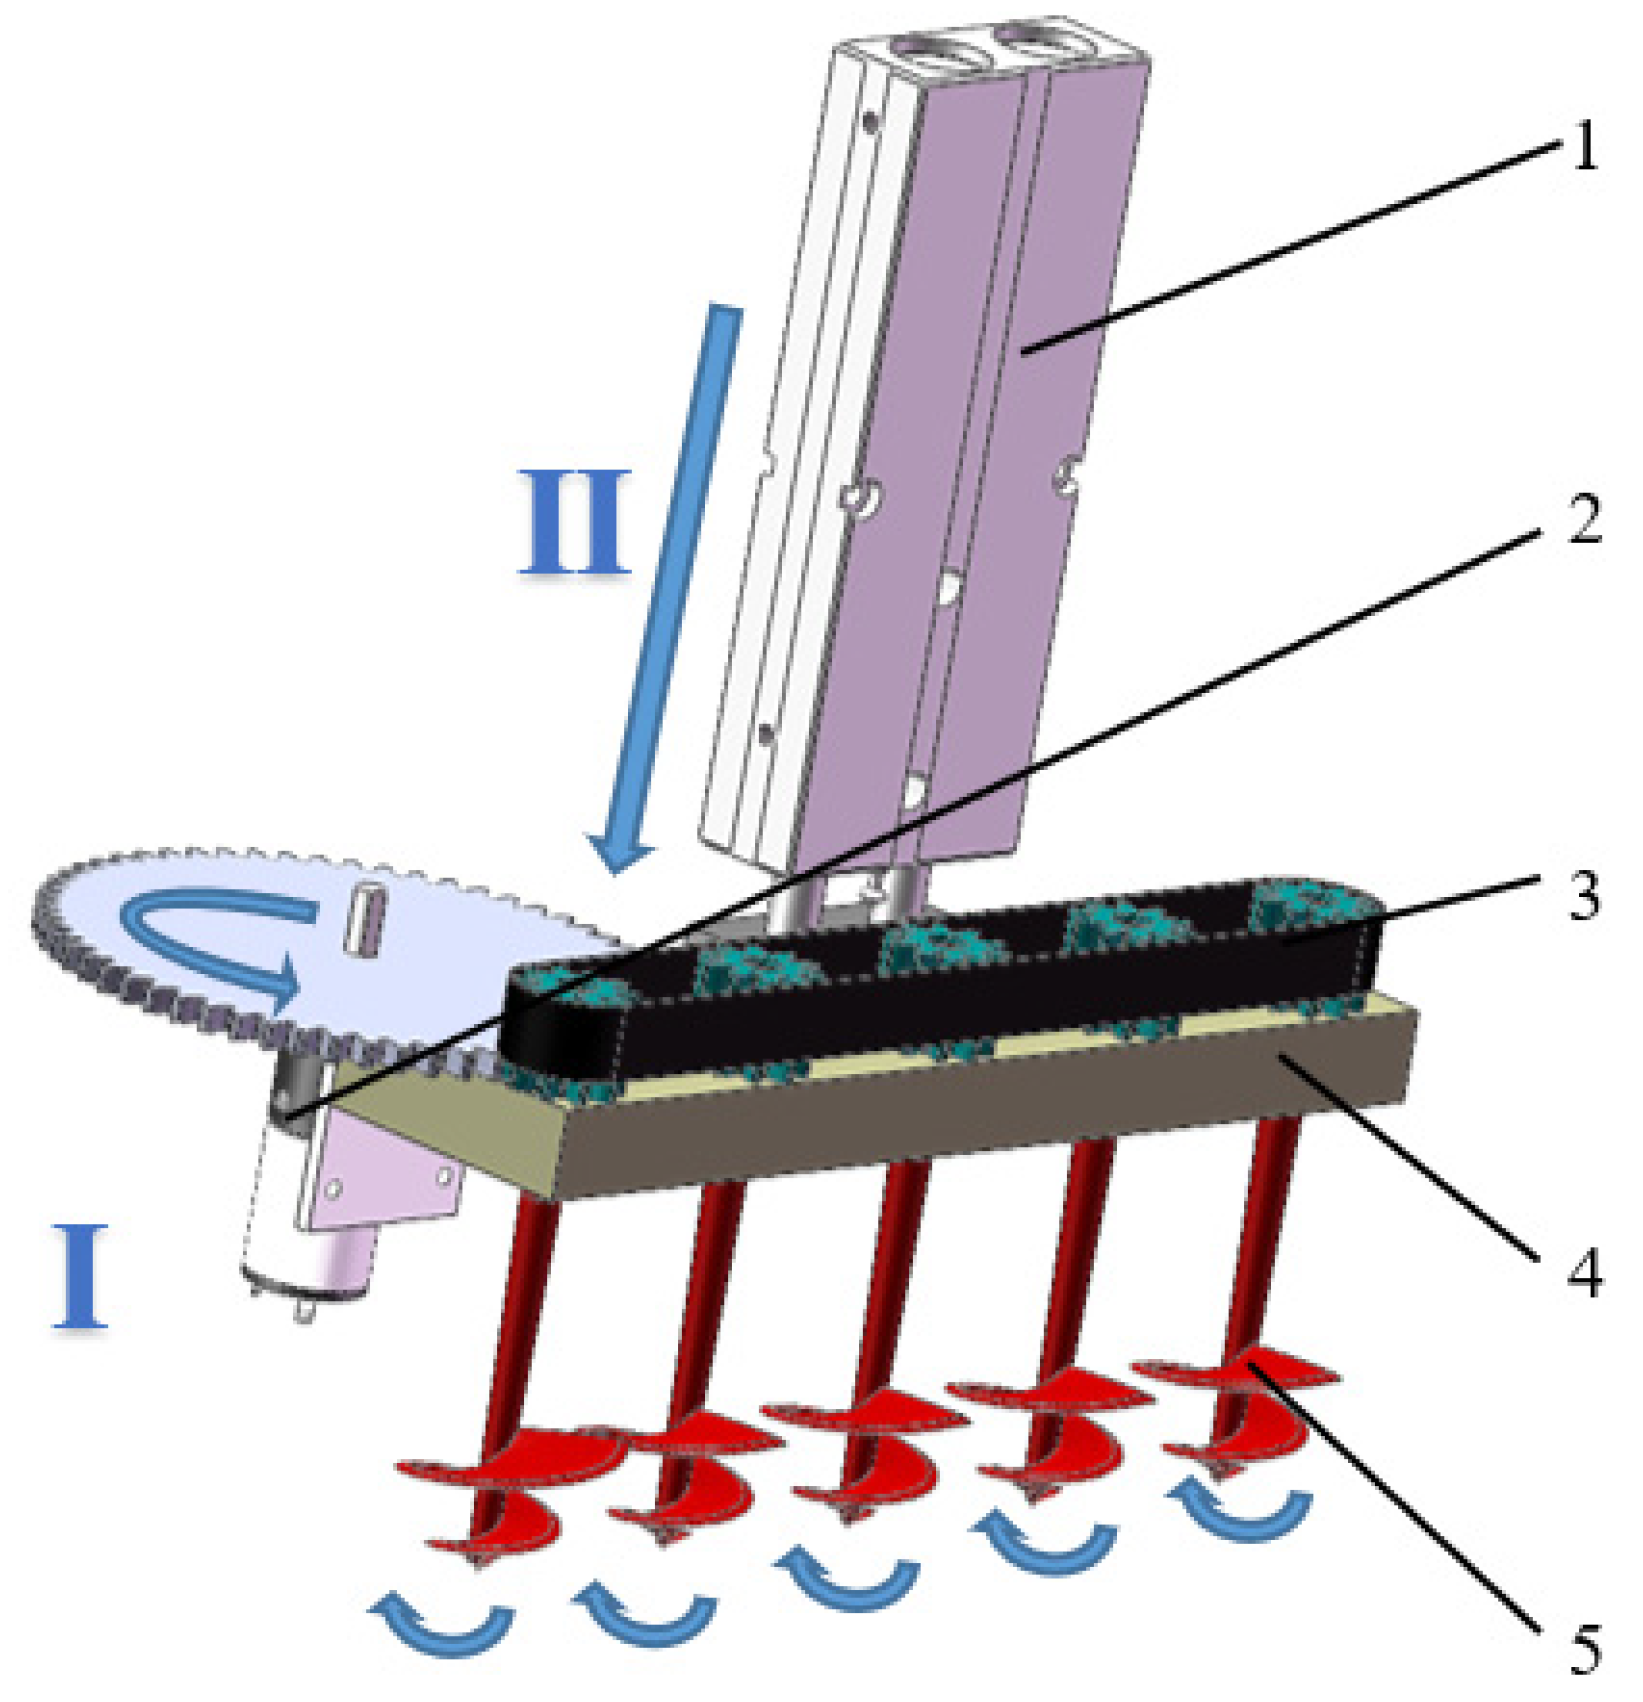
Agronomy 12 00779 g001
Figure 2. (I) The gear motor drives the five spiral bits to rotate. (II) The end-effector moves downwards by pushing the cylin-der. Spiral digging end-effector module: 1. cylinder, 2. gear motor, 3. synchronous belt, 4. connecting plate, and 5. spiral bits.
Agronomy 12 00779 g002
Figure 3. The main size of drill tip.
Agronomy 12 00779 g003
Figure 4. Conical spiral line with equal pitch variable pitch. Note: γ is cone top angle, °; D is top diameter of helical blade, mm; H is length of helical blade, mm, and d is bottom diameter of helical blade, mm.
Agronomy 12 00779 g004
Figure 5. Particle diameter distribution.
Agronomy 12 00779 g005
Figure 6. Device components of physical test on the substrate AOR: 1. funnel, 2. substrate, 3. steel plate, and 4. funnel holding device.
Agronomy 12 00779 g006
Figure 7. Substrate boundary profile processing: (a) original image, (b) gray processing, (c) binarization, (d) extract contour, and (e) contour pixel coordinates.
Agronomy 12 00779 g007
Figure 8. Comparison of simulation test (a) and physical test (b) of parameter calibration.
Agronomy 12 00779 g008
Figure 9. Digging Performance: 1. substrate, 2. tray.
Agronomy 12 00779 g009
Figure 10. The traditional protrusions penetrating end-effector.
Agronomy 12 00779 g010
Figure 11. The influence of cone angle (a) spiral angle, (b) rotational speed, and (c) on hole digging capability (triangle ▲: cross-section width; square ■: particle overflow percentage; round ●: dig time).
Agronomy 12 00779 g011
Figure 12. Simulation of hole digging process: 1. spiral bits, 2. substrate particles, 3. plug tray. (a) substrate particles into the plug tray, (b) natural settlement of particles, (c) the spiral bit spun into the substrate particles, (d) the spiral bit rotated for 2.09 s, (e) the spiral blade was lifted up, and (f) a hole was formed.
Agronomy 12 00779 g012
Figure 13. Spiral digging end-effector photo.
Agronomy 12 00779 g013
Figure 14. Comparison of physical test and simulation test on spiral digging: (a) soil profile measurement and (b) contour of the hole.
Agronomy 12 00779 g014
Table 1. Factors and levels table of Plackett–Burman Design.
FactorsLevels
−101
A-Substrate particles shear modulus (MPa)2.906.4510.00
B-Substrate–substrate restitution coefficient0.100.400.70
C-Substrate–substrate static friction coefficient0.300.731.16
D-Substrate–substrate rolling friction coefficient0.000.280.56
E-Substrate–steel restitution coefficient0.100.350.60
F-Substrate–steel static friction coefficient0.200.400.60
G-Surface energy (J·m−2)0.000.501.00
H-Contact plasticity ratio0.300.500.70
J-Tensile exp.1.503.255.00
K-Tangential stiff multiplier0.050.5251.00
Table 2. Scheme and results of Plackett–Burman Design.
No.Test FactorsAngle of Repose (°)
ABCDEFGHJKL
111−1111−1−11−1−131.21
2−111−111−1−1−11125.83
31−111−111−1−1−1169.41
4−11−111−111−1−1160.96
5−1−11−111111−1−143.74
6−1−1−11−11−1111139.26
71−1−1−11−11−111140.44
811−1−1−1111−11−128.05
9111−1−1−1−111−1119.86
10−1111−1−11−111−176.84
111−1111−1−11−11−163.88
12−1−1−1−1−1−1−1−1−1−1−116.71
130000000000062.95
Note: L indicates black column.
Table 3. ANOVA of Plackett–Burman Design test’s result.
Source of VarianceMean SquaredfF-Valuep-Value
Model450.4410247.850.0494 *
A9.1715.050.2666
B78.49143.190.0961
C573.121315.350.0358 *
D2322.1411277.720.0178 *
E21.15111.640.1815
F141.38177.790.0719
G1254.401690.220.0242 *
H1.8311.010.4986
J15.1718.340.2122
K87.53148.160.0911
Residual1.821
Cor Total4873.0012
Note: * Means significant (p < 0.05).
Table 4. Scheme and results of path of steepest ascent method.
No.Test FactorsAngle of Repose (°)Relative Error (%)
CDG
10.20.000.025.2035.43
20.40.120.246.2718.55
30.60.240.451.7832.67
40.80.360.657.2146.58
51.00.480.861.2656.96
61.20.601.067.8173.74
Table 5. Factors and levels table of Central Composite Design.
LevelsCDG
−1.6820.0636414−0.0818151−0.136359
−10.200
00.40.120.2
10.60.240.4
1.6820.7363590.3218150.536359
Table 6. Scheme and results of Central Composite Design.
No.Test FactorsAngle of Repose (°)
CDG
100044.30
211159.52
3−11−135.96
41.6820043.55
5001.68251.83
60−1.682026.51
700047.73
800047.32
900046.28
1001.682058.04
1100043.52
12−1.6820026.09
13−11147.27
141−1134.39
1500042.52
16−1−1−127.33
1700044.22
1811−154.59
1900041.73
20−1−1139.27
2100045.20
2200−1.68237.53
231−1−128.12
Table 7. ANOVA of Central Composite Design quadratic model.
Source of VarianceSum of SquaresdfMean SquareF Valuep Value
Model1924.359213.8257.31<0.0001 **
C230.891230.8961.89<0.0001 **
D1076.6211076.62288.57<0.0001 **
G250.591250.5967.17<0.0001 **
CD152.861152.8640.97<0.0001 **
CG18.15118.154.860.0460 *
DG0.485110.48510.13000.7242
C2185.481185.4849.72<0.0001 **
D29.6919.692.600.1311
G20.076510.07650.02050.8883
Residual48.50133.73
Lack of Fit14.3852.880.67450.6548
Pure Error34.1284.26
Cor Total1972.8522
Note: * Means significant (p < 0.05); ** Means extremely significant (p < 0.01).
Table 8. ANOVA of Central Composite Design modified model.
Source of VarianceSum of SquaresdfMean SquareF Valuep Value
Model1914.086319.0186.86<0.0001 **
C230.891230.8962.87<0.0001 **
D1076.6211076.62293.14<0.0001 **
G250.591250.5968.23<0.0001 **
CD152.861152.8641.62<0.0001 **
CG18.15118.154.940.0410 *
C2184.971184.9750.36<0.0001 **
Residual58.76163.67
Lack of Fit24.6583.080.72240.6718
Pure Error34.1284.26
Cor Total1972.8522
Note: * Means significant (p < 0.05); ** Means extremely significant (p < 0.01).
Table 9. Factors and levels of orthogonal test.
LevelsTest Factors
γ-Cone Angle (°)α-Spiral Angle (°)r-Rotational Speed (r·min−1)
127.575180
230.080240
332.585300
Table 10. Results of orthogonal tests.
No.γαrCross-Section Width (mm) Particle Overflow Percentage (%) Dig Time (s)
133122.65.222.68
212321.72.881.48
331323.08.301.62
413221.51.332.18
523322.64.041.60
632222.86.961.94
722121.63.682.54
821222.15.462.16
911120.92.312.62
Table 11. Analysis of variance.
Cross-Section WidthParticle Overflow PercentageDig Time
γαrγαrγαr
III sum of squares3.080.100.8232.505.012.740.000.051.64
df222222222
Mean square1.540.050.4116.252.511.370.000.030.82
F-value198.14 **6.1452.43 *2340.22 **360.94 **197.54 **0.107.66253.25 **
Note: * Means significant (p < 0.05); ** Means extremely significant (p < 0.01).
Table 12. Cross-sectional width test results.
No.12345678910
Cross-sectional width (mm)20.7324.2424.4722.9223.6422.4422.2526.323.3422.09
Relative error (%)10.264.945.930.782.342.863.6813.851.044.37
Publisher’s Note: MDPI stays neutral with regard to jurisdictional claims in published maps and institutional affiliations.

