
Environmental Impact Assessment of Sustainable Pig Farm via Management of Nutrient and Co-Product Flows in the Farm

 , ,
, ,  ,
,  , ,
, ,  , and
, and
Abstract
:1. Introduction
2. Materials and Methods
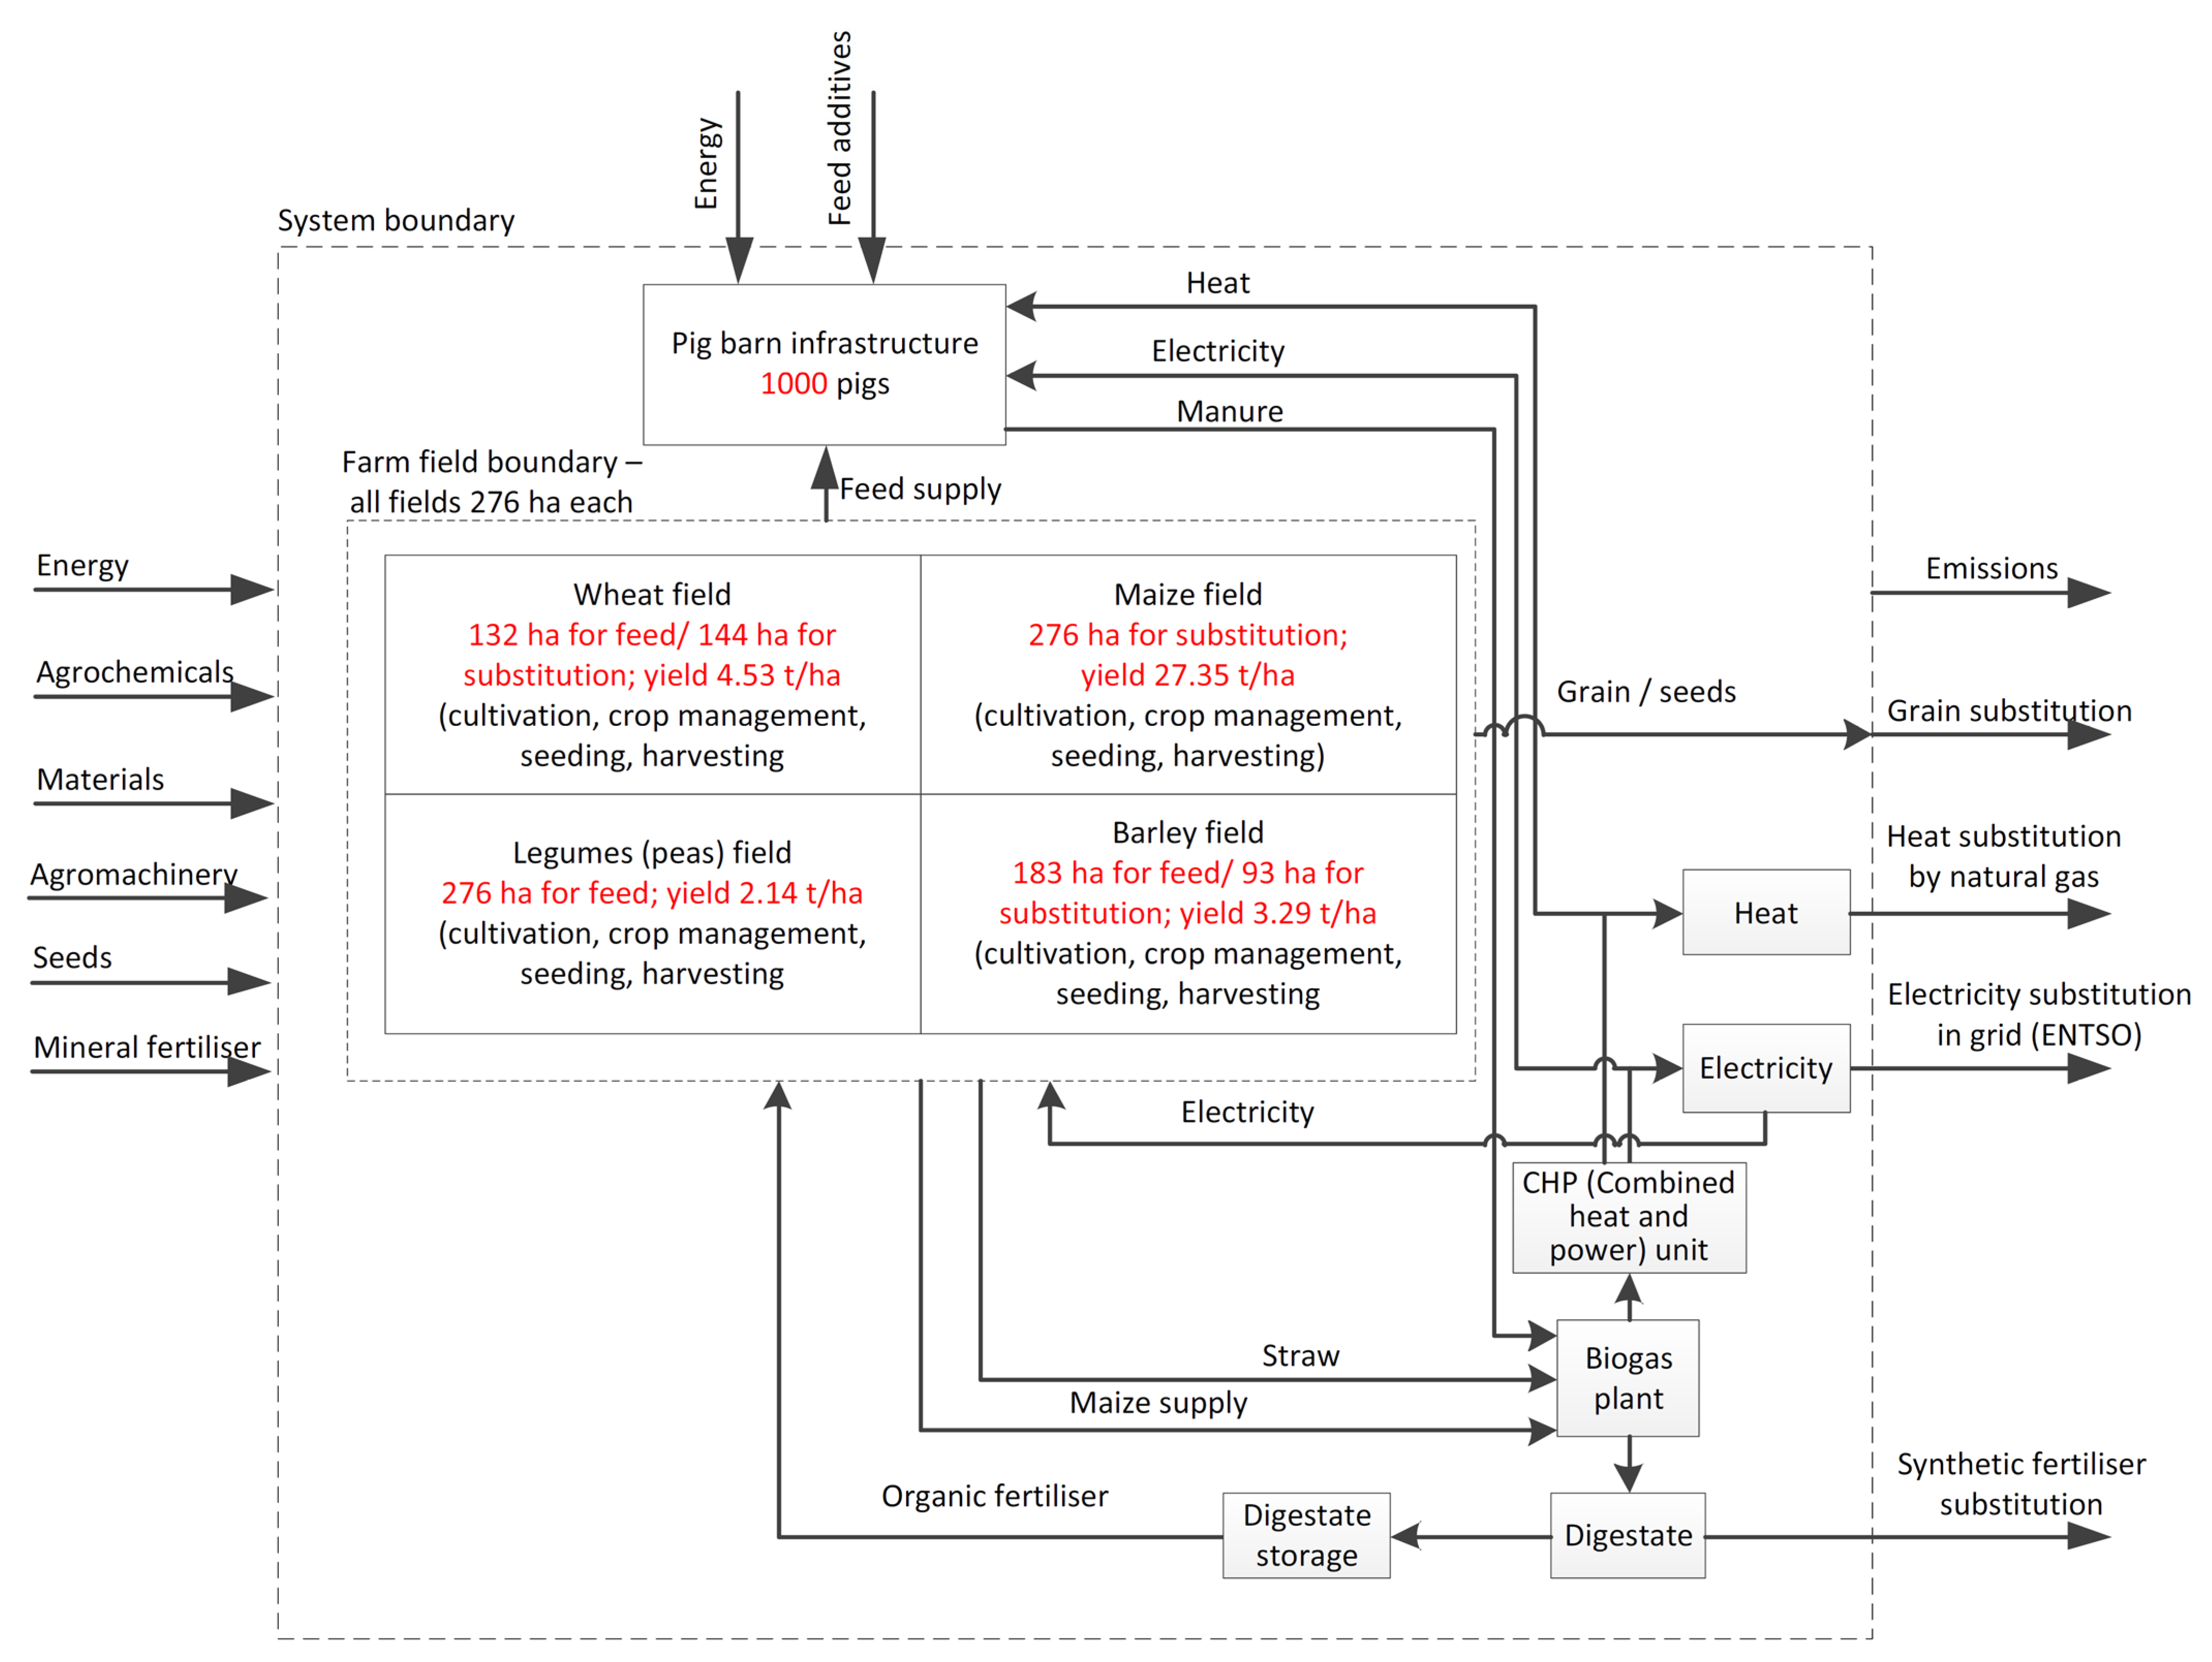
2.1. Description of the System Analysed
2.2. Functional Unit, System Boundary and the Environmental Impact Categories
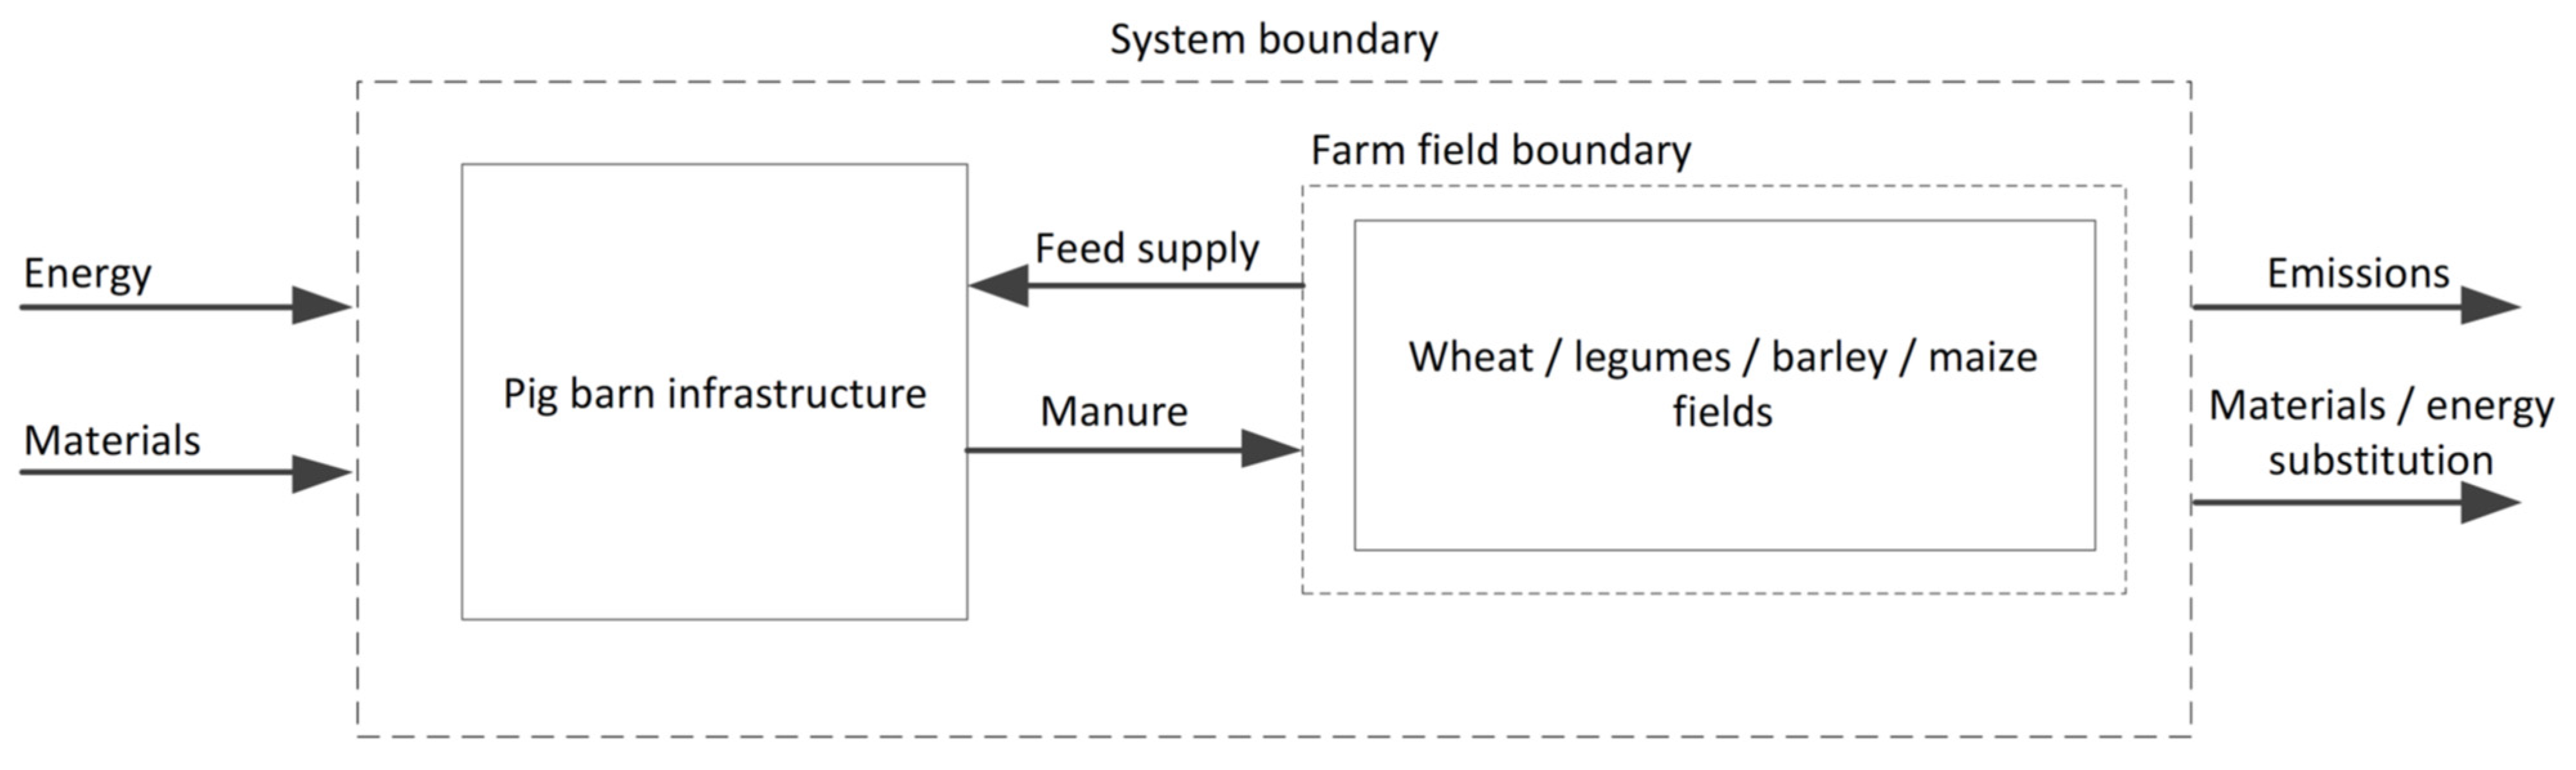
2.2.1. Scope of System
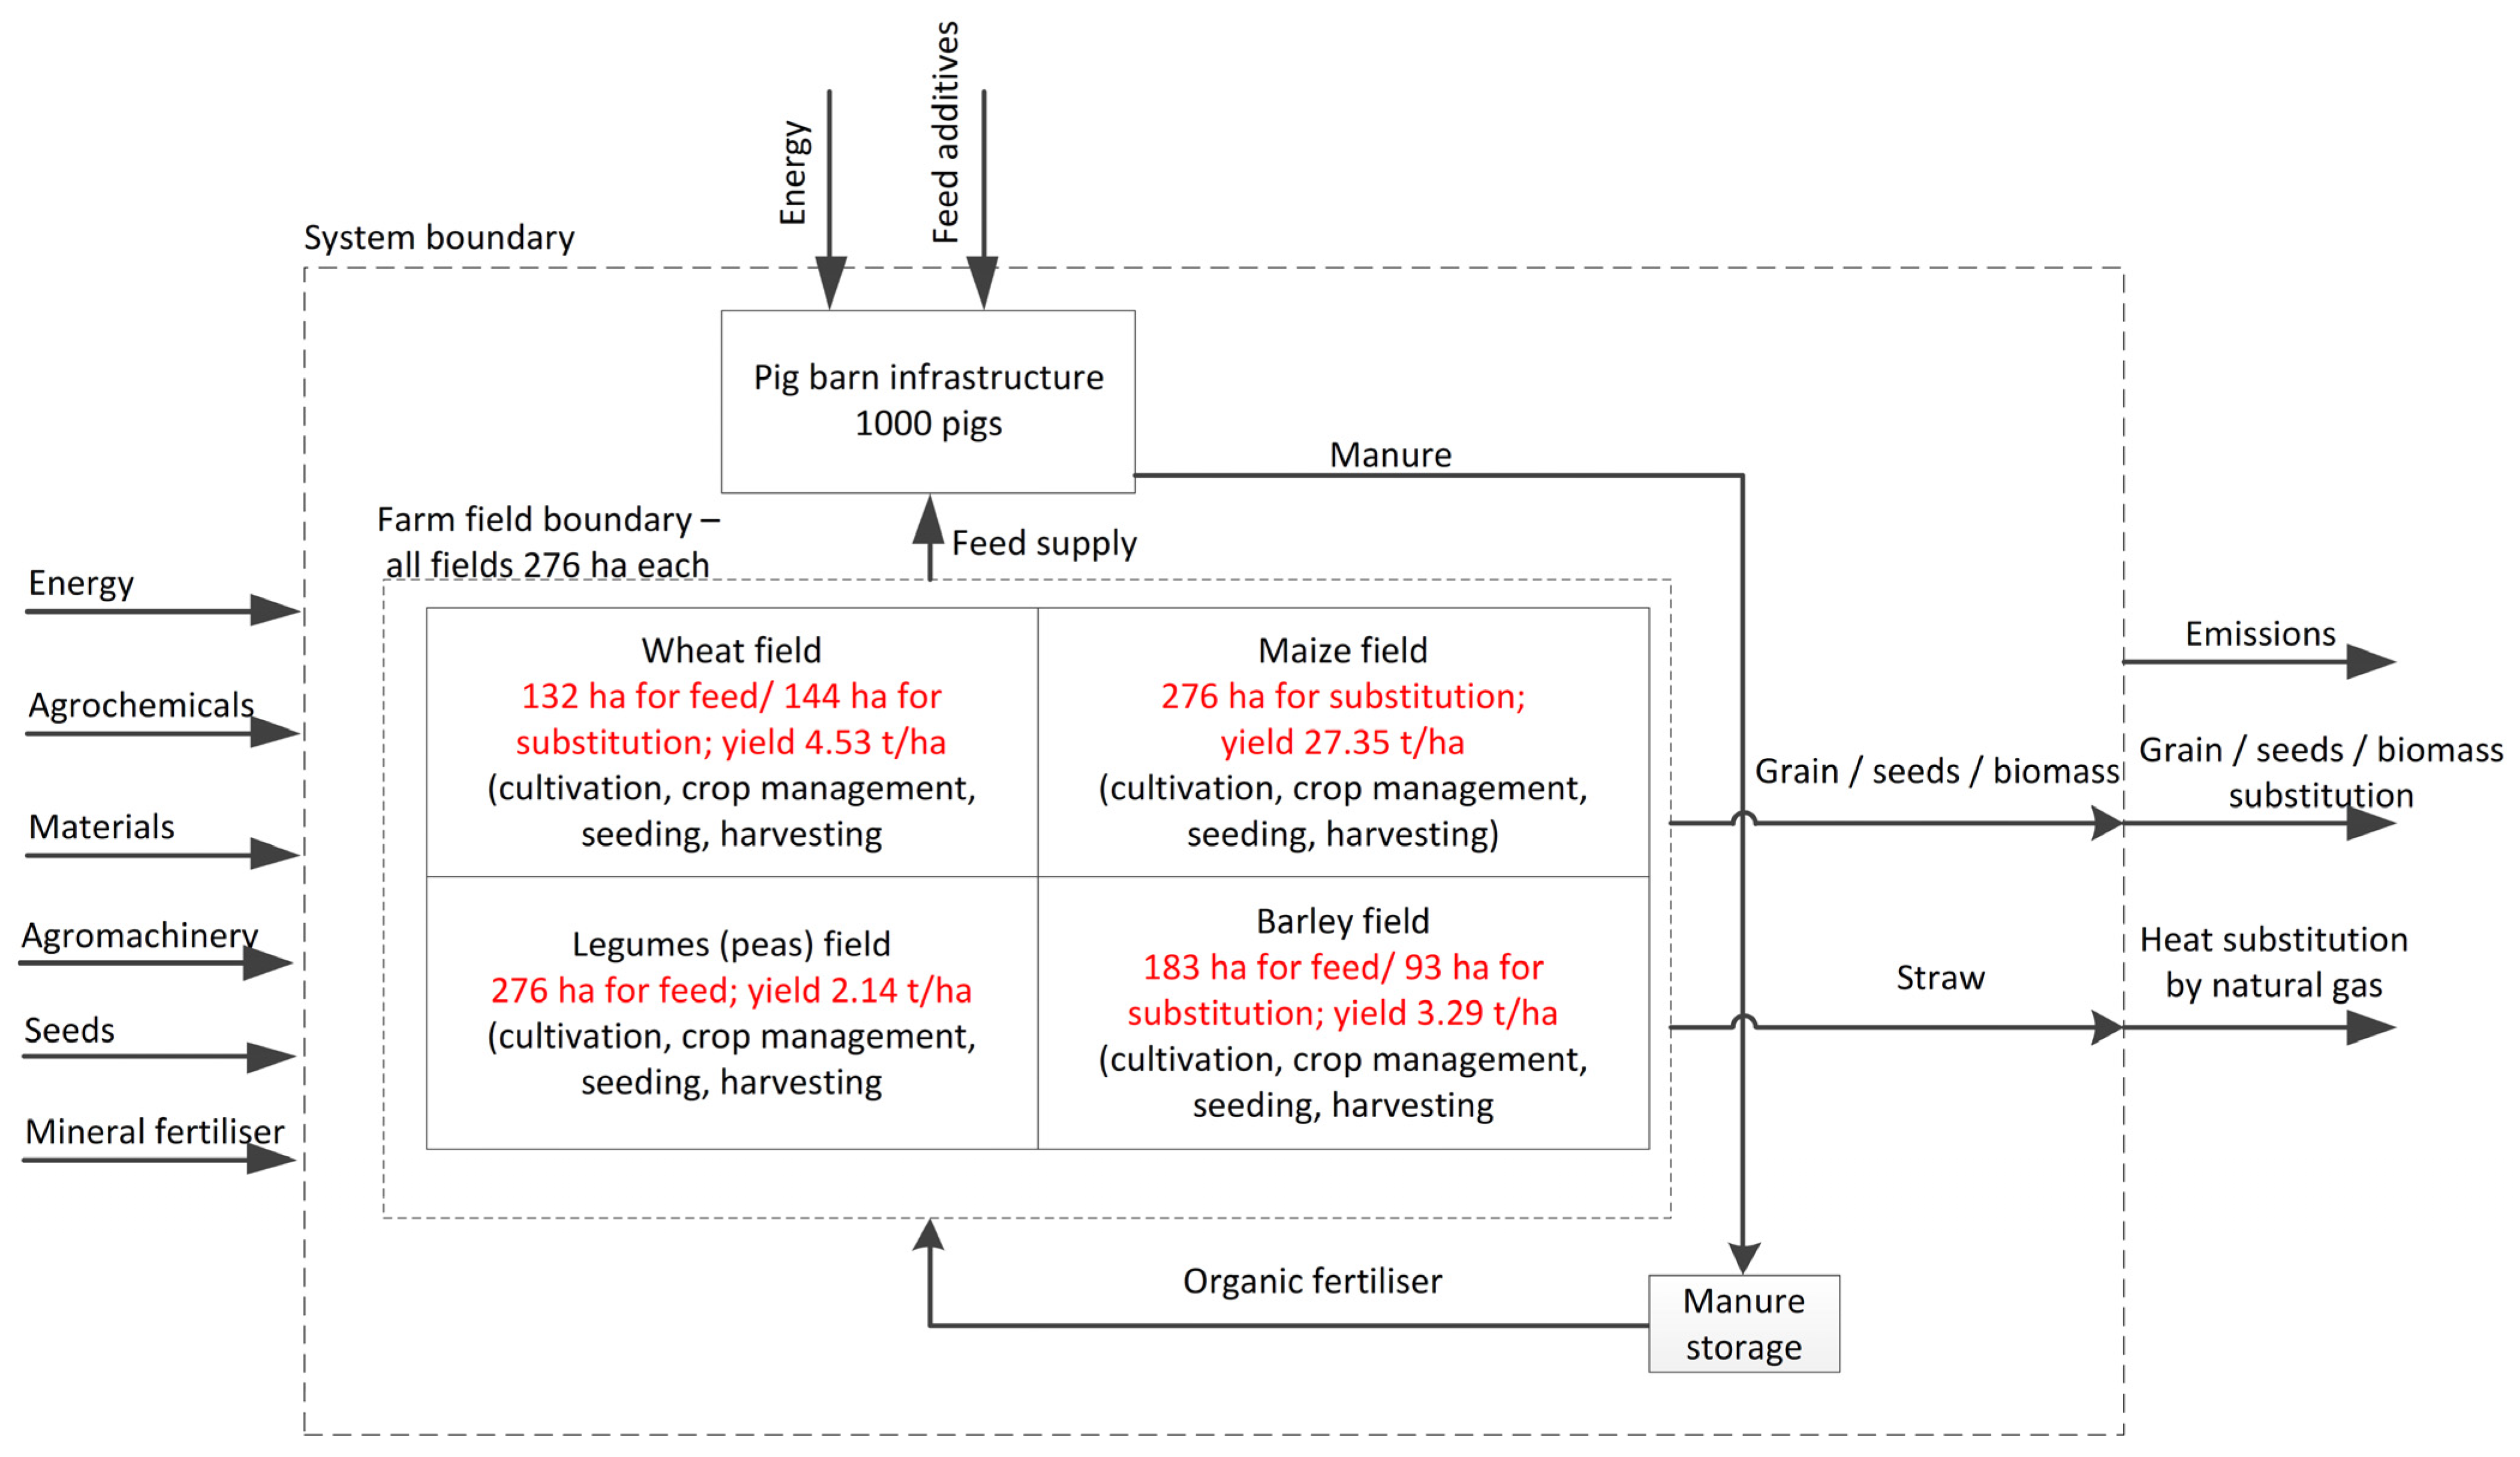
2.2.2. Scenario 1 (SC1)
2.2.3. Scenario 2 (SC2)
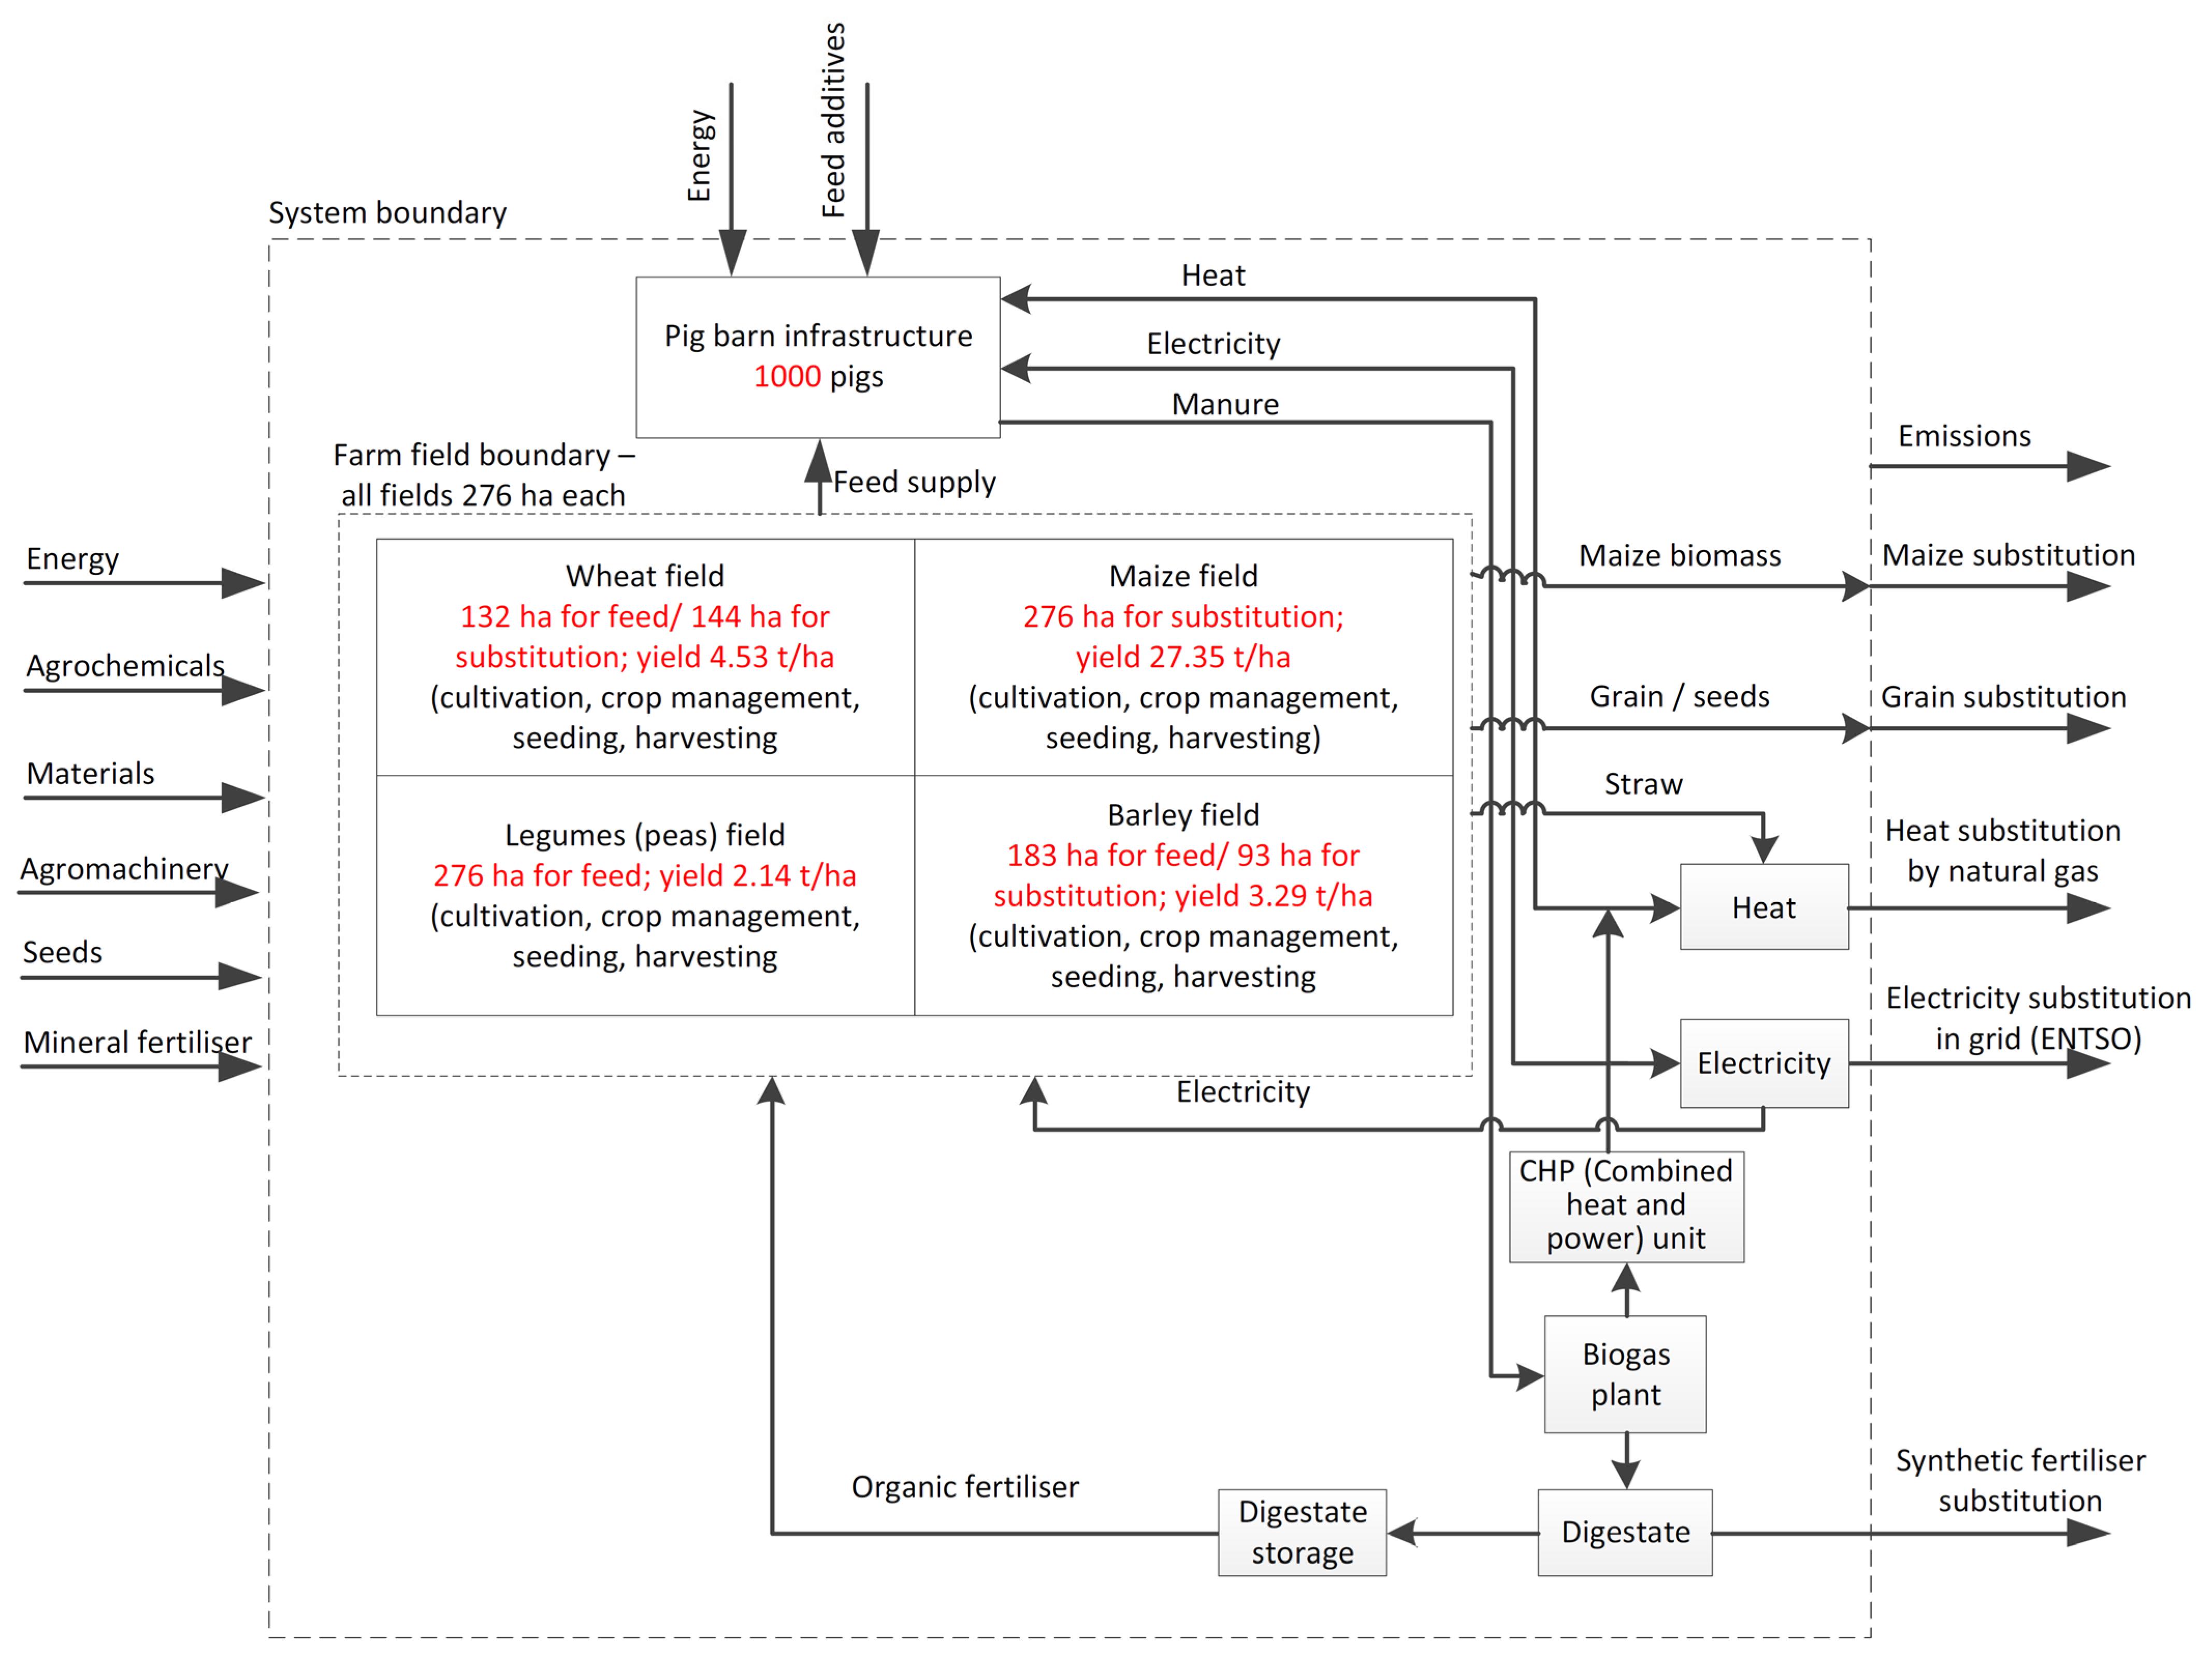
2.2.4. Scenario 3 (SC3)
2.2.5. Functional Unit
2.3. Allocation Procedures
3. Results
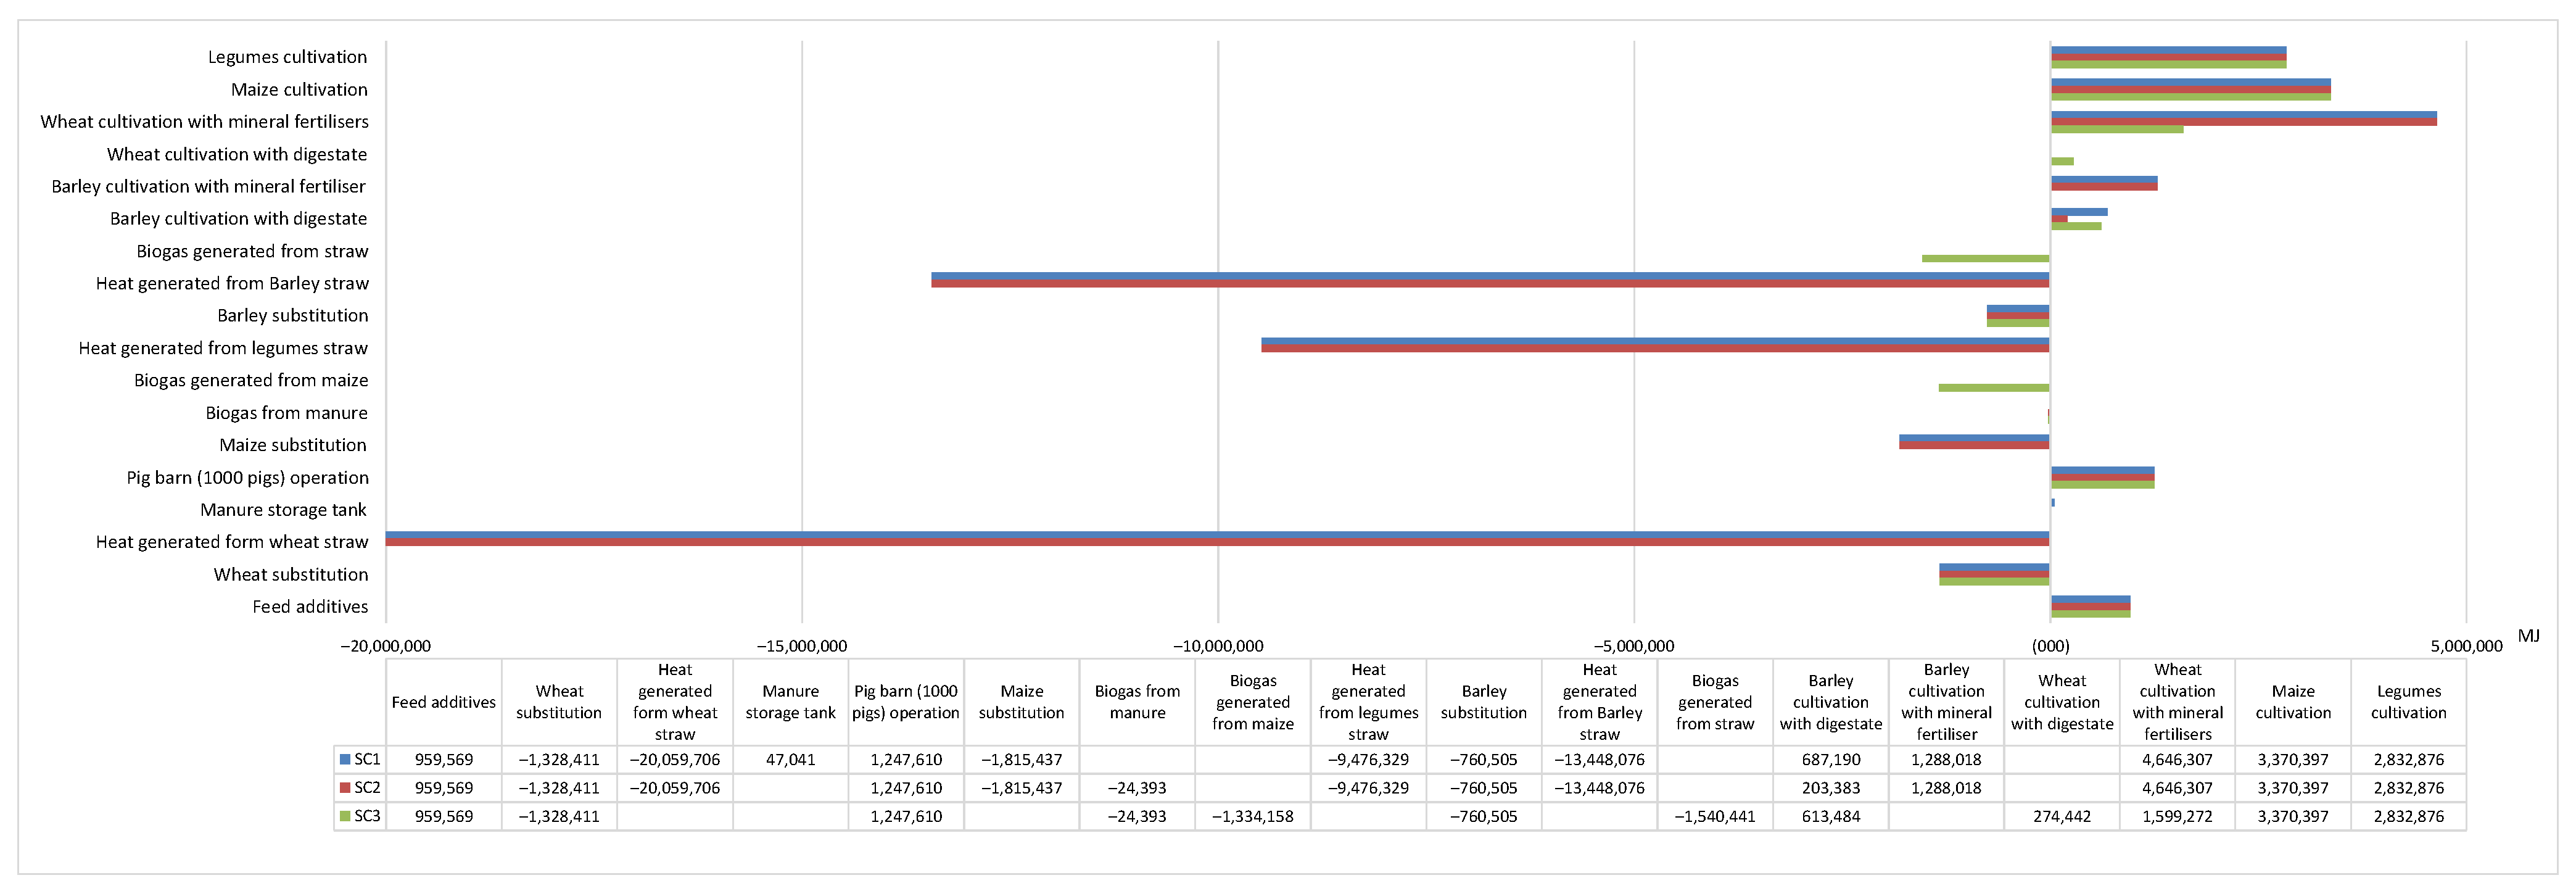
3.1. Energy Inputs
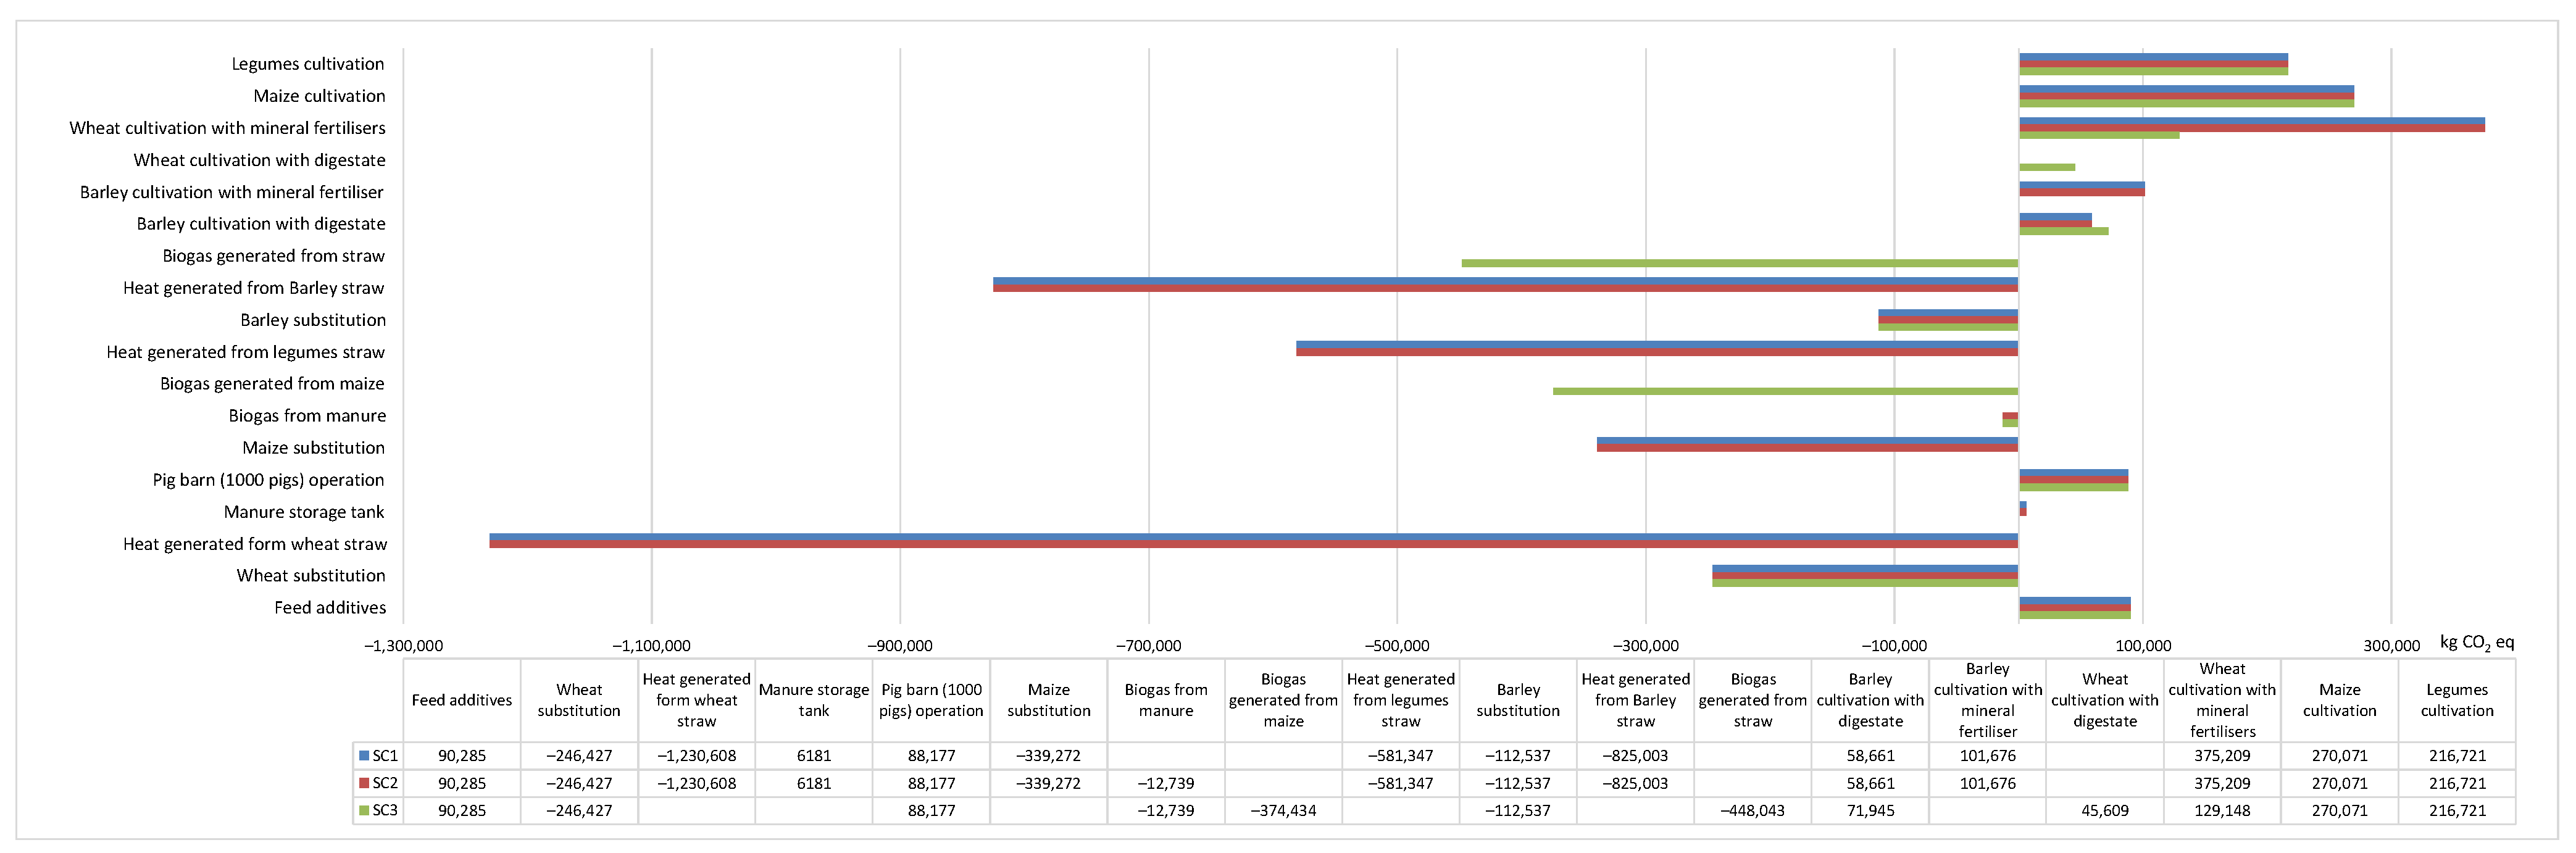
3.2. Inventory Analysis
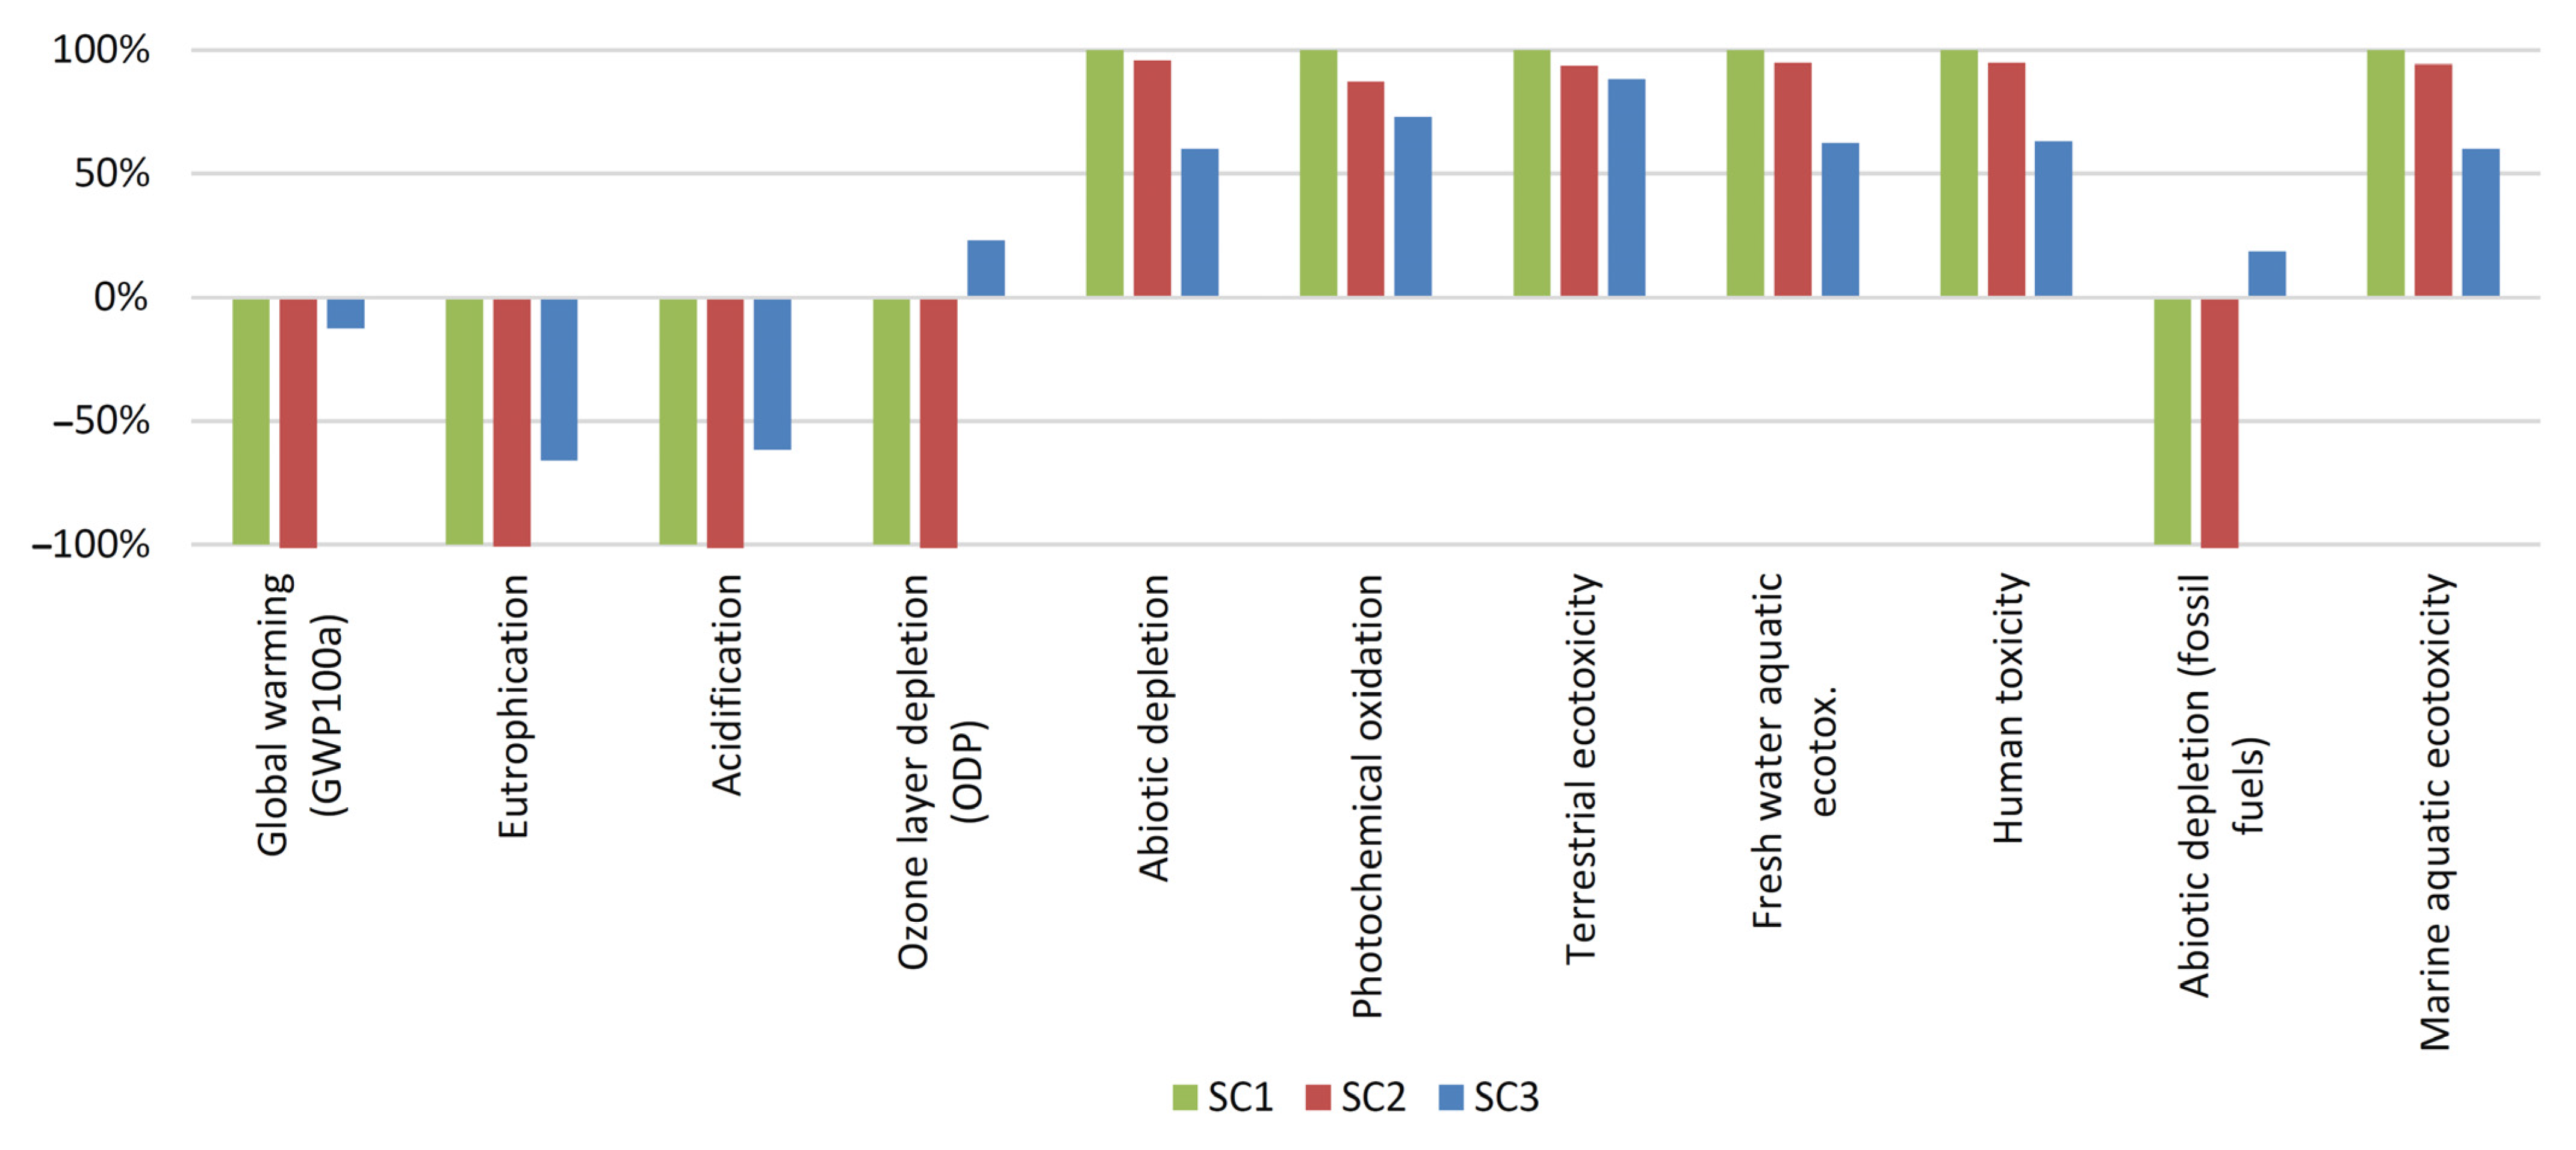
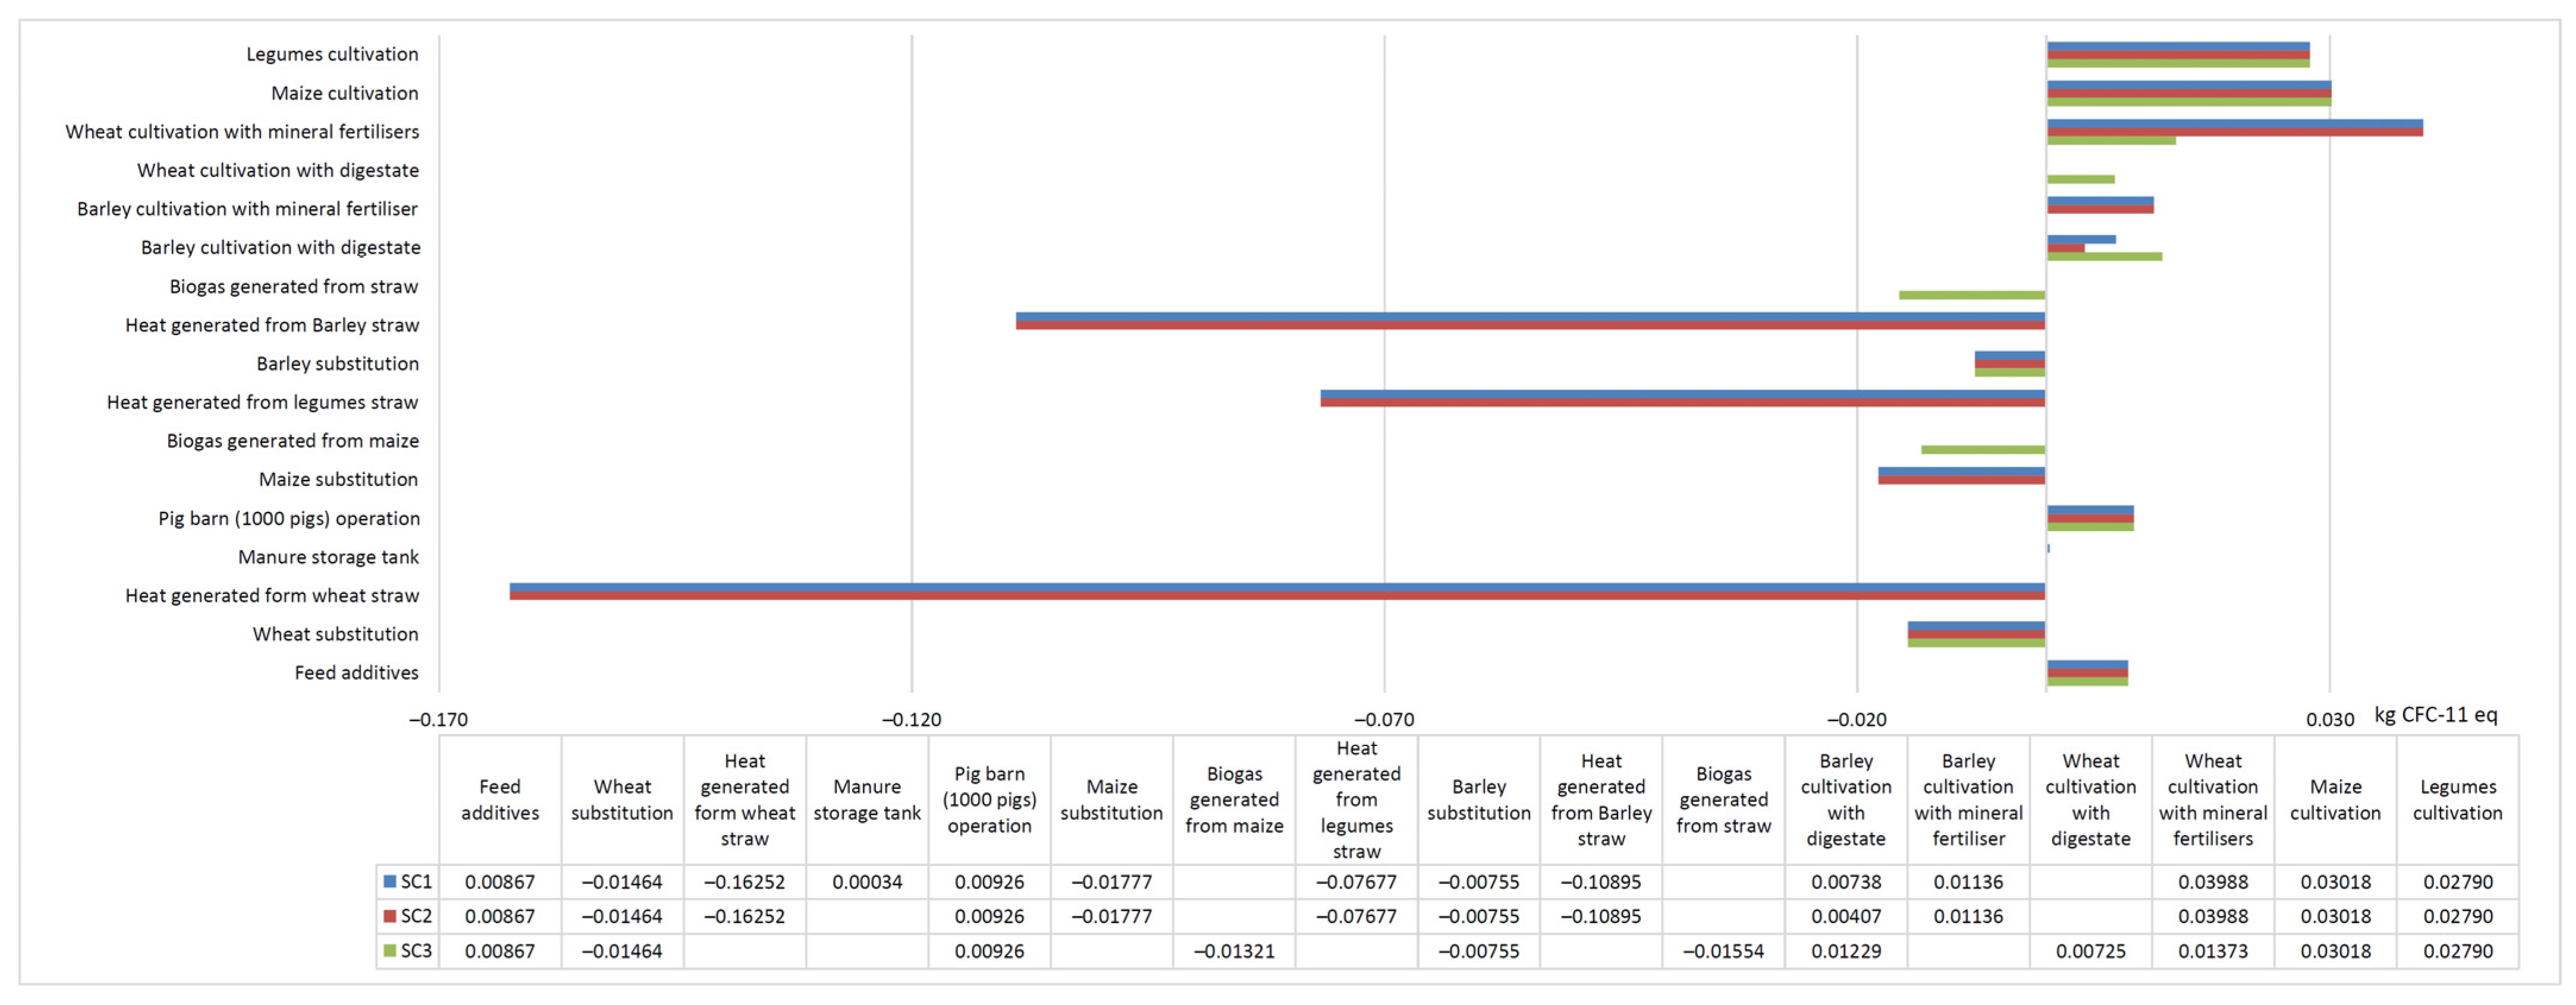
3.3. Environmental Indicators of Pig Farming
4. Conclusions
Author Contributions
Funding
Institutional Review Board Statement
Informed Consent Statement
Data Availability Statement
Conflicts of Interest
References
- Awasthi, A.K.; Cheela, V.R.S.; D’Adamo, I.; Iacovidou, E.; Islam, M.R.; Johnson, M.; Miller, T.R.; Parajuly, K.; Parchomenko, A.; Radhakrishan, L.; et al. Zero waste approach towards a sustainable waste management. Resour. Environ. Sustain. 2021, 3, 100014. [Google Scholar] [CrossRef]
- MacLeod, M.J.; Hasan, M.R.; Robb, D.H.F.; Mamun-Ur-Rashid, M. Quantifying greenhouse gas emissions from global aquaculture. Sci. Rep. 2020, 10, 11679. [Google Scholar] [CrossRef] [PubMed]
- Macleod, M.; Gerber, P.; Mottet, A.; Tempio, G.; Falcucci, A.; Opio, C.; Vellinga, T.; Henderson, B.; Steinfeld, H. Greenhouse Gas Emissions from Pig and Chicken Supply Chains—A Global Life Cycle Assessment; Food and Agriculture Organization of the United Nations: Rome, Italy, 2013; ISBN 9789251079447. [Google Scholar]
- Bacenetti, J.; Sala, C.; Fusi, A.; Fiala, M. Agricultural anaerobic digestion plants: What LCA studies pointed out and what can be done to make them more environmentally sustainable. Appl. Energy 2016, 179, 669–686. [Google Scholar] [CrossRef] [Green Version]
- Saracevic, E.; Koch, D.; Stuermer, B.; Mihalyi, B.; Miltner, A.; Friedl, A. Economic and global warming potential assessment of flexible power generation with biogas plants. Sustainability 2019, 11, 2530. [Google Scholar] [CrossRef] [Green Version]
- Sutton, M.A.; Howard, C.M.; Erisman, J.W.; Billen, G.; Bleeker, A.; Grennfelt, P.; van Grinsven, H.; Grizzetti, B. Assessing our nitrogen inheritance. In The European Nitrogen Assessment; Sutton, M.A., Howard, C.M., Erisman, J.W., Billen, G., Bleeker, A., Grennfelt, P., van Grinsven, H., Grizzetti, B., Eds.; Cambridge University Press: Cambridge, UK, 2011; pp. 1–6. [Google Scholar] [CrossRef]
- Howarth, R. Nitrogen in Freshwater Systems and Estuaries Nitrogen; Elsevier Inc.: Amsterdam, The Netherlands, 2014; ISBN 9780124095489. [Google Scholar]
- Chandini, R.K.; Kumar, R.; Om, P. The impact of chemical fertilizers on our environment and ecosystem. In Research Trends in Environmental Sciences, 2nd ed.; AkiNik Publications: New Delhi, India, 2019; pp. 69–86. [Google Scholar]
- Yousaf, M.; Li, J.; Lu, J.; Ren, T.; Cong, R.; Fahad, S.; Li, X. Effects of fertilization on crop production and nutrient-supplying capacity under rice-oilseed rape rotation system. Sci. Rep. 2017, 7, 1270. [Google Scholar] [CrossRef]
- Mari, G.R.; Ji, C.; Zhou, J. Effects of soil compaction on soil physical properties and nitrogen, phosphorus, potassium uptake in wheat plants. Trans. CSAE 2008, 24, 74–79. [Google Scholar]
- Manici, L.M.; Caputo, F.; Cappelli, G.A.; Ceotto, E. Can repeated soil amendment with biogas digestates increase soil suppressiveness toward non-specific soil-borne pathogens in agricultural lands? Renew. Agric. Food Syst. 2020, 36, 353–364. [Google Scholar] [CrossRef]
- Brenzinger, K.; Drost, S.M.; Korthals, G.; Bodelier, P.L.E. Organic Residue amendments to modulate greenhouse gas emissions from agricultural soils. Front. Microbiol. 2018, 9, 3035. [Google Scholar] [CrossRef] [Green Version]
- Sapp, M.; Harrison, M.; Hany, U.; Charlton, A.; Thwaites, R. Comparing the effect of digestate and chemical fertiliser on soil bacteria. Appl. Soil Ecol. 2015, 86, 1–9. [Google Scholar] [CrossRef]
- Corden, C.; Bougas, K.; Cunningham, E.; Tyrer, D.; Kreißig, J.; Crookes, M. Digestate and Compost as Fertilisers: Risk Assessment and Risk Management Options; European Commission, Directorate General–Environment: Brussels, Belgium, 2019. [Google Scholar]
- Timonen, K.; Sinkko, T.; Luostarinen, S.; Tampio, E.; Joensuu, K. LCA of anaerobic digestion: Emission allocation for energy and digestate. J. Clean. Prod. 2019, 235, 1567–1579. [Google Scholar] [CrossRef]
- Duan, N.; Khoshnevisan, B.; Lin, C.; Liu, Z.; Liu, H. Life cycle assessment of anaerobic digestion of pig manure coupled with different digestate treatment technologies. Environ. Int. 2020, 137, 105522. [Google Scholar] [CrossRef] [PubMed]
- Barzee, T.J.; Edalati, A.; El-Mashad, H.; Wang, D.; Scow, K.; Zhang, R. Digestate biofertilizers support similar or higher tomato yields and quality than mineral fertilizer in a subsurface drip fertigation system. Front. Sustain. Food Syst. 2019, 3, 58. [Google Scholar] [CrossRef]
- He, P.J. Anaerobic digestion: An intriguing long history in China. Waste Manag. 2010, 30, 549–550. [Google Scholar] [CrossRef] [PubMed]
- Nianguo, L. Biogas in China. Trends Biotechnol. 1984, 2, 77–79. [Google Scholar] [CrossRef]
- Alburquerque, J.A.; de la Fuente, C.; Ferrer-Costa, A.; Carrasco, L.; Cegarra, J.; Abad, M.; Bernal, M.P. Assessment of the fertiliser potential of digestates from farm and agroindustrial residues. Biomass Bioenergy 2012, 40, 181–189. [Google Scholar] [CrossRef]
- Wilkie, A.C. Anaerobic Digestion of Dairy Manure: Design and Process Consideration; Natural Resource, Agriculture, and Engineering Service, Cornell University: New York, NY, USA, 2005; pp. 301–312. [Google Scholar]
- Drury, C.F.; Tan, C.S.; Welacky, T.W.; Reynolds, W.D.; Zhang, T.Q.; Oloya, T.O.; McLaughlin, N.B.; Gaynor, J.D. Reducing nitrate loss in tile drainage water with cover crops and water-table management systems. J. Environ. Qual. 2014, 43, 587–598. [Google Scholar] [CrossRef]
- Ibrahim, M.; Alhameid, A.; Kumar, S.; Chintala, R.; Sexton, P.; Malo, D.; Schumacher, T. Long-Term Tillage and Crop Rotation Impacts on a Northern Great Plainsmollisol. Adv. Crop Sci. Technol. 2015, 3, 1000178. [Google Scholar] [CrossRef]
- Styles, D.; Dominguez, E.M.; Chadwick, D. Environmental balance of the UK biogas sector: An evaluation by consequential life cycle assessment. Sci. Total Environ. 2016, 560–561, 241–253. [Google Scholar] [CrossRef] [Green Version]
- ISO 14040:2006; The International Standards Organisation. International Organization for Standardization: Geneva, Switzerland, 2006.
- Rejane Rigon, M.; Zortea, R.; Alberto Mendes Moraes, C.; Célia Espinosa Modolo, R. Suggestion of life cycle impact assessment methodology: Selection criteria for environmental impact categories. In New Frontiers on Life Cycle Assessment-Theory and Application; IntechOpen: London, UK, 2019. [Google Scholar]
- Park, W.-J.; Kim, R.; Roh, S.; Ban, H. Analysis of major environmental impact categories of road construction materials. Sustainability 2020, 12, 6951. [Google Scholar] [CrossRef]
- Product Environmental Footprint (PEF) Guide. Available online: http://ec.europa.eu/environment/eussd/pdf/footprint/PEF methodology final draft.pdf (accessed on 11 February 2022).
- Hutchings, N.J.; Hoeve, M.T.; Jensen, R.; Bruun, S.; Søtoft, L.F. Modelling the potential of slurry management technologies to reduce the constraints of environmental legislation on pig production. J. Environ. Manag. 2013, 130, 447–456. [Google Scholar] [CrossRef]
- Noya, I.; Villanueva-Rey, P.; González-García, S.; Fernandez, M.D.; Rodriguez, M.R.; Moreira, M.T. Life cycle assessment of pig production: A case study in Galicia. J. Clean. Prod. 2017, 142, 4327–4338. [Google Scholar] [CrossRef]
- Ogino, A.; Osada, T.; Takada, R.; Takagi, T.; Tsujimoto, S.; Tonoue, T.; Matsui, D.; Katsumata, M.; Yamashita, T.; Tanaka, Y. Life cycle assessment of Japanese pig farming using low-protein diet supplemented with amino acids. Soil Sci. Plant Nutr. 2013, 59, 107–118. [Google Scholar] [CrossRef]
- Guinée, J.B.; Heijungs, R.; Huppes, G.; Kleijn, R.; de Koning, A.; van Oers, L.; Wegener Sleeswijk, A.; Suh, S.; Udo de Haes, H.A.; de Bruijn, H.; et al. Life Cycle Assessment. Operational Guide to the ISO Standards. I: LCA in Perspective. IIa: Guide. IIb: Operational Annex. III: Scientific Background; Ministries of the Netherlands: Dordrecht, The Netherlands, 2002; p. 692.
- Castellani, V.; Sala, S.; Benini, L. Hotspots analysis and critical interpretation of food life cycle assessment studies for selecting eco-innovation options and for policy support. J. Clean. Prod. 2017, 140, 556–568. [Google Scholar] [CrossRef]
- Wernet, G.; Bauer, C.; Steubing, B.; Reinhard, J.; Moreno-Ruiz, E.; Weidema, B. The ecoinvent database version 3 (part I): Overview and methodology. Int. J. Life Cycle Assess. 2016, 21, 1218–1230. [Google Scholar] [CrossRef]
- Order No. 3D-419 Order of the Minister for Agriculture for the Minister of Agriculture in 27 January 2010 Order No. 3D-50 “On the Amendment of the Rules for the Technological Design of Pigs in the Agriculture TPT 02: 2010” (1 July 2021 No. 3D-419, TAR, 2021-07-01, code 202. 2021. Available online: https://www.e-tar.lt/portal/en/legalAct/6d1c98b0da3311eb9f09e7df20500045 (accessed on 6 December 2021).
- Yield of Agricultural Crops. Available online: https://osp.stat.gov.lt/statistiniu-rodikliu-analize?hash=80098c78-93c6-447e-98a1-acccae5ff144#/ (accessed on 8 October 2021).
- Parajuli, R.; Dalgaard, T.; Birkved, M. Can farmers mitigate environmental impacts through combined production of food, fuel and feed? A consequential life cycle assessment of integrated mixed crop-livestock system with a green biorefinery. Sci. Total Environ. 2018, 619–620, 127–143. [Google Scholar] [CrossRef] [Green Version]
- Beausang, C.; McDonnell, K.; Murphy, F. Anaerobic digestion of poultry litter—A consequential life cycle assessment. Sci. Total Environ. 2020, 735, 139494. [Google Scholar] [CrossRef]
- Sommer, S.G.; Maahn, M.; Poulsen, H.D.; Hjorth, M.; Sehested, J. Interactions between phosphorus feeding strategies for pigs and dairy cows and separation efficiency of slurry. Environ. Technol. 2008, 29, 75–80. [Google Scholar] [CrossRef]
- Xi, Y.; Liu, Y.; Ye, X.; Du, J.; Kong, X.; Guo, D.; Xiao, Q. Enhanced anaerobic biogas production from wheat straw by herbal-extraction process residues supplementation. Front. Bioeng. Biotechnol. 2021, 9, 281. [Google Scholar] [CrossRef]
- Franco, R.T.; Buffière, P.; Bayard, R. Ensiling for biogas production: Critical parameters. A review. Biomass Bioenergy 2016, 94, 94–104. [Google Scholar] [CrossRef] [Green Version]
- Murphy, J.; Bochmann, G.; Weiland, P.; Wellinger, A. Biogas from Crop Digestion. In IEA Bioenergy-Task 37; Vienna University of Technology: Vienna, Austria, 2011. [Google Scholar]
- Marcato, C.E.; Pinelli, E.; Pouech, P.; Winterton, P.; Guiresse, M. Particle size and metal distributions in anaerobically digested pig slurry. Bioresour. Technol. 2008, 99, 2340–2348. [Google Scholar] [CrossRef] [Green Version]
- Møller, H.B.; Sørensen, P.; Olesen, J.E.; Petersen, S.O.; Nyord, T.; Sommer, S.G. Agricultural biogas production—climate and environmental impacts. Sustainability 2022, 14, 1849. [Google Scholar] [CrossRef]
- Wang, Z.; Jiang, Y.; Wang, S.; Zhang, Y.; Hu, Y.; Hu, Z.-H.; Wu, G.; Zhan, X. Impact of total solids content on anaerobic co-digestion of pig manure and food waste: Insights into shifting of the methanogenic pathway. Waste Manag. 2020, 114, 96–106. [Google Scholar] [CrossRef] [PubMed]
- Yang, L.; Xu, F.; Ge, X.; Li, Y. Challenges and strategies for solid-state anaerobic digestion of lignocellulosic biomass. Renew. Sustain. Energy Rev. 2015, 44, 824–834. [Google Scholar] [CrossRef]
- Cotana, F.; Cavalaglio, G.; Petrozzi, A.; Coccia, V. Lignocellulosic biomass feeding in biogas pathway: State of the art and plant layouts. Energy Procedia 2015, 81, 1231–1237. [Google Scholar] [CrossRef] [Green Version]
- Feng, L.; Perschke, Y.M.L.; Fontaine, D.; Ward, A.J.; Eriksen, J.; Sørensen, P.; Møller, H.B. Co-ensiling of cover crops and barley straw for biogas production. Renew. Energy 2019, 142, 677–683. [Google Scholar] [CrossRef]
- Gunnarsson, A. Plant-Based Biogas Production for Improved Nutrient Management of Beetroot in Stockless Organic Farming; Sveriges lantbruksuniversitet: Uppsala, Sweden, 2012. [Google Scholar]
- Liao, X.; Gerichhausen, M.J.W.; Bengoa, X.; Rigarlsford, G.; Beverloo, R.H.; Bruggeman, Y.; Rossi, V. Large-scale regionalised LCA shows that plant-based fat spreads have a lower climate, land occupation and water scarcity impact than dairy butter. Int. J. Life Cycle Assess. 2020, 25, 1043–1058. [Google Scholar] [CrossRef] [Green Version]
- Benoist, A.; Dron, D.; Zoughaib, A. Origins of the debate on the life-cycle greenhouse gas emissions and energy consumption of first-generation biofuels—A sensitivity analysis approach. Biomass Bioenergy 2012, 40, 133–142. [Google Scholar] [CrossRef]
- Weidema, B. Market Information in Life Cycle Assessment; Miljøstyrelsen: København, Denmark, 2003; p. 863. [Google Scholar]
- Lechón, Y.; Cabal, H.; Saez, R. Life cycle analysis of wheat and barley crops for bioethanol production in Spain. Int. J. Agric. Resour. Gov. Ecol. 2005, 4, 113. [Google Scholar] [CrossRef]
- Lijó, L.; González-García, S.; Bacenetti, J.; Fiala, M.; Feijoo, G.; Lema, J.M.; Moreira, M.T. Life Cycle Assessment of electricity production in Italy from anaerobic co-digestion of pig slurry and energy crops. Renew. Energy 2014, 68, 625–635. [Google Scholar] [CrossRef] [Green Version]
- Dalgaard, R.; Halberg, N.; Kristensen, I.S.; Larsen, I. Modelling representative and coherent Danish farm types based on farm accountancy data for use in environmental assessments. Agric. Ecosyst. Environ. 2006, 117, 223–237. [Google Scholar] [CrossRef] [Green Version]
- Arulnathan, V.; Heidari, M.D.; Pelletier, N. Internal causality in agri-food Life Cycle Assessments: Solving allocation problems based on feed energy utilization in egg production. J. Environ. Manag. 2022, 309, 114673. [Google Scholar] [CrossRef] [PubMed]
- Adams, P.; Mezzullo, W.; McManus, M. Biomass sustainability criteria: Greenhouse gas accounting issues for biogas and biomethane facilities. Energy Policy 2015, 87, 95–109. [Google Scholar] [CrossRef] [Green Version]
- Rodias, E.; Berruto, R.; Busato, P.; Bochtis, D.; Sørensen, C.G.; Zhou, K. Energy Savings from Optimised In-Field Route Planning for Agricultural Machinery. Sustainability 2017, 9, 1956. [Google Scholar] [CrossRef] [Green Version]
- Salemdeeb, R.; Saint, R.; Clark, W.; Lenaghan, M.; Pratt, K.; Millar, F. A pragmatic and industry-oriented framework for data quality assessment of environmental footprint tools. Resour. Environ. Sustain. 2021, 3, 100019. [Google Scholar] [CrossRef]
- Montemayor, E.; Bonmatí, A.; Torrellas, M.; Camps, F.; Ortiz, C.; Domingo, F.; Riau, V.; Antón, A. Environmental accounting of closed-loop maize production scenarios: Manure as fertilizer and inclusion of catch crops. Resour. Conserv. Recycl. 2019, 146, 395–404. [Google Scholar] [CrossRef]
- Parajuli, R.; Løkke, S.; Østergaard, P.A.; Knudsen, M.T.; Schmidt, J.H.; Dalgaard, T. Life Cycle Assessment of district heat production in a straw fired CHP plant. Biomass Bioenergy 2014, 68, 115–134. [Google Scholar] [CrossRef]
- Pardo, G.; Moral, R.; del Prado, A. SIMSWASTE-AD—A modelling framework for the environmental assessment of agricultural waste management strategies: Anaerobic digestion. Sci. Total Environ. 2017, 574, 806–817. [Google Scholar] [CrossRef]
- Adams, P.; Bridgwater, T.; Lea-Langton, A.; Ross, A.; Watson, I. Chapter 8–Biomass Conversion Technologies. In Greenhouse Gas Balances of Bioenergy Systems; Academic Press: Cambridge, MA, USA, 2018; pp. 107–139. [Google Scholar] [CrossRef]
- Tonini, D.; Vadenbo, C.; Astrup, T.F. Priority of domestic biomass resources for energy: Importance of national environmental targets in a climate perspective. Energy 2017, 124, 295–309. [Google Scholar] [CrossRef]
- Cooper, J.; Butler, G.; Leifert, C. Life cycle analysis of greenhouse gas emissions from organic and conventional food production systems, with and without bio-energy options. NJAS Wagening. J. Life Sci. 2011, 58, 185–192. [Google Scholar] [CrossRef] [Green Version]
- Pampillón-González, L.; Luna-Guido, M.; Valdiviezo, V.M.R.; Franco-Hernández, O.; Fernández-Luqueño, F.; Paredes-López, O.; Hernández, G.; Dendooven, L. Greenhouse Gas Emissions and Growth of Wheat Cultivated in Soil Amended with Digestate from Biogas Production. Pedosphere 2017, 27, 318–327. [Google Scholar] [CrossRef]
- Brockmann, D.; Hanhoun, M.; Négri, O.; Hélias, A. Environmental assessment of nutrient recycling from biological pig slurry treatment—Impact of fertilizer substitution and field emissions. Bioresour. Technol. 2014, 163, 270–279. [Google Scholar] [CrossRef] [PubMed]
- Møller, J.; Boldrin, A.; Christensen, T.H. Anaerobic digestion and digestate use: Accounting of greenhouse gases and global warming contribution. Waste Manag. Res. 2009, 27, 813–824. [Google Scholar] [CrossRef] [PubMed] [Green Version]
- Slorach, P.C.; Jeswani, H.K.; Cuéllar-Franca, R.; Azapagic, A. Environmental sustainability of anaerobic digestion of household food waste. J. Environ. Manag. 2019, 236, 798–814. [Google Scholar] [CrossRef] [PubMed]
- Shakoor, A.; Shakoor, S.; Rehman, A.; Ashraf, F.; Abdullah, M.; Shahzad, S.M.; Farooq, T.H.; Ashraf, M.; Manzoor, M.A.; Altaf, M.M. Effect of animal manure, crop type, climate zone, and soil attributes on greenhouse gas emissions from agricultural soils—A global meta-analysis. J. Clean. Prod. 2021, 278, 124019. [Google Scholar] [CrossRef]
- Tonhauzer, K.; Tonhauzer, P.; Szemesová, J.; Šiška, B. Estimation of N2O emissions from agricultural soils and determination of Nitrogen Leakage. Atmosphere 2020, 11, 552. [Google Scholar] [CrossRef]


| Indicator | 30–60 kg Live Weight Pigs | 60–100 kg Live Weight Pigs |
|---|---|---|
| Liquid manure generation per pig, kg/day | 5.0 | 6.5 |
| Totally manure kg/day | 5750.0 | |
| Totally manure t/year | 2098.8 | |
| Indicator | Feed Composition, % | Totally per Year, t | |
|---|---|---|---|
| Live Weight | 30–60 kg | 60–100 kg | |
| Barley flour | 27.9 | 32.5 | 602.0 |
| Wheat flour | 27.6 | 32.3 | 597.2 |
| Pea flour | 30.0 | 30.0 | 591.3 |
| Sunflower meal | 5.0 | 0.0 | 42.0 |
| Rapeseed cake | 4.2 | 2.0 | 57.9 |
| Fish meal | 1.5 | 0.0 | 12.6 |
| Dicalcium phosphate | 0.8 | 1.1 | 19.2 |
| Feed chalk | 1.0 | 0.9 | 18.6 |
| Premix (vitamin complex) | 1.0 | 1.0 | 19.7 |
| Table salt (NaCl) | 1.0 | 0.2 | 10.7 |
| Totally | 100 | 100 | 1971.2 |
| Plant Type | Yield, t/ha | Yearly Consumption for Feed, t | Yearly Surplus Feedstock for Substituting Crops on Market, t | Land Area Requirement to Meet Farm Needs, ha |
|---|---|---|---|---|
| Barley | 3.29 | 602 | 306 | 183 |
| Wheat | 4.53 | 597 | 652 | 132 |
| Pea | 2.14 | 591 | 0 | 276 |
| Maize | 27.35 | - | 7549 | 276 |
| Operation | Operating Machinery, Implements, Power | Spring Barley | Spring Wheat | Maize | Legumes (Peas) | ||||
|---|---|---|---|---|---|---|---|---|---|
| SC1 | SC2 | SC3 | SC1 | SC2 | SC3 | SC1, SC2, CS3 | SC1, SC2, CS3 | ||
| Units | MJ/ha | MJ/ha | MJ/ha | MJ/ha | MJ/ha | MJ/ha | MJ/ha | MJ/ha | |
| Ploughing | Tractor 120 kW + 4-share plough | 402 | 402 | 402 | 402 | 402 | 402 | 402 | 402 |
| Disc harrowing | Tractor 120 kW + Rotary Harrow 6 m | 257 | 257 | 257 | 257 | 257 | 257 | 257 | 257 |
| Transportation of mineral fertilizers | Truck 24 t, 440 kW | 11 | 11 | - | 11 | 11 | 11 | 11 | - |
| Fertilizer spreading | Tractor 78 kW + Fertilizer Spreader | 29 | 29 | - | 29 | 29 | 29 | 32 | 36 |
| Pre-sowing tillage | Case 160 AG, germinator 6 mg | 181 | 181 | 181 | 181 | 181 | 181 | 181 | 181 |
| Sowing | Tractor 78 kW; Seeder Fiona 3 m | 250 | 250 | 250 | 250 | 250 | 250 | 250 | 250 |
| Application of organic liquid fertilizers. First insertion | Case 160 AG + 8.8 m3 capacity GT series slurry truck with insertion system | 367 | 367 | 367 | - | 375 | 375 | - | - |
| Spring spraying | CASE 105 AG, sprayer, 12 m | 60 | 60 | 60 | 60 | 60 | 60 | 60 | 60 |
| Application of organic liquid fertilizers. Second insertion | Case 160 AG + 8.8 m3 capacity GT series slurry truck with insertion system | 367 | 367 | 367 | - | 375 | 375 | - | - |
| Spraying 1 | CASE 105 AG, sprayer, 12 m | 60 | 60 | 60 | 60 | 60 | 60 | 60 | 60 |
| Spraying 2 | CASE 105 AG, sprayer, 12 m | 60 | 60 | 60 | 60 | 60 | 60 | 60 | - |
| Spraying 3 | CASE 105 AG, sprayer, 12 m | 60 | 60 | 60 | 60 | 60 | 60 | - | - |
| Harvesting (crops) | Class Tucano, 238 AG, 5.4 m | 982 | 982 | 982 | 982 | 982 | 982 | - | 982 |
| Harvesting (maize) | Self-propelled forage harvester, 580 kW + tractor 160 kW | - | - | - | - | - | - | 470 | - |
| Transportation of organic liquid fertilizers | Tank truck MAN, 162 kW, capacity 8 m3 | 884 | 884 | 884 | - | 884 | 884 | - | - |
| Total | 3970 | 3970 | 3930 | 2352 | 3986 | 3986 | 1783 | 2228 | |
| Stage | Input/Output/Process | Units | SC1 | SC2 | SC3 | |||
|---|---|---|---|---|---|---|---|---|
| In | Out | In | Out | In | Out | |||
| Cultivation | Fuel (diesel) | kg | 231,389 | 231,389 | 197,252 | |||
| Nitrogen fertilizer, inorganic | kg | 55,658.4 | 55,658.4 | 17,732.6 | ||||
| Potassium chloride as K2O | kg | 64,086.5 | 64,086.5 | 25,801.3 | ||||
| Agrochemicals (pesticides, herbicides, fungicides) | kg | 1959.4 | 1959.4 | 2186.6 | ||||
| Land | ha | 1104 | 1104 | 1104 | ||||
| Electricity | MJ | 196,290 | 196,290 | 219,330 | ||||
| Heat | MJ | 2,899,980 | 2,899,980 | 36,105 | ||||
| Water | m3 | 6714.2 | 6714.2 | 6714.2 | ||||
| Barley | kg | 908,040 | 908,040 | |||||
| Barley straw | kg | 1,089,648 | 1,089,648 | 1,089,648 | ||||
| Wheat | Kg | 1,250,280 | 1,250,280 | |||||
| Wheat straw | kg | 1,625,364 | 1,625,364 | 1,625,364 | ||||
| Pea | kg | 590,640 | 590,640 | |||||
| Pea straw | kg | 767,832 | 767,832 | 767,832 | ||||
| Maize | kg | 7,548,600 | 7,548,600 | 7,548,600 | ||||
| Manure | kg | 2,098,800 | 2,098,800 | 2,098,800 | ||||
| Digestate | kg | 2,038,150 | 12,738,651 | |||||
| Transportation | t·km | 218,725 | 225,668 | 257,597 | ||||
| Agricultural machinery | kg | 7334.3 | 7448.2 | 2941 | ||||
| Substituted products | Substituted wheat grain | kg | −652,000 | −652,000 | −652,000 | |||
| Substituted barley grain | kg | −306,000 | −306,000 | −306,000 | ||||
| Substituted maize silage | kg | −7,548,600 | −7,548,600 | 0 | ||||
| Substituted ammonium nitrate | kg | −6405 | −6405 | −122,207 | ||||
| Substituted heat | GJ | −146,847 | −146,849 | −4657 | ||||
| Avoided diesel | kg | −4310 | −4310 | −13,340 | ||||
| Impact Category | Unit | SC1 | SC2 | SC3 |
|---|---|---|---|---|
| Global warming (GWP100a) | kg CO2 eq | −2,127,937 | −2,181,688 | −269,389 |
| Eutrophication | kg PO4 eq | −13,775 | −13,894 | −9105 |
| Acidification | kg SO2 eq | −13,388 | −13,703 | −8269 |
| Ozone layer depletion (ODP) | kg CFC-11 eq | −0.253 | −0.257 | 0.0584 |
| Abiotic depletion | kg Sb eq | 21.7 | 20.8 | 13.0 |
| Photochemical oxidation | kg C2H4 eq | 92.3 | 80.7 | 67.4 |
| Terrestrial ecotoxicity | kg 1,4-DB eq | 4709 | 4424 | 4160 |
| Fresh water aquatic ecotoxicity | kg 1,4-DB eq | 605,735 | 574,248 | 378,655 |
| Human toxicity | kg 1,4-DB eq | 853,425 | 809,332 | 539,232 |
| Abiotic depletion (fossil fuels) | MJ | −31,809,456 | −32,364,697 | 5,934,459 |
| Marine aquatic ecotoxicity | kg 1,4-DB eq | 1,257,615,704 | 1,187,382,468 | 755,845,079 |
Publisher’s Note: MDPI stays neutral with regard to jurisdictional claims in published maps and institutional affiliations. |
© 2022 by the authors. Licensee MDPI, Basel, Switzerland. This article is an open access article distributed under the terms and conditions of the Creative Commons Attribution (CC BY) license (https://creativecommons.org/licenses/by/4.0/).
Share and Cite
Venslauskas, K.; Navickas, K.; Rubežius, M.; Tilvikienė, V.; Supronienė, S.; Doyeni, M.O.; Barčauskaitė, K.; Bakšinskaitė, A.; Bunevičienė, K. Environmental Impact Assessment of Sustainable Pig Farm via Management of Nutrient and Co-Product Flows in the Farm. Agronomy 2022, 12, 760. https://doi.org/10.3390/agronomy12040760
Venslauskas K, Navickas K, Rubežius M, Tilvikienė V, Supronienė S, Doyeni MO, Barčauskaitė K, Bakšinskaitė A, Bunevičienė K. Environmental Impact Assessment of Sustainable Pig Farm via Management of Nutrient and Co-Product Flows in the Farm. Agronomy. 2022; 12(4):760. https://doi.org/10.3390/agronomy12040760
Chicago/Turabian StyleVenslauskas, Kęstutis, Kęstutis Navickas, Mantas Rubežius, Vita Tilvikienė, Skaidrė Supronienė, Modupe Olufemi Doyeni, Karolina Barčauskaitė, Aušra Bakšinskaitė, and Kristina Bunevičienė. 2022. "Environmental Impact Assessment of Sustainable Pig Farm via Management of Nutrient and Co-Product Flows in the Farm" Agronomy 12, no. 4: 760. https://doi.org/10.3390/agronomy12040760
APA StyleVenslauskas, K., Navickas, K., Rubežius, M., Tilvikienė, V., Supronienė, S., Doyeni, M. O., Barčauskaitė, K., Bakšinskaitė, A., & Bunevičienė, K. (2022). Environmental Impact Assessment of Sustainable Pig Farm via Management of Nutrient and Co-Product Flows in the Farm. Agronomy, 12(4), 760. https://doi.org/10.3390/agronomy12040760