Article

Humic Substances as Indicator of Degradation Rate of Chernozems in South-Eastern Poland

by
Michał Dudek
*,
Beata Łabaz
,
Magdalena Bednik
and
Agnieszka Medyńska-Juraszek
Institute of Soil Sciences, Plant Nutrition and Environmental Protection, Wrocław University of Environmental and Life Sciences, Grunwaldzka 53 St., 50-375 Wrocław, Poland
*
Author to whom correspondence should be addressed.
Agronomy 2022, 12(3), 733; https://doi.org/10.3390/agronomy12030733
Submission received: 12 February 2022 / Revised: 8 March 2022 / Accepted: 14 March 2022 / Published: 17 March 2022

Abstract

:
Unfavourable quantitative and qualitative changes of soil organic matter result from degradation processes, such as water erosion connected with intense arable land use. In order to take adequate preventive action, the proper indicators of soil quality or degradation are urgently needed. In particular, tests considering the soil organic matter quality seem to be beneficial for soil monitoring. In this paper, we performed organic matter fractionation using the Tyurin and IHSS procedures on eight profiles of chernozemic soils (non-degraded, eroded, forest and accumulative soils). The study conducted confirmed the applicability of using humic and fulvic fractions in order to determine the pedogenesis processes and degradation rates of chernozemic soils. For example, the HA/FA ratio was higher in non-eroded and accumulative soils, compared with eroded or forest profiles. These findings were supported by statistical discrimination performed on the mid-infrared spectra of humic acids extracted from the selected profiles. Groups of samples were divided into classes depending on land usage or degradation rate. Considering the results, fractions of humic substances can be recommended as useful tools for the assessment of soil transformation.

1. Introduction

Soil organic matter (SOM) content and composition are considered as the most important factors reflecting soil quality, particularly in the cases of agricultural land use and sustainability [1]. High content of SOM is typical for productive and fertile soils, as the organic matter has a beneficial impact on both physical and chemical soil properties [2,3]. Due to its complex structure, SOM plays an important role in sorption processes and is a source of macronutrients, such as nitrogen and phosphorus. Therefore, SOM participates in nutrient cycling in terrestrial ecosystems and enhances microbial activity, providing sources of energy for soil microbiomes [4,5]. The physical role of SOM is associated with water retention and stabilization of the soil structure, which are important for plant rooting, soil fauna activity, and resistance to erosion. All these benefits from SOM presence positively affect the crop yields [6], whereas SOM degradation leads to the worsening of physicochemical soil properties and, subsequently, to the lowering of its productivity [7,8]. The decrease in SOM content is caused mostly by human activity, e.g., long-term tillage, which leads to organic matter oxidation, and organic matter removal imbalanced with fertilization (e.g., by manuring, organic mulching, or green manure cropping). Another problem is the soil carbon loss induced by climate change—particularly by the increase in global temperatures, which results in faster organic matter decomposition and the release of carbon dioxide from pools sequestered in the soil [7]. SOM quality and content respond relatively quickly to changes in environmental conditions; hence, it can be considered an indicator of soil transformation and degradation.
Currently, soil degradation is one of the greatest problems concerning agricultural ecosystems. It is defined as the set of physical, chemical, biological and ecological processes that considerably decrease soil quality and potential soil productivity [8,9]. Thus, soil degradation threatens not only the ecological balance of nutrients or carbon, but also food safety [10]. Soils with the highest fertility and greatest potential for productivity play a crucial role in grain production and food security worldwide [11]. In Poland, the most fertile chernozemic soils are permanently threatened by erosion, as they are mostly located in rolling (sloped) landscapes and precipitation outweighs evaporation for most of the year, in particular during the winter season, when soils are poorly protected with plant cover [12,13,14]. Therefore, the soil components may be lost with water surface runoff.
Optimally, attributes used to estimate soil degradation should be sensitive to physical, chemical, and biological changes in environmental properties, and reliable enough to reflect the soil quality. Considering these aforementioned functions, the SOM characteristic seems to be a suitable indicator. However, due to the complexity of SOM, a simple measurement of the total soil organic carbon (SOC) content is insufficient, and more detailed insight into SOM composition is required [15,16]. On the other hand, the most labile organic compounds, commonly generalized as “dissolved organic carbon”, have a relatively rapid turnover because they are readily utilized by microorganisms or leached; thus, their concentration informs us mostly about the current state of the environment influencing SOM stability [17]. The humic substances (HS) are more stable organic matter compounds that constitute a significant pool of total soil C and N [18]. The content and ratios of humic and fulvic acids as the indicators of soil quality have been previously suggested by many authors [2,4,19]. Their observations prove that changes in agriculture practices or land transformation processes can alter the chemical properties of HS [20,21]. For example, Spaccini et al. [22] confirmed that the conversion from forest to arable land caused a progressive decrease in HS concentration in soils.
The objective of this study was to evaluate the usefulness of humic substances as indicators of soil transformation, especially when caused by water erosion or by the impact of different land use. Research was based on the quantitative data from two OM fractionation methods (Tyurin and IHSS) and the qualitative comparison of MIR spectra of organic compounds extracted from examined soils. The obtained results were used to conclude whether soil organic matter fractional composition and/or chemical characteristics may be informative in the studies on pedogenic processes.

2. Materials and Methods
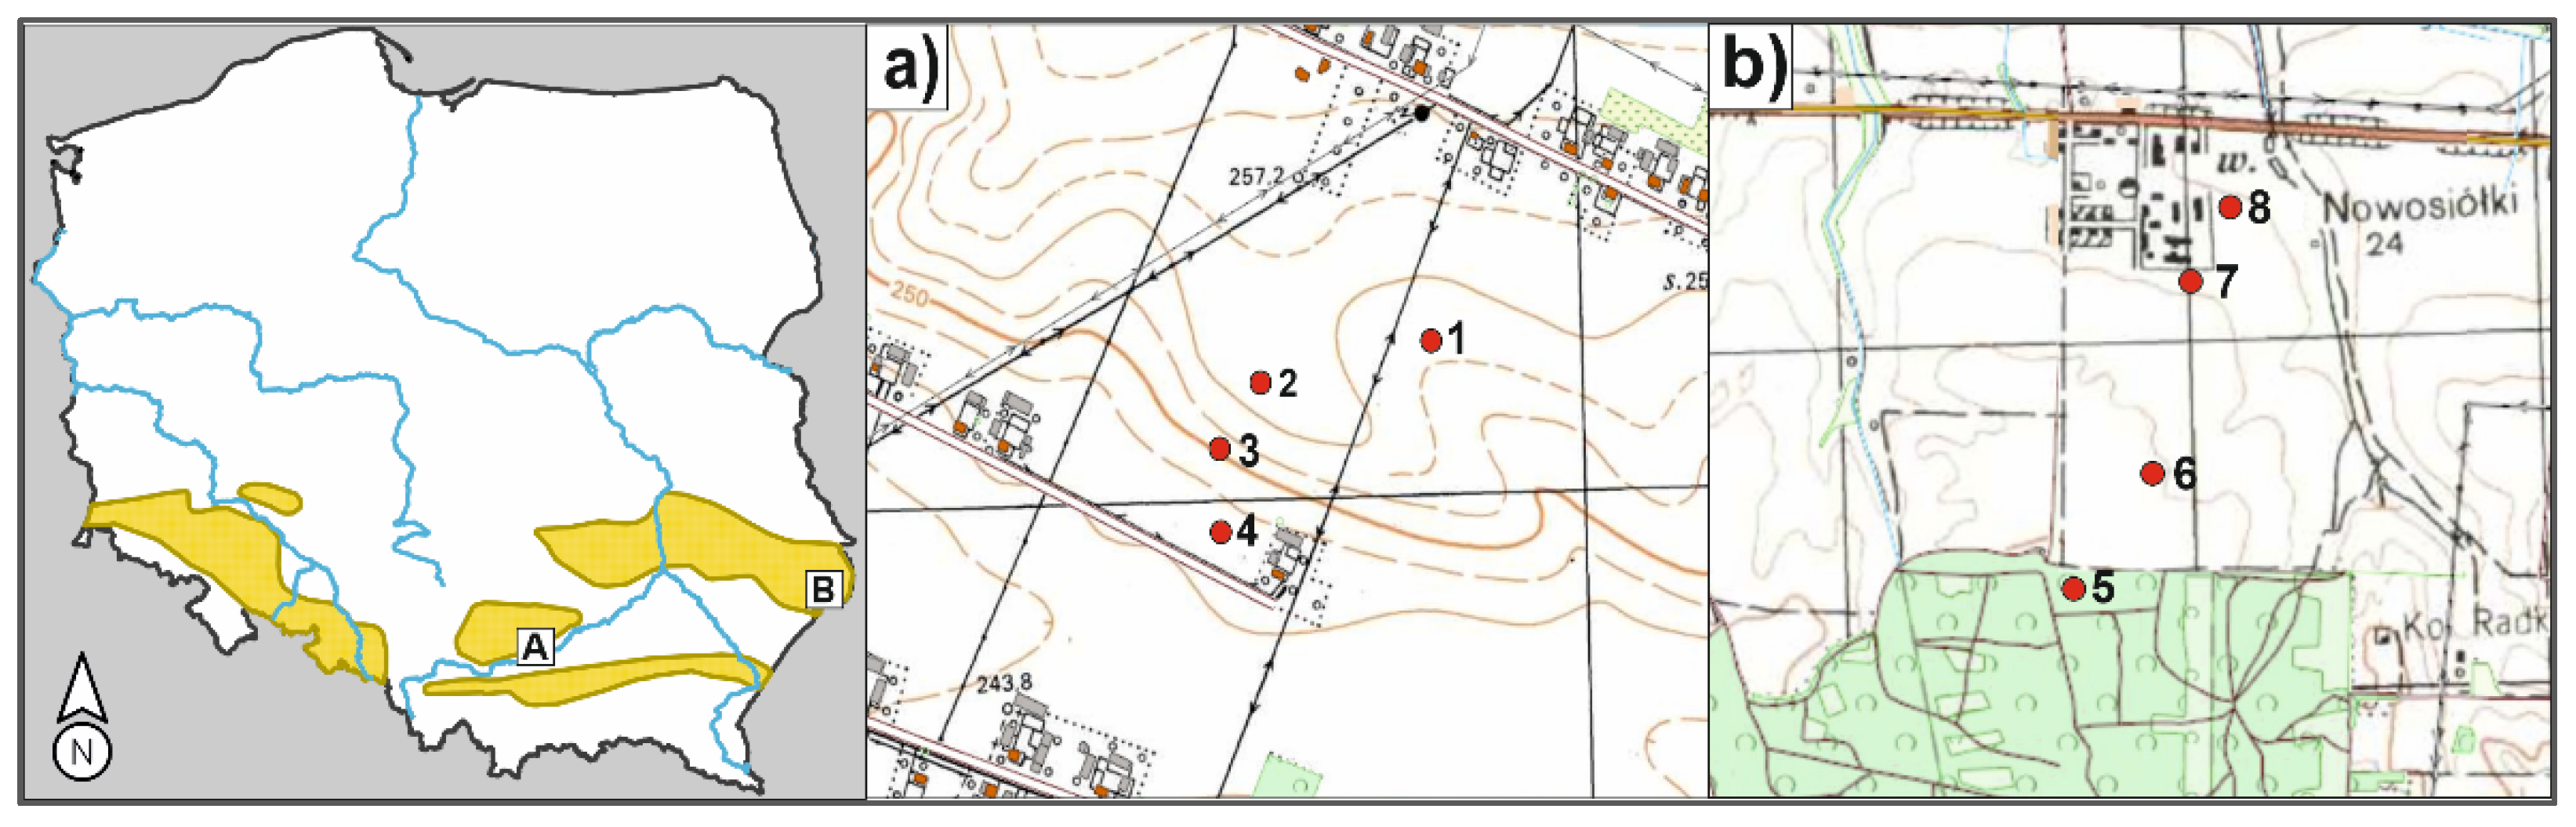
2.1. Area of Study

The research was conducted in 2019 and 2020 in two sequences (catenas) of chernozemic soils located in south-eastern Poland. Both sites are situated within the Central European loess belt, stretching from the Ural Mountains, through southern Poland, up to central Germany. Arable soils developed from loess in a rolling landscape are considered particularly exposed to the processes of erosion [23]. Catena 1 (profiles 1–4) was located on the arable land of the Proszowice Plateau (50°06′ N, 20°00′ E) (Figure 1). Soils of the plateau are developed from loess of variable thickness overlying the Upper Cretaceous limestone, sometimes emerging at the land surface [24]. High annual precipitation (600–650 mm), an undulating landscape, and dominant soil parent material are responsible for high risk and observed rates of water erosion in the plateau [25]. Catena 2 (profiles 5–8) was located in the Hrubieszów Basin (50°30′ N, 23°52′ E), characterized by geomorphological conditions similar to the Proszowice Plateau: elevation 250–300 m a.s.l., rolling landscape, surface coverage with loess, and mean annual precipitation of ca. 550 mm. Soil profiles 6–8 were located on arable field, while profile 5 was located in a broadleaf forest with a predominance of hornbeam (Carpinus betulus L.) and an admixture of oak (Quercus robur L.). Forests cover only small patches of the Proszowice Plateau and the Hrubieszów Basin, and the majority of the soil is used for agricultural purposes, especially for wheat, maize, and rape cultivation.

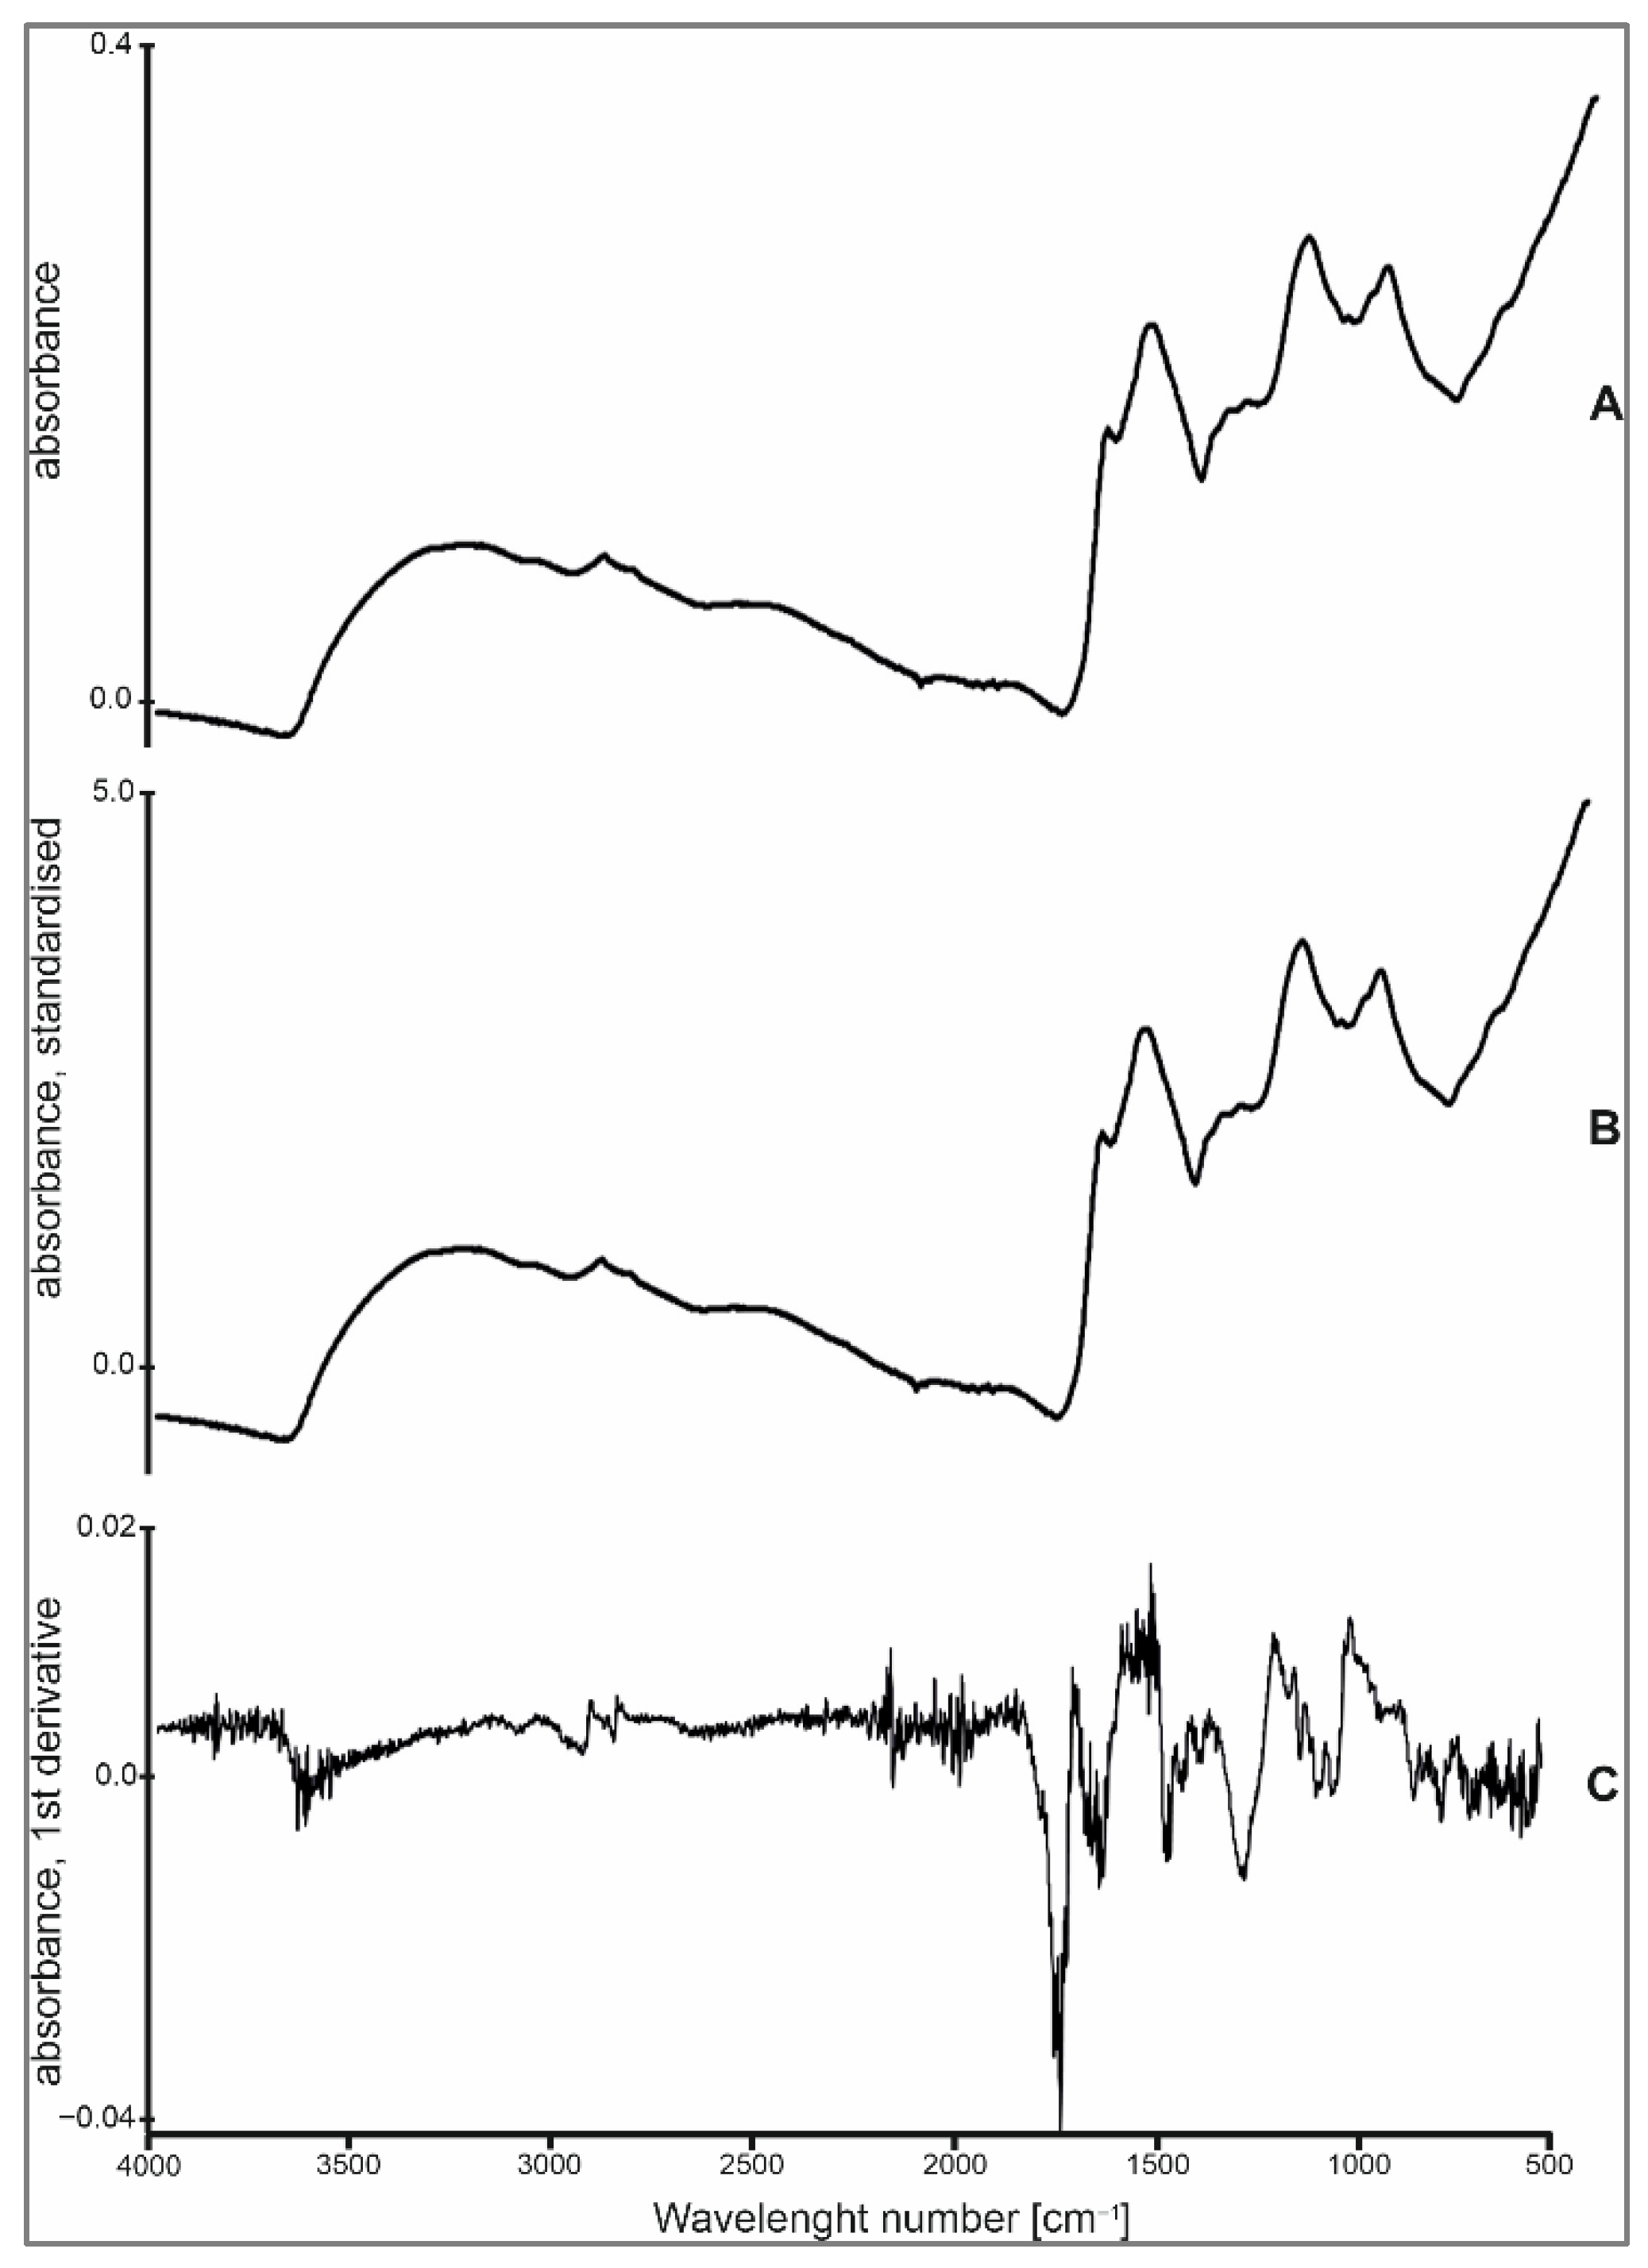
2.2. Sample Preparations and Analysis

The soil profiles were described and classified according to FAO-WRB classification (Table 1) [26]. Soil samples for further laboratory analyses were collected from all morphologically distinguished horizons and subhorizons. In this paper, only the samples from topsoil humus horizons are considered. Complete data of all horizons are available in Supplementary Materials (Table S1). Sample pretreatment included soil drying, crushing and sieving through 2 mm mesh. Particle size distribution was measured by sieve and hydrometer method. Texture classes were assigned according to the USDA standard applied by WRB classification [26]. Soil organic carbon was determined by a dry-combustion method using a CS-MAT 5500 analyser (Ströhlein, Kaarst, Germany). Total nitrogen was measured by the Kjeldahl method (Büchi semi-automated analyser). Soil pH was measured potentiometrically in a distilled water suspension at the soil:water ratio of 1:5 (v/v) (Mettler Toledo, Graifensee, Switzerland). The equivalent of calcium carbonate content was determined volumetrically using Scheibler apparatus (Table 2) [27].
Quantitative fractional composition of organic matter was carried out following the method proposed by Tyurin [28,29] and the International Humic Substances Society (IHSS) [30]. The first method was selected based on its popularity in Central and Eastern Europe. Moreover, findings from our previous work, where we performed the comparison of fractionation methods used in Poland, confirmed its suitability regarding SOM composition [31]. The IHSS extraction method, in turn, is currently recommended as an international standard in studies on humic substances [32]. Both methods allow the obtainment of fractions of humic (HA) and fulvic acids (FA), based on the solubility of examined components in acidic and alkaline solutions. The content of carbon in individual fractions was determined by carbon oxidation with acid dichromate solution. Originally, the Tyurin method allows for the separation of multiple HA and FA fractions, while the IHSS method is much more simplified. For further comparison of the Tyurin and IHSS procedures, the obtained fractions of HA and FA are summed up in Table 3. All partial results of the organic matter fractionation are available in Supplementary Materials (Table S2).

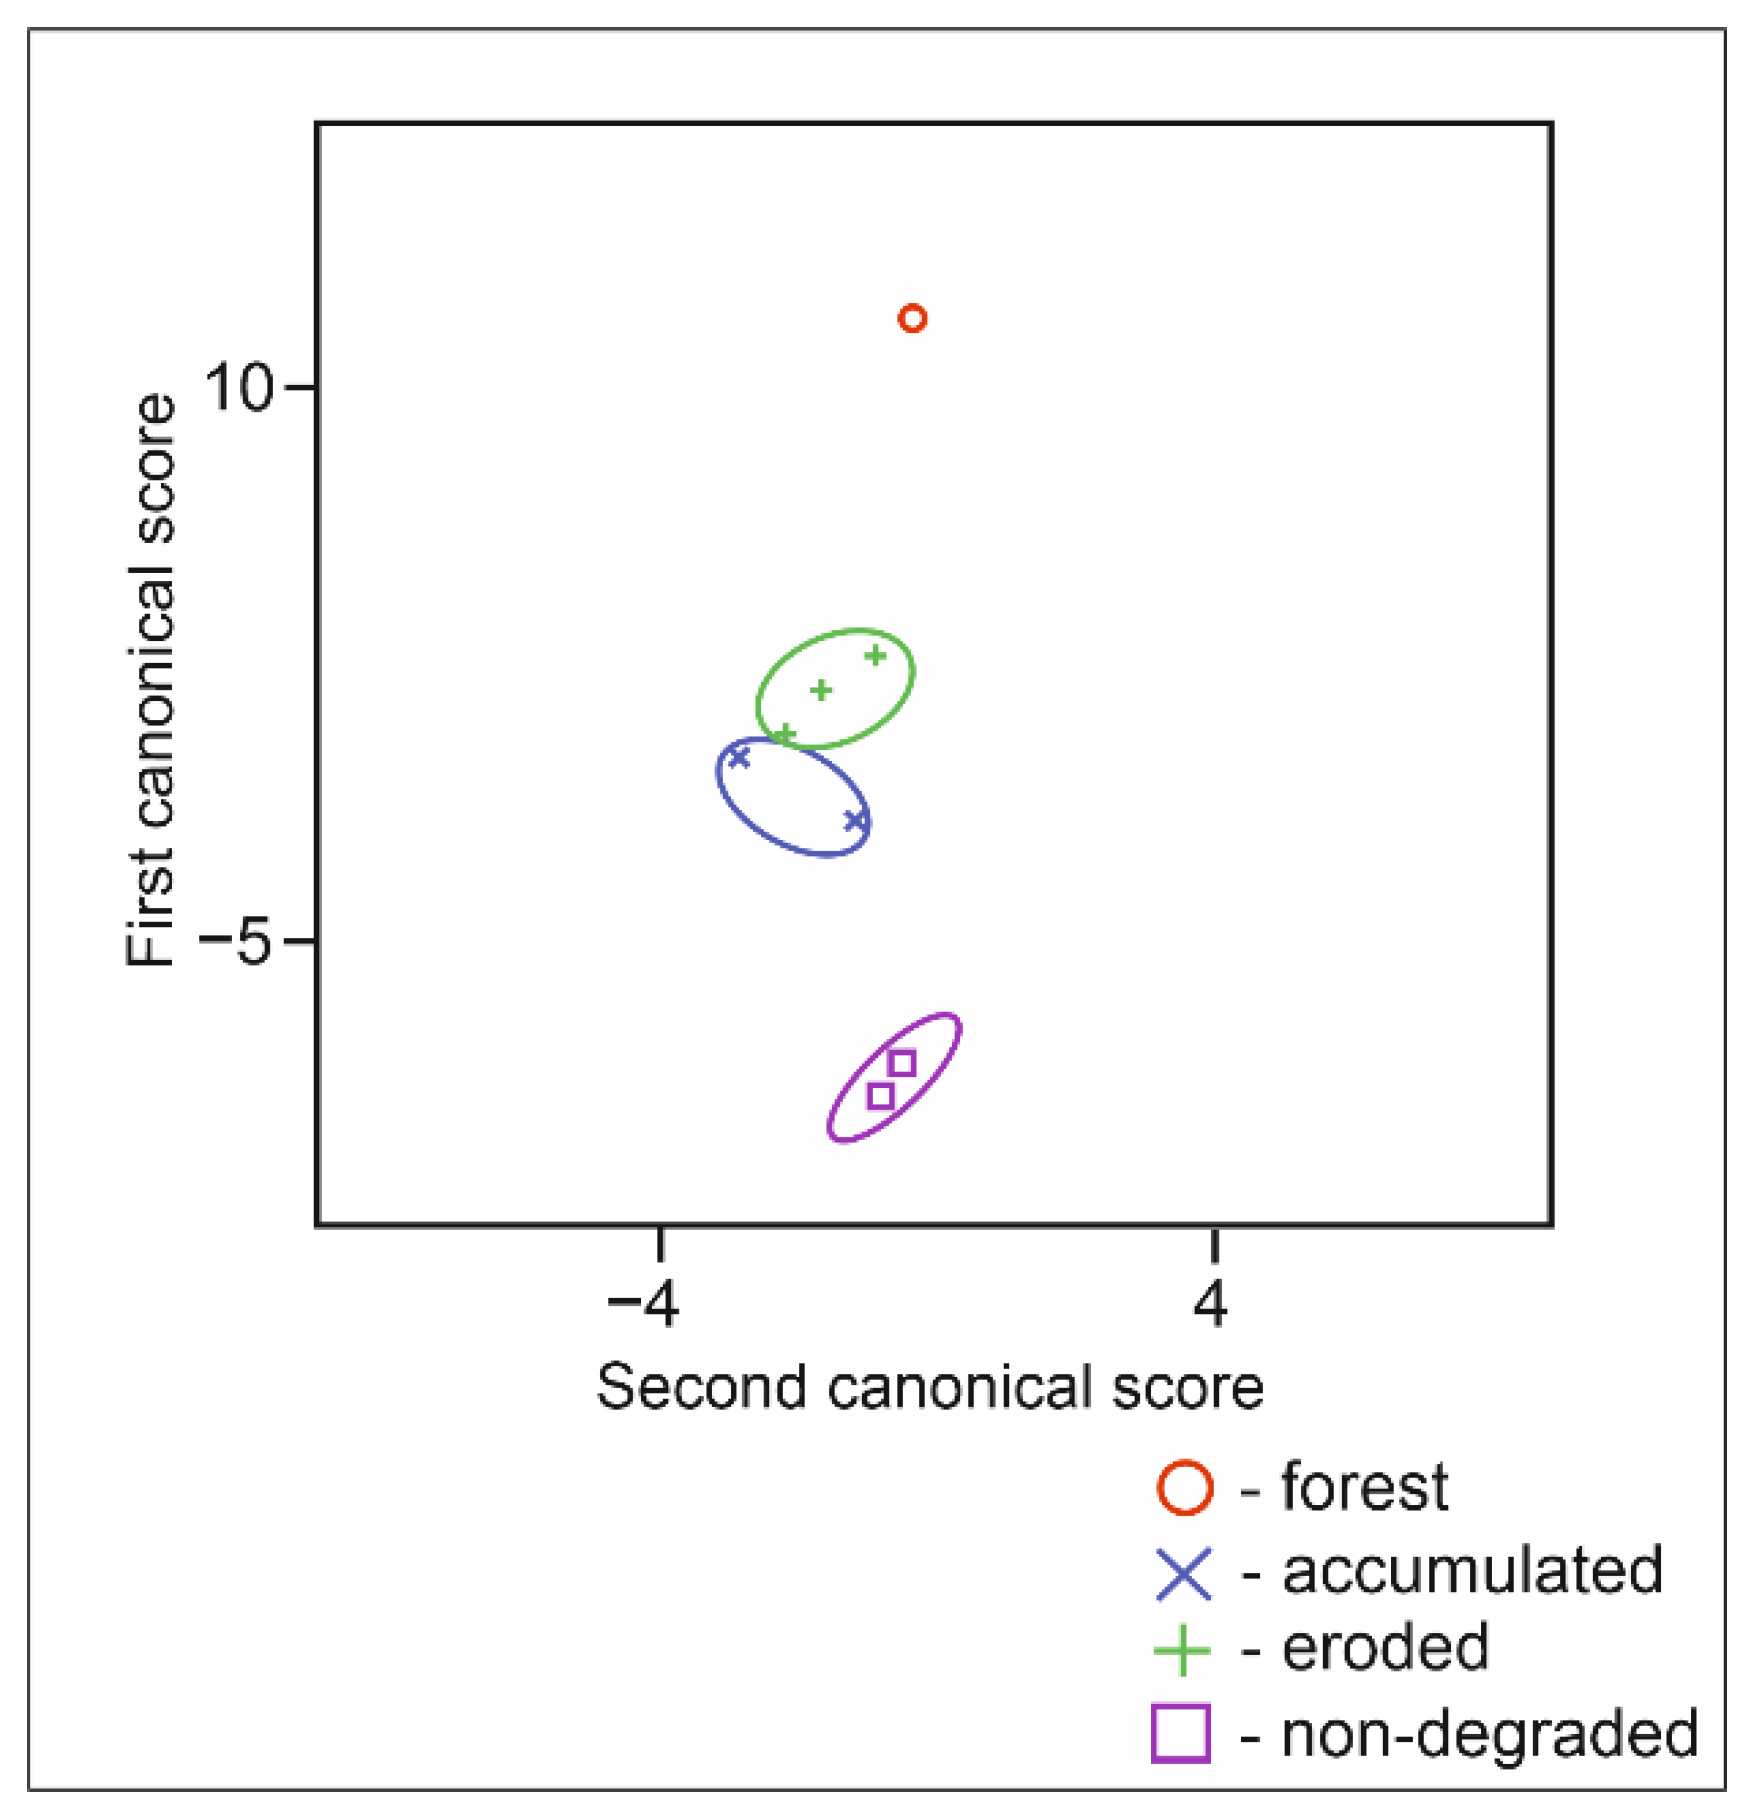
2.3. Statistical Analysis

The mid-infrared spectra of HA from topsoil horizons, extracted by IHSS fractionation, were obtained using a spectrometer Nicolet iZ10 FT-IR with the Smart iTX accessory supplied with a diamond plate (Thermo128 Scientific, Madison, WI, USA), in the range 4000–525 cm−1 at a resolution of 2 cm−1. Spectra used for analysis originally created a data matrix with 8 rows (number of samples) and 7200 columns (spectral peaks), but in order to implement further statistical analysis, they were averaged in blocks to 359 columns. Thus, the final resolution of the spectral database was 20 cm−1. Statistical analysis was applied using Systat 13.2 software (Systat Software, San Jose, CA, USA). Canonical correlation analysis was used in order to verify if there was an association among variables [33], and if so, to measure the size of the correlation. Grouping variables were separated according to Table 1 into: (a) two samples of non-degraded soils, (b) three samples of eroded soils, (c) two samples of accumulative soils and (d) one sample of soil under forest vegetation, while a dependent variable represented the mid-infrared spectrum of HA. In order to maximize the differentiation of sample groups, we performed two-step mathematical pretreatment [34,35] using Unscrambler 10.4 software (Camo Software AS, Oslo, Norway). The first step included standardization (SNV) of the spectra to obtain variance = 1. Then, we applied the first derivative to highlight the peaks of the spectral image (Figure 2).

3. Results

3.1. Basic Soil Characteristics and Properties

The main characteristic for chernozemic soils was the presence of mollic or chernic diagnostic horizons, recognised by their colour, SOC content, pH, and thickness. Soils described in two catenas fulfilled the criteria of chernozemic soils and were classified as Chernozems or Phaeozems according to FAO-WRB [26]. Profile 3 was exceptionally described as Calcisol, due to the loss of chernozemic properties caused by strong erosion. The soil sequence in catena 1 represented the different stages of soil erosion in an undulated landscape. Profile 1 was located in a higher plain position and no traces of erosion were identified. Profiles 2–3 were situated on a moderately steep slope and exemplified various intensities of erosion, while profile 4, located at the foot of the slope was upbuilt by colluvial soil accumulation (Table 1). Catena 2 also included the non-eroded soil (profile 7), eroded soil (profile 6) and colluvially accumulated/upbuilt soil (profile 8). Profile 5, situated in a forest, although located in a high plain position and non-eroded, experienced strong acidification (Table 2).
All profiles differed by the thickness of topsoil humus horizons (Ap + remaining A subhorizons), which varied from 30–35 cm in eroded profiles (profiles 2, 3, and 6), and up to 65–75 cm in non-eroded and colluvially accumulated soils (profiles 1, 4, 5, 7, and 8). Topsoil Ap horizons were black (10YR 1/1−3/1; Table 2), excluding strongly eroded profile 3, where Ap was featured by a lighter colour of 10YR 4/2. SOC content in the uppermost topsoil layer varied in a range of 1.03–3.29%, with the lowest in strongly eroded profile 3. The majority of soils were characterized by an alkaline reaction, particularly in deeper subhorizons (pH of 7.2–8.2), with the only exception being the strongly acidified (pH of 4.5–5.1) forest soil (profile 5) (Table 2). Non-eroded soils (profiles 1, 5, 7, and 8) contained only trace amounts of carbonates in the topsoil horizons, whereas eroded soils (profiles 2, 3, and 6) and colluvially accumulated soil (profile 4) contained noticeably higher amounts of carbonates. All analysed topsoil horizons had a texture of silt loam, typically with elevated clay content in the subsurface subhorizons(Table 2).

3.2. Soil Humic Fractions as Indicators of SOM Responses to Degradation

The sum of HA and FA fractions obtained in both methods are not at a similar level of total values. In general, the Tyurin procedure allows the obtainment of a higher content of total HA and FA fractions compared to the IHSS procedure (Table 3). However, the general trends of HA and FA amounts and their ratio seem to be similar in both methods. Regardless of the procedure used, non-eroded and accumulative soils (1 and 4) from catena 1 are characterized by high amounts of HA fractions in a range of 32.4–22.5% in the Tyurin method and 23.9% in the IHSS method. In eroded profiles (2 and 3), the content of HA starts to decrease, and FA become dominant, especially in the case of profile 3 with the strongest signs of erosion (Table 3). It needs to be noted that in profiles with well-developed and thick humus horizons, where the fractions of humic substances were analysed in sub-layers, the content of HA increased with the depth (profiles 1 and 4). The ratio of HA/FA in catena 1 is the highest in the topsoil layer for non-eroded profile 1, slightly eroded profile 2, and accumulated profile 4 (1.0–1.4 in the Tyurin method or 1.0–1.6 in the IHSS method). The lowest value is present in strongly eroded profile 3 (0.7 in the Tyurin method and 0.5 in the IHSS method).
Profile 5 under forest vegetation is characterized by a clear predominance of FA over HA in both procedures. The content of FA in the topsoil horizon for the Tyurin method is 39.9%, and it is and 30.5% for the IHSS method. Thus, the HA/FA ratio remains at a low level (0.6–0.7) and is similar in both procedures. The comparison between non-eroded profile 7 and eroded profile 6 shows that slight traces of erosion are not reflected in the contribution of humus fractions. In both profiles (6 and 7), HA content remains at a level of 40% in the Tyurin method and around 30% in the IHSS method. Accumulative profile 8 has different characteristics with a particularly high content of HA and relatively low values of FA. It is reflected in the HA/FA ratio with the highest values in catena 2, up to 2.9 for the Tyurin method and 2.5 for the IHSS method.
What is noteworthy is the fact that in soils with a high SOC content (1.9%, 2.7% and 3.2%), the HA/FA ratio is generally wide (1.6, 2.5 and 2.1, respectively). Soils with a lower SOC content (1.0 and 1.5), such as eroded profile 3 and accumulative profile 4, represented a decreased HA/FA ratio at the level of 0.5–1.0.
Canonical correlation analysis allows us to distinguish the groups of samples based on humic acid spectra recorded in the MIR range. All spectra are described as canonical scores in Figure 3 based on sample diversity and further statistical discrimination. Figure 3 shows that samples separated into individual groups if there was more than one in particular sets, and they spread at certain distances from each other. The distance between canonical scores of samples is referred to as the Mahalanobis distance and is used to assess the discrimination between examined groups [36]. As shown in Figure 3, the single forest sample and two non-degraded samples are located at longer distances from the others. In turn, eroded and accumulative samples are situated closer to each other, but still are separated into individual groups.

4. Discussion

Performed analyses showed that humic and fulvic fractions, obtained by extraction methods, may indicate the processes of degradation and transformation within the soil sequences. Non-eroded profiles 1 and 7 were chosen as reference soils for this study. Despite their different locations in Poland, they have SOC content at a similar level of 1.44%. However, profile 7 has a darker topsoil layer of 10YR 2/2 compared to 10YR 3/1 in profile 1, which indicates a varied content of decomposed organic matter [37]. Both profiles are characterized by a high content of HA, which generally predominates over FA, as a result of the presence of well-humified OM in a stable environment. Similar HA results for non-degraded Chernozems were obtained by Ľubica et al. [38] and Prikhod’ko et al. [39]. An example of soil with clear features of degradation can be seen in profile 3, where erosion has caused shallowing and the loss of the dark colour of the topsoil horizon (Table 2) [37]. This profile also has the lowest content of HA and FA in the analysed catenas. Such results typical for heavily eroded Chernozems support the research of Turski [40], who reported a decrease in HA content along with an increasing intensity of erosion on a slope. For example, on non-eroded soil, the content of HA was 28.3, whereas on strongly eroded Chernozem, it was 19.3. Such a decrease is related to the physical translocation of humic substances across the slope due to erosion, whereas the predominance of FA is an effect of the constant formation of fresh, low-molecular organic compounds on slopes. However, in the profiles located in upper parts of both catenas, where processes of erosion have already started to develop (profiles 2 and 6), there is only a decrease in humus horizon thickness, while colour remains even darker than in non-eroded profiles. As a result, in the content of humic substances, there is no clear indication of erosive processes. Hladký et al. [41], in their work on the humus quality of chernozemic soils, had similar conclusions, as they observed a decrease in SOM content in the middle part of a slope, although changes in the quality of humus were not detected.
General changes in field management practices are also reflected in HS chemical composition overall, which is particularly visible in the case of forest profile 5. Constant supply of fresh biomass results in a higher content of the majority of the fractions, whereas an acidic environment stimulates formation of FA over HA under soils with freshly accumulated organic matter [42]. A characteristic feature of accumulative soils is the increase in humic substance content when compared to eroded soils. A remarkably higher sum of fraction of HS is a direct effect of OM transportation along the slopes and the accumulation in lower parts in the bottom of both catenas. The aforementioned trends are additionally reflected by the HA/FA ratio. Profiles with the highest HA/FA relation are characterized by the predominance of well-humified organic matter in the form of HA and their specific location in the field. The highest ratio occurs in non-eroded areas and in soils located at the lowest parts of slopes. On the other hand, eroded and forest profiles represent the lowest ratio. Many authors presented similar results, for example, Horáček et al. [43] showed the HA/FA ratio for slightly degraded Chernozems at level 1.1–1.3, while Hladký et al. [41] confirmed that on eroded soils, values of the HA/FA ratio decreased below 1. Moreover, in the case of accumulative soils located in the lowlands, our results stay in agreement with Dębska [44], who reported values at the level of 1.9.
Performance of canonical correlation analysis confirms that the MIR spectra of humic acids extracted from soil organic matter discriminate and classify samples into classes, based on their land use or degradation ratio. Considering the first canonical score, the Mahalanobis distance between groups of samples in some cases is remarkably high—around 20 between the forest and non-degraded classes. It clearly indicates significant differentiation within the examined material, which is an effect of distinct types of organic matter supplies [45]. However, non-degraded, eroded and accumulative soils are localized at closer distances to each other. Weaker differentiation is an effect of the same land use; therefore, general composition of organic matter should be similar. Classes with the lowest Mahalanobis distance are the eroded and accumulated groups, probably due to the intensive translocation of organic matter between these two types of soils.
Based on the presented results, we can conclude that both the Tyurin and the IHSS procedures allow us to draw similar conclusions about soil transformation considering HA and FA content along with their HA/FA ratio. Despite the fact that the Tyurin method extracts higher amounts of humic substances (usually around 10–15% more than the IHSS method), the trends and general overview on soil organic matter composition are maintained in both procedures. Therefore, the results obtained by each of the mentioned approaches are useful as indicators of pedogenic processes and degradation rate in soils. An additional confirmation of the role of humus substances in the studies on soil transformation are the results of MIR spectroscopy of HA. Therefore, different land use and pedogenic processes leave marks not only in the quantity of the humic compounds, but also in their chemical/qualitative characteristics [34].
It can be expected that the erosion processes and excessive decrease in soil organic carbon content will negatively affect the productivity of fertile soils [46]. It should be emphasised that the location of all the studied profiles was carefully selected based on soil maps. Theoretically, profiles should be located on surfaces described in the literature as regions covered by well-developed Chernozems. However, direct field observations have shown that soils demonstrate signs of erosion caused by their location in undulating areas (Figure 1). Hence, humic substances seem to be suitable indicators of changes that directly affect the soil organic matter pool due to their great contribution in total OM content (up to 60%) [31,32,47].

5. Conclusions

The performed study confirms the applicability of humic and fulvic fractions in order to determine pedogenesis processes and the degradation rate of chernozemic soils. This conclusion is particularly supported by the different distribution of the humic substances’ fractions and their ratio, according to the location of the profile, land use, current vegetation or traces of erosion. The presented data show that both the Tyurin and the IHSS fractionation procedures lead to the same conclusions, despite the differences in the quantities of extracted humic compounds. Research on soil transformation based on SOM composition can be supplemented by the application of spectroscopic methods on separated humic substances, which gives additional insight into organic matter quality.

Supplementary Materials

The following supporting information can be downloaded at: https://www.mdpi.com/article/10.3390/agronomy12030733/s1, Table S1: Physicochemical properties of complete chernozemic profiles under study. Table S2. Composition of humic substances extracted by the Tyurin and IHSS methods.

Author Contributions

M.D., A.M.-J. and B.Ł. contributed to the development of the ideas and authoring of the paper. Conceptualization, M.D., A.M.-J. and B.Ł.; methodology, M.D. and B.Ł.; software, M.D.; formal analysis, M.D. and M.B.; investigation, M.D., M.B. and B.Ł.; resources, M.D., A.M.-J. and B.Ł.; data curation, M.D. and B.Ł.; writing—original draft preparation, M.D. and M.B.; writing—review and editing, M.D., A.M.-J. and B.Ł.; visualization, M.D.; supervision, A.M.-J. and B.Ł.; project administration, B.Ł.; funding acquisition, B.Ł. and M.D. All authors have read and agreed to the published version of the manuscript.

Funding

This work was supported by the Wrocław University of Environmental and Life Sciences (Poland) as the Ph.D. research program “Innowacyjny Doktorat”, no. N070/0007/21 and partly from the project: “Origin and transformation of chernozemic soils in Poland in relation to the climatic changes and influence of settlement and human activity since the beginning of the Neolithic period” (grant no. 2018/29/B/ST10/00610, National Science Centre of Poland).

Data Availability Statement

All data from this study are contained within the article and Supplementary Materials.

Conflicts of Interest

The authors declare no conflict of interest.

References

  1. Daniels, W.L. The Nature and Properties of Soils, 15th ed.; Weil, R.R., Brady, N.C., Eds.; Pearson Press: Upper Saddle River, NJ, USA, 2017. [Google Scholar] [CrossRef]
  2. Kleber, M.; Eusterhues, K.; Keiluweit, M.; Mikutta, C.; Mikutta, R.; Nico, P.S. Mineral-Organic Associations: Formation, Properties, and Relevance in Soil Environments. In Advances in Agronomy; Elsevier: Amsterdam, The Netherlands, 2015; Volume 130, pp. 1–140. [Google Scholar] [CrossRef]
  3. Lugato, E.; Lavallee, J.M.; Haddix, M.L.; Panagos, P.; Cotrufo, M.F. Different Climate Sensitivity of Particulate and Mineral-Associated Soil Organic Matter. Nat. Geosci. 2021, 14, 295–300. [Google Scholar] [CrossRef]
  4. Schmidt, M.W.I.; Torn, M.S.; Abiven, S.; Dittmar, T.; Guggenberger, G.; Janssens, I.A.; Kleber, M.; Kögel-Knabner, I.; Lehmann, J.; Manning, D.A.C.; et al. Persistence of Soil Organic Matter as an Ecosystem Property. Nature 2011, 478, 49–56. [Google Scholar] [CrossRef] [PubMed] [Green Version]
  5. Lehmann, J.; Kleber, M. The Contentious Nature of Soil Organic Matter. Nature 2015, 528, 60–68. [Google Scholar] [CrossRef] [PubMed]
  6. Cotrufo, M.F.; Ranalli, M.G.; Haddix, M.L.; Six, J.; Lugato, E. Soil Carbon Storage Informed by Particulate and Mineral-Associated Organic Matter. Nat. Geosci. 2019, 12, 989–994. [Google Scholar] [CrossRef]
  7. Chabbi, A.; Lehmann, J.; Ciais, P.; Loescher, H.W.; Cotrufo, M.F.; Don, A.; SanClements, M.; Schipper, L.; Six, J.; Smith, P.; et al. Aligning Agriculture and Climate Policy. Nat. Clim. Change 2017, 7, 307–309. [Google Scholar] [CrossRef]
  8. Lal, R. Restoring Soil Quality to Mitigate Soil Degradation. Sustainability 2015, 7, 5875–5895. [Google Scholar] [CrossRef] [Green Version]
  9. Obalum, S.E.; Chibuike, G.U.; Peth, S.; Ouyang, Y. Soil Organic Matter as Sole Indicator of Soil Degradation. Environ. Monit. Assess. 2017, 189, 176. [Google Scholar] [CrossRef]
  10. Jamroz, E.; Bekier, J.; Medyńska-Juraszek, A.; Kałuża-Haładyn, A.; Ćwieląg-Piasecka, I.; Bednik, M. The Contribution of Water Extractable Forms of Plant Nutrients to Evaluate MSW Compost Maturity: A Case Study. Sci. Rep. 2020, 10, 12842. [Google Scholar] [CrossRef]
  11. Ouyang, W.; Wu, Y.; Hao, Z.; Zhang, Q.; Bu, Q.; Gao, X. Combined Impacts of Land Use and Soil Property Changes on Soil Erosion in a Mollisol Area under Long-Term Agricultural Development. Sci. Total Environ. 2018, 613–614, 798–809. [Google Scholar] [CrossRef]
  12. Kabała, C. Chernozem (Czarnoziem)—Soil of the Year 2019 in Poland. Origin, Classification and Use of Chernozems in Poland. Soil Sci. Annu. 2019, 70, 184–192. [Google Scholar] [CrossRef]
  13. Łabaz, B.; Kabała, C.; Dudek, M.; Waroszewski, J. Morphological Diversity of Chernozemic Soils in South-Western Poland. Soil Sci. Annu. 2019, 70, 211–224. [Google Scholar] [CrossRef] [Green Version]
  14. Łabaz, B.; Waroszewski, J.; Dudek, M.; Bogacz, A.; Kabała, C. Persistence of arable Chernozems and Chernic Rendzic Phaeozems in the eroded undulating loess plateau in Central Europe. Catena, 2021; submitted. [Google Scholar]
  15. Kleber, M.; Lehmann, J. Humic Substances Extracted by Alkali Are Invalid Proxies for the Dynamics and Functions of Organic Matter in Terrestrial and Aquatic Ecosystems. J. Environ. Qual. 2019, 48, 207–216. [Google Scholar] [CrossRef]
  16. Olk, D.C.; Bloom, P.R.; De Nobili, M.; Chen, Y.; McKnight, D.M.; Wells, M.J.M.; Weber, J. Using Humic Fractions to Understand Natural Organic Matter Processes in Soil and Water: Selected Studies and Applications. J. Environ. Qual. 2019, 48, 1633–1643. [Google Scholar] [CrossRef] [Green Version]
  17. Guimarães, D.V.; Gonzaga, M.I.S.; da Silva, T.O.; da Silva, T.L.; da Silva Dias, N.; Matias, M.I.S. Soil Organic Matter Pools and Carbon Fractions in Soil under Different Land Uses. Soil Tillage Res. 2013, 126, 177–182. [Google Scholar] [CrossRef] [Green Version]
  18. Jensen, J.L.; Schjønning, P.; Watts, C.W.; Christensen, B.T.; Obour, P.B.; Munkholm, L.J. Soil Degradation and Recovery—Changes in Organic Matter Fractions and Structural Stability. Geoderma 2020, 364, 114181. [Google Scholar] [CrossRef]
  19. Martinez-Salgado, M.M.; Gutiérrez-Romero, V.; Jannsens, M.; Ortega-Blu, R. Biological Soil Quality Indicators: A Review. Curr. Res. Technol. Educ. Top. Appl. Microbiol. 2010, 1, 319–328. [Google Scholar]
  20. Olk, D.C.; Bloom, P.R.; Perdue, E.M.; McKnight, D.M.; Chen, Y.; Farenhorst, A.; Senesi, N.; Chin, Y.-P.; Schmitt-Kopplin, P.; Hertkorn, N.; et al. Environmental and Agricultural Relevance of Humic Fractions Extracted by Alkali from Soils and Natural Waters. J. Environ. Qual. 2019, 48, 217–232. [Google Scholar] [CrossRef]
  21. Jamroz, E.; Jerzykiewicz, M. Humic Fractions as Indicators of Soil Organic Matter Responses to Clear-Cutting in the Mountain and Lowland Conditions of South-Western Poland. Land Degrad. Dev. 2021, 33, 368–378. [Google Scholar] [CrossRef]
  22. Spaccini, R.; Piccolo, A.; Haberhauer, G.; Gerzabek, M.H. Transformation of Organic Matter from Maize Residues into Labile and Humic Fractions of Three European Soils as Revealed by 13C Distribution and CPMAS-NMR Spectra. Eur. J. Soil Sci. 2000, 51, 583–594. [Google Scholar] [CrossRef]
  23. Loba, A.; Waroszewski, J.; Tikhomirov, D.; Calitri, F.; Christl, M.; Sykuła, M.; Egli, M. Tracing Erosion Rates in Loess Landscape of the Trzebnica Hills (Poland) over Time Using Fallout and Cosmogenic Nuclides. J. Soils Sediments 2021, 21, 2952–2968. [Google Scholar] [CrossRef]
  24. Krysiak, Z. Carpathian Foredeep; Neogene; Neotectonics; Mesostructural Analysis; Teledetection; Synsedimentary Faults; Strike-Slip; Faults; Tectonic Breccias. Geol. Q. 2000, 44, 137–156. [Google Scholar]
  25. Drużkowski, M.M. Różnorodność krajobrazu obszarów rolnictwa tradycyjnego. Studium geoekologiczne dla Płaskowyżu Proszowickiego. Stud. Geoekologiczne Dla Płaskowyżu Proszowickiego. Probl. Ekol. Kraj. 2004, 13, 8. [Google Scholar]
  26. FAO. World Reference Base for Soil Resources 2014: International Soil Classification System for Naming Soils and Creating Legends for Soil Maps; FAO: Rome, Italy, 2014; ISBN 978-92-5-108369-7. [Google Scholar]
  27. Kobierski, M.; Kondratowicz-Maciejewska, K.; Banach-Szott, M.; Wojewódzki, P.; Peñas Castejón, J.M. Humic Substances and Aggregate Stability in Rhizospheric and Non-Rhizospheric Soil. J. Soils Sediments 2018, 18, 2777–2789. [Google Scholar] [CrossRef] [Green Version]
  28. Dziadowiec, H.; Gonet, S.S. Przewodnik Metodyczny Do Badań Materii Organicznej Gleb. Pr. Kom. Nauk. PTG 1999, 120, 31–33. [Google Scholar]
  29. Łabaz, B.; Bogacz, A.; Żymełka, R. Substancje humusowe i własciwości czarnych ziem występujących w obniżeniu milicko-głogowskim. Woda-Śr.-Obsz. Wiej. 2010, 10, 113–128. [Google Scholar]
  30. Swift, R. Fractionation of Soil Substances. Humic Subst. Soil Sediment Water 1985, 387–408. [Google Scholar]
  31. Dudek, M.; Łabaz, B.; Kabała, C. Comparison of Sequential Extraction Techniques and Fractional Composition of Humic Substances in Chernozems and Phaeozems of Poland—A Review. Soil Sci. Annu. 2021, 72, 132235. [Google Scholar] [CrossRef]
  32. Weber, J.; Jamroz, E.; Kocowicz, A.; Debicka, M.; Bekier, J.; Ćwieląg-Piasecka, I.; Ukalska-Jaruga, A.; Mielnik, L.; Bejger, R.; Jerzykiewicz, M. Optimized Isolation Method of Humin Fraction from Mineral Soil Material. Environ. Geochem. Health 2021, 1–10. [Google Scholar] [CrossRef]
  33. Rupnik, J.; Shawe-Taylor, J. Multi-View Canonical Correlation Analysis. Doctoral Dissertation, Jožef Stefan International Postgraduate School, Ljubljana, Slovenia, 17 June 2016. [Google Scholar]
  34. Dudek, M.; Kabała, C.; Łabaz, B.; Mituła, P.; Bednik, M.; Medyńska-Juraszek, A. Mid-Infrared Spectroscopy Supports Identification of the Origin of Organic Matter in Soils. Land 2021, 10, 215. [Google Scholar] [CrossRef]
  35. Ertlen, D.; Schwartz, D.; Trautmann, M.; Webster, R.; Brunet, D. Discriminating between Organic Matter in Soil from Grass and Forest by Near-Infrared Spectroscopy. Eur. J. Soil Sci. 2010, 61, 207–216. [Google Scholar] [CrossRef]
  36. Roth, P.M.; Hirzer, M.; Köstinger, M.; Beleznai, C.; Bischof, H. Mahalanobis Distance Learning for Person Re-Identification. In Person Re-Identification; Gong, S., Cristani, M., Yan, S., Loy, C.C., Eds.; Springer: London, UK, 2014; pp. 247–267. ISBN 978-1-4471-6295-7. [Google Scholar]
  37. Łabaz, B.; Musztyfaga, E.; Waroszewski, J.; Bogacz, A.; Jezierski, P.; Kabała, C. Landscape-Related Transformation and Differentiation of Chernozems—Catenary Approach in the Silesian Lowland, SW Poland. Catena 2018, 161, 63–76. [Google Scholar] [CrossRef]
  38. Ľubica, P.; Fasurová, N.; Barančíková, G.; Liptaj, T. Spectral Characteristics of Humic Acids Isolated from South Moravian Lignite and Soils. Pet. Coal 2008, 50, 30–36. [Google Scholar]
  39. Prikhod’ko, V.E.; Cheverdin, Y.I.; Titova, T.V. Changes in the Organic Matter Forms in Chernozems of the Kamennaya Steppe under Different Land Uses, Locations, and Hydromorphism Degrees. Eurasian Soil Sci. 2013, 46, 1230–1240. [Google Scholar] [CrossRef]
  40. Turski, R. The Influence of Erosion on the Organic Matter Compounds in the Brown Soils and Chernozems of the Lublin Upland. Soil Sci. Annu. 1964, 14, 345–352. [Google Scholar]
  41. Hladký, J.; Kynický, J.; Dvořáčková, H.; Elbl, J.; Brtnický, M. Effect of Long-Term Erosion on Humus Content and Quality on Chernozem Soils. Int. Multidiscip. Sci. GeoConf. 2017, 17, 179–184. [Google Scholar] [CrossRef]
  42. López, R.; Gondar, D.; Iglesias, A.; Fiol, S.; Antelo, J.; Arce, F. Acid Properties of Fulvic and Humic Acids Isolated from Two Acid Forest Soils under Different Vegetation Cover and Soil Depth. Eur. J. Soil Sci. 2008, 59, 892–899. [Google Scholar] [CrossRef]
  43. Horáček, J.; Novák, P.; Liebhard, P.; Strosser, E.; Babulicová, M. The Long-Term Changes in Soil Organic Matter Contents and Quality in Chernozems. Plant Soil Environ. 2017, 63, 8–13. [Google Scholar] [CrossRef] [Green Version]
  44. Dębska, B.; Banach-Szott, M.; Rosa, E.; Pakuła, J. The Effect of Soil Pollution by Selected PAHs on the Fractional Composition of Organic Matter. Soil Sci. Annu. 2012, 63, 13–17. [Google Scholar] [CrossRef] [Green Version]
  45. Cécillon, L.; Barthès, B.G.; Gomez, C.; Ertlen, D.; Genot, V.; Hedde, M.; Stevens, A.; Brun, J.J. Assessment and Monitoring of Soil Quality Using Near-Infrared Reflectance Spectroscopy (NIRS). Eur. J. Soil Sci. 2009, 60, 770–784. [Google Scholar] [CrossRef] [Green Version]
  46. Liu, X.; Herbert, S.J.; Hashemi, A.M.; Zhang, X.; Ding, G. Effects of Agricultural Management on Soil Organic Matter and Carbon Transformation–A Review. Plant Soil Environ. 2011, 52, 531–543. [Google Scholar] [CrossRef] [Green Version]
  47. Mielnik, L.; Hewelke, E.; Weber, J.; Oktaba, L.; Jonczak, J.; Podlasiński, M. Changes in the Soil Hydrophobicity and Structure of Humic Substances in Sandy Soil Taken out of Cultivation. Agric. Ecosyst. Environ. 2021, 319, 107554. [Google Scholar] [CrossRef]
Figure 1. Localization of sampling areas in (A) and (a) Proszowice Plateau (catena 1: profiles 1–4), (B) and (b) Hrubieszów Basin (catena 2: profiles 5–8).
Agronomy 12 00733 g001
Figure 2. Mid-infrared absorbance spectra (A)—without processing, (B)—after standardization (SNV), (C)—after SNV and 1st derivative.
Agronomy 12 00733 g002
Figure 3. Canonical scores of humic acids obtained from non-eroded, eroded, accumulated and forest soils.
Agronomy 12 00733 g003
Table 1. Soil location, land use and classification.
Soil ClassificationAltitude m.a.s.l.Landscape PositionLand UseType of Degradation
Profile 1Chernic Phaeozem254plain part of long slopearable—wheatnon-eroded
Profile 2Calcic Chernozem257middle part of long slopearable—wheaterosion
Profile 3Haplic Calcisol251ridge in midslopearable—wheaterosion (strong)
Profile 4Calcic Chernozem247footslope below the ridgearable—wheatcolluvial accumulation
Profile 5Haplic Chernozem252upper part of long slopeforestacidification
Profile 6Haplic Chernozem245middle part of long slopearable—oilseed rapeerosion
Profile 7Haplic Chernozem230plain part of slopearable—oilseed rapenon-eroded
Profile 8Haplic Chernozem219footslopearable—oilseed rapecolluvial accumulation
Table 2. Selected physicochemical properties of humus horizons under study (complete list of data for whole profiles is included in Supplementary Materials).
HorizonColorDepth cmpHCaCO3 % [m/m]SOC
%
TN %Clay %Texture Class
Profile 1
Ap10YR 3/10–257.600.421.940.1617SiL
A210YR 2/125–407.880.211.640.1216SiL
A310YR 2/140–757.960.301.990.1222SiL
Profile 2
Apk10YR 2/20–358.106.361.440.1315SiL
Profile 3
Ap10YR 4/20–308.1816.71.030.0717 SiL
Profile 4
Ap10YR 3/20–258.108.481.480.1418SiL
A210YR 3/225–488.059.541.310.1417SiL
A310YR 3/248–548.235.091.520.1223SiL
Profile 5
A110YR 3/20–354.550.591.820.1512SiL
A210YR 3/135–655.140.510.830.0623SiL
Profile 6
Ap10YR 2/10–317.163.133.290.3014SiL
Profile 7
Ap110YR 2/20–207.130.051.440.1113SiL
Ap210YR 1/120–407.080.081.490.1211SiL
Ahk10YR 3/240–657.181.081.040.0716SiL
Profile 8
Ap10YR 1/10–457.970.252.750.1810SiL
A10YR 2/145–658.060.171.570.1120SiL
Explanation: SOC—soil organic carbon; TN—total nitrogen: SiL—silt loam.
Table 3. Composition of humic substances extracted by Tyurin and IHSS methods.
TyurinIHSS
HAFAHA/FAHAFAHA/FA
% of SOC % of SOC
Profile 1
Ap33.526.31.323.914.81.6
A240.820.12.024.615.01.6
A342.726.01.635.219.91.8
Profile 2
Apk27.825.41.125.921.41.2
Profile 3
Ap22.334.10.714.626.70.5
Profile 4
Ap32.432.11.023.823.21.0
A238.132.51.220.622.30.9
A341.427.91.522.321.81.0
Profile 5
A129.639.90.718.330.50.6
A230.148.80.615.531.10.5
Profile 6
Ap40.121.11.927.813.32.1
Profile 7
Ap138.935.81.131.922.71.4
Ap239.638.91.031.018.61.7
Ahk57.726.02.250.017.82.8
Profile 8
Ap49.116.72.937.115.12.5
A53.522.92.334.918.11.9
Explanation: HA—humic acids, FA—fulvic acids, SOC—soil organic carbon.
Publisher’s Note: MDPI stays neutral with regard to jurisdictional claims in published maps and institutional affiliations.

