Article

Long-Term Effects of Organic Amendments on Carbon Stability in Clay–Organic Complex and Its Role in Soil Aggregation

1
Division of Soil Science and Agricultural Chemistry, Indian Council of Agricultural Research (ICAR)-Indian Agricultural Research Institute, New Delhi 110012, India
2
Indian Council of Agricultural Research (ICAR)-Indian Institute of Soil Science, Bhopal, Bhopal 462038, India
3
Agriculture University, Kota 324001, India
4
Division of Agronomy, Indian Council of Agricultural Research (ICAR)-Indian Agricultural Research Institute, New Delhi 110012, India
5
Feed the Future Innovation Lab for Collaborative Research on Sustainable Intensification, Kansas State University, Manhattan, KS 66506, USA
6
Columbia Basin Agricultural Research Center, Oregon State University, Adams, OR 97810, USA
7
Department of Agronomy, Kansas State University, Manhattan, KS 66506, USA
*
Author to whom correspondence should be addressed.
Agronomy 2023, 13(1), 39; https://doi.org/10.3390/agronomy13010039
Submission received: 31 October 2022 / Revised: 1 December 2022 / Accepted: 5 December 2022 / Published: 22 December 2022

Abstract

:
Clay–organic complexes (COC) impart chemical and physical protection to soil carbon (C). In the present study, the aim was to assess the long-term effects of different organic amendments on C stability in COC, distribution of the aggregates, C concentration in the aggregates and labile organic C fractions in the inceptisols located at the research farm situated in the semi-arid sub-tropical climate of India. The results showed that the COC, the percentage of large macroaggregates (LMA) (>2 mm) and the C associated with the aggregates decreased through the soil depths, whereas the other size fractions of soil aggregates (<2 mm) showed an increasing trend. The COC was significantly higher (4.4 times) in soil treatments where farmyard manures (FYM), green manure (GM) and biofertilizers (BF) were applied together (FYM + GM + BF). The organic amendments increased the proportion of LMA over control (no application of organic amendments) to a magnitude of 83 to 101% and the C associated with LMA to a magnitude of 0.48 to 9.8% over control in surface soil. On average, the combined application of FYM, GM and BF exhibited higher C accumulation in almost all soil aggregate fractions, except microaggregates (mA), i.e., (0.25–0.053 mm) size fractions, where application of FYM alone recorded the highest value. Averaged over soil depths, the particulate organic C (POC), dissolved organic C (DOC) and potassium permanganate oxidizable C (POXC) were significantly higher under integrated organic treatments than individual amendments. The significantly higher correlation between COC and the percentage of LMA and aggregate-associated C implied their direct role in soil aggregate formation and their stability. The carbon stability, i.e., retention time of humus in soil, was significantly correlated with soil organic carbon, dissolved organic carbon, particulate organic carbon, potassium permanganate oxidizable C, C mineralization (Cmin), glomalin-related soil protein (GRSP), macroaggregate (MA)-associated C and rice equivalent yield (REY). Overall, the data suggest that the combined application of FYM + GM + BF promotes soil quality under rice–wheat rotation in inceptisols in semi-arid sub-tropical India.

1. Introduction

Rice (Oryza sativa L.)–wheat (Triticum aestivum L.) is one of the most important cropping systems, which covers around 13.5 million ha in the Indo-Gangetic Plains of south Asia and provides food for 400 million people [1]. However, there is evidence of a declining pattern of system productivity, as well as deterioration of soil health [2,3]. The stagnating or declining crop yields are predominantly due to soil organic carbon (SOC) depletion and decreasing soil fertility [4,5]. SOC restoration and its build-up is a challenging task, especially under the intensive production system of the arid and semi-arid regions where the SOC concentration in soils is inherently low. Soil organic matter (SOM) maintenance at the optimum level could be achieved by crop rotation and tillage methods [6], maintenance of fertility, including the use of inorganic fertilizers, organic amendments, biofertilizers, and other components of the cropping system [3]. The stabilization of C by physical, chemical, and biological means is a prerequisite for C sequestration on a long-term basis [7,8]. Soil clay minerals can physically protect C by forming stable soil aggregates. The soil aggregates’ formation and their stabilization are intricately linked to SOC [9]. Therefore, the aggregate-associated C distribution determines the C storage and retention capacity of soils [10]. SOC is not only stabilized by aggregate formation, but it also interacts with clay minerals through various bonding mechanisms, i.e., hydrogen (H) bonding, electrostatic attraction, Van der Waals attraction and ligand exchange [11], and SOC is chemically protected in a clay–organic complex (COC). Glomalin, which is a glycoprotein present in arbuscular mycorrhizal fungi, is considered as a fingerprint of the formation of stable soil aggregates [12]. In fact, soil aggregates are the fundamental unit of soil structure and represent special organic–inorganic complexes [13]. Hence, the formation of different macroaggregates (MA), i.e., >2 mm, and microaggregates (mA), i.e., 0.25–0.053 mm size, and stable COC could protect SOC from microbial decomposition and increase its stability in soil [14].
The application of organic amendments with inorganic fertilizers improved the C associated with soil aggregates and COC compared to control, as well as the recommended dose of fertilizers [8,15,16]. The quality of the organics applied to the soil also affects the C mineralization process due to the input of C, the change of microbial community and, eventually, C storage in soil [17,18]. Several studies suggested that cropping systems relying on organic sources are more likely to maintain the SOM levels over systems relying solely on inorganic sources [3,8,18]. In addition to fertilizers and manure, the application of biofertilizers also significantly influences the aggregate stability and SOC [19]. Therefore, organic amendments, such as farmyard manure (FYM), green manure (GM), crop residue (CR), and biofertilizer (BF) application, independently or in combination, over multiple years could play an important role in the chemical and physical stabilization of SOC sequestration [3,8,15,20] and enhance the soil productivity under a rice–wheat cropping system [21]. Labile SOC is important due to its significant role in faster nutrient cycling and the supply of essential nutrients to plants. Different labile C fractions, e.g., dissolved organic C (DOC), particulate organic C (POC) and microbial biomass C (MBC), are reported as indicators of lability of SOC [22]. Thus, managing and/or maintaining SOM is one of the key factors for soil quality improvement.
There is still a paucity of information concerning the impact of long-term application of different organic amendments, either alone or in combination with inorganic fertilizers, on the aggregate distribution pattern, the C concentration in those aggregates and the labile organic C fractions. We hypothesized that COC is the basic building block of soil aggregates, and the stability of C in COC might affect the soil aggregate-associated C. Further, the application of different organics alone or in combinations over multiple years will affect the C stability in COC and ultimately change the amount of C associated with different soil aggregate fractions. There is a need to study SOC in a holistic way by considering its stability and lability and their significant contributions to C sequestration and crop productivity. There is a lack of knowledge on how the chemically stable C in COC could affect the C concentration in soil aggregates, i.e., physically protected C, particularly in semi-arid tropical soils. Therefore, in the present study, we investigated the following research questions:
  • Do different combinations of organic amendments in a rice–wheat system influence the stability of C in a clay–organic complex (COC), aggregate fractions and the C associated with aggregates in the inceptisol of semi-arid tropics?
  • Whether the stability of C in COC is one of the determining factors for the formation of aggregates and the C associated with aggregates?
  • What is the relationship between C stability in COC and C protected by aggregates in soil?
To address the above questions, the present study was carried out to assess the effect of different organic amendments over the past 10 years of experimentation on the COC, aggregate size distribution, the C associated with aggregate size fractions, glomalin-related soil protein (GRSP), total SOC (TSOC) and other labile SOC fractions, viz., particulate organic C (POC), dissolved organic C (DOC) and potassium permanganate oxidizable C (POXC). The association of stability of C in COC with aggregate size fractions and aggregate-associated C was also studied through correlation, and the prediction of C stability in COC was performed through regression analysis. The findings of this study therefore provide new insights on how chemically protected C in COC is linked with the formation of soil aggregates, thus subsequently capturing, and protecting C within the aggregates.

2. Materials and Methods

2.1. Study Site and Experimental Details

The experimental field has been located in the main block 14-C of the research farm (28°4′ N Latitude and 77°1′ E Longitude, 228.6 msl) of the Indian Agricultural Research Institute (IARI), New Delhi, India, since 2003. The experimental site soil was sandy clay loam (Typic Ustochrept) in texture. The initial soil characteristics of the study site were content of sand, silt, and clay 51.46, 23.02 and 25.52%, respectively. The soil was medium in organic C, low in available N and medium in both available phosphorus and potassium content. The pH of the soil was 8.0 (1:2.5 soil–water suspension), and EC was 0.84 dS m−1. The mean annual rainfall of Delhi was 615 mm yr−1, received mostly between July and September with little rain in winter, i.e., January or February. Further, the highest temperature was registered in the month of May (mean maximum temperature 40.1 °C) and the lowest during January (mean minimum temperature of 17.3 °C). The layout of the studied experiment under organic farming practice was a randomized block design with three replications, with a gross plot size of 4.8 m × 4.8 m. The net plot size under rice was 4.0 m × 3.8 m, and under wheat, 4.2 m × 3.8 m. The treatments imposed in the experiment under organic manuring and biofertilizers for a rice–wheat cropping system consisted of sixteen treatments imposed on individual rice and wheat plots and applied to both rice and wheat; six of those treatments imposed on both rice and wheat were selected for the present investigation, as described below. Different treatments were allocated through randomization using the random table of Fisher and Yates [23]. The six treatments that were applied to both rice (cv. Pusa Basmati 1) and wheat (cv. HD 2643) were: T1, control without fertilization; T2, farmyard manure (FYM) applied to rice and wheat; T3, Sesbania aculeate as green manure (SGM) applied to rice and Leucaena leucocephala as green leaf manure (LGLM) applied to wheat (GM); T4, SGM + blue green algae (BGA) applied to rice and LGLM + Azotobacter applied to wheat (GM + BF); T5, FYM + SGM applied to rice and FYM + LGLM applied to wheat (FYM + GM); T6, FYM + SGM + blue green algae (BGA) applied to rice and FYM + LGLM + Azotobacter applied to wheat (FYM + GM + BF). The FYM was applied at the rate of 10 t (tonne) ha−1 on a dry weight basis. The 60-day-old grown green manure plants Sesbania aculeate were incorporated into the soil before rice transplantation using a tractor-drawn plow and a heavy disc subsequently. Similarly, the Leucaena leucocephala green leaves were pruned and applied into the soil 20 days prior to wheat sowing at the rate of 5 t ha−1 on a dry weight basis. The microbial consortia of Fuller’s earth-based BGA culture containing micro-organisms, such as Nostoc muscorum, Anabaena variabilies, Aulosira fertilissima and Tolypothrix tenuis, were collected from the National Centre for Conservation and Utilization of Blue Green Algae, IARI, New Delhi, and broadcast in the plots after 10 days of rice transplanting at the rate of 2.5 kg ha−1. The wheat-specific strains of Azotobacter chroococcum collected from the Division of Microbiology, IARI, New Delhi, were used for wheat seed inoculation at the rate of 25 g kg−1. The seeds were further dried in shade and sown in the respective plots according to treatments.

2.2. Soil Sampling and Analysis

The soil samples were drawn after the harvesting of wheat crop from three different depths, i.e., 0–15, 15–30 and 30–60 cm. The soil samples collected were bifurcated into two sub-sets; one was processed, air-dried, and passed through a 2 mm mesh sieve for analysis of various fractions of SOC, soil C mineralization, labile organic C fractions, GRSP and COC, and the other was gently broken through natural cleavage and sieved through an 8 mm sieve. The sieved soil was carefully cleaned from any type of debris and then air-dried for soil aggregates and particulate organic C (POC) analysis.

2.3. Assessment of C Stability in Clay–Organic Complex (COC)

The separation of COC from bulk soil was carried out following the protocol of Datta et al. [24]. The COC was measured using the batch technique of the humus desorption experiment [8,24], whereby nearly 0.10 g COC along with 80 mL of 0.1 M NaOH + 0.1 M Na2 P4O7 were shaken for two hours followed by centrifugation for collection of the supernatant solution. This whole process was repeated four times, and each time, the COC was shaken with a fresh solution of hydroxide–pyrophosphate (NaOH + Na2P4O7). The C concentration in the extracts was measured following the method outlined by Schollenberger [25]. The absorbance of the extract was measured by a spectrophotometer at a wavelength of 440 nm. Regression lines were developed between the C concentration in the extract and the corresponding absorbance. In subsequent extractions, when the C concentration was very low, the estimation of C was performed by employing regression equations instead of using acidified potassium dichromate (K2Cr2O7). The cumulative desorption of humus C per unit amount of COC was estimated from the C concentration of the extract at different times and was subtracted from the C concentration in the clay–humus complex to obtain the remaining C, Ct at time t. The above parameters were fitted to a first-order kinetic Equation (1).
Ct = Co e−kt
where Co represents the initial C concentration; e denotes the exponential; and k denotes the humus desorption rate constant. The inverse of k gives the retention time of humus in the soil.

2.4. Soil Aggregate Analysis and Aggregate-Associated C

The 8 mm sieved soils were passed through a set of three sieves with the sizes of 2, 0.25 and 0.053 mm [26,27]. For the separation of soil aggregates, 100 g soil was initially placed over a 2 mm sieve in a Yoder apparatus, so that the set of sieves were completely immersed in water, and it was shaken vertically for 20 min. Large macroaggregate (LMA > 2 mm), small macroaggregate (SMA, 0.25–2 mm), microaggregate (mA, 0.053–0.25 mm) and CSA-sized fractions (< 0.053 mm) were separated in individual sieves and transferred to pre-weighed filter papers (Figure 1). The aggregate samples thus collected were dried in an oven at 60 °C for 48 h, grounded to fine powder in a pestle and mortar and passed through a 0.2 mm sieve before total C analysis by the dry combustion method [28].

2.5. Estimation of Glomalin-Related Soil Protein (GRSP)

The GRSP was extracted from soil by using the protocol of Wright and Upadhyaya [29]. Further, the GRSPs were quantified using the Bradford protein assay [30] employing Bovine serum albumin as a standard. Depending on the color of the supernatants, the dilution was performed using phosphate-buffered saline solution, following which, 500 µL\G-250 was added. The GRSP concentration was then measured on a spectrophotometer at 595 nm.

2.6. Fractions of Soil C and Soil C Mineralization

The SOC was determined by the dry combustion method [31] using an automatic elemental analyzer (Vario EL, Elementar Analysensysteme GmbH, Hanau, Germany). The labile fractions of organic carbon, including KMnO4 oxidizable C (POXC), particulate organic carbon (POC), dissolved organic carbon (DOC) and mineralized C (Cmin), are often considered as being very much sensitive to changes occurring in the soil environment and as suitable indicators for soil quality assessment. The POXC in soil was determined by employing 0.2 M KMnO4 stock solution [32]. The POC was estimated by the protocol outlined by Cambardella and Elliott [33]. The soils were shaken with 0.5% sodium hexametaphosphate solution for 15 h, followed by sieving with 0.053 mm sieve, subsequent washing, drying and total C estimation. The DOC was evaluated by the methods of Jones and Willett [34]. The soil samples were extracted with distilled water (soil: water ratio of 1:5) for 30 min, then shaken at 230 rpm and centrifuged at 4000 rpm. The extracted fluid was filtered through 0.45 µm filter for organic C estimation. An incubation experiment was conducted to measure the C mineralization (Cmin) through C dioxide (CO2) flux [35]. The Cmin was determined by keeping the pre-weighed soils in a respiration jar kept at field capacity at 37 °C, and a 0.5 M NaOH trap was placed inside the respiration jar in vials, which were used for trapping the evolved CO2. These were further titrated with standard acids with the help of a phenolphthalein indicator. The incubation was performed for a one-year period.

2.7. Plant Sample Collection and Rice Equivalent Yield

The grain yield of rice and wheat in a cropping system was recorded, and the rice equivalent yield (REY) was calculated for those five treatments by the following Equation (2):
REY = Yx (Px/Py)
where Yx represents the yield of x crops (kg ha−1); Px is the price of x crops (INR kg−1); and Py denotes the y crop price (INR kg−1) (based on the minimum support price fixed by the Government of India for different crops) [36].

2.8. Statistical Analysis

The experiment was conducted using a randomized block design. Analysis of variance was performed by the SPSS program (Version 16.0, SPSS, 2007, Chicago, IL, USA) to determine the effects of treatment. The significance of differences between the means was evaluated by analysis of variance. Samples were analyzed in triplicate, and mean values were used for comparisons. Duncan’s multiple-range test (DMRT) was performed to compare the treatment means at 5% probability (p = 0.05). Simple correlations and regressions were performed to evaluate the relationships among the response variables. The correlation coefficients between different soil parameters were determined using the same statistical package. Multivariate correlation matrix (Pearson) was worked out between different soil organic carbon fractions, aggregate-associated carbon, glomalin-related soil protein in aggregates and rice equivalent yield to show their degrees of association.

3. Results

3.1. Carbon Stability in Clay–Organic Complex

The stability of C in COC ranged from 2.99 to 13.1, 1.63 to 5.81, and 1.33 to 6.62 h, with mean values of 9.13, 3.15 and 2.92 h for all the soil depths, 0–15, 15–30 and 30–60 cm, respectively. It was three times higher at the surface layer compared to the sub-surface layers. The COC was found to be significantly higher for the treatments with the addition of organic amendments on a continuous basis over the last nine years under a rice–wheat rotation (Figure 2 and Figure 3; Table 1). The T3 treatment denotes Sesbania aculeate as green manure (SGM) applied to rice and Leucaena leucocephala as green leaf manure (LGLM) applied to wheat (GM); T4 denotes SGM + blue green algae (BGA) applied to rice and LGLM + Azotobacter applied to wheat (GM + BF); and T5 denotes FYM + SGM applied to rice and FYM + LGLM applied to wheat (FYM + GM). These treatments were at par 0–15 cm in depth but were significantly different among all organic treatment combinations in sub-surface depths. On average, the organic amendment showed 193% higher C stability compared to the control. Irrespective of soil depth, the highest C stability in COC was invariably recorded in the treatment receiving FYM + GM + BF (T6).

3.2. Aggregate Size Distribution

The percentage of large macroaggregate (LMA) (>2 mm) significantly decreased with the soil depth. Averaged over the treatments, the values were 30.6, 6.40 and 0.41% at 0–15, 15–30 and 30–60 cm soil depths, respectively (Table 2). All other size aggregates (<2 mm) increased from surface to sub-surface layers and showed a reverse trend compared to the distribution of LMA along the soil depths.
For the SMA, mA and CSA (<0.053 mm) sized soil aggregate fractions, the magnitude of increase at 15–30 cm soil depth was 58, 13 and 16%, respectively, while at 30–60 cm soil depth, it was 46, 49 and 0.3%, respectively, compared to the aggregate fractions at 0–15 cm soil depth (Table 2). It was found that, except for T3 (where GM was applied alone), all other treatments recorded a significant increase in the percentage of LMA over the control, with a magnitude of 83 to 101% at 0–15 cm soil depth. The increase was maximum for T6, where GM, FYM and BF were applied together for nine years, and there was also a 16% higher LMA over the control at 15–30 cm soil depth. The FYM and GM application, either alone or in combination with other organics, significantly decreased the percentage of SMA (2–0.25 mm) and mA (0.25–0.053 mm), with a magnitude of 25 and 23% over the control, respectively. The GM application alone (T3) significantly increased the proportion of CSA, with a magnitude of 132% in surface soil. However, the distribution of aggregates in different size fractions was not uniform in sub-surface layers.

3.3. Aggregate-Associated C

The C associated with the aggregates was found to be higher in surface than in sub-surface layers (Table 3). On average, the aggregate-associated C was 74 and 192% higher at 0–15 cm depth as compared to 15–30 and 30–60 cm soil depths, respectively. The depth-wise reduction in aggregate-associated C was higher in the SMA and mA (>300% together) compared to the LMA and CSA fraction (<150% together). Averaged over the depth, CSA-associated C was highest as compared to the C associated with other fractions. The organic treatments significantly increased the aggregate-associated C by 15 to 36% over the control in surface soil.
The LMA-associated C was lowest for the control (8.32 g kg−1) and highest for T2 (9.14 g kg−1) and T6 (8.88 g kg−1) in surface soil (Table 3). T2 and T6 exhibited higher LMA-associated C not only at 0–15 cm soil depth but also at 15–30 cm depth, with a magnitude of 14 and 11%, respectively, over the control. Further, at surface layer (0–15 cm), T6 recorded a 14.1% higher SMA-associated C over the control; however, at sub-surface layers, the treatment effects were insignificant. The mA (0.25–0.053 mm)-associated C was highest where FYM was applied alone (T2). At sub-surface soil depth, there was no particular trend. On average, at 0–15 cm soil layer, the treatments with different organics contributed 131% higher C in CSA-sized fraction (<0.053 mm) over the control. The amount of CSA-associated C was highest for T6 at both the surface (0–15 cm) and sub-surface (30–60 cm) soil depths, and the magnitude of increase in T6 over the control was 193 and 58%, respectively. On average, the combined application of FYM, GM and BF (T6) exhibited higher C accumulation in almost all the soil aggregates, except mA, where application of FYM alone (T2) recorded the highest C accumulation.

3.4. Glomalin-Related Soil Protein

The GRSP concentration at surface soil (0–15 cm) varied from 1.45 to 2.45 and 1.37 to 1.93 mg kg−1 in macroaggregates, both large and small (>0.25 mm), and mA (<0.25 mm), respectively. The distribution of GRSP throughout the depth did not follow any trend. The application of organics significantly increased the GRSP concentration in both the aggregates, and it was recorded the highest in treatments where FYM, GM and BF were applied together (T6) on a long-term basis. The magnitude of increases for T6 over the control (T1) in macroaggregates and mA was 67 and 40%, respectively, at 0–15 cm, and 60 and 171%, respectively, at 15–30 cm depth (Figure 4). However, manure application for long-term effects in the GRSP allocation at 30–60 cm soil depth was highly variable and inconsistent.

3.5. Soil Organic C Fractions

On average, the soil C fractions, i.e., TSOC, POC, DOC and POXC, decreased with soil depth (0–15, 15–30, 30–60 cm), and the magnitude of decrease was 85, 91, 55 and 62%, respectively. The TSOC concentration at 0–15 cm soil layer ranged from 7.68 g kg−1 in the control (T1) to 10.54 g kg−1 in T6 (combined application of GM, FYM and BF), which was 37% higher over the control and at par with T5, followed by T4 and T2 (Table 4).
The treatment effect was not significant for 15–30 and 30–60 cm soil depths. The highest POC was recorded under T6 and the lowest under T1 at 0–15 and 15–30 cm soil depths. On the other hand, DOC decreased sharply with increasing depth. Compared with the control (T1), T6 increased the DOC by 50, 47.3 and 55.6% at 0–15, 15–30 and 30–60 cm soil depths, respectively. The POXC at 0–15 cm soil depth was lowest in T1 (358 mg kg−1), and it was highest in T2 (470 mg kg−1), which was at par with T4 and T6, and the average increase was 28% over the control.

3.6. Soil C Mineralization

Almost all treatments depict a higher rate of Cmin at 0–15 cm soil depth than at sub-surface layers (15–30 cm and 30–60 cm). The cumulative values of CO2-C evolved over the incubation period of 1 year showed a progressive trend among the treatments receiving different combinations of organic manures and biofertilizers (Figure 5). Averaged over all the soil depths studied, the treatment with GM + FYM + BF (T6) showed the greatest cumulative Cmin throughout the incubation period, and it was lowest in the control (T1). The Cmin at 0–15 cm depth ranged from 4.06 to 2.46 mg g−1 soil, and T6 and T5 (GM + FYM) recorded 65% and 56% higher Cmin over T1. Similarly, at 15–30 cm soil depth, T6 and T5 increased Cmin by 55% and 62%, and at 30–60 cm depth, the increases were 274% and 141% over the control, respectively.

3.7. Rice Equivalent Yield (REY)

The REY ranged from 3.25 to 5.63 t ha−1, and the highest yield was recorded for T6 where GM, FYM and BF were applied together. However, compared to the control, a 47 to 73% increase in REY was recorded with the organic treatment (Figure 6).

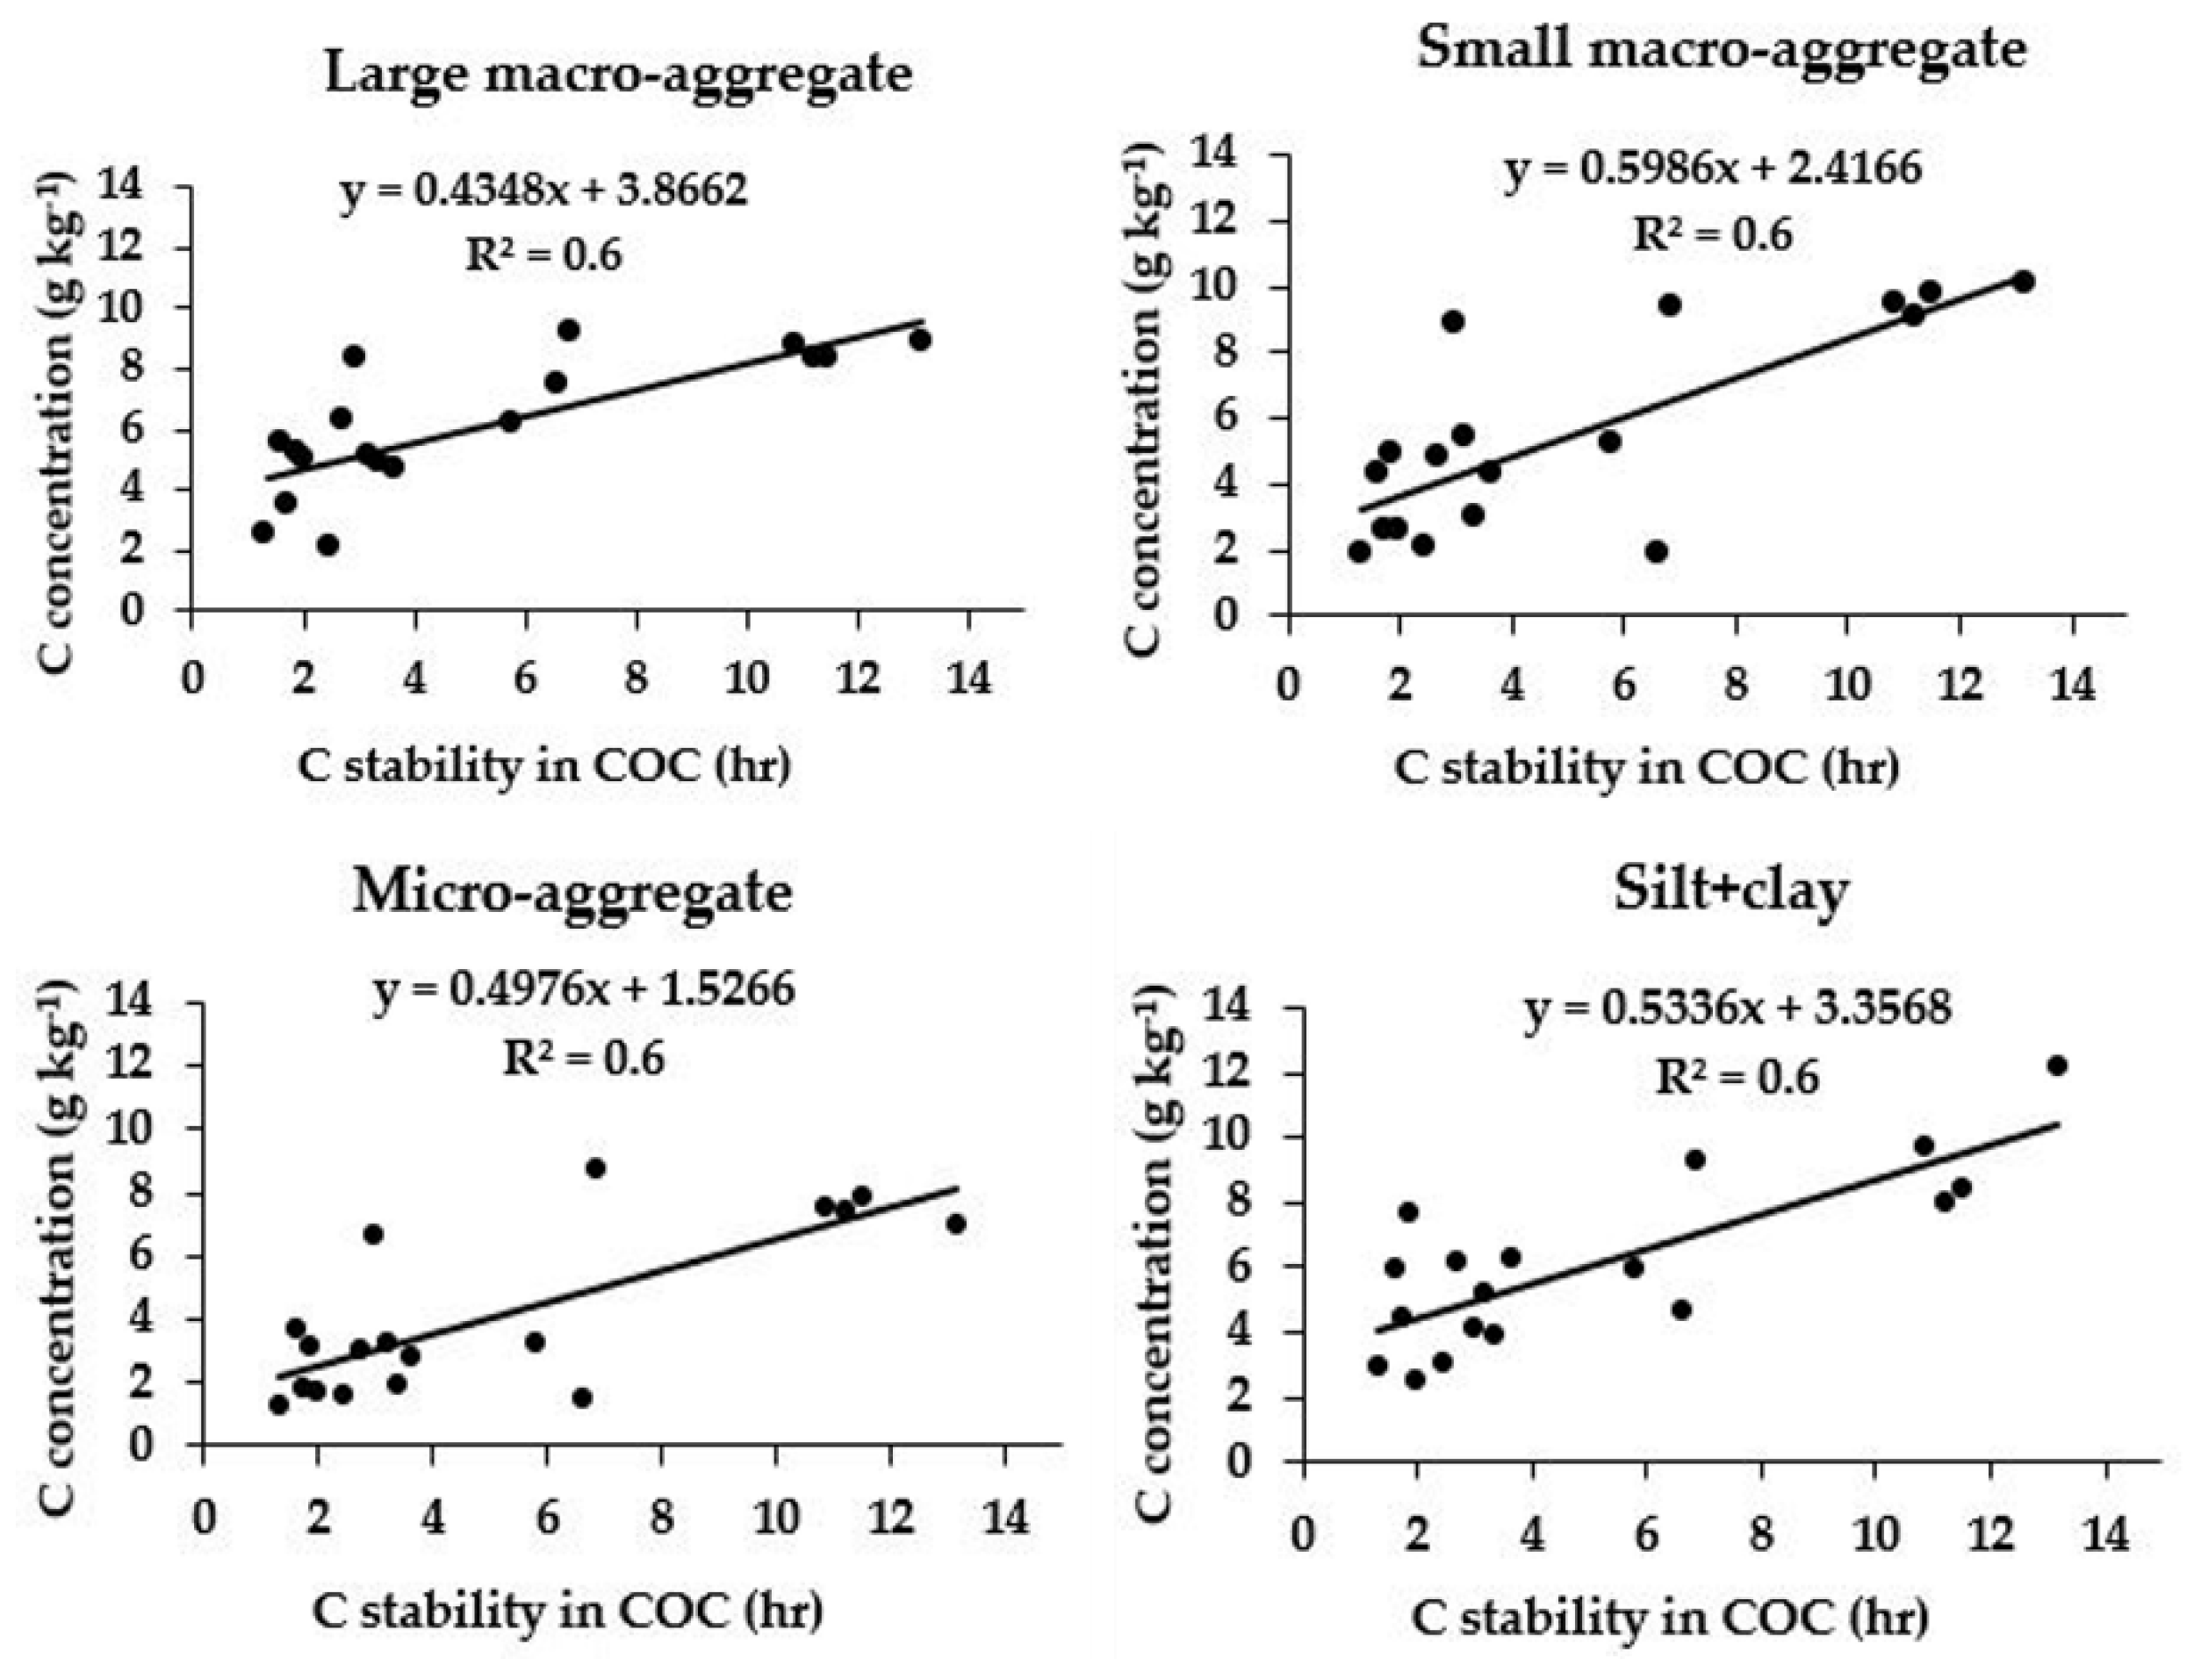
3.8. Relationships among the COC, Aggregate-Associated C, SOC Fractions, Cmin and REY

The COC was highly correlated (p = 0.01) with the aggregate-associated C, SOC fractions and REY (r = 0.93). A regression equation was also developed by plotting the values of C stability in COC on the x-axis and C concentration on the y-axis (Figure 2). On the other hand, the TSOC significantly correlated with POC, DOC, Cmin, POXC, and all aggregate size fractions and REY. The increase in SOC was associated with concomitant increase in the above labile SOC fractions. POC and POXC showed significant correlations with Cmin, which implies that the former TSOC fractions significantly contributed to the latter. POXC and POC were significantly correlated with each other due to moderate lability of the latter fraction. The Cmin-, LMA- and mA-associated C did not correlate with REY. Further, the GRSP concentration in both MA and mA did not correlate with either various SOC fractions or aggregate size fractions, except for the GRSP concentration in MA, which correlated (p = 0.05) with COC, depicting its role in aggregate formation.

4. Discussion

4.1. Carbon Stability in COC

The cultivation of soil with different organic amendments, either alone or in combinations, over multiple years increased the COC compared to the control (T1), and the highest stability of C was recorded for T6, where GM, FYM and BGA were applied together. The treatments with organic amendments performed well compared to the unfertilized control due to higher biomass yield [37], which resulted in higher root exudation and more stability of C in COC. Higher stability of C in COC due to application of FYM or GM along with inorganic fertilizers has been reported [8]. However, the highest increase in T6 was due to higher C input from the combined application of GM, FYM and BGA compared to GM alone or combinations of any two in the other treatments [3]. A narrower C:N ratio in FYM and GM is often linked with more availability of N per unit of C, which, in turn, increases the use efficiency of C through soil microbes, and as a result, a greater quantity of substrate C could be added and retained in the soils [38]. Compared to the control, the addition of organics improved the humification and aromaticity of SOM [3], hence the higher COC in organically treated plots. Moreover, the addition of organics also increases the amount of poorly crystalline iron oxides, which establish covalent links with organic matter by their hydroxyl functional groups, bind the organic matter and increase the stability of C in soil [8,39].

4.2. Aggregate Size Distribution and Aggregate-Associated C

The percentage of LMA decreased with soil depth, and, on the contrary, the SMA, mA and CSA size fractions increased with soil depth. The percentage of LMA showed a significantly positive correlation (p < 0.01) with the C associated with various aggregate size fractions, i.e., LMA (r = 0.81), SMA (r = 0.93), mA (r = 0.94) and CSA (r = 0.82). Therefore, a higher percentage of LMA at the surface layer was due to the higher amount of aggregate-associated C (192% higher than at 30–60 cm depth). The LMA distribution (>2 mm) size fraction at surface layer revealed that GM + BF, GM + FYM and GM + FYM + BF treatments showed better aggregation over the control. The combined application of GM, FYM and BF in T6 not only maintained the higher proportion of LMA in surface soil but also at the 15–30 cm sub-surface layer. Higher C input from the freshly added organic substrate increases LMA in those organic treatments compared to the control [40]. The added organics from these three different sources directly supply the water-soluble and hydrolysable organic substrates and C to the soil, which results in the production of polysaccharides from microbes, which might increase the aggregate stability [15].
Several investigators reported that continuous addition of organic matter via compost and additional root biomass to the soil induced the formation of MA, as they act as a source of C for microbial activities, and also the release of microbe-derived binding agents that bind the soil particles together to form aggregates [41,42,43]. It was interesting to note that when GM was applied alone (T3), the aggregate formation was decreased, and consequently, the CSA fraction was increased compared to the control, as well as to the other organic treatments. The intensity of humification in GM was reported to be lower than in FYM [3,44] as well as in the lignin and polyphenol concentration [15], hence a decrease in aggregate formation. The C associated with the aggregates was higher at surface layer than at sub-surface layers in almost all aggregate size fractions. The larger amount of C associated with the aggregates at surface layer was often due to the higher root biomass production at surface layer [18] and SOC, as contributed by surface litter at the top layer of the soil profile [45], which caused higher C density in different aggregate sizes. The SOC often acts as a binding agent and strongly binds together the individual soil particles to form mA, which combine to form MA [46]. Therefore, the associated C in MA (>0.25 mm, both large and small) was higher (20%) as compared to the mA-associated C at surface soil layer.
Across the treatments, it was found that C concentration in soil aggregates increased with organic manuring. Microbial activities resulting from organic matter decomposition lead to secretion of polysaccharides responsible for the efficient binding of mA to form MA [47,48]. These MA are capable of protecting the C physically and act as a C sink. The increased C in the MA fraction suggests that MA play a crucial role in long-term C capture and are a possible indicator of soil C sequestration. Application of FYM, GM and BF (T6) in a conjoint manner led to greater accumulation of C in all the soil aggregates due to more contribution of C from these organic sources as compared to their individual application. Moreover, the BGA and Azotobacter applied as biofertilizers were also capable of binding the primary soil particles and resulted in an increase in the aggregate stability and C enrichment within the aggregates [49]. The BF + FYM treatment consists of more labile forms of C, leading to deposition of extra cellular polysaccharides during the process of annihilation, and incorporates intra-aggregate particulate organic matter (iPOM) within the aggregate, resulting in a better aggregate formation [50].

4.3. Glomalin-Related Soil Protein (GRSP)

The GRSP in both MA and mA was significantly improved due to the application of different combinations of organic manures, and T6, where FYM, GM and BF were applied together, had the highest values (Figure 4). The addition of organics alone or in combination increases the activity of micro-organisms, which release growth-stimulating substances from organic manures [51]. Continuous application of large amounts of manure over ten years significantly affects the arbuscular mycorrhizal fungi (AMF) activities, which results in glomalin production [51]. Glomalin was reported to act as a binding agent [52], which can facilitate aggregation, especially the formation of MA, involving C capture and protection [53].

4.4. Soil Organic C Fractions and Cumulative C Mineralization

The application of organics increased the SOC fractions, i.e., TSOC, POC, DOC and POXC, over the control, and the highest increase was recorded in T6, where FYM, GM and BF were applied together. The SOC stock is linked directly to both the quantity and quality of organic residues, manure, as well as fertilizer application [54]. The labile fractions of SOC were increased due to the external addition of organic inputs [55,56]. For example, POXC, representing relatively younger and newer forms of organic compounds, which include labile humic materials and polysaccharides [57,58], increased significantly in organic treated plots, especially under T6. The differences in cumulative Cmin among the treatments are indicative of the fact that varied proportions of organic manures and biofertilizers led to better accumulation and release of labile organic C. Balanced fertilization created favorable conditions by supplying labile C substrate, which might have triggered the biological activity, and thus showed an enhanced rate of Cmin [59]. However, the minimum rate of soil Cmin in the control plot suggests a depletion of the SOC and nutrients due to continuous cropping [60]. Even the combined application of manure and chemical fertilizers showed a consistent increase in the activity of urease, phosphatase and invertase as compared to non-fertilized plots [61].

4.5. Rice Equivalent Yield (REY)

The long-term addition of organic manures, either alone or conjointly with biofertilizers, led to improvement in the yield of rice–wheat rotation over the control. The application of organic matter increased the SOC fractions [62], C stability in soil, as well as increasing the N inputs due to organic matter addition ultimately facilitating higher REY in organic treated plots. Many workers have reported the increase in yield of paddy as a residual effect of FYM application to a previous crop [63,64,65,66]. Further, the application of green manure (Sesbania aculeata) with Azospirillum significantly improved the yield-attributing characteristics of rice [67,68]. Similarly, the combined application of FYM, GM and BF resulted in a significant increase in the growth attributes of rice owing to the increased uptake of nutrients [69,70,71]. The strongly positive correlations (p < 0.01) between the REY with COC and with C pools, such as TSOC, POC, DOC and GRSP (Table 5), also suggested the same.

4.6. Role of C Stability in Clay–Organic Complex (COC) in MA Formation

The COC was three times higher in topsoil layer over the sub-surface layer. The direct input of C from the root biomass as well as plant litter at surface soil layer [18] increased the amount of aggregate-associated C, TSOC, POC, DOC and POXC in surface soil, which facilitated the aggregate formation [72]. This is further clarified by the significantly positive correlation (p < 0.01) between the COC and those soil SOC fractions. The SOC fractions play a crucial role in aggregate formation and thereby enhance C stability. The POC within the MA encapsulates the minerals and other microbial products to form mA within the MA [26], which is very crucial for long-term sequestration of C [73] and explains the higher COC in the surface soil, where the LMA percentage was higher.
The organic C fractions bind the individual soil particles into soil aggregates and subsequently into LMA formation [46], which explains the positive relationship between COC and aggregate-associated C (Table 5). This result also implies that not only the aggregate-associated C, but also different SOC fractions had a significant role in the SOC stabilization process (Table 5). The COC contributed to 56–60% variability of C density in different aggregate size fractions (Figure 2). Further, CSA-associated C (r = 0.798, p < 0.01) was highly correlated with COC; this might be due to the fact that COC serves as the main component of the CSA fraction, which in turn stabilizes C in clay. Thus, organic C becomes physically protected within the aggregates [13,74] and chemically protected on clay surfaces by different bonding mechanisms [75].

4.7. Relationship between Cumulative C Mineralization and Soil Organic C Fractions

The SOC and its various pools, such as labile C and biologically active C, play a key role in aggregate stability [76,77]. In our study, we observed a strongly positive correlation (p < 0.01) between the Cmin and organic C fractions, viz., TSOC, POC, DOC and POXC. The TSOC was significantly and positively correlated with POC, DOC and POXC. This type of strong correlation was also reported by others [57,78]. This reiterates that SOC is one of the major determinants of labile C fractions in soil. Further, the SOC fractions significantly correlated with aggregate-associated C. However, GRSP did not correlate with aggregate-associated C or SOC fractions. The GRSP in MA showed a positive correlation with clay–humus stability, and GRSP in both MA and mA also strongly correlated with REY (r = 0.68 and r = 0.87). This is in line with the findings of Wright and Upadhyaya [79]. This suggests the important role played by GRSP in C stability in aggregates, leading to C sequestration. Similar findings were also reported by other studies [53,80].

5. Conclusions

The present study evaluated the influence of organic amendments on the stability of carbon in a clay–organic complex and their role in soil aggregation. We found that continuous application of locally available organic soil amendments, namely GM, FYM and BGA in rice, and FYM, GLM and Azotobacter in wheat, under a rice–wheat cropping system resulted in the stabilization of carbon in a clay–organic matter complex, the formation of higher proportion of macroaggregate- and aggregate-protected carbon. Among the different organic carbon sources and their combinations, FYM, GM and BF proved superior over others in improving different soil organic carbon fractions, such as TSOC, POC, DOC, POXC and GRSP. The REY was also higher in a combined application of FYM, GM and BF. Therefore, the above-mentioned combination of sources can be used for organically managed rice–wheat rotation in the inceptisols of semi-arid sub-tropical India for carbon sequestration, as a measure to counteract the effect of climate change. It is also reiterated that the formation of a clay–organic complex is a prerequisite for the development of macroaggregates, which could protect the carbon both physically as well as chemically, and thus, they are largely responsible for long-term carbon sequestration in soil. The increased carbon in the macroaggregate fraction suggests that macroaggregates play a significant role in long-term carbon capture. Further, a similar type of regression equation between the clay–organic complex and aggregate-associated carbon needs to be developed for other cropping systems, soil types and management practices for predicting carbon stability in a clay–organic complex.

Author Contributions

Conceptualization, D.K. and T.J.P.; methodology, D.K. and T.J.P.; formal analysis, D.K. and T.J.P.; investigation, D.K. and T.J.P.; resources, T.J.P.; data curation, D.K.; writing—original draft preparation, D.K.; writing—review and editing, R.D., R.K.Y., Y.S.S., P.K.J., S.S., K.A. and P.V.V.P.; visualization, P.K.J. and P.V.V.P.; supervision, T.J.P. All authors have read and agreed to the published version of the manuscript.

Funding

This research received no external funding.

Acknowledgments

The authors are grateful to the Head, Division of Soil Science and Agricultural Chemistry and Division of Agronomy, Indian Agricultural Research Institute (IARI), New Delhi, for providing the necessary infrastructure and support during the research work. Senior author (D.K.) acknowledges fellowship (senior research fellowship) from the Indian Council of Agricultural Research through IARI, New Delhi.

Conflicts of Interest

The authors declare that they have no known competing financial interests or personal relationships that could appear to have influenced the work reported in this paper.

References

  1. Ladha, J.K.; Dawas, D.; Pathak, H.; Padre, A.T.; Yadav, R.L.; Singh, B. How extensive are yield decline in long-term rice–wheat experiments in Asia. Field Crop. Res. 2003, 81, 159–180. [Google Scholar] [CrossRef]
  2. Ray, S.; Bhattacharyya, T.; Reddy, K.; Pal, D.; Chandran, P.; Tiwary, P.; Mandal, D.; Mandal, C.; Prasad, J.; Sarkar, D.; et al. Soil and land quality indicators of the Indo- Gangetic Plains of India. Curr. Sci. 2014, 107, 1470–1486. [Google Scholar]
  3. Purakayastha, T.J.; Das, R.; Kumari, S.; Shivay, Y.S.; Biswas, S.; Kumar, D.; Chakrabarti, B. Impact of continuous organic manuring on mechanisms and processes of the stabilisation of soil organic C under rice–wheat cropping system. Soil Res. 2019, 58, 73–83. [Google Scholar] [CrossRef]
  4. Samal, S.K.; Rao, K.K.; Poonia, S.P.; Kumar, R.; Mishra, J.S.; Prakash, V.; Mondol, S.; Dwivedi, S.K.; Bhatt, B.P.; Naik, S.K.; et al. Evaluation of long-term conservation agriculture and crop intensification in rice-wheat rotation of Indo-Gangetic Plains of South Asia: Carbon dynamics and productivity. Eur. J. Agron. 2017, 90, 198–208. [Google Scholar] [CrossRef]
  5. Muhammed, S.E.; Coleman, K.; Wu, L.; Bell, V.A.; Davies, J.A.C.; Quinton, J.N.; Carnell, E.J.; Tomlinson, S.J.; Dore, A.J.; Dragosits, U.; et al. Impact of two centuries of intensive agriculture on soil carbon, nitrogen and phosphorus cycling in the UK. Sci. Total Environ. 2018, 634, 1486–1504. [Google Scholar] [CrossRef]
  6. West, T.O.; Post, W.M. Soil organic carbon sequestration rates by tillage, and crop rotation: A global data analysis. Soil Sci. Soc. Am. J. 2002, 66, 1930–1946. [Google Scholar] [CrossRef] [Green Version]
  7. Sarkar, D.; Baishya, L.K.; Meitei, C.B.; Naorem, G.C.; Thokchom, R.C.; Singh, J.; Bhuvaneswari, S.; Batabyal, K.; Das, R.; Padhan, D.; et al. Can sustainability of maize-mustard cropping system be achieved through balanced nutrient management? Field Crop. Res. 2018, 225, 9–21. [Google Scholar] [CrossRef]
  8. Das, R.; Purakayastha, T.J.; Das, D.; Ahmed, N.; Kumar, R.; Biswas, S.; Walia, S.S.; Singh, R.; Shukla, V.K.; Yadava, M.S.; et al. Long-Term fertilization and manuring with different organics alter stability of carbon in colloidal organo-mineral fraction in soils of varying clay mineralogy. Sci. Total Environ. 2019, 684, 682–693. [Google Scholar] [CrossRef]
  9. Zinn, Y.L.; Lal, R.; Bigham, J.M.; Resck, D.V.S. Edaphic controls on soil organic carbon retention in the Brazilian Cerrado: Texture and mineralogy. Soil Sci. Soc. Am. J. 2007, 71, 1204–1214. [Google Scholar] [CrossRef]
  10. Mohammadi, J.; Motaghian, M. Spatial prediction of soil aggregate stability and aggregate-associated organic carbon content at the catchment scale using geostatistical techniques. Pedosphere 2011, 21, 389–399. [Google Scholar] [CrossRef]
  11. Schmidt, M.W.I.; Torn, M.S.; Abiven, S.; Dittmar, T.; Guggenberger, G.; Janssens, I.A.; Kleber, M.; Kögel-Knabner, I.; Lehmann, J.; Manning, D.A.C.; et al. Persistence of soil organic matter as an ecosystem property. Nature 2011, 478, 49–56. [Google Scholar] [CrossRef] [PubMed]
  12. Gispert, M.; Emran, M.; Pardini, G.; Doni, S.; Ceccanti, B. The impact of land management and abandonment on soil enzymatic activity, glomalin content and aggregate stability. Geoderma 2013, 202–203, 51–61. [Google Scholar] [CrossRef]
  13. Blanco-Canqui, H.; Lal, R. Mechanisms of carbon sequestration in soil aggregates. Crit. Rev. Plant Sci. 2004, 23, 481–504. [Google Scholar] [CrossRef]
  14. Kleber, M.; Eusterhues, K.; Keiluweit, M.; Mikutta, C.; Mikutta, R.; Nico, P.S. Mineral organic associations: Formation, properties, and relevance in soil environments. Adv. Agron. 2015, 130, 1–140. [Google Scholar] [CrossRef]
  15. Bandyopadhyay, P.K.; Saha, S.; Mani, P.K.; Mandal, B. Effect of organic inputs on aggregate-associated organic carbon concentration under long-term rice–wheat cropping system. Geoderma 2010, 154, 379–386. [Google Scholar] [CrossRef]
  16. Yu, H.Y.; Ding, W.X.; Luo, J.F.; Geng, R.L.; Cai, Z.C. Long-Term application of organic manure and mineral fertilizers on aggregation and aggregate-associated carbon in a sandy-loam soil. Soil Tillage Res. 2012, 124, 170–177. [Google Scholar] [CrossRef]
  17. Mohanty, M.; Sinha, N.K.; Reddy, K.S.; Chaudhary, R.S.; Subba Rao, A.; Dalal, R.C.; Menzies, N.W. How important is the quality of organic amendments in relation to mineral availability in soils? Agric. Res. 2013, 2, 99–110. [Google Scholar] [CrossRef]
  18. Yadav, R.K.; Purakayastha, T.J.; Khan, M.A.; Kaushik, S.C. Long-Term impact of manuring and fertilization on enrichment, stability, and quality of organic carbon in Inceptisol under two potato-based cropping systems. Sci. Total Environ. 2017, 609, 1535–1543. [Google Scholar] [CrossRef]
  19. Graf, F.; Frei, M. Soil aggregate stability related to soil density, root length, and mycorrhiza using site-specific Alnus incana and Melanogaster variegates s.l. Ecol. Eng. 2013, 57, 314–323. [Google Scholar] [CrossRef]
  20. Yilmaz, E.; Sonmez, M. The role of organic/biofertilizers amendment on aggregate stability and organic carbon content in different aggregate scales. Soil Tillage Res. 2017, 168, 118–124. [Google Scholar] [CrossRef]
  21. Ramesh, P.; Panwar, N.R.; Singh, A.B.; Ramana, S.; Rao, A.S. Impact of organic manure combinations on the productivity and soil quality in different cropping systems in Central India. J. Plant Nutr. Soil Sci. 2009, 172, 577–585. [Google Scholar] [CrossRef]
  22. Banger, K.; Toor, G.; Biswas, A.; Sidhu, S.; Sudhir, K. Soil organic carbon fractions after 16 years of applications of fertilizers and organic manure in a Typic Rhodalfs in semi-arid tropics. Nutr. Cycl. Agroecosyst. 2010, 86, 391–399. [Google Scholar] [CrossRef]
  23. Fisher, R.A.; Yates, F. Statistical Table for Biological, Agricultural, and Medical Research, 6th ed.; Oliver and Boyd: London, UK, 1963. [Google Scholar]
  24. Datta, S.C.; Takkar, P.N.; Verma, U.K. Assessing stability of humus in soils from continuous rice–wheat and maize–wheat cropping systems using kinetics of humus desorption. Commun. Soil Sci. Plant Anal. 2015, 46, 2888–2900. [Google Scholar] [CrossRef]
  25. Jackson, M.L. Soil Chemical Analysis; Prentice Hall of India Pvt. Ltd.: New Delhi, India, 1967. [Google Scholar]
  26. Six, J.; Elliott, E.T.; Paustian, K.; Doran, J.W. Aggregation, and soil organic matter accumulation in cultivated and native grassland soils. Soil. Sci. Soc. Am. J. 1998, 62, 1367–1377. [Google Scholar] [CrossRef] [Green Version]
  27. Six, J.; Elliott, E.T.; Paustian, K. Aggregate and soil organic matter dynamics under conventional and no-tillage systems. Soil Sci. Soc. Am. J. 1999, 63, 1350–1358. [Google Scholar] [CrossRef] [Green Version]
  28. Snyder, J.D.; Trofymow, J.A. A rapid accurate wet oxidation diffusion procedure for determining organic and inorganic carbon in pot and soil samples. Commun. Soil Sci. Plant Anal. 1984, 15, 587–597. [Google Scholar] [CrossRef]
  29. Wright, S.F.; Upadhyaya, A. Extraction of an abundant and unusual protein from soil and comparison with hyphal protein of arbuscular mycorrhizal fungi. Soil Sci. 1996, 161, 575–586. [Google Scholar] [CrossRef]
  30. Bradford, M.M. A rapid and sensitive method for the quantification of microgram quantities of protein utilizing the principle of protein-dye binding. Anal. Biochem. 1976, 72, 248–254. [Google Scholar] [CrossRef]
  31. Nelson, D.W.; Sommers, L.E. Total carbon, organic carbon, and organic matter. In Methods of Soil Analysis, Part 2 Chemical and Microbiological Properties, 2nd ed.; Page, A.L., Ed.; Agronomy Monograph 9; Soil Science Society of America: Madison, WI, USA, 1982. [Google Scholar] [CrossRef]
  32. Weil, R.R.; Islam, K.R.; Stine, M.A.; Gruver, J.B.; Samson-Leibig, S.E. Estimating active carbon for soil quality assessment: A simplified method for laboratory and field use. Am. J. Altern. Agri. 2003, 18, 3–17. [Google Scholar] [CrossRef]
  33. Cambardella, C.A.; Elliott, E.T. Particulate soil organic matter changes across a grassland cultivation sequence. Soil Sci. Soc. Am. J. 1992, 56, 777–783. [Google Scholar] [CrossRef]
  34. Jones, D.L.; Willett, V.B. Experimental evaluation of methods to quantify dissolved organic nitrogen (DON) and dissolved organic carbon (DOC) in soil. Soil Biol. Biochem. 2006, 38, 991–999. [Google Scholar] [CrossRef]
  35. Parr, J.F.; Smith, S. A multiple-purpose manifold, assembly: Use in evaluating microbial effects of pesticide. Soil Sci. 1969, 4, 271–276. [Google Scholar] [CrossRef]
  36. Verma, S.P.; Modgal, S.C. Production potential and economics of fertilizer application as resources constraints in maize, wheat crop sequences. Himachal J. Agric. Res. 1983, 9, 89–92. [Google Scholar]
  37. Brar, B.S.; Singh, K.; Dheri, G.S.; Kumar, B. Carbon sequestration and soil carbon pools in a rice–wheat cropping system: Effect of long-term use of inorganic fertilizers and organic manure. Soil Tillage Res. 2013, 128, 30–36. [Google Scholar] [CrossRef]
  38. Dannehl, T.; Leithold, G.; Brock, C. The effect of C:N ratios on the fate of carbon from straw and green manure in soil. Eur. J. Soil Sci. 2017, 68, 988–998. [Google Scholar] [CrossRef]
  39. Wang, P.; Wang, J.; Zhang, H.; Dong, Y.; Zhang, Y. The role of iron oxides in the preservation of soil organic matter under long-term fertilization. J. Soils Sediments 2019, 19, 588–598. [Google Scholar] [CrossRef]
  40. Chivenge, P.; Vanlauwe, B.; Gentile, R.; Six, J. Organic resource quality influences short-term aggregate dynamics and soil organic carbon and nitrogen accumulation. Soil Biol. Biochem. 2011, 43, 657–666. [Google Scholar] [CrossRef]
  41. Sodhi, G.P.S.; Beri, V.; Benbi, D.K. Soil aggregation and distribution of carbon and nitrogen in different fractions under long-term application of compost in rice–wheat system. Soil Tillage Res. 2009, 103, 412–418. [Google Scholar] [CrossRef]
  42. Chen, Y.; Zhang, X.; He, H.; Xie, H.; Yan, Y.; Zhu, P.; Ren, J.; Wang, L. Carbon and nitrogen pools in different aggregates of a Chinese Mollisol as influenced by long-term fertilization. J. Soils Sediments 2010, 10, 1018–1026. [Google Scholar] [CrossRef]
  43. Totsche, K.U.; Amelung, W.; Gerzabek, M.H.; Guggenberger, G.; Klumpp, E.; Knief, C.; Lehndorff, E.; Mikutta, R.; Peth, S.; Prechtel, A.; et al. Microaggregate in soils. J. Plant Nutr. Soil Sci. 2018, 181, 104–136. [Google Scholar] [CrossRef] [Green Version]
  44. Chaudhary, S.; Dheri, G.; Brar, B. Long-term effects of NPK fertilizers and organic manures on carbon stabilization and management index under rice-wheat cropping system. Soil Tillage Res. 2017, 166, 59–66. [Google Scholar] [CrossRef]
  45. Maia, S.M.F.; Ogle, S.M.; Cerri, C.C.; Cerri, C.E.P. Changes in soil organic carbon storage under different agricultural management systems in the Southwest Amazon Region of Brazil. Soil Tillage Res. 2010, 106, 177–184. [Google Scholar] [CrossRef]
  46. Six, J.; Conant, R.T.; Paul, E.A.; Paustian, K. Stabilization mechanisms of soil organic matter: Implications for C-saturation of soils. Plant Soil 2002, 241, 155–176. [Google Scholar] [CrossRef]
  47. Benbi, D.K.; Pritpal, S.; Toor, A.S.; Gayatri, V. Manure and fertilizer application effects on aggregate and mineral associated organic carbon in a loamy soil under rice-wheat system. Commun. Soil Sci. Plant Anal. 2016, 47, 1828–1844. [Google Scholar] [CrossRef]
  48. Mi, W.; Wu, Y.; Zhao, H.; Wu, L.; Liu, Y. Effects of combined organic manure and mineral fertilization on soil aggregation and aggregate-associated organic carbon in two agricultural soils. J. Plant Nutr. 2018, 41, 2256–2265. [Google Scholar] [CrossRef]
  49. Issa, M.O.; Défarge, C.; Le Bissonnais, Y.; Marin, B.; Duval, O.; Bruand, A.; D’Acqui, L.P.; Nordenberg, S.; Annerman, M. Effects of the inoculation of cyanobacteria on the microstructure and the structural stability of a tropical soil. Plant Soil 2007, 290, 209–219. [Google Scholar] [CrossRef] [Green Version]
  50. Haynes, R.J.; Francis, G.S. Changes in microbial biomass C, soil carbohydrate composition and aggregate stability induced by growth of selected crop and forage species under field conditions. Eur. J. Soil Sci. 1993, 44, 665–675. [Google Scholar] [CrossRef]
  51. Wu, F.S.; Dong, M.; Liu, Y.; Ma, X.; An, L.; Young, J.P.W.; Feng, H. Effects of long-term fertilization on AM fungal community structure and Glomalin-related soil protein in the Loess Plateau of China. Plant Soil 2011, 342, 233–247. [Google Scholar] [CrossRef]
  52. Haddad, M.J.; Sarkar, D. Glomalin, a newly discovered component of soil organic matter: Part II-Relationship with soil properties. Environ. Geosci. 2003, 10, 99–106. [Google Scholar] [CrossRef]
  53. Franzluebbers, A.J.; Wright, S.F.; Stuedemann, J.A. Soil aggregation and glomalin under pastures in the Southern Piedmont USA. Soil Sci. Soc. Am. J. 2000, 64, 1018–1026. [Google Scholar] [CrossRef]
  54. Wang, S.; Liang, X.; Luo, Q.; Fan, F.; Chen, Y.; Li, Z.; Sun, H.; Dai, T.; Wan, J.; Li, X. Fertilization increases paddy soil organic carbon density. J. Zhejiang Univ. Sci. B 2012, 13, 274–282. [Google Scholar] [CrossRef] [PubMed]
  55. Schneider, M.P.W.; Scheel, T.; Mikutta, R.; van Hees, P.; Kaiser, K.; Kalbitz, K. Sorptive stabilization of organic matter by amorphous Al hydroxide. Geochim. Cosmochim. Acta. 2010, 74, 1606–1619. [Google Scholar] [CrossRef] [Green Version]
  56. Saidy, A.R.; Smernik, R.J.; Baldock, J.A.; Kaiser, K.; Sanderman, J. Microbial degradation of organic carbon sorbed to phyllosilicate clays with and without hydrous iron oxide coating. Eur. J. Soil Sci. 2015, 66, 83–94. [Google Scholar] [CrossRef]
  57. Rudrappa, L.; Purakayastha, T.J.; Singh, D.; Bhadraray, S. Long-term manuring and fertilization effects on soil organic carbon pools in a Typic Haplustept of semi-arid subtropical India. Soil Tillage Res. 2006, 88, 180–192. [Google Scholar] [CrossRef]
  58. Datta, S.P.; Rattan, R.K.; Chandra, S. Labile soil organic carbon, soil fertility, and crop productivity as influenced by manure and mineral fertilizers in the tropics. J. Plant Nutr. Soil Sci. 2010, 173, 715–726. [Google Scholar] [CrossRef]
  59. Grunwald, D.; Kaiser, M.; Ludwig, B. Effect of biochar and organic fertilizers on C mineralization and macro-aggregate dynamics under different incubation temperatures. Soil Tillage Res. 2016, 164, 11–17. [Google Scholar] [CrossRef]
  60. Yang, Y.; Tilman, D.; Furey, G.; Lehman, C. Soil carbon sequestration acceleration by the restoration of grassland biodiversity. Nat. Commun. 2019, 10, 718. [Google Scholar] [CrossRef] [Green Version]
  61. Miao, F.; Li, Y.; Cui, S.; Jagadamma, S.; Yang, G.; Zhang, Q. Soil extracellular enzyme activities under long-term fertilization management in the croplands of China: A meta-analysis. Nutr. Cycl. Agroecosyst. 2019, 114, 125–138. [Google Scholar] [CrossRef]
  62. Oldfield, E.E.; Bradford, M.A.; Wood, S.A. Global meta-analysis of the relationship between soil organic matter and crop yields. Soil 2019, 5, 15–32. [Google Scholar] [CrossRef] [Green Version]
  63. Ramusseen, P.E.; Smiley, R.W. Long Term Management Effect on Soil Productivity and Crop Yields in Semi-Arid Regions of Oregeon; Station Bulletin 675; Columbia Basin Agricultural Research Center: Pendleton, OR, USA, 1989; p. 57. [Google Scholar]
  64. Mahapatra, B.S.; Sharma, K.C.; Sharma, G.L. Effects of bio-organic and chemical nitrogen on yield and nitrogen uptake of rice and their residual effect on succeeding wheat crop. Indian J. Agron. 1987, 32, 7–11. [Google Scholar]
  65. Tiwari, K.N.; Dev, G.; Sharma, S.; Singh, V.V. Production maximization of rice-wheat sequence in recently reclaimed saline-sodic soils. Better Crop. 1998, 12, 9–11. [Google Scholar]
  66. Satapathy, K.B. Comparative efficiency of blue green algae, Azolla and other biofertilizers on growth of rice. Indian J. Plant Physiol. 1999, 4, 100–104. [Google Scholar]
  67. Shanmugam, P.M.; Veeraputhran, R. Effect of organic manure, biofertilizers, inorganic nitrogen and zinc on growth and yield of rabi rice (Oryzae sativa L.). Madras Agril. J. 2001, 87, 90–93. [Google Scholar]
  68. Chinnusamy, M.; Kaushik, B.D.; Prasanna, R. Growth, nutritional and yield parameters of wetland rice as influenced by microbial constraun under controlled conditions. J. Plant Nutr. 2006, 29, 857–871. [Google Scholar] [CrossRef]
  69. Dixit, K.G.; Gupta, B.R. Effect of farm yard manure, chemical and biofertilizers on yield and quality of rice (Oryzae sativa L.) and soil properties. J. Indian Soc. Soil Sci. 2000, 48, 773–780. [Google Scholar]
  70. Quyen, N.V.; Sharma, S.N. Relative effect of roganic and conventional farming on growth, yield and grain quality of scented rice and soil fertility. Arch. Agron. Soil Sci. 2003, 49, 623–629. [Google Scholar] [CrossRef]
  71. Kumar, N.; Prasad, R.; Zaman, F.U. Relative response of high yielding variety and a hybrid of rice to levels and sources of nitrogen. Proc. Indian Natl. Sci. Acad. 2007, 73, 1. [Google Scholar]
  72. Peng, X.; Yan, X.; Zhou, H.; Zhang, Y.Z.; Sun, H. Assessing the contributions of sesquioxides and soil organic matter to aggregation in an Ultisol under long-term fertilization. Soil Tillage Res. 2015, 146, 89–98. [Google Scholar] [CrossRef]
  73. Six, J.; Paustian, K.; Elliot, E.T.; Combrink, C. Soil structure and organic matter: I. distribution of aggregate size-classes and aggregate-associated carbon. Soil Sci. Soc. Am. J. 2000, 64, 681–689. [Google Scholar] [CrossRef]
  74. Singh, S.; Nouri, A.; Singh, S.; Anapalli, S.; Lee, J.; Arelli, P.; Jagadamma, S. Soil organic carbon and aggregation in response to thirty-nine years of tillage management in the southeastern US. Soil Till. Res. 2020, 197, 104523. [Google Scholar] [CrossRef]
  75. Six, J.A.; Elliott, Ε.Τ.; Paustian, K. Soil macroaggregate turnover and microaggregate formation: A mechanism for C sequestration under no-tillage agriculture. Soil Biol. Biochem. 2000, 32, 2099–2103. [Google Scholar] [CrossRef]
  76. Abiven, S.; Menasseri, S.; Chenu, C. The effects of organic inputs over time on soil aggregate stability—A literature analysis. Soil Biol. Biochem. 2009, 41, 1–12. [Google Scholar] [CrossRef]
  77. Almajmaie, A.; Hardie, M.; Doyle, R.; Birch, C.; Acuna, T. Influence of soil properties on the aggregate stability of cultivated sandy clay loams. J. Soils Sediments 2017, 17, 800–809. [Google Scholar] [CrossRef]
  78. Liang, Q.; Chen, H.; Gong, Y.; Fan, M.; Yang, H.; Lal, R.; Kuzyakov, Y. Effects of 15 years of manure and inorganic fertilizers on soil organic carbon fractions in a wheat-maize system in the North China Plain. Nutr. Cycl. Agroecosyst. 2011, 92, 21–33. [Google Scholar] [CrossRef]
  79. Wright, S.F.; Upadhyaya, A. A survey of soils for aggregate stability and glomalin, a glycoprotein produced by hyphae of arbuscular mycorrhizal fungi. Plant Soil 1998, 198, 97–107. [Google Scholar] [CrossRef]
  80. Rillig, M.C.; Wright, S.F.; Eviner, V.T. The role of arbuscular mycorrhizal fungi and glomalin in soil aggregation: Comparing effects of five plant species. Plant Soil 2002, 238, 325–333. [Google Scholar] [CrossRef]
Figure 1. Fractionation scheme followed for soil aggregate analysis and its associated C. Note: Large macroaggregate (LMA) (>2 mm); Small macroaggregate (SMA) (>0.25 mm) and microaggregate (mA) (0.053–0.25 mm); Silt + clay (CSA) C (<0.053 mm).
Agronomy 13 00039 g001
Figure 2. Relationship between C stability in clay–organic complex (COC) and aggregate-associated C (n = 18; p ≤ 0.05).
Agronomy 13 00039 g002
Figure 3. Relationship between C stability in clay–organic complex (COC) and large macroaggregate (LMA) concentration (n = 18; p ≤ 0.05).
Agronomy 13 00039 g003
Figure 4. Depth-wise distribution of glomalin-related soil protein (GRSP) concentration in (a) macroaggregate (MA) and (b) microaggregate (mA), as affected by long-term organic agriculture. Note: T1, control without fertilization; T2, farmyard manure (FYM); T3, green manure (GM); T4, GM + biofertilizers (BF); T5, FYM +GM; T6, FYM + GM + BF. Letters represent significance of results among different treatments.
Agronomy 13 00039 g004
Figure 5. Cumulative C mineralization (Cmin) (mg/g soil) at 0–15, 15–30 and 30–60 cm soil depths, as influenced by long-term organic manure. Note: T1, control without fertilization; T2, farmyard manure (FYM); T3, green manure (GM); T4, GM + biofertilizers (BF); T5, FYM + GM; T6, FYM + GM + BF.
Agronomy 13 00039 g005
Figure 6. Effect of organic amendments on rice equivalent yield (REY). Note: T1, control without fertilization; T2, farmyard manure (FYM); T3, green manure (GM); T4, GM + biofertilizers (BF); T5, FYM + GM; T6, FYM + GM + BF. Letters represent significance of results among different treatments.
Agronomy 13 00039 g006
Table 1. Effect of different organic amendments on the stability of clay–humus at 0–15, 15–30 and 30–60 cm soil depths under rice–wheat cropping system (k = humus desorption rate constant; while (1/k) = stability in hour (h)).
TreatmentkStability
(1/k) in h
kStability
(1/k) in h
kStability
(1/k) in h
0–15 cm15–30 cm30–60 cm
T10.334 a2.99 d0.613 a1.63 f0.753 a1.33 f
T20.146 b6.85 c0.367 c2.72 d0.404 d2.48 c
T30.092 c10.86 b0.529 b1.89 e0.569 b1.76 e
T40.089 c11.24 b0.312 d3.20 c0.498 c2.00 d
T50.087 c11.49 b0.274 e3.65 b0.297 e3.37 b
T60.076 d13.16 a0.172 f5.81 a0.178 f6.62 a
Columns with different lower-case letters in each depth are significantly different at p = 0.05 according to Duncan’s multiple-range test. Note: T1, control without fertilization; T2, farmyard manure (FYM); T3, green manure (GM); T4, GM + biofertilizers (BF); T5, FYM +GM; T6, FYM + GM + BF. Letters represent significance of results among different treatments.
Table 2. Effect of organic amendments on percentage of aggregates at 0–15, 15–30 and 30–60 cm soil depths for different sieve size fractions under rice–wheat cropping system. § Columns with different lower-case letters in each depth are significantly different at p = 0.05 according to Duncan’s multiple-range test.
TreatmentAggregate (%) in 0–15 cm Soil LayerAggregate (%) in 15–30 cm Soil LayerAggregate (%) in 30–60 cm Soil Layer
LMA
(>2 mm)
SMA
(2–0.25 mm)
mA
(0.25–0.053 mm)
CSA
(<0.053 mm)
LMA
(>2 mm)
SMA
(2–0.25 mm)
mA
(0.25–0.053 mm)
CSA
(<0.053 mm)
LMA
(>2 mm)
SMA
(2–0.25 mm)
mA
(0.25–0.053 mm)
CSA
(<0.053 mm)
T118.96 b40.49 a36.02 a3.85 c6.19 c50.17 c38.42 a5.02 cd0.59 ab44.66 b51.55 a2.59 c
T234.80 a29.27 e30.88 ab4.57 c5.21 d45.30 cd40.40 a8.72 a0.30 bc49.98 ab43.38 bc5.58 b
T319.24 b35.37 b35.70 a9.49 a10.08 a41.90 d41.91 a5.66 bc0.28 c49.83 ab39.93 c9.57 a
T436.44 a34.81 bc26.60 bc1.48 d2.94 e59.43 b32.28 b4.80 d0.33 abc48.26 ab47.65 ab3.28 c
T536.17 a32.37 cd27.45 bc3.54 c6.80 bc57.16 b29.57 b6.00 b0.60 a50.61 ab45.25 bc3.31 c
T638.04 a29.85 de24.72 c7.00 b7.17 b65.17 a22.67 c4.52 d0.35 abc51.76 a41.75 bc5.69 b
Note: LMA, Large macroaggregate; SMA, Small macroaggregate; mA, Microaggregate; T1, control without fertilization; T2, farmyard manure (FYM); T3, green manure (GM); T4, GM + biofertilizers (BF); T5, FYM +GM; T6, FYM + GM + BF. Letters represent significance of results among different treatments.
Table 3. Effect of organic manures and biofertilizers on aggregate-associated C for large macroaggregate (LMA, >2 mm), small macroaggregate (SMA, 2.0–0.25 mm), microaggregate (mA, 0.25–0.053 mm) and (silt + clay) CSA sieve under rice–wheat cropping system.
TreatmentAggregate-Associated C (g kg−1)
LMA
>2 mm Sieve Fraction
SMA
(2–0.25) mm
Sieve Fraction
mA
(0.25–0.053) mm
Sieve Fraction
CSA Fraction
<0.053 mm
0–15 cm15–30 cm30–60 cm0–15 cm15–30 cm30–60 cm0–15 cm15–30 cm30–60 cm0–15 cm15–30 cm30–60 cm
T18.32 b§5.51 bc2.52 b8.85 c4.32 a1.86 a6.62 b3.67 a1.27 b4.12 c5.89 a2.92 bc
T29.14 a6.29 a2.10 b9.36 abc4.84 a2.03 a8.70 a2.99 ab1.54 ab9.25 ab6.13 a3.07 bc
T38.79 ab5.22 cd3.47 b9.42 abc4.86 a2.53 a7.55 b3.11 ab1.85 a9.74 ab7.62 a4.42 ab
T48.31 b5.04 cd4.97 ab9.09 bc5.36 a2.59 a7.43 b3.25 ab1.72 ab7.94 b5.16 a2.52 c
T58.36 ab4.69 d4.88 ab9.80 ab4.30 a2.93 a7.80 ab2.79 b1.87 a8.45 b6.27 a3.85 abc
T68.88 ab6.13 ab7.43 a10.10 a5.15 a1.81 a6.97 b3.22 ab1.43 ab12.21 a5.89 a4.62 a
§ Columns with different lower-case letters in each depth are significantly different at p = 0.05 according to Duncan’s multiple-range test. Note: LMA, Large macroaggregate; SMA, Small macroaggregate; mA, Microaggregate; T1, control without fertilization; T2, farmyard manure (FYM); T3, green manure (GM); T4, GM + biofertilizers (BF); T5, FYM + GM; T6, FYM + GM + BF. Letters represent significance of results among different treatments.
Table 4. Effect of organic manures and biofertilizers on total soil C (TSOC), particulate organic C (POC), dissolved organic C (DOC) and KMnO4 oxidizable C (POXC) at 0–15, 15–30 and 30–60 cm soil depth under rice–wheat cropping system.
TrTSOC
(g kg−1)
POC
(g kg−1)
DOC
(mg kg−1)
POXC
(mg kg−1)
TSOC
(g kg−1)
POC
(g kg−1)
DOC
(mg kg−1)
POXC
(mg kg−1)
TSOC
(g kg−1)
POC
(g kg−1)
DOC
(mg kg−1)
POXC
(mg kg−1)
0–15 cm15–30 cm30–60 cm
T17.68 c§2.49 c§62.9 e§359 c§2.58 a§0.80 c§42.7 c§220 a§0.79 b§0.25 ab§27.7 e §155 c§
T29.36 b2.83 c74.5 cd470 a2.65 a1.11 bc46.8 c189 a1.59 a0.24 ab32.8 d161 bc
T38.15 c3.57 b69.4 d412 abc3.13 a1.17 ab45.8 c236 a0.82 b0.40 a30.1 e155 c
T49.4 b2.80 c77.3 c460 ab2.85 a1.18 ab54.0 b234 a1.42 a0.29 ab35.9 c182 a
T510.5 a3.58 b83.8 b400 bc3.48 a0.82 c57.8 b149 a1.59 a0.43 a39.3 b167 abc
T610.5 a4.26 a94.4 a450 ab3.51 a1.42 a62.9 a207 a1.60 a0.18 b43.1 a175 ab
§ Columns with different lower-case letters are significant according to Duncan’s multiple-range test (p = 0.05). Note: Tr, treatment; T1, control without fertilization; T2, farmyard manure (FYM); T3, green manure (GM); T4, GM + biofertilizers (BF); T5, FYM + GM; T6, FYM + GM + BF. Letters represent significance of results among different treatments.
Table 5. Inter-relationships among different SOC fractions, aggregate-associated C, glomalin-related soil protein (GRSP) and rice equivalent yield (REY).
TraitCOCTSOCPOCDOCPOXCCminGRSP_
MA
GRSP_
mA
LMA_
C
SMA_
C
mA_
C
<C_
0.053
REY
COC1
TSOC 0.83 **1
OC 0.85 **0.97 **1
DOC 0.87 **0.92 **0.94 **1
POXC0.80 **0.97 **0.94 **0.88 **1
Cmin0.56 *0.79 **0.72 **0.73 **0.76 **1
GRSP_MA0.56 *0.240.330.370.22−0.051
GRSP_mA0.06−0.060.140.16−0.170.120.111
LMA_C0.77 **0.86 **0.84 **0.85 **0.86 **0.69 **0.28−0.201
SMA_C0.77 **0.98 **0.97 **0.93 **0.95 **0.79 **0.180.010.86 **1
mA_C0.75 **0.98 **0.94 **0.89 **0.97 **.81 **0.13−0.090.86 **0.98 **1
<0.053_C0.80 **0.80 **0.86 **0.86 **0.79 **0.63 **0.250.070.74 **0.81 **0.78 **1
EY0.93 **0.70 **0.73 **0.71 **0.56 *−0.150.68 **0.87 **0.200.59 **0.260.73 **1
Note: * p ≤ 0.05, ** p ≤ 0.01. Carbon stability in clay–organic complex (COC), Total soil organic C (TSOC), Particulate organic C (POC), Dissolved organic C (DOC), KMnO4 oxidizable C (POXC), Mineralized C (Cmin), Glomalin in macroaggregates (GRSP_MA), Glomalin in microaggregates (GRSP_mA), Large-macroaggregate-associated C (LMA_C), Small-macroaggregate-associated C (SMA_C), Microaggregate-associated C (mA_C), Less than 53 micrometer fraction associated C (<0.053_C), Rice equivalent yield (REY).
Disclaimer/Publisher’s Note: The statements, opinions and data contained in all publications are solely those of the individual author(s) and contributor(s) and not of MDPI and/or the editor(s). MDPI and/or the editor(s) disclaim responsibility for any injury to people or property resulting from any ideas, methods, instructions or products referred to in the content.

