Article

A Decade of Climate-Smart Agriculture in Major Agri-Food Systems: Earthworm Abundance and Soil Physico-Biochemical Properties

1
ICAR-Central Soil Salinity Research Institute (CSSRI), Karnal 132001, India
2
College of Agriculture, CCS Haryana Agricultural University, Hisar 125004, India
3
College of Agriculture and Life Sciences, Cornell University, Ithaca, NY 14853, USA
4
International Maize & Wheat Improvement Centre (CIMMYT), New Delhi 110012, India
5
Faculty of Agriculture, Damanhour University, Damanhour 22516, Egypt
*
Authors to whom correspondence should be addressed.
Agronomy 2022, 12(3), 658; https://doi.org/10.3390/agronomy12030658
Submission received: 27 January 2022 / Revised: 3 March 2022 / Accepted: 4 March 2022 / Published: 9 March 2022
(This article belongs to the Special Issue Effects of Tillage, Cover Crop and Crop Rotation on Soil)

Abstract

:
Earthworms (EWs) could be a viable indicator of soil biology and agri-food system management. The influence of climate-smart agriculture (CSA)-based sustainable intensification practices (zero tillage, crop rotations, crop residue retention, and precision water and nutrients application) on earthworms’ (EWs) populations and soil physico-biochemical properties of rice-wheat cropping system in the Indo-Gangetic plains of South Asia was investigated. This study investigates the effect of 10-years adoption of various CSA practices on the abundance of earthworms and physical and biochemical properties of the soil and EWs’ casts (EWC). Five scenarios (Sc) were included: conventionally managed rice-wheat system (farmers’ practices, Sc1), CSA-based rice-wheat-mungbean system with flood irrigation (FI) (Sc2) and subsurface drip irrigation (SDI) (Sc3), CSA-based maize-wheat-mungbean system with FI (Sc4), and SDI (Sc5). Results revealed that EWs were absent under Sc1, while the 10-year adoption of CSA-based scenarios (mean of Sc2–5) increased EWs’ density and biomass to be 257.7 no. m−2 and 36.05 g m−2, respectively. CSA-based maize scenarios (Sc4 and Sc5) attained higher EWs’ density and biomass over rice-based CSA scenarios (Sc2 and Sc4). Also, SDI-based scenarios (Sc3 and Sc5) recorded higher EWs’ density and biomass over FI (Sc2 and Sc4). Maize-based CSA with SDI recorded the highest EWs’ density and EWs’ biomass. The higher total organic carbon in EWC (1.91%) than in the bulk soil of CSA-based scenarios (0.98%) and farmers’ practices (0.65%) suggests the shift of crop residue to a stable SOC (in EWC). EWC contained significant amounts of C and available NPK under CSA practices, which were nil under Sc1. All CSA-based scenarios attained higher enzymes activities over Sc1. CSA-based scenarios, in particular, maize-based scenarios using SDI, improved EWs’ proliferation, SOC, and nutrients storage (in soil and EWC) and showed a better choice for the IGP farmers with respect to C sequestration, soil quality, and nutrient availability.

Graphical Abstract

1. Introduction

The rice-wheat (RW) cropping system dominates in the Indo-Gangetic Plains (IGP) of South Asia covering an area of 13.5 Mha [1]. Besides being high water, energy, labor, and fertilizers demanding cropping system, burning crop residues, and intensive tillage practices contributed to soil degradation [2,3,4,5]. Consequently, the sustainability of the RW cropping system in the IGP of South Asia is under threat [6], promoting the need for better agri-food systems management practices [7]. Climate-smart agriculture (CSA) practices could enhance soil properties through the adoption of zero tillage (ZT), crop residue retention (CRR), and crop diversification [8,9,10] with best-fit crop management technologies [5,11,12,13]. Despite the positive impacts of CSA practices on cropping system productivity, profitability, and resource use efficiency in the IGP of India, little information is available about the combined effects of CSA practices on the abundance of earthworms (EWs) and soil physico-biochemical properties.
Conventional farming practices not only influence soil physico-biochemical properties but also intensively reduce the population, diversity, and activity of soil fauna [4,14]. The protection of soil fauna has a key role in soil management that determines soil quality [15]. Among organisms, soil properties are more amplified by EWs’ abundance and activity than other soil fauna [16]. EWs’ abundance was found to influence soil biophysical properties [17], crop productivity [18], and agroecosystem health [19]. EWs’ feeding, burrowing, and casting activities impact OM distribution and dynamics [20], soil structure formation, aggregate stability, and soil porosity [21,22], nutrient availability and cycling [18,20,23], water infiltration [24], and microbial activity [25], thereby crop growth and productivity [18,23]. Consequently, due to the numerous ecosystem services that EWs provide, it was identified as ecosystem engineers [26,27] that could act as a bioindicator of land use and management [20,28].
In general, EWs’ density, diversity, and biomass in arable lands are lesser compared to gardens [14,29], organic farming [30], and integrated farming [28]. Several meta-analyses [22,30] and reviews [23,31] concluded that tillage reduces EWs’ abundance. Moreover, EWs’ abundance and diversity are influenced by crop residues amount and type [15,19,29] and cropping rotation [20]. Indeed, numerous studies have shown that CRR, ZT, and crop diversity positively affect EWs’ population [24,27,32]. However, the layering of such practices on EWs’ abundance in intensively irrigated rice-wheat cropping systems is limited.
Soil biological properties, carbon mineralization, and nutrient release are strongly related. Earthworms primarily decompose low-quality OM to a nutrient-rich product by establishing a mutualistic relationship with soil microflora [32]. Accordingly, changes in EWs’ density and activity could be manifested by increased nutrient levels and enzyme activities [14]. Enzymes, proteins produced by plant roots, soil microbiota, and fauna to hydrolyze SOM, are responsive to the soil management practices, e.g., tillage, cropping diversity, residue, and nutrient management [4,33,34,35]. Due to their relationship with soil biology, soil enzymes have been described as “biological fingerprints”, considered key soil quality indicators [36] that catalyze various reactions for OM decomposition, and OM- and nutrient cycling [37,38]. For example, phosphatases play roles in the organic Phosphorus (P) bioavailability [39], while dehydrogenase (DHA) plays a role in the oxidation of SOM by shifting organic H to inorganic acceptors [40]. In brief, DHA activity reflects a good picture of the overall soil microbial activities, thus it is a viable soil health indicator [41]. Hence, the effect of CSA and EWs’ activity might be reflected by nutrient levels and enzyme activities in both bulk soil and EWs’ casts (EWC).
The nature of retained crop residues and EWs’ abundance has produced contradictory results. While OM supply usually increases EWs’ populations [42], Bamminger et al., [43] found no effect. Additionally, not always the adoption of sustainably managed systems promotes EWs’ abundance [22,44]. More importantly, the effect of EWs on SOC is found ambiguous [45], as EWs influence SOC in two different directions [46]. EWs could accelerate crop residues decomposition by promoting microbial activity [33,47]. However, EWs’ activity could increase SOC levels by boosting the formation of stable aggregates that protect the SOC against microbial attack [48,49] and by stabilizing the newly added OM in their casts, thus aiding soil C storage in the long term [25,46,48,50]. Therefore, the impact of retaining various crop residues under conservative managed systems on the EWs’ abundance and their impact on SOC sequestration and soil quality in the IGP is important in light of global warming.
In northern India, studies revealed the anthropogenic pressure on EWs’ communities in arable lands [4,28,29]. Despite researchers confirming the ultimate beneficial effects of CSA in the IGP of India, little information is available about the effects of various CSA practices on the EWs’ density and biomass. We hypothesize that CSA-based sustainable intensification practices (zero tillage, crop rotations, crop residue retention, and precision water and nutrients application) would augment EWs’ populations that could enhance soil physico-biochemical properties than conventional practices, which could vary as per the cropping system management practices. In the present study, after a decade of adopting various CSA practices, we measured EWs’ density and biomass in two soil layers (0–15 and 15–30 cm), as well the soil physical properties and the biochemical properties of both the bulk soil and EWs’ casts. The CSA practices were compared with farmers’ practices. CSA practices involved tillage (zero tillage Vs intensive tillage), crop rotations (maize-wheat vs rice-wheat), crop residue management (retention Vs removal), and water and nutrients application (precision application via subsurface irrigation vs flood irrigation). The effect of different management practices and their linear contrast on the above-mentioned parameters were analyzed. The results of these studies could help in designing a better cropping system with the best CSA practices that could show a better choice for the IGP farmers with respect to EWs’ proliferation, C sequestration, nutrients storage, and availability, and soil physical and biological properties.

2. Materials and Methods

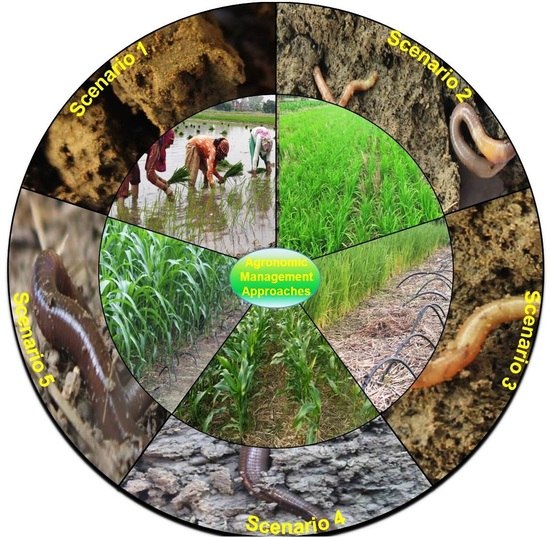
2.1. Experimental Site Description

The experiment was conducted at the Indian Council of Agricultural Research (ICAR), Central Soil Salinity Research Institute (CSSRI), Karnal (29°42″20.7′ N latitude, 76°57″19.79′ E longitude, 243 m elevation), India. This area is typically known for the rice-wheat (RW) system. The climate of the region is semi-arid subtropical with an average rainfall of 670 mm annually, of which ~80% is distributed mainly from June to September (monsoon season). The climate is characterized by three distinctive seasons, i.e., wet-Kharif (July–October), dry-Rabi (November–March), and summer-Zaid (April–June). The soil of the experimental site is silty loam in texture (34.0% sand, 46.0% silt, and 20.0% clay), slightly alkaline (pH of 8.0), and poor in organic carbon content (0.45%).

2.2. Experimental Design and Treatment Details

This study included five treatments (hereinafter named scenarios) consisting of two cropping systems (rice-wheat and maize-wheat) with combinations of tillage, residue management, crop establishment, mungbean integration, and water management practices (Table 1). The treatments were designated as scenarios by keeping in view present management practices, as well as future drivers of agricultural changes in the region. Before initiating the experiment, the experimental site was under a conventionally managed rice-wheat system. The experiment began in 2009 and was laid out in a randomized complete block design and replicated thrice in 20 m × 50 m plot size. The five scenarios (Sc) were: conventional tillage (CT)-puddled transplanted rice (PTR) -CT wheat with flood irrigation (FI) (Sc1; farmers’ practice); ZT direct-seeded rice (DSR) -ZT wheat -ZT mungbean with FI (Sc2); ZT DSR -ZT wheat -ZT mungbean with subsurface drip irrigation (SDI) (Sc3); ZT maize -ZT wheat -ZT mungbean with FI (Sc4) and ZT Maize -ZT Wheat -ZT mungbean with SDI (Sc5). Details of all CSA-based management scenarios comprised of crop rotation, tillage, crop establishment, and residue and water management are given in Table 1. In all the scenarios, similar management practices were followed across the years. A sampling of soil and EWs was carried out during the year 2019 (after 10 years of adopting CSA practices).

2.3. Crop Residue Management and Estimation of Recycled Residues

All crop residues were removed in farmers’ practice (Sc1) from the ground level. However, in rice-based CSA scenarios (Sc2 and Sc3), all rice and mungbean residues and anchored wheat residues were retained on the soil surface. In maize-based CAS scenarios (Sc4 and Sc5), partial (~65%) maize residues and anchored wheat stubbles were retained at the soil surface. To assess the amount of crop residue recycled in each scenario, five rows with a length of 1.0 m were sampled from three locations in each plot after the harvest of each crop. The residues were cut from the soil surface, oven-dried, and expressed on a dry weight basis per hectare. The average residue load varied from 7.36–7.75 Mg ha−1 for rice, 9.52–9.88 Mg ha−1 for maize, 1.85–1.97 Mg ha−1 for wheat, and 2.95–3.30 Mg ha−1 for mungbean over the years. Annual average crop residues of 12.29, 12.39, 14.78, and 14.33 Mg ha−1 were retained on the soil surface for Scenario 2, 3, 4, and 5, respectively. The C/N ratio of rice and maize was 58–65 and 43–50, respectively, and for wheat and mungbean, 50–56 and 20–30, respectively.

2.4. Irrigation Management

In Sc1 (farmers’ practice), conventional irrigation practices were applied; for CT-PTR, flood irrigation (FI) of ~5 cm depth for one month followed by irrigation applied at the hair-line crack, while needs-based FI was applied for wheat (Table 1). In CSA-based scenarios, irrespective of the irrigation system (e.g., FI for Sc2 and Sc4 and SDI for Sc3 and Sc5), irrigation was based on a soil matric potential (SMP) of −20 to −30 kPa for rice and −40 to −50 kPa for maize throughout the season. The only exception is rice in Sc2, in which the soil was kept wet for the first 20 days to ensure good germination and establishment (Table 1). However, in the case of mungbean, needs-based irrigation was applied. Within each plot, a soil tensiometer “gauge-type” (IRROMETER, Riverside, California) was installed to monitor SMP. The ceramic cups were placed at 15 cm depth, ensuring good contact between the ceramic tip and the surrounding soil. The subsurface drip irrigation (SDI) system was installed; polyvinyl chloride pipes having an inside diameter of 90 and 63 mm for mains and sub mains, respectively. The laterals were placed at depth of 20 cm using tractor operated drip laying machine. Dripping lines (16 mm in diameter) were laid down along the rows at 20 cm depth with in-line emitters with a flow rate of 2.0 L h−1 and located 30 cm apart and the distance between dripping lines was 67.5 cm.

2.5. Crop Management

In Sc1 (farmers’ practice), both rice and wheat were cultivated as common farmers’ practices in northwest India. The tillage operations in conventional till puddled transplanted rice (CT-PTR) comprised of two passes of harrow, one pass of rotavator, and two passes of puddle harrow followed by planking. Twenty-five-days-old rice seedlings were manually transplanted in a random geometry (20 cm × 15 cm) in puddled fields. In CT wheat, preparatory tillage included two passes each of harrowing, and two cultivators then wheat seeds were manually broadcasted and followed by planking. In CSA scenarios (Sc2–5), under ZT, all crops (rice, wheat, mungbean) except maize were planted with a row spacing of 22.5 cm using Happy Seeder; while maize was seeded at a row spacing of 67.5 cm. For CT (PTR) and DSR rice, a seed rate of 10 and 20 kg ha−1 were used, respectively. For maize, wheat, and mungbean, a seed rate of 100, 20, and 20 kg ha−1 was used, respectively. The best management practices were followed for weed, insect, pest, and disease management as per the recommendations of Punjabi Agricultural University.

2.6. Soil Physical Analysis

Soil bulk density was measured following the core method [51]. The soil penetration resistance was measured using a manual cone penetrometer (Eijkelkamp Agrisearch Equipment, Germany) at a 5 cm interval to a depth of 0–30 cm. The infiltration rate (IR) was determined using a double-ring infiltrometer as described by Gathala et al. [52]. The mean weight diameter (MWD) of water-stable soil aggregates was determined using the wet sieving method [53]. An air-dry soil sample of 100 g was passed through an 8 mm sieve and transferred in a set of sieves with diameters of 4, 2, 1, 0.5, 0.25, and 0.125 mm. After which, sieves (including the soil) were soaked for 10 min for capillary rewetting, followed by 10 min of shaking in a water drum with an oscillation frequency of 30 cycles min−1 and an amplitude of 3 cm, resulting in distinct aggregate class diameters, i.e., 0–0.125, 0.125–0.25, 0.25–0.5, 0.5–1, 1–2, 2–4 and 4–8 mm. The aggregates that remained in each class were collected and oven-dried at 65–70 °C until a constant weight was recorded. The aggregates MWD was calculated according to Kemper and Rosenau [54] using the following equation.
M W D   ( m m ) = i = 1 n ( x i   w i ) 2 i = 1 n w i
where, n is the number of fractions (0.1–0.25, 0.25–0.5, 0.5–1.0, 1.0–2.0, 2.0–4 and 4–8 mm), xi is the mean diameter (mm) of the sieve size class (0.175, 0.375, 0.75, 1.5 and 2.0, 3, and 6 mm), and wi is the weight of soil (g) retained on each sieve.

2.7. Earthworms’ Sampling

Sampling was performed for EWs in the morning (during their active period) [29] during mid-September 2019, using the digging and hand sorting method for two soil depths, i.e., 0–15 and 15–30 cm, from each replicate with three grid points. Soil blocks (0.25 cm × 25 cm × 15 cm) were removed from each plot. Similarly, soil blocks at a depth of 15–30 cm were sampled [55]. Soil blocks were bagged and directly moved to the laboratory and hand sorted. EWs were sorted into three categories based on their length, e.g., small (<20 mm), medium (20–40 mm), and large (>40 mm). The fresh biomass (g m−2) and density (No. m−2) were determined for each size category.

2.8. Sampling and Analysis of Soil Bulk and Earthworms’ Casts (EWC)

Soil samples were collected (mid-September 2019) from each plot with three grid points from 0–15 cm depth using an auger with an internal diameter of 5 cm from each replicate. The activity of EWs is usually higher at night and therefore EWC was collected from the upper soil surface within a sampling area of 25 cm × 25 cm early in the morning using a brush and a small spoon [14]. Part of the fresh soil and EWC samples were kept (separately) in a refrigerator at 4 °C till the analysis of enzyme activities, i.e., dehydrogenase activity (DHA), alkaline phosphatase activity (ALP), and acid phosphatase activity (ACP). The other part of soil and EWC samples were air-dried, ground, sieved through a 2 mm sieve, and stored in a plastic jar for laboratory analysis of selected chemical properties.
Soil and EWC were analyzed for electrical conductivity (EC), pH, total organic carbon (TOC), available N, P, and K, and enzymes (DHA, ALP, and ACP). EC and pH were determined in soil water extract (1 soil: 2 water) following the methods of Jakson [56]. The TOC content was determined using the wet oxidation method [57]. Available N was determined by the alkaline permanganate method [58]. Available P was determined by the ascorbic acid reductant method of Olsen et al. [59]. Available K was measured by flame photometer using neutral 1 N ammonium acetate extractant as described by Jackson [56]. Enzymes (DHA, ALP, and ACP) activities were estimated as described by Dick et al. [37].

2.9. Data Analysis

Data on earthworm population density, biomass weight, chemical properties of EWC, and soil had a greater coefficient of variation than 20%, and hence were transformed through a square-root ( x + 0.5 ) method [60].
The data were subjected to ANOVA (analysis of variance) using a one-way completely randomized design in the Glmmix procedure in SAS 9.1. The significant effect was determined at a significance level of 5% (p ≤ 0.05) and was compared according to Fisher’s least significant difference (LSD). Principal component analysis (PCA) and correlation matrix were carried out using the R package GEA-R. The results were submitted to PCA to determine the common relationships between parameters.

3. Results

3.1. Earthworm Density and Biomass

For All CSA-based scenarios (Sc2–5), EWs’ density and biomass of the three size categories (small, medium, and large) were higher in the surface soil layer (0–15 cm), compared to the subsurface soil layer (15–30 cm) (Table 2). However, for farmers’ practices (Sc1), EWs’ density and biomass were nil across the tested soil depths. For the two tested soil layers, all CSA-based scenarios had a significantly (p ≤ 0.05) higher total EWs’ density and biomass compared with Sc1 (farmers’ practices) and the increase varied with different crop-based scenarios. Across the two soil layers, CSA-based maize scenarios (Sc4 and Sc5) did not significantly (p ≤ 0.05) differ in EWs’ density and biomass (across all size categories) (Table 2). Similarly, CSA rice-based scenarios (Sc2 and Sc3) did not significantly (p ≤ 0.05) differ in EWs’ density and biomass across all size categories. The only exception is the medium size (20–40 mm), only in 15–30 cm soil depth, in which an EW density of Sc3 was significantly (p ≤ 0.05) higher than Sc2. In the top 15 cm soil depth, Sc5 recorded maximum EWs’ density and biomass across all size categories, in which total EWs’ density and biomass were 257.7 indv. m−2 and 36.05 g m−2, respectively, instead of nil under Sc1. However, in sub-surface soil depth (15–30 cm), maximum EWs’ density and biomass were recorded for Sc4 that was at par with Sc5.
Total EWs’ density and biomass were significantly (p ≤ 0.01) higher in maize-based CSA scenarios (Sc4 and Sc5) than rice-based CSA scenarios (Sc2 and Sc3), in particular for the surface soil layer (Table 2). Maize-based CSA scenarios (Sc4 and Sc5) recorded higher total EWs’ density and biomass by 76.3, 240.0% and 56.0 and 52.0%, respectively, over rice-based CSA scenarios (Sc2 and Sc3), for the surface and subsurface soil layers, respectively, irrespective of system management (tillage, irrigation, and CRR). Similarly, precise water and N management through SDI (Sc3 and Sc5) recorded significantly (p ≤ 0.05) higher EWs’ density (p ≤ 0.05) and biomass (p ≤ 0.01) by 25.0 and 39.12%, respectively, relative to flood irrigation (FI)-based scenarios (Sc2 and Sc4) for the surface soil layer, irrespective of the cropping system. In the sub-surface soil depth, no differences were observed due to the irrigation system. Within the CSA rice-based scenarios, the SDI-irrigated rice (Sc3) recorded a significantly (p ≤ 0.05) higher EWs’ density and biomass by 5.86% and 48.48%, respectively over FI-irrigated rice (Sc2) for the 0–15 cm soil depth. Similarly, within maize-based scenarios, the SDI-irrigated maize (Sc5) recorded significantly (p ≤ 0.01) higher EWs’ density and biomass by 37.5 and 36.5%, respectively, over FI-irrigated maize (Sc4) for the 0–15 cm depth.

3.2. Soil Physical Properties

3.2.1. Bulk Density (BD)

The CSA practices significantly (p ≤ 0.05) affected soil BD, which ranged from 1.4 Mg m−3 (Sc5) to 1.54 Mg m−3 (Sc1) (Figure 1). Soil BD of farmers’ practices scenario was 7.8% higher than the CSA-based scenarios (Sc2–5). Full CSA-based scenarios did not significantly (p ≤ 0.05) differ in BD (Figure 1). However, maize-based CSA scenarios (Sc4 and Sc5) had significantly (p ≤ 0.05) lower BD compared to Sc1; while rice-based CSA scenarios (Sc2 and Sc3), did not significantly (p ≤ 0.05) differ from Sc1. Compared to Sc1, CSA-based maize and rice scenarios significantly (p ≤ 0.05) decreased BD by 9.7 and 5.2%, respectively, irrespective of crop management practices. Interestingly, the effect of the irrigation system on soil BD was minimal, in which both SDI-based scenarios (Sc3 and Sc5) and FI-based scenarios (Sc2 and Sc4) showed similar BD.

3.2.2. Infiltration Rate

The infiltration rate (IR) of all CSA-based scenarios (Sc2–5) was significantly (p ≤ 0.05) higher than Sc1 (Figure 1). No significant (p ≤ 0.05) differences in IR were observed among CSA-based scenarios (Sc2–5). Irrespective of crop type and management, IR of CSA was 3.5 and 3.0 times over Sc1 for rice-based CSA scenarios and maize-based CSA scenarios, respectively. On a system basis, rice-based CSA scenarios significantly (p ≤ 0.05) increased the IR rate by 15.4% compared to maize-based CSA scenarios, irrespective of the irrigation system. The IR of SDI-based scenarios (Sc3 and Sc5) was significantly (p ≤ 0.05) higher than FI-based scenarios (Sc2 and Sc4) by 3.8%.

3.2.3. Mean Weight Diameter (MWD) of Soil Aggregates

The CSA-based scenario did not significantly (p ≤ 0.05) differ in the MWD and was significantly higher than farmer practice (Sc1). The CSA-based scenario (average of Sc2–5) increased MWD significantly (p ≤ 0.05) by 159%, irrespective of crop type and management practices (Figure 1). Summing the data over the cropping system, the results revealed that maize-based CSA scenarios showed statistically similar MWD to those recorded for rice-based CSA scenarios, irrespective of crop management (tillage, irrigation, and CRR). While SDI-based CSA scenarios (Sc3 and Sc5) increased the MWD significantly (p ≤ 0.05) by 6.5% over SDI-based CSA scenarios (Sc2 and Sc4), irrespective of the cropping system.

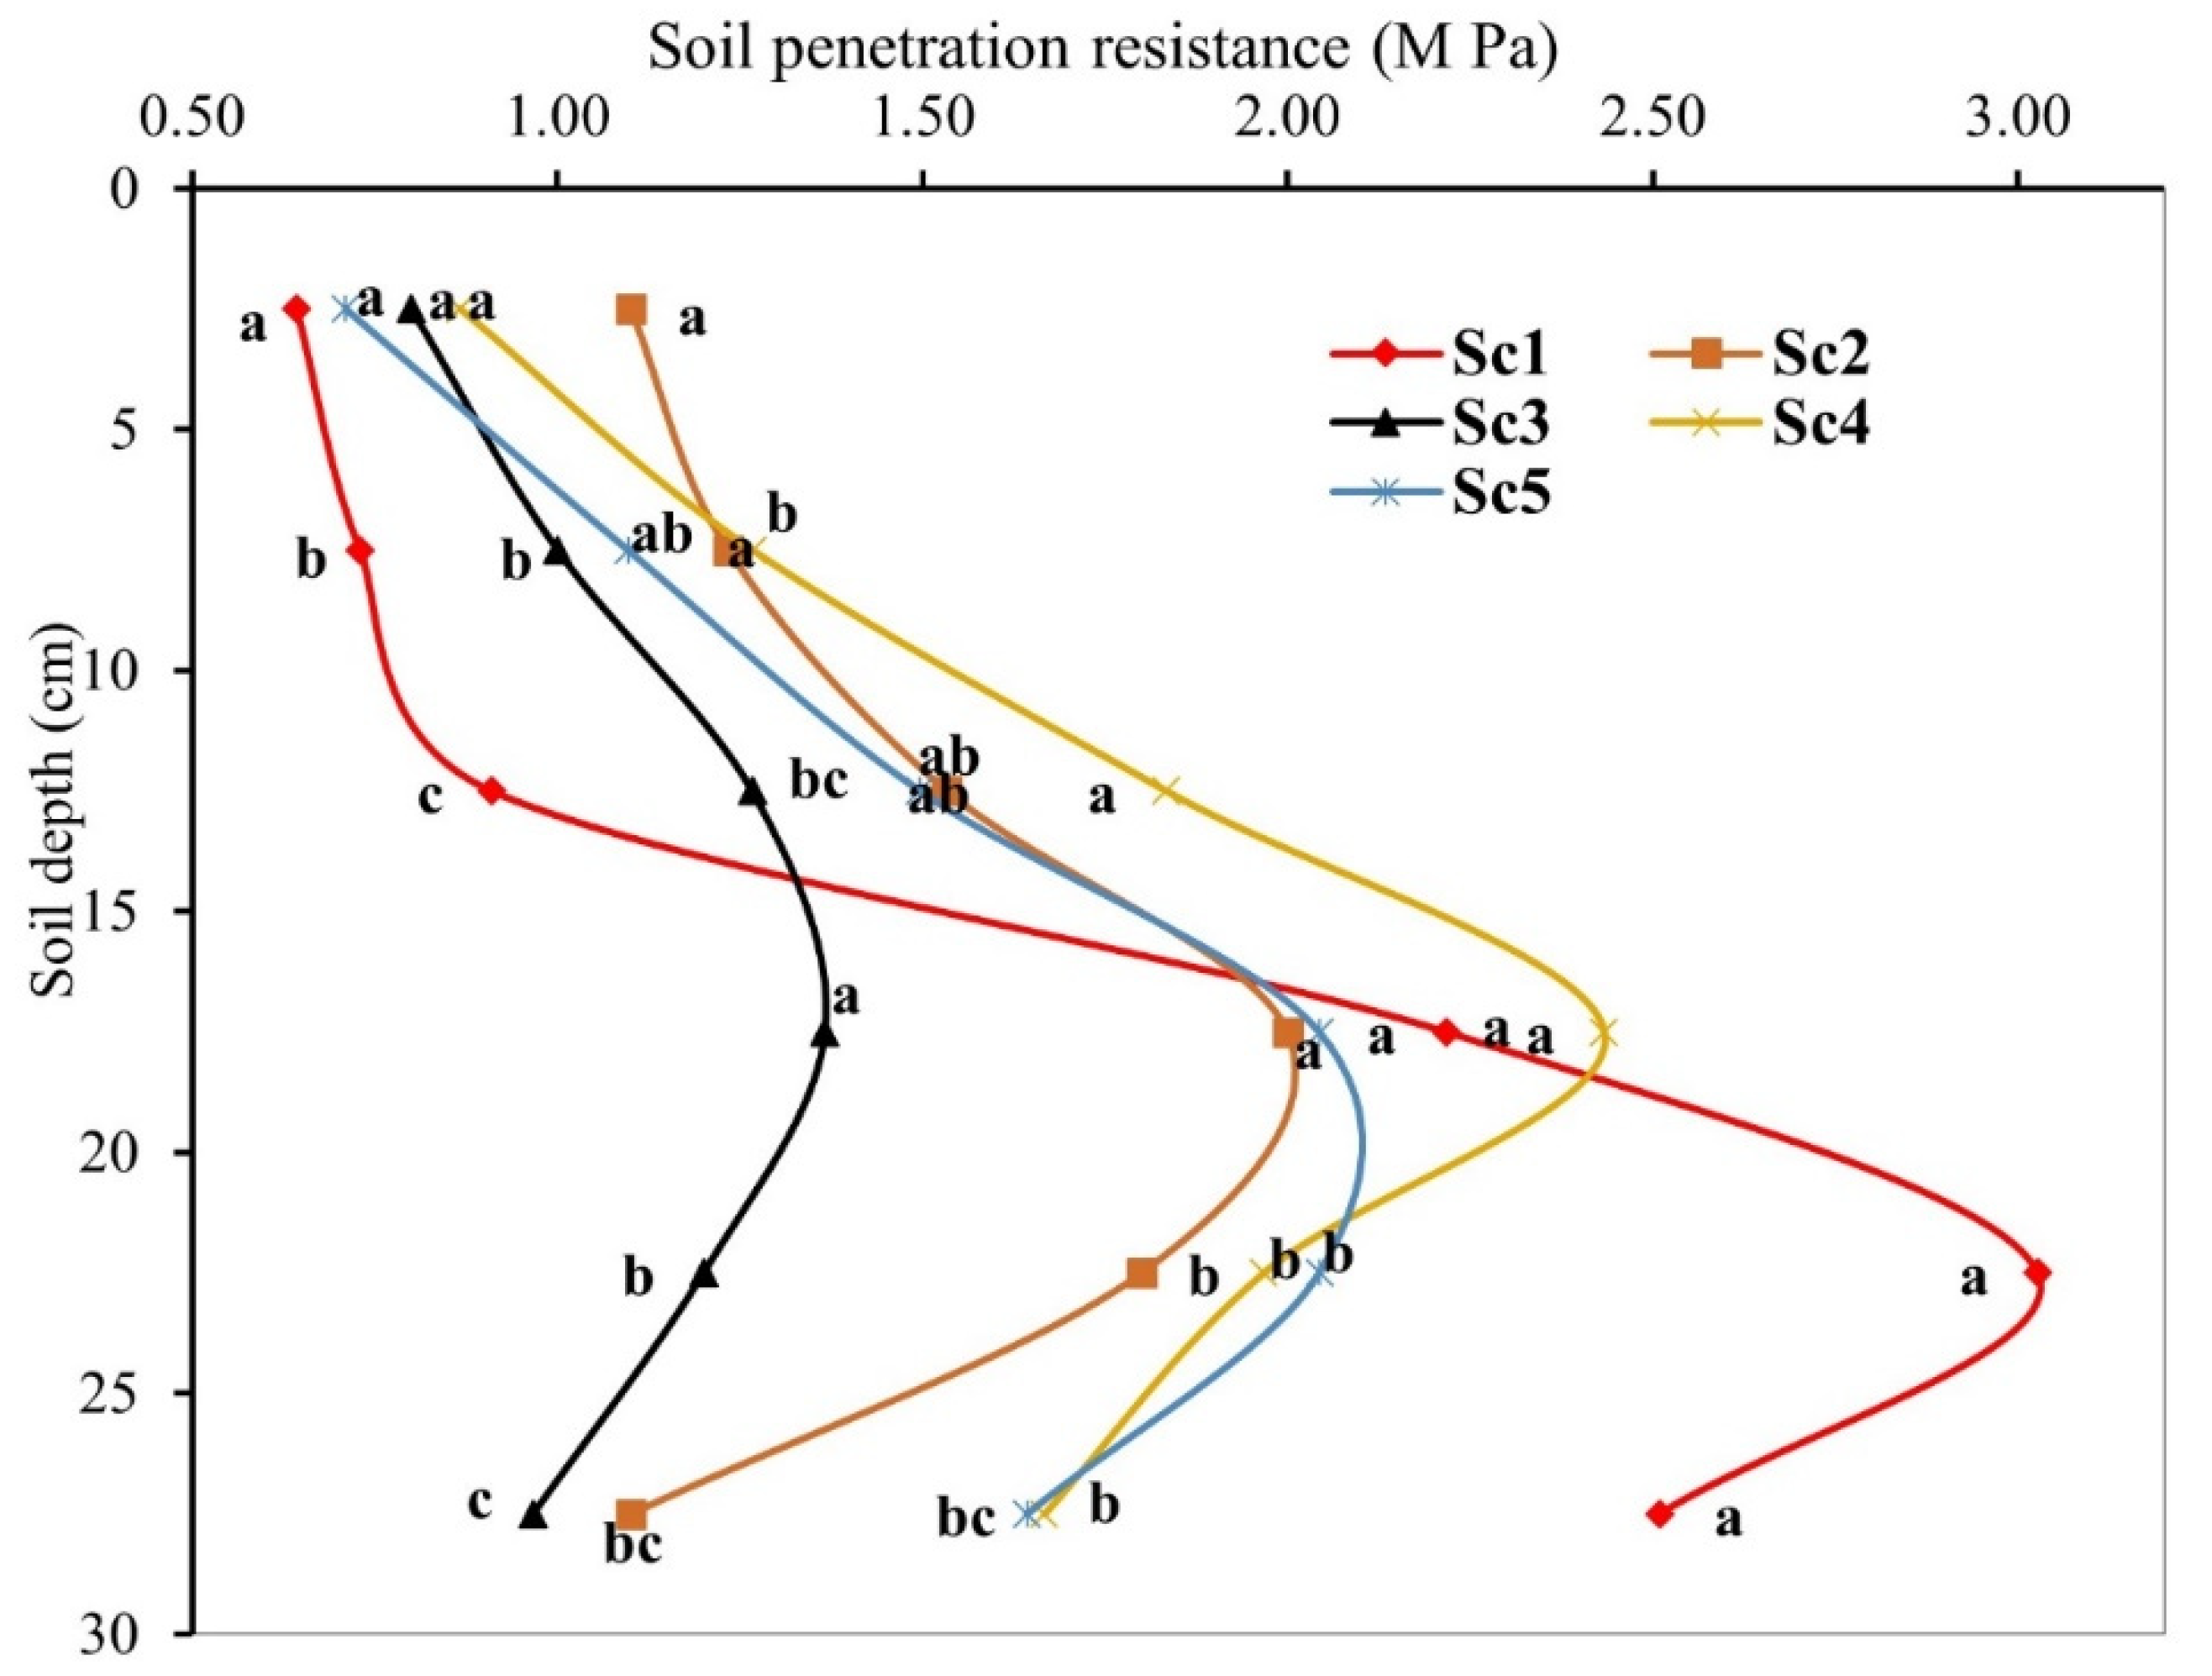
3.2.4. Soil Penetration Resistance (SPR)

CSA-based scenarios significantly (p ≤ 0.05) influenced SPR at all measured depths, except at 0–5 cm and 15–20 cm, in which no significant differences (p ≤ 0.05) were observed among all scenarios (Figure 2). In general, in the top 15 cm, minimum SPR was recorded for Sc1 (0.64–0.91 MPa), while the highest values were recorded for Sc4 (0.87–1.83 MPa). Below 15 cm, an opposite trend was observed, in which CSA-based scenarios had significantly (p ≤ 0.05) lower SPR relative to Sc1. The effect of CSA was minimal in the upper 5 cm surface, in which no significant (p ≤ 0.05) differences were observed among all scenarios (Figure 2). In the 5–10 and 10–15 cm soil depths, all CSA-based scenarios significantly increased SPR except Sc3 which was at par with Sc1 (Figure 2). The threshold point was at a soil depth of 15–20 cm, wherein CSA practices did not significantly affect SPR. In the 20–25 and 25–30 cm soil depths, all CSA scenarios significantly (p ≤ 0.05) increased SPR (Figure 2), with Sc3 (rice-based CSA with SDI) having the lowest SPR (0.97–1.2 MPa). The average SPR of maize-based CSA scenarios (Sc4 and Sc5) was 5.0 and 39.6%, over rice-based CSA scenarios (Sc4 and Sc5), for the 0–15 and 15–30 cm soil depth, respectively. Moreover, SDI-based CSA scenarios (Sc3 and Sc5) decreased SPR significantly (p ≤ 0.05) by 18.5 and 15.5%, relative to FI-based CSA scenarios (Sc2 and Sc4) for the 0–15 and 15–30 cm soil depth, respectively. SPR of maize-based CSA scenarios was higher than rice-based CSA scenarios for all tested depths except 0–5 cm soil depth. SPR of maize-based CSA scenarios was 5.8, 19.0, 33.0, 33.5, and 60.0% over rice-based CSA scenarios for 5–10, 10–15, 15–20, 20–25, and 25–30 cm soil depth, respectively. Incorporation of SDI-based system decreased penetration resistance significantly (p ≤ 0.05) by 23.4, 16.0, 17.6, 23.0, 14.0, and 5.7% for 0–5, 5–10, 10–15, 15–20, 20–25, and 25–30 cm soil depth, respectively.

3.3. Soil and Earthworms’ Casts (EWC) Biochemical Properties

3.3.1. Soil Salinity and pH

The effect of CSA-based scenarios on the soil salinity and pH was minimal, in which no significant (p ≤ 0.05) differences in soil salinity and pH were observed owing to CSA-based management practices (Table 3). Irrespective of CSA-based scenarios, soil salinity ranged from 0.22 to 0.28 dS m−1, while the soil was almost neutral, and the pH varied from 7.1 to 7.8. However, both EC and pH in EWC were significantly (p ≤ 0.05) higher in rice CSA-based scenarios over maize CSA-based and farmers’ practices (Sc1) (Table 3). The rice-based CSA scenarios (Sc2 and Sc3) showed similar EC in EWC to those observed for maize-based CSA scenarios (Sc4 and Sc5), irrespective of crop management. However, the pH of EWC in rice-based CSA scenarios (Sc2 and Sc3) was significantly (p ≤ 0.01) higher than maize-based scenarios (Sc4 and Sc5) by 7.4%, irrespective of management systems.

3.3.2. Total Organic Carbon (TOC)

All CSA-based scenarios (Sc2–5) showed higher TOC in both bulk soil and EWC than farmers’ practice (Sc1) but did not significantly (p ≤ 0.05) differ from each other (Table 3). Interestingly, under CSA-based scenarios (Sc2–5), the average TOC in EWC was two times higher than the average TOC in bulk soil. In farmers’ practices, OC was found only in the bulk soil (0.65%); however, under CSA-based scenarios (Sc2–5), OC was found in the bulk soil (0.98%) and in EWC (1.91%). TOC in bulk soil under CSA-based scenarios was significantly (p ≤ 0.01) higher (50.0%) over Sc1. Maize-based CSA scenarios (Sc4 and Sc5) significantly (p ≤ 0.01) increased TOC in bulk soil by 4.7% and in EWC by 8.7% over rice-based CSA scenarios (Sc2 and Sc3), irrespective of crop management practices. Similarly, SDI-based CSA scenarios (Sc3 and Sc5) significantly (p ≤ 0.01) increased TOC in bulk soil by 9.0% over FI-based CAS scenarios (Sc2 and Sc4), irrespective of the cropping system.

3.3.3. Macronutrients (N, P, and K)

All CSA-based scenarios significantly (p ≤ 0.05) increased available N in bulk soil and EWC over Sc1, irrespective of cropping systems, with Sc5 having the maximum effect (Table 3). The exception is FI-based CAS scenarios (Sc2 and Sc4), which were on par with Sc1 for available N in bulk soil. Maize-based CSA scenarios (Sc4 and Sc5) and rice-based scenarios (Sc2 and Sc3) significantly (p ≤ 0.05) increased available N in bulk soil by 14.8% and 15.8%, respectively, over Sc1, irrespective of crop management practices. The effect of the cropping system on available N in bulk soil was minimal, where both cropping systems had similar values. However, implementing SDI significantly (p ≤ 0.01) increased available N in bulk soil by 9.3% compared to FI, irrespective of the cropping system.
Available P and K in bulk soil were not significantly (p ≤ 0.05) affected by CSA scenarios, while in EWC, all CSA scenarios significantly (p ≤ 0.05) increased available P and K over Sc1 (Table 3). Full CSA scenarios (Sc2–5) did not significantly (p ≤ 0.05) differ in P and K in EWC, except for Sc3 that recorded a significantly higher available P relative to Sc4 and Sc5. Rice-based scenarios (Sc2 and Sc3) significantly (p ≤ 0.01) increased available P in EWC by 14.0% over maize-based scenarios (Sc4 and S5). However, in bulk soil, maize-based scenarios (Sc4 and Sc5) showed statistically similar available P to those obtained from rice-based scenarios (Sc2 and Sc3).
Interestingly, similar to C, in farmers’ practices, available N, P, and K were found only in the bulk soil. However, under CSA-based scenarios (Sc2–5), available N, P, and K were found in the bulk soil and in EWC. Furthermore, the available N, P, and K in EWC were always higher under all CSA scenarios than in bulk soil. Irrespective of the CSA scenario, available N, P, and K in EWC were higher than in bulk soil by 5.6, 60.0, and 160.0% for N, P, and K, respectively. Moreover, amounts of available N, P, and K were highly affected by CSA practices. On average, CSA scenarios increased available N, P, and K levels (in EWC) from 0.0 kg ha−1 in Sc1 to 167.0, 50.8, and 547.8 kg ha−1, respectively.

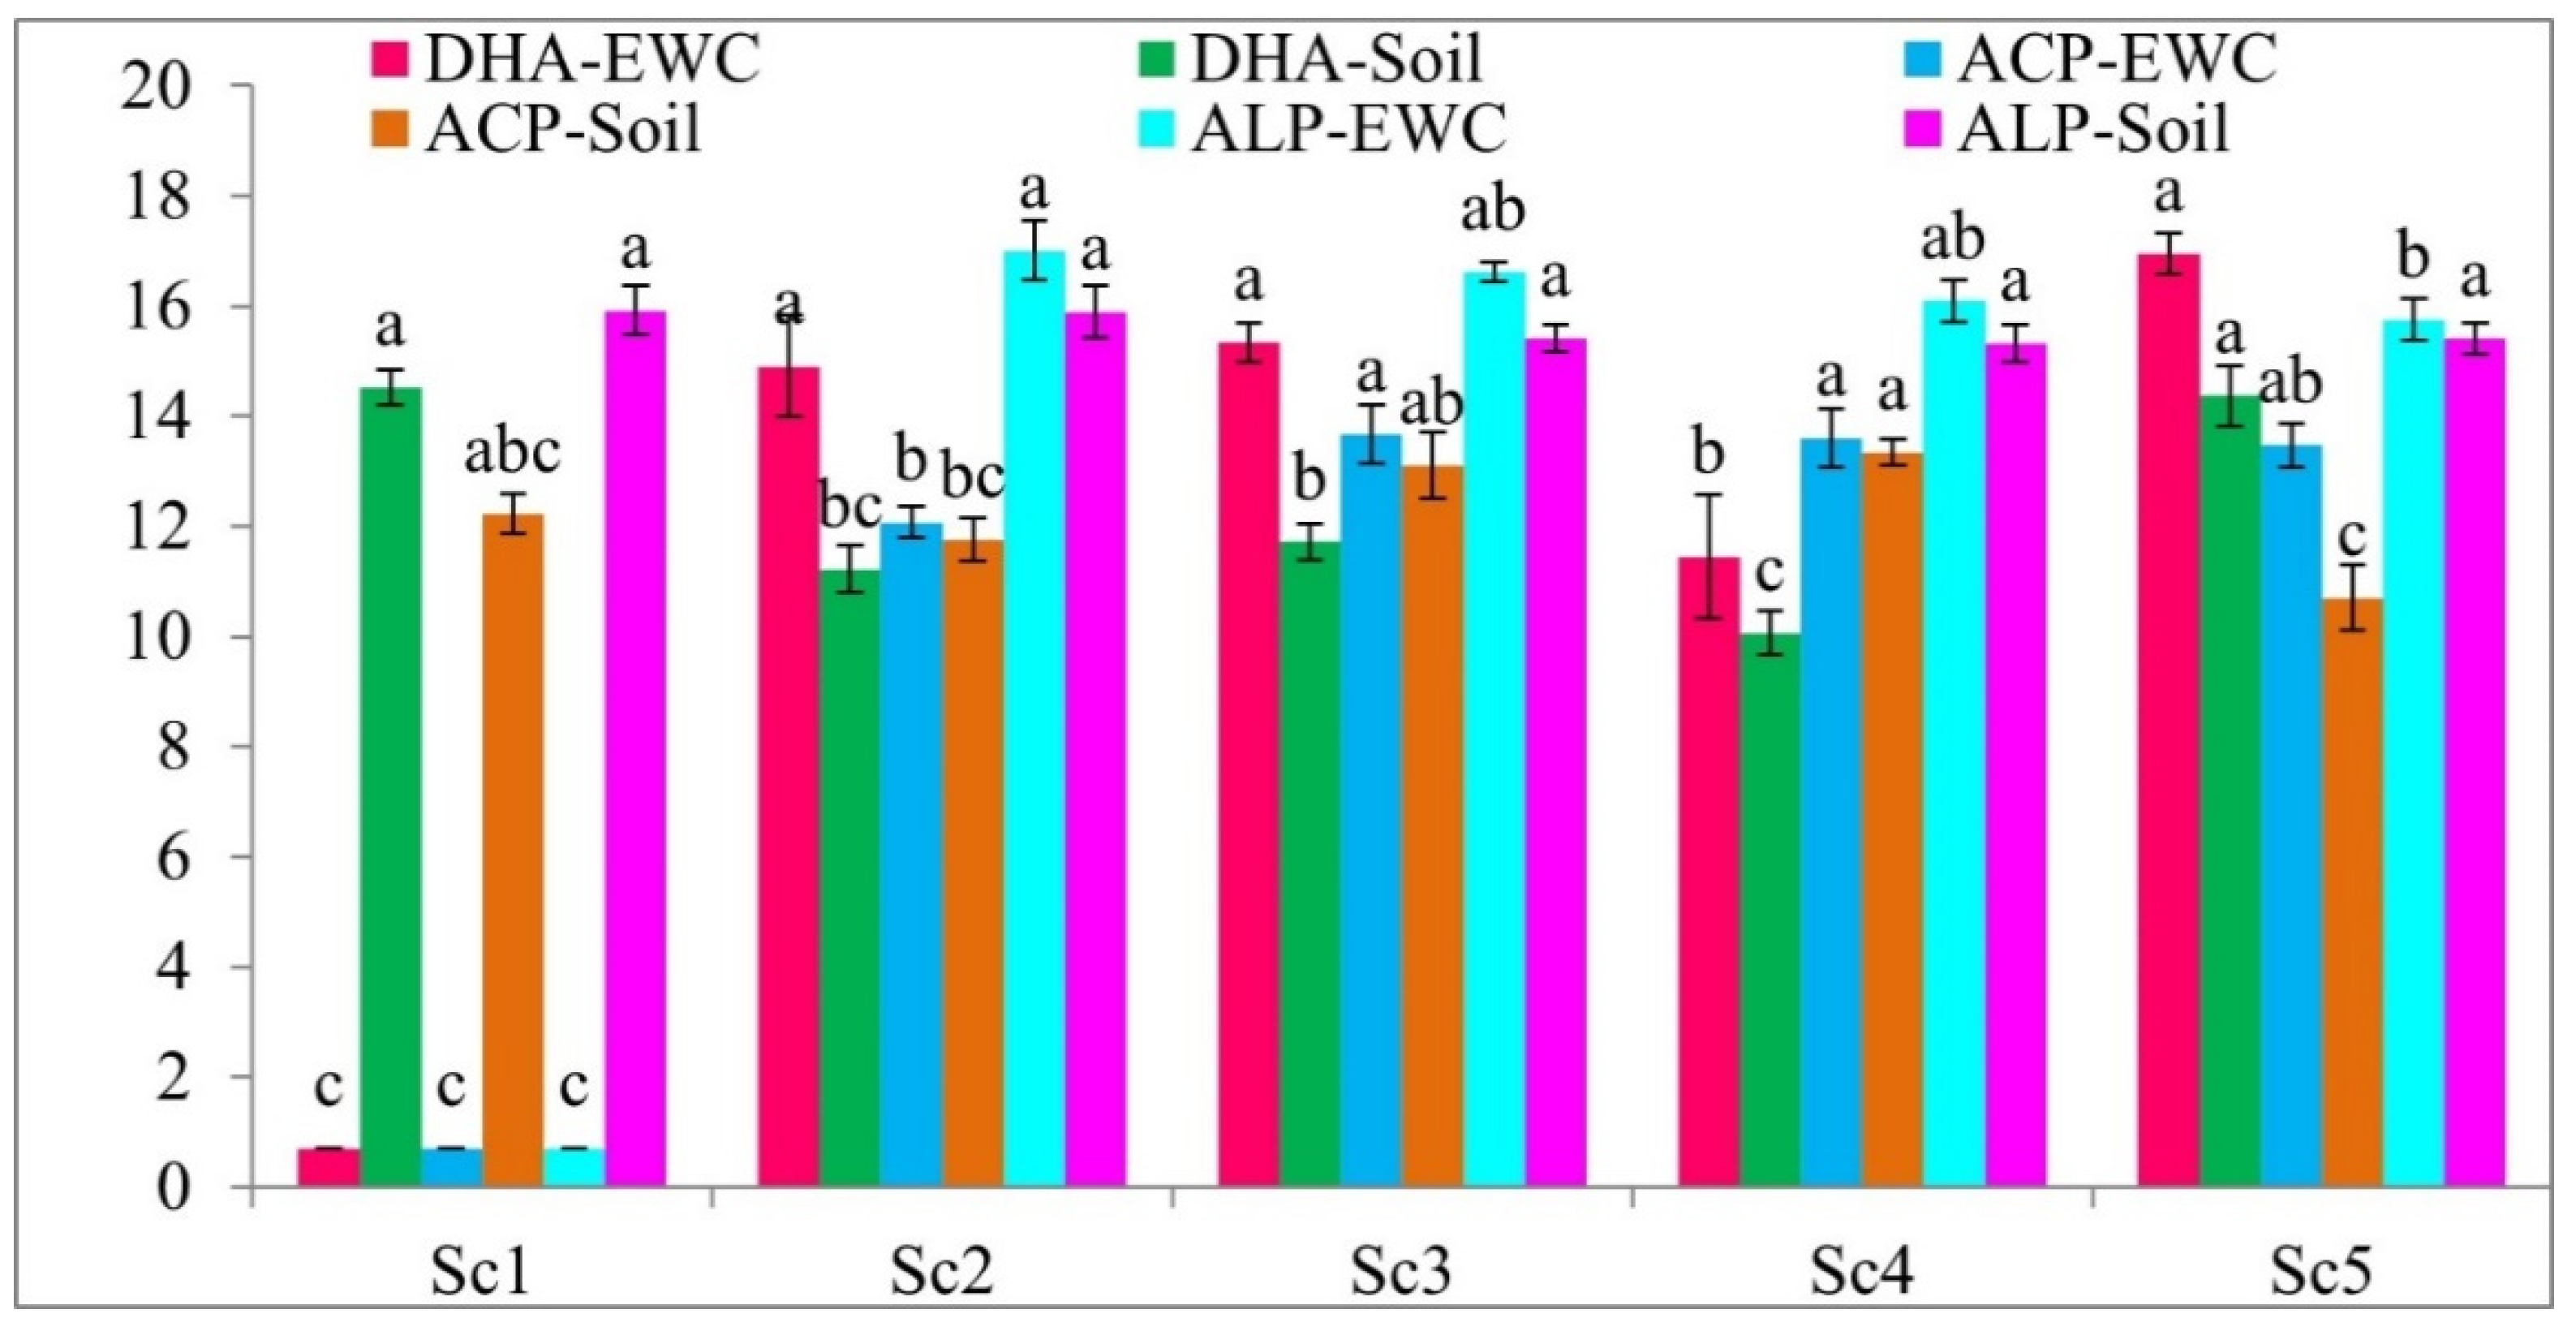
3.3.4. Enzymes in Bulk Soil and Earthworms’ Casts

In the EWC, DHA, acid phosphates (ACP) and alkaline phosphates (ALP) were significantly (p ≤ 0.05) higher under all CSA-based scenarios with respect to Sc1 (Figure 3). CSA-based scenarios did not significantly (p ≤ 0.05) differ in DHA and ALP activities, only DHA under Sc4 was significantly (p ≤ 0.05) lower than other CSA-based scenarios. As for ACP, the highest activity was recorded for Sc3 which was on par with Sc4 and Sc5 (Figure 3). In EWC, rice-based CSA scenarios significantly (p ≤ 0.01) increased DHA, ACP, and ALP activities by 9.4, 5.4, and 14.0%, respectively, over maize-based scenarios. Moreover, SDI-based CSA scenarios (Sc3 and Sc5) significantly (p ≤ 0.01) increased DHA and ACP activities in EWC over FI-based CSA scenarios (Sc2 and Sc4) by 46.6 and 11.5%, respectively, while ALP was not affected by the irrigation system. As for the bulk soil, CSA-based practices did not significantly (p ≤ 0.05) differ in ALP and ACP activity and were on par with Sc1 (Figure 3). The exception is ACP in Sc5, in which a significantly lower value (relative to the control) was observed. DHA activity was significantly (p ≤ 0.05) decreased in all CSA-based practices, except for Sc5 which was on par with Sc1 (Figure 3).

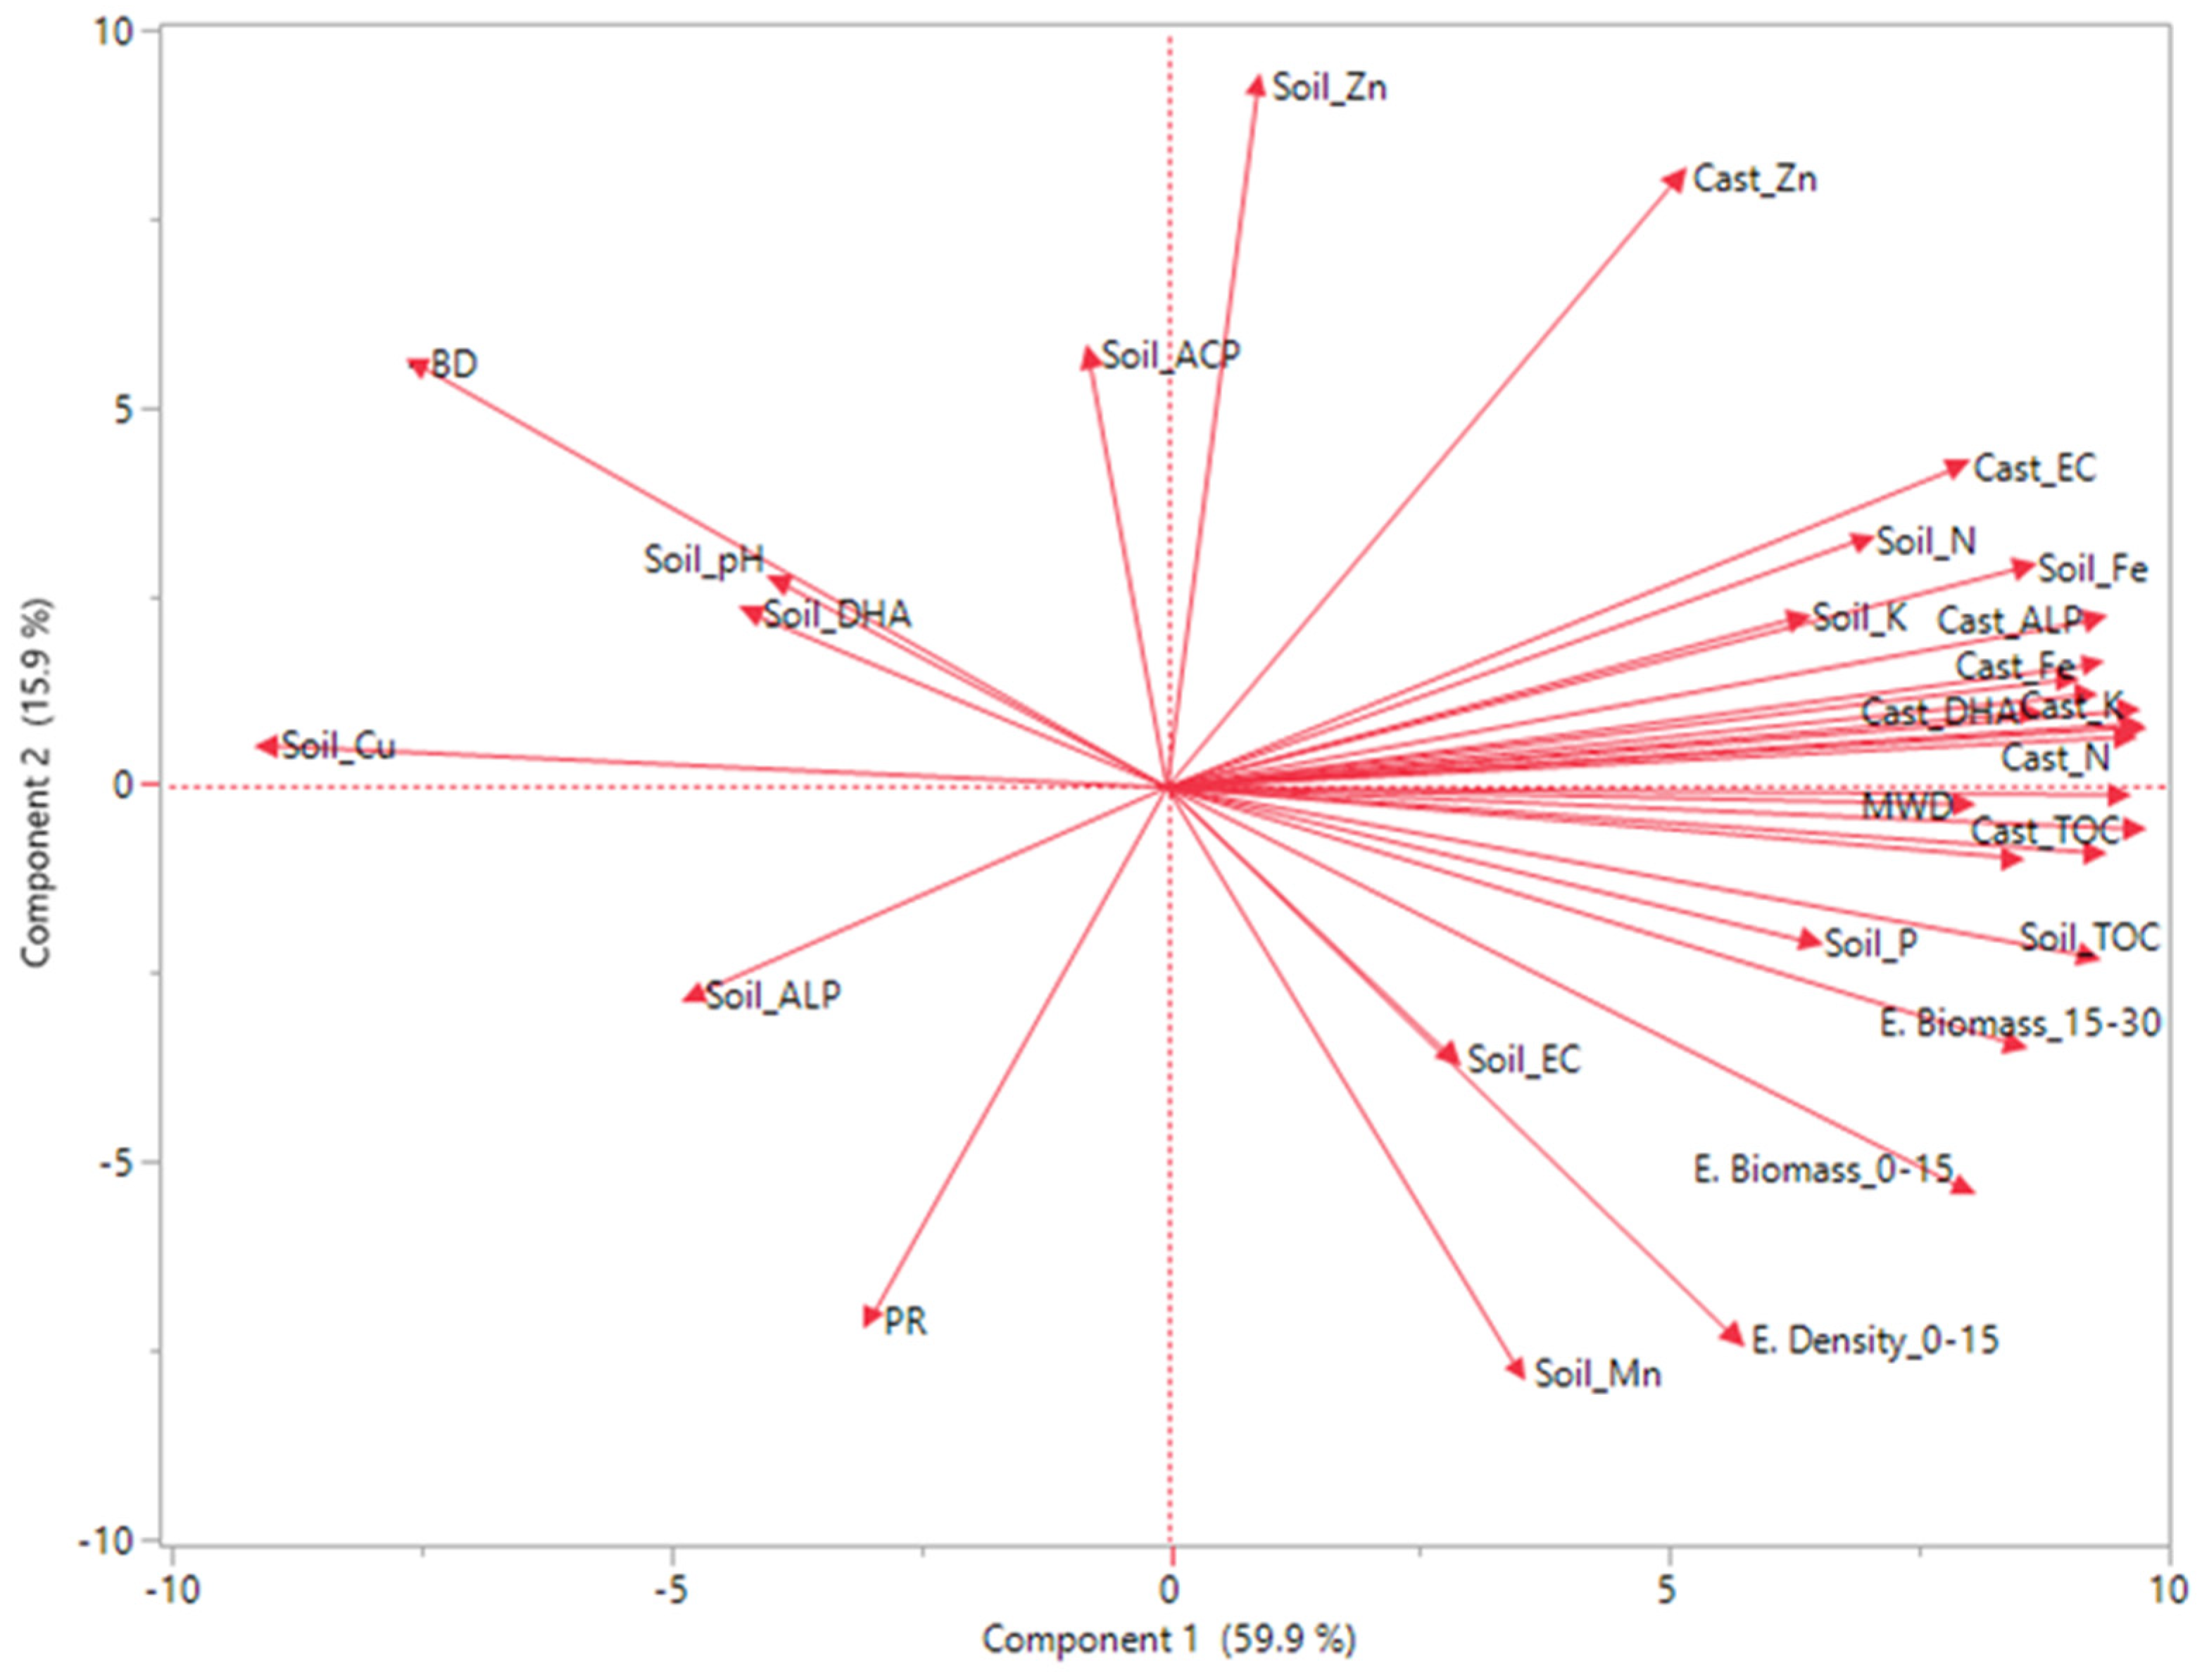
3.4. Principal Component Analysis (PCA)

In the PCA of 25 variables, three PCs were extracted with eigen values > 0.9 and explained 75.8% of the variance (Figure 4); first and second components explained 59.9% and 13.9%, respectively, of variation. Based on PCA, about 59.9% loadings were provided by the parameters in PC1 that can be used as key indicators for assessing soil quality. The results showed a strong and positive correlation between EW abundance (density and biomass for the 0–15 and 15–30 cm soil depths) and parameters located on the upper right-hand side (Figure 4), i.e., IR, MWD, TOC in bulk soil and EWC, available N, P, and K in the bulk soil and EWC, enzymes’ activities (DHA, ALP, and ACP) only in EWC. However, EW density and biomass for the 0–15 and 15–30 cm soil depths were negatively correlated with enzyme activity (DHA, ALP, and ACP) in the bulk soil and BD. In the top-soil layer, a significant positive correlation was observed between EWs’ density and TOC in bulk soil (r = 0.84), TOC in EWC (r = 0.87), IR (r = 0.68), MWD (r = 0.94), P in bulk soil (r = 0.95), P in EWC (r = 0.74), K in soil (r = 0.96), and K in EWC (r = 0.86) (Table S1). Similarly, EWs’ biomass significantly correlated with TOC in bulk soil (r = 0.66), TOC in EWC (r = 0.92), IR (r = 0.44), MWD (r = 0.81), P in bulk soil (r = 0.83), and P in EWC (r = 0.81). Similar trends were observed for the sub-surface soil layer (Table S1).

3.5. Effect of Different Management Practices and Their Linear Contrast

The effect of different management practices and their linear contrast and interactions on EWs’ density, EWs’ biomass, physico-chemical, and enzymes’ activities under CSA-based management practices are given in Table 4. The effect of scenarios, depth/soil-casts, and their interactions (Scenario x Depth/soil-casts) on EWs’ density and biomass, TOC, pH, N, P, and K was significant (Table 4). The effect of scenarios and Scenario × Depth/soil-casts interactions was significant for all measured parameters except EC and DHA. However, the effect of depth/soil-casts interaction was significant for all parameters except N, P, and enzymes’ activities.
The effect of tillage (ZT vs CT), irrigation management (SDI vs FI), and cropping system (RW vs MW) was evident on EWs’ density and biomass, most soil physical properties, and all biochemical properties of EWs’ casts. However, except for (TOC, N, and K), the biochemical properties of bulk soil were not significantly affected by tillage, irrigation system, and cropping system (Table 4). Moreover, all soil physical properties (except SPR) and biochemical properties of EWC were significantly (p ≤ 0.01) affected by tillage (Table 4). However, in the bulk soil, only TOC, N, K, and DHA were significantly affected by tillage. The effect of the cropping system (RW vs. MW) was significant (p ≤ 0.05) on all soil physical properties (except MWD) and biochemical properties of EWC (p ≤ 0.01), while the biochemical properties of soil bulk were not affected by the cropping system (except, TOC, ALP, and DHA) (Table 4). Furthermore, the effect of the irrigation system (SDI vs FI) was significant (p ≤ 0.05) on all soil physical properties (except BD), and all biochemical properties of EWC. As for the soil-bulk biochemical properties, only TOC, pH, N, and K were affected by the irrigation system.

4. Discussion

4.1. Earthworms’ Density and Biomass

The absence of EWs in farmers’ practice (Sc1) indicates the intensive soil biological degradation in the IGP of India. The limited EWs’ abundance in the conventionally managed agroecosystems has been reported previously in India [4,28,29] and worldwide [15,20,47,61]. Intensive tillage lessens the EWs’ abundance by killing and injuring them, exposing them to predators by bringing them closer to the soil surface, decreasing their food source through the acceleration of OM decomposition [22,26], and creating unfavorable soil physical conditions, e.g., temperature, moisture, and soil structure [62]. During tillage, about 68–70% of the EWs’ biomass can be lost [44,63]. The very low abundance of EWs under farmers’ practices in rice fields was confirmed by Singh et al. [29] in which they outlined that EWs were more abundant at the margins of the paddy fields in India, but no EWs were observed inside the fields. Our results were also confirmed by the findings of Giannitsopoulos et al. [64] who found that the highest EWs’ density (181–228 m−2) was achieved under the least destructive tillage, while the most disruptive tillage yielded the lowest densities (75–98 m−2).
The burning or removal of crop residue directly influenced EWs by reducing their food source. In contrast, the input of OM by crop residue retention or organic amendments promotes EWs’ density and abundance [20,24,30]. In the present study, TOC strongly correlated with EWs’ density and EWs’ biomass for the two soil depths (Figure 4). Several studies reported a significant correlation between soil OC and EWs’ abundance [26,42,61,65]. Giannitsopoulos et al. [64] estimated that for every 10% increase in crop residue retention on the soil surface, EWs’ density could increase by 15 indv. m−2.
The effect of the cropping system on EW density and biomass was significant. The higher EWs’ density and biomass of CSA maize-based scenarios (Sc4 and 5) over CSA rice-based scenarios (Sc2 and Sc3) could be attributed to the increased crop residues amount in which 14.5 Mg ha−1 of crop residues was retained annually on the soil surface compared to 12.34 Mg ha−1 for rice-based CSA scenarios. The higher input of crop residue in maize-based CSA systems has been translated to a 4.7% higher TOC in bulk soil by over rice-based CSA scenarios that could contribute to better EWs’ proliferation under maize-based CSA scenarios. Similar results were reported by other researchers [15,19,20] in which they reported that EWs’ abundance is affected by crop residues amount and TOC in the soil. Irrespective of food “OM” quantity, the quality of crop residues also plays an important role whereas the C/N ratio of maize residues (43–50) is lower than rice residue (58–65), implying that maize residue is a favorable food source of EWs relative to rice residues. Abail and Whalen [55] reported that EWs’ biomass and density were higher under crop residues with a lower C/N ratio. In the present study, maize was irrigated at SMP of −40 to −50 kPa, while the rice was irrigated at −20 to −30 kPa, indicating better aeration under maize cultivation which could be another compelling reason for the enhanced EWs’ density and biomass under maize-based CSA scenarios. Dhar and Chaudhuri [66] attributed the low EWs’ density in paddy soils to inadequate drainage and anaerobic conditions. This explanation was validated by the higher EWs’ density and biomass for SDI-based scenarios compared to the FI-based scenarios. Interestingly, SDI-based CSA scenarios (Sc3 and Sc5) could promote the EWs’ population not only by providing better soil anaerobic conditions but also SDI-based CSA scenarios increased TOC in bulk soil by 9.0% over FI-based CAS scenarios, irrespective of the cropping system.

4.2. Total Organic Carbon

The observed increase in TOC in bulk soil under CSA-based scenarios could be explained by the greater residue input and the less soil disturbance over ten years. Several studies reported higher SOC under conservation agriculture practices than conventional practices [11,67,68,69]. The low SOC under Sc1 might be due to the combination of crop residue removal and intensive tillage that increases SOC losses by increasing its exposure to environmental fluctuations [35]. Furthermore, tillage (puddling/ploughing) breaks stable aggregates and exposes the protected OM to microbial decay [61,64,68]. Subsequently, lesser soil disturbance provides potential protection of SOC inside the macro-aggregates [68,70,71].
The amount of TOC in bulk soil is determined by the OM input and soil fauna activities, in particular by activities of EWs. EWs’ feeding, burrowing, and casting activities impact OM distribution and dynamics [18,20,21,23,71,72]. Besides the higher TOC in the bulk soil of CAS-based scenarios (0.98%), relative to Sc1 (0.65), the presence of the EWC is another significant source for the TOC (1.98%), which was absent under Sc1. Angest et al. [46] demonstrated that EWs function similar to biochemical reactors that assist in converting plant compounds into microbial necromass in stabilized carbon pools “in their casts” without altering the TOC. In the present study, EWs’ activity promoted the formation of stable aggregates that protected the SOC against microbial attack [48,49], in which the MWD was positively correlated with EWs’ density (r = 0.94) (Figure 4 and Table S1). This suggestion is corroborated by the observed significantly higher MWD under CSA-based scenarios (Figure 1), and TOC in bulk soil, in which MWD was significantly correlated with TOC in bulk soil (r = 0.89) (Figure 4 and Table S1). EWs’ activity might have also stabilized SOM through its incorporation and protection in their casts [48]. The higher average TOC in EWC (1.91%) relative to the bulk soil in CSA (0.98%) and the bulk soil of Sc1 (0.65) supports this scenario (Table 3). In short, EWs can promote C sequestration by increasing the decomposition of newly added C into stable C either inside stable aggregates or inside their casts, thus aiding soil C storage in the long term [25,46,48].

4.3. Soil Physical Properties

CSA practices increase the mean weight diameter (MWD) of water-stable aggregates through increasing TOC, decreasing soil disturbance, increasing EWs’ population, and reducing SOC loss [64,68,70,71]. The MWD was positively correlated with TOC (r = 0.89) and EWs’ density (r = 0.94) and EWs’ biomass (r = 0.81). Under farmers’ practices, intensive tillage breaks the stable aggregates and exposes protected OM to microbial decay and kills the EWs [9,24,68]. Similar to our results, the water-stable aggregates under ZT and residue retention were higher in the studies of Li et al. [73] and Song et al. [9] over conventional practices. EWs’ activity not only promotes humus formation but also mixes such components to create stable aggregates [74]. Upon cast deposition, microbial products together with EWs’ mucilages, bind soil particles and form very stable aggregates [75].
The minimum soil disturbance (due to adoption of ZT), increased MWD, and higher SOC content led to a reduction in soil BD of CSA-based scenarios. Our results corroborated the previous findings of [35] under similar ecologies in which they reported that ZT and CRR reduced soil BD. In the present study, a significant negative correlation between soil BD and TOC (r = −0.54) was observed (Figure 4). The higher soil BD under Sc1 could be due to the compaction induced by tillage operations that were followed by puddling [4]. Puddling destructs soil aggregates and fills the macro-pores with finer soil particles [76]. The reduced BD could also be due to the increased large bio-bores due to EWs’ browning (vertically and horizontally) and to the enhanced soil structure (increased MWD). Gathala et al. [52] found that the increase in MWD increases soil macro-porosity and reduces soil BD. A significant negative correlation was found between soil BD and EWs’ density (r = −72), EWs’ biomass (r = −0.66), and MWD (r = −0.65) (Figure 4 and Table S1). Similar to our results, Kumar et al. [77] found a strong negative correlation (r = −0.78) between BD and MWD.
The observed increase in infiltration rate (IR) in the present study owing to CSA practices could be attributed to the direct and indirect influences of CRR, ZT, and EWs’ activity. Under CSA practices, Ews’ activity might enhance the MWD which could lead to an increase in the IR. This is evident from the observed positive correlation between IR and EWs’ density (r = 0.68) and MWD (r = 0.88) (Figure 4 and Table S1). Under CSA-based scenarios, the highly stable aggregates and EWs’ activities not only reduce the chances for the formation of surface crust but also increase the portion of macro- and bio-porosity [78], and pores connectivity [68,78]. Under ZT, the burrowing activity of the undisturbed EWs leads to an increase in the number of bio-pores, thus IR [23]. EWs vertically dig and create large bio-pores (higher than one mm in diameter) that could extend deeper than one meter in the soil profile [23].
The peak SPR (3.03 MPa) observed for Sc1 was at 20 cm which could be due to the creation of a hardpan by tillage operations [79]. As for the CSA scenarios, despite the significantly higher SPR in the 5–15 cm soil depth, (Figure 2) the maximum SPR (1.83 MPa) was below the critical value of 2–3 MPa that could affect the growth of wheat roots [80]. However, the observed increased SPR in the CSA-based scenarios in the 5–10 and 10–15 cm depths differs from the results of Jat et al. [3] in which they found lower SPR in ZT than in CT. Our results corroborate the findings of Dekemati et al. [61] in which they reported higher SPR under ZT for the top 20 cm. Interestingly, despite high SPR (which might affect EWs’ abundance), in the present study, the maximum EWs’ density and biomass were observed under CSA-based scenarios where significantly higher SPR values were observed, implying that EWs’ abundance is a function of various interacting factors (tillage, amount and type of crop residue, irrigation management, cropping system, and soil type) and not only one factor [42,61].

4.4. Chemical Analysis of Bulk Soil and Earthworms’ Casts

Crop residue decay leads to nutrient release that could be available to plants [81]. Soil biological properties, OM amount, and nutrient availability are strongly correlated [10]. In the present study, under CSA-based scenarios (Sc2–5), available N, P, and K were higher in both the bulk soil and in EWC, compared to farmers’ practices in which due to the absence of the EWs (thus, EWC), available N, P, and K were found only in the bulk soil. This increase might be due to the integration between CRR, EWs “feeding and casting”, and microbial activity. This is evident from the strong and positive correlation between available N, P, and K in the bulk soil and EWs’ density on one side and TOC in the soil on the other side (Figure 4 and Table S1). The adoption of ZT and continuous CRR for 10 years coupled with precision water management promoted EWs’ proliferation, which enhanced and transformed soil microbial structure in a way that boosts SOM mineralization [4,18,20,48], thus releasing available N, P, and K in the soil while maintaining a higher amount inside the EWC. As for available N, P, and K in EWC, the EWs ingest litter on the soil surface [15,19]. This digested litter is converted to a nutrient-rich product by establishing a mutualistic relationship with soil microflora [32]. Once ingested, the unassimilated and undigested litter portions are returned to the soil as EWC. The fresh EWC depositions lead to a release of large quantities of nutrients (N, P, and K) that are easily assimilable by plants [82]. In this way, changes in EWs’ density and activity could be manifested by increased nutrient levels (both in bulk soil and EWC) [14]. Bertrand et al. [23] reported that high EWs’ abundance in the 0–15 cm could have more available N than low EWs’ abundance. Our results were supported by a recent metanalysis that concluded that EWC is highly fertile and contains 40–48% more total P, N, and OC than bulk soil [83]. In the current study, significant amounts of available N, P, and K were accumulated in the EWC. On average, CSA scenarios (Sc2–5) increased available N, P, and K from 0.0 kg ha−1 in Sc1 to 167.0, 50.8, and 547.8 kg ha−1, respectively.
Soil enzymes are responsive to soil management practices, e.g., tillage, cropping diversity, crop residue, and nutrient management [4,34,35]. However, lower enzymes’ activities in bulk soil were found under CSA-based scenarios than the EWC. In contrast, CSA-based management scenarios influenced EWs, thus microbial activities, as evidenced from extracellular enzymes’ activities, i.e., ALP, ACP, and DHA in EWC [10]. EWs establish a mutualistic relationship with soil microflora [32], converting crop residues to EWC containing enzymes and microorganisms [4,48]. Earthworms affect enzyme activities by stimulating microbial communities [46,47] and enhancing enzyme activities [84]. For example, Hoang et al. [33] found higher enzymes’ activities in the topsoil in bio-pores compared to rhizosphere and bulk soil. The higher ALP and ACP in EWC might explain the higher levels for P in bulk soil and EWC [39]. In the present study, we investigated the impact of different CSA practices that promote EWs’ activity, and how EWs influence the soil physico-biochemical properties of the soil, irrespective of EWs’ species (ecological groups). Future studies must include the classification of EWs to their ecological groups as affected by various CSA practices.

5. Conclusions

Earthworms (EWs) were absent under farmers’ practices, reflecting the high pressure on EWs’ communities due to intensive tillage and crop residue burning/removal in the rice-wheat system. Long-term adoption of CSA-based practices markedly boosted EWs’ abundance, positively affected soil structure, increased TOC, nutrient availability, and soil biological activity, in particular, the CSA maize-based cropping system. The high TOC in EWC suggests the potential transformation of the retained crop residue to stable SOC inside the EWC, thus increasing SOC sequestration. Similarly, EWC contained a significant amount of available N, P, and K under CSA practices. Maize-based CSA scenarios recorded higher EWs’ density, EWs’ biomass, TOC, and MWD over rice-based CSA scenarios. Interestingly, SDI-based CSA scenarios yielded higher EWs’ density and biomass, TOC, and available NPK, relative to FI-based CSA scenarios. Therefore, long-term adoption of CSA-based maize-based scenarios using SDI improved EWs’ proliferation, TOC, and nutrient storage (in the soil and EWC) and showed a better choice for the IGP farmers’ w.r.t. soil physical and biological properties. Future studies must include the classification of EWs to their ecological groups as affected by various CSA practices.

Supplementary Materials

The following supporting information can be downloaded at: https://www.mdpi.com/article/10.3390/agronomy12030658/s1, Table S1: Correlation values (r) resulted from the principal component analysis (PCA) between earthworm density (EW.D), earthworm biomass weight (EW.W), and physio-biochemical soil parameters under mid-term (10 years) CSA- based management practices. Where, BD- Bulk density, IR- Infiltration rate, MWD- Mean weight diameter, DHA- Dehydrogenase, ACP- Acid phosphatase, ALP- Alkaline phosphatase, SPR- Soil Penetration resistance, EC -Electrical conductivity, TOC -Total organic carbon, N- Nitrogen, P- Phosphorus, K- Potassium, and EWC- Earthworm.

Author Contributions

Conceptualization, H.S.J., P.C.S., A.J.M. and M.L.J.; methodology, M.C., S.K.K., M.K., M.K.G., V.K., P. and T.P.; software, M.C., S.K.K., M.K., M.K.G., A.M.A. and V.K.; validation, M.K., V.K., P. and A.M.A.; formal analysis, M.C., S.K.K., M.K. and V.K.; investigation, M.K., M.K.G., V.K., P. and T.P.; resources, H.S.J., P.C.S., A.J.M. and M.L.J.; data curation, M.C., S.K.K., M.K., M.K.G., A.M.A. and V.K.; writing—original draft preparation, A.M.A. and S.K.K.; writing—review and editing, H.S.J., P.C.S., A.J.M. and M.L.J.; supervision, H.S.J., P.C.S. and M.L.J.; project administration, H.S.J., P.C.S. and M.L.J.; funding acquisition, H.S.J., P.C.S. and M.L.J. All authors have read and agreed to the published version of the manuscript.

Funding

This research was funded by and funding from the Bill & Melinda Gates Foundation [OPP1052535] through Cereal System Initiative for South Asia (CSISA) project. This research was also funded by ICAR-DARE-W3-CA-2020-CIMMYT, CGIAR-WHEAT-FP4/W1/2 and CGIAR-CCAFS-FP2/P25).

Data Availability Statement

Data are contained within the article.

Acknowledgments

The authors acknowledge the support received from the ICAR-CSSRI, Karnal, and CIMMYT. We also acknowledge the financial and technical support from CGIAR research program on climate change, agriculture, and food security (CCAFS) to undertake this study. The research was financed and supported by CGIAR Research Program (CRPs) on Climate Change, Agriculture and Food Security (CCAFS) and Wheat Agri-Food Systems (WHEAT). We acknowledge the CGIAR Fund Council, Australia (ACIAR), Irish Aid, European Union, and International Fund for Agricultural Development, Netherlands, New Zealand, Switzerland, UK, USAID, and Thailand for funding to the CGIAR Research Program on Climate Change, Agriculture and Food Security (CCAFS). Ahmed M. Abdallah was supported by the Department of Science and Technology (DST) for funding under Research Training Fellowship (RTF) -Developing Countries Scheme, and The Federation of Indian Chambers of Commerce and Industry (FICCI).

Conflicts of Interest

The authors declare no conflict of interest.

References

  1. Gupta, R.; Seth, A. A review of resource conserving technologies for sustainable management of the rice-wheat cropping systems of the Indo-Gangetic plains (IGP). Crop Prot. 2007, 26, 436–447. [Google Scholar] [CrossRef]
  2. Nayak, H.S.; Parihar, C.M.; Mandal, B.N.; Patra, K.; Jat, S.L.; Singh, R.; Singh, V.K.; Jat, M.L.; Garnaik, S.; Nayak, J.; et al. Point placement of late vegetative stage nitrogen splits increase the productivity, N-use efficiency and profitability of tropical maize under decade long conservation agriculture. Eur. J. Agron. 2022, 133, 126417. [Google Scholar] [CrossRef]
  3. Jat, H.S.; Datta, A.; Sharma, P.C.; Kumar, V.; Yadav, A.K.; Choudhary, M.; Choudhary, V.; Gathala, M.K.; Sharma, D.K.; Jat, M.L.; et al. Assessing soil properties and nutrient availability under conservation agriculture practices in a reclaimed sodic soil in cereal-based systems of North-West India. Arch. Agron. Soil Sci. 2018, 64, 531–545. [Google Scholar] [CrossRef] [PubMed]
  4. Choudhary, M.; Datta, A.; Jat, H.S.; Yadav, A.K.; Gathala, M.K.; Sapkota, T.B.; Das, A.K.; Sharma, P.C.; Jat, M.L.; Singh, R.; et al. Changes in soil biology under conservation agriculture based sustainable intensification of cereal systems in Indo-Gangetic Plains. Geoderma 2018, 313, 193–204. [Google Scholar] [CrossRef]
  5. Jat, H.S.; Sharma, P.C.; Datta, A.; Choudhary, M.; Kakraliya, S.K.; Yadvinder-Singh; Sidhu, H.S.; Gerard, B.; Jat, M.L. Re-designing irrigated intensive cereal systems through bundling precision agronomic innovations for transitioning towards agricultural sustainability in North-West India. Sci. Rep. 2019, 9, 17929. [Google Scholar] [CrossRef] [PubMed] [Green Version]
  6. Humphreys, E.; Kukal, S.S.; Christen, E.W.; Hira, G.S.; Balwinder-Singh; Sudhir-Yadav; Sharma, R.K. Halting the Groundwater Decline in North-West India-Which Crop Technologies Will Be Winners? Elsevier Ltd.: Amsterdam, The Netherlands, 2010; Volume 109. [Google Scholar]
  7. Jat, H.S.; Choudhary, K.M.; Nandal, D.P.; Yadav, A.K.; Poonia, T.; Singh, Y.; Sharma, P.C.; Jat, M.L. Conservation agriculture-based sustainable intensification of cereal systems leads to energy conservation, higher productivity and farm profitability. Environ. Manag. 2020, 65, 774–786. [Google Scholar] [CrossRef]
  8. Li, Y.; Zhang, Q.; Cai, Y.; Yang, Q.; Chang, S.X. Minimum tillage and residue retention increase soil microbial population size and diversity: Implications for conservation tillage. Sci. Total Environ. 2020, 716, 137164. [Google Scholar] [CrossRef]
  9. Song, K.; Zheng, X.; Lv, W.; Qin, Q.; Sun, L.; Zhang, H.; Xue, Y. Effects of tillage and straw return on water-stable aggregates, carbon stabilization and crop yield in an estuarine alluvial soil. Sci. Rep. 2019, 9, 4586. [Google Scholar] [CrossRef]
  10. Jat, H.S.; Choudhary, M.; Datta, A.; Yadav, A.K.; Meena, M.D.; Devi, R.; Gathala, M.K.; Jat, M.L.; McDonald, A.; Sharma, P.C. Temporal changes in soil microbial properties and nutrient dynamics under climate smart agriculture practices. Soil Tillage Res. 2020, 199, 104595. [Google Scholar] [CrossRef]
  11. Jat, H.S.; Datta, A.; Choudhary, M.; Sharma, P.C.; Yadav, A.K.; Choudhary, V.; Gathala, M.K.; Jat, M.L.; McDonald, A. Climate Smart Agriculture practices improve soil organic carbon pools, biological properties and crop productivity in cereal-based systems of north-west India. Catena 2019, 181, 104059. [Google Scholar] [CrossRef]
  12. Kakraliya, S.K.; Jat, H.S.; Singh, I.; Sapkota, T.B.; Singh, L.K.; Sutaliya, J.M.; Sharma, P.C.; Jat, R.D.; Choudhary, M.; Lopez-Ridaura, S.; et al. Performance of portfolios of climate smart agriculture practices in a rice-wheat system of western Indo-Gangetic plains. Agric. Water Manag. 2018, 202, 122–133. [Google Scholar] [CrossRef]
  13. Jat, H.S.; Kumar, V.; Kakraliya, S.K.; Abdallah, A.M.; Datta, A.; Choudhary, M.; Gathala, M.K.; McDonald, A.J.; Jat, M.L.; Sharma, P.C. Climate-smart agriculture practices influence weed density and diversity in cereal-based agri-food systems of western Indo-Gangetic plains. Sci. Rep. 2021, 11, 15901. [Google Scholar] [CrossRef]
  14. Singh, J.; Singh, S.; Vig, A.P.; Bhat, S.A.; Hundal, S.S.; Yin, R.; Schädler, M. Conventional farming reduces the activity of earthworms: Assessment of genotoxicity test of soil and vermicast. Agric. Nat. Resour. 2018, 52, 366–370. [Google Scholar] [CrossRef]
  15. Frazão, J.; de Goede, R.G.M.; Salánki, T.E.; Brussaard, L.; Faber, J.H.; Hedde, M.; Pulleman, M.M. Responses of earthworm communities to crop residue management after inoculation of the earthworm Lumbricus terrestris (Linnaeus, 1758). Appl. Soil Ecol. 2019, 142, 177–188. [Google Scholar] [CrossRef]
  16. Pelosi, C.; Pey, B.; Caro, G.; Cluzeau, D.; Peigné, J.; Bertrand, M.; Hedde, M. Dynamics of earthworm taxonomic and functional diversity in ploughed and no-tilled cropping systems. Soil Tillage Res. 2016, 156, 25–32. [Google Scholar] [CrossRef]
  17. Ashworth, A.J.; Allen, F.L.; Tyler, D.D.; Pote, D.H.; Shipitalo, M.J. Earthworm populations are affected from long-term crop sequences and bio-covers under no-tillage. Pedobiologia (Jena) 2017, 60, 27–33. [Google Scholar] [CrossRef]
  18. Van Groenigen, J.W.; Lubbers, I.M.; Vos, H.M.J.; Brown, G.G.; De Deyn, G.B.; Van Groenigen, K.J. Earthworms increase plant production: A meta-analysis. Sci. Rep. 2014, 4, 6365. [Google Scholar] [CrossRef] [Green Version]
  19. Sizmur, T.; Martin, E.; Wagner, K.; Parmentier, E.; Watts, C.; Whitmore, A.P. Milled cereal straw accelerates earthworm (Lumbricus terrestris) growth more than selected organic amendments. Appl. Soil Ecol. 2017, 113, 166–177. [Google Scholar] [CrossRef]
  20. Treder, K.; Jastrzębska, M.; Kostrzewska, M.K.; Makowski, P. Do long-term continuous cropping and pesticides affect earthworm communities? Agronomy 2020, 10, 586. [Google Scholar] [CrossRef]
  21. Frazão, J.; de Goede, R.G.M.; Capowiez, Y.; Pulleman, M.M. Soil structure formation and organic matter distribution as affected by earthworm species interactions and crop residue placement. Geoderma 2019, 338, 453–463. [Google Scholar] [CrossRef]
  22. Briones, M.J.I.; Schmidt, O. Conventional tillage decreases the abundance and biomass of earthworms and alters their community structure in a global meta-analysis. Glob. Chang. Biol. 2017, 23, 4396–4419. [Google Scholar] [CrossRef] [PubMed] [Green Version]
  23. Bertrand, M.; Barot, S.; Blouin, M.; Whalen, J.; de Oliveira, T.; Roger-Estrade, J. Earthworm services for cropping systems. A review. Agron. Sustain. Dev. 2015, 35, 553–567. [Google Scholar] [CrossRef]
  24. Schlüter, S.; Albrecht, L.; Schwärzel, K.; Kreiselmeier, J. Long-term effects of conventional tillage and no-tillage on saturated and near-saturated hydraulic conductivity—Can their prediction be improved by pore metrics obtained with X-ray CT? Geoderma 2019, 361, 114082. [Google Scholar] [CrossRef]
  25. Bossuyt, H.; Six, J.; Hendrix, P.F. Interactive effects of functionally different earthworm species on aggregation and incorporation and decomposition of newly added residue carbon. Geoderma 2006, 130, 14–25. [Google Scholar] [CrossRef]
  26. Stroud, J.L. Soil health pilot study in England: Outcomes from an on-farm earthworm survey. PLoS ONE 2019, 14, e0203909. [Google Scholar] [CrossRef] [Green Version]
  27. Johnston, A.S.A.; Sibly, R.M.; Hodson, M.E.; Alvarez, T.; Thorbek, P. Effects of agricultural management practices on earthworm populations and crop yield: Validation and application of a mechanistic modelling approach. J. Appl. Ecol. 2015, 52, 1334–1342. [Google Scholar] [CrossRef] [Green Version]
  28. Suthar, S. Earthworm communities a bioindicator of arable land management practices: A case study in semiarid region of India. Ecol. Indic. 2009, 9, 588–594. [Google Scholar] [CrossRef]
  29. Singh, S.; Sharma, A.; Khajuria, K.; Singh, J.; Vig, A.P. Soil properties changes earthworm diversity indices in different agro-ecosystem. BMC Ecol. 2020, 20, 27. [Google Scholar] [CrossRef]
  30. Moos, J.H.; Schrader, S.; Paulsen, H.M. Reduced tillage enhances earthworm abundance and biomass in organic farming: A meta-analysis. Appl. Agric. For. Res. 2017, 67, 123–128. [Google Scholar] [CrossRef]
  31. Pelosi, C.; Barot, S.; Capowiez, Y.; Hedde, M.; Vandenbulcke, F. Pesticides and earthworms. A review. Agron. Sustain. Dev. 2014, 34, 199–228. [Google Scholar] [CrossRef] [Green Version]
  32. Mubeen, H.; Hatti, S.S. Earthworms diversity of Koppal district with the updated information on genus Thatonia of Hyderabad–Karnataka region, Karnataka, India. J. Asia-Pacific Biodivers. 2018, 11, 482–493. [Google Scholar] [CrossRef]
  33. Hoang, D.T.T.; Bauke, S.L.; Kuzyakov, Y.; Pausch, J. Rolling in the deep: Priming effects in earthworm biopores in topsoil and subsoil. Soil Biol. Biochem. 2017, 114, 59–71. [Google Scholar] [CrossRef]
  34. Lehman, R.M.; Acosta-Martinez, V.; Buyer, J.S.; Cambardella, C.A.; Collins, H.P.; Ducey, T.F.; Halvorson, J.J.; Jin, V.L.; Johnson, J.M.F.; Kremer, R.J.; et al. Soil biology for resilient, healthy soil. J. Soil Water Conserv. 2015, 70, 12A–18A. [Google Scholar] [CrossRef]
  35. Choudhary, M.; Jat, H.S.; Datta, A.; Yadav, A.K.; Sapkota, T.B.; Mondal, S.; Meena, R.P.; Sharma, P.C.; Jat, M.L. Sustainable intensification influences soil quality, biota, and productivity in cereal-based agroecosystems. Appl. Soil Ecol. 2018, 126, 189–198. [Google Scholar] [CrossRef]
  36. Utobo, E.B.; Tewari, L. Assesment of aboveground biomass stock in the Pachaimalai forest of Eastern Ghats in India. Appl. Ecol. Environ. Res. 2015, 13, 85–97. [Google Scholar] [CrossRef]
  37. Dick, R.P.; Breakwell, D.P.; Turco, R.F. Soil enzyme activities and biodiversity measurements as integrative microbiological indicators. In Handbook of Methods for Assessing Soil Quality; Doran, J.W., Jones, A.J., Eds.; SSSA: Madison, WI, USA, 1996; pp. 242–272. [Google Scholar]
  38. Karaca, A.; Cetin, S.C.; Turgay, O.C.R. Soil enzymes as indication of soil quality. In Soil Enzymology; Shukla, G., Varma, A., Eds.; Springer: Berlin/Heidelberg, Germany, 2010; Volume 22, pp. 275–285. ISBN 978-3-642-14224-6. [Google Scholar]
  39. Nannipieri, P.; Giagnoni, L.; Landi, L.; Renella, G. Role of Phosphatase Enzymes in Soil. In Phosphorous in Action. Soil Biology; Bünemann, E., Oberson, A., Frossard, E., Eds.; Springer: Berlin/Heidelberg, Germany, 2011; Volume 26, pp. 215–243. ISBN 978-3-642-15270-2. [Google Scholar]
  40. Zhang, N.; He, X.D.; Gao, Y.B.; Li, Y.H.; Wang, H.T.; Ma, D.; Zhang, R.; Yang, S. Pedogenic Carbonate and Soil Dehydrogenase Activity in Response to Soil Organic Matter in Artemisia ordosica Community. Pedosphere 2010, 20, 229–235. [Google Scholar] [CrossRef]
  41. Bera, T.; Sharma, S.; Thind, H.S.; Singh, Y.; Sidhu, H.S.; Jat, M.L. Soil biochemical changes at different wheat growth stages in response to conservation agriculture practices in a rice-wheat system of north-western India. Soil Res. 2018, 56, 91–104. [Google Scholar] [CrossRef]
  42. D’Hose, T.; Ruysschaert, G.; Viaene, N.; Debode, J.; Vanden Nest, T.; Van Vaerenbergh, J.; Cornelis, W.; Willekens, K.; Vandecasteele, B. Farm compost amendment and non-inversion tillage improve soil quality without increasing the risk for N and P leaching. Agric. Ecosyst. Environ. 2016, 225, 126–139. [Google Scholar] [CrossRef]
  43. Bamminger, C.; Zaiser, N.; Zinsser, P.; Lamers, M.; Kammann, C.; Marhan, S. Effects of biochar, earthworms, and litter addition on soil microbial activity and abundance in a temperate agricultural soil. Biol. Fertil. Soils 2014, 50, 1189–1200. [Google Scholar] [CrossRef]
  44. Chan, K.Y. An overview of some tillage impacts on earthworm population abundance and diversity - Implications for functioning in soils. Soil Tillage Res. 2001, 57, 179–191. [Google Scholar] [CrossRef]
  45. Lubbers, I.M.; Pulleman, M.M.; Van Groenigen, J.W. Can earthworms simultaneously enhance decomposition and stabilization of plant residue carbon? Soil Biol. Biochem. 2017, 105, 12–24. [Google Scholar] [CrossRef]
  46. Angst, G.; Mueller, C.W.; Prater, I.; Angst, Š.; Frouz, J.; Jílková, V.; Peterse, F.; Nierop, K.G.J. Earthworms act as biochemical reactors to convert labile plant compounds into stabilized soil microbial necromass. Commun. Biol. 2019, 2, 1–7. [Google Scholar] [CrossRef] [PubMed] [Green Version]
  47. Lubbers, I.M.; Jan Van Groenigen, K.; Brussaard, L.; Van Groenigen, J.W. Reduced greenhouse gas mitigation potential of no-tillage soils through earthworm activity. Sci. Rep. 2015, 5, 13787. [Google Scholar] [CrossRef] [PubMed] [Green Version]
  48. Bossuyt, H.; Six, J.; Hendrix, P.F. Protection of soil carbon by microaggregates within earthworm casts. Soil Biol. Biochem. 2005, 37, 251–258. [Google Scholar] [CrossRef]
  49. Kallenbach, C.M.; Frey, S.D.; Grandy, A.S. Direct evidence for microbial-derived soil organic matter formation and its ecophysiological controls. Nat. Commun. 2016, 7, 13630. [Google Scholar] [CrossRef]
  50. Lubbers, I.M.; Van Groenigen, K.J.; Fonte, S.J.; Six, J.; Brussaard, L.; Van Groenigen, J.W. Greenhouse-gas emissions from soils increased by earthworms. Nat. Clim. Chang. 2013, 3, 187–194. [Google Scholar] [CrossRef]
  51. Blake, G.; Hartge, K. Bulk density. In Methods of Soil Analysis. Part 1. Physical and Mineralogical Methods; Klute, A., Ed.; ASA: Madison, WI, USA; SSSA: Madison, WI, USA, 1986; pp. 363–375. [Google Scholar]
  52. Gathala, M.K.; Ladha, J.K.; Saharawat, Y.S.; Kumar, V.; Kumar, V.; Sharma, P.K. Effect of tillage and crop establishment methods on physical properties of a medium-textured soil under a seven-year Rice-Wheat rotation. Soil Sci. Soc. Am. 2011, 75, 1851–1863. [Google Scholar] [CrossRef]
  53. Yoder, R.E. A direct method of aggregate analysis of soils and the study of the physical nature of erosion losses. J. Am. Soc. Agron. 1936, 28, 337–351. [Google Scholar] [CrossRef]
  54. Kemper, W.D.; Rosenau, R.C. Aggregate stability and size distribution. In Methods of Soil Analysis. Part 1. Physical and Mineralogical Methods; Klute, A., Ed.; ASA: Madison, WI, USA; SSSA: Madison, WI, USA, 1986; pp. 425–442. ISBN 2079-0538. [Google Scholar]
  55. Abail, Z.; Whalen, J.K. Corn residue inputs influence earthworm population dynamics in a no-till corn-soybean rotation. Appl. Soil Ecol. 2018, 127, 120–128. [Google Scholar] [CrossRef]
  56. Jackson, M.L. Soil Chemical Analysis; Prentice Hall of India Pvt. Ltd.: New Delhi, India, 1973. [Google Scholar]
  57. Walkely, A.; Black, I. An experiment of the Degtareff method for determination of soil organic matter and a proposed modification of the chronic acid titration method. Soill Sci. 1934, 37, 29–38. [Google Scholar] [CrossRef]
  58. Subbiah, B.V.; Asija, G.L. A rapid procedure for the estimation of available nitrogen in soils. Curr. Sci. India 1956, 25, 259–260. [Google Scholar]
  59. Olsen, S.R.; Cole, C.V.; Watandbe, F.; Dean, L. Estimation of available Phosphorus in soil by extraction with sodium bicarbonate. J. Chem. Inf. Model. 1954, 53, 1689–1699. [Google Scholar] [CrossRef]
  60. Ribeiro-oliveira, J.P.; De Santana, D.G.; Pereira, V.J. Data transformation: An underestimated tool by inappropriate use. Acta Sci. Agron. 2018, 40, 35015. [Google Scholar] [CrossRef] [Green Version]
  61. Dekemati, I.; Simon, B.; Vinogradov, S.; Birkás, M. The effects of various tillage treatments on soil physical properties, earthworm abundance and crop yield in Hungary. Soil Tillage Res. 2019, 194, 104334. [Google Scholar] [CrossRef]
  62. Rosas-Medina, M.Á.; de León-González, F.; Flores-Macías, A.; Payán-Zelaya, F.; Borderas-Tordesillas, F.; Gutiérrez-Rodríguez, F.; Fragoso-González, C. Effect of tillage, sampling date and soil depth on earthworm population on maize monoculture with continuous stover restitutions. Soil Tillage Res. 2010, 108, 37–42. [Google Scholar] [CrossRef]
  63. Boström, U. Earthworm populations (Lumbricidae) in ploughed and undisturbed leys. Soil Tillage Res. 1995, 35, 125–133. [Google Scholar] [CrossRef]
  64. Giannitsopoulos, M.L.; Burgess, P.J.; Rickson, R.J. Effects of conservation tillage drills on soil quality indicators in a wheat–oilseed rape rotation: Organic carbon, earthworms and water-stable aggregates. Soil Use Manag. 2020, 36, 139–152. [Google Scholar] [CrossRef]
  65. Guo, Y.; Zhang, X.; Zhang, Y.; Wu, D.; McLaughlin, N.; Zhang, S.; Chen, X.; Jia, S.; Liang, A. Temporal variation of earthworm impacts on soil organic carbon under different tillage systems. Int. J. Environ. Res. Public Health 2019, 16, 1908. [Google Scholar] [CrossRef] [Green Version]
  66. Dhar, S.; Chaudhuri, P.S. Earthworm communities in paddy (Oryza sativa) fields of west Tripura (India). Proc. Zool. Soc. 2020, 73, 273–284. [Google Scholar] [CrossRef]
  67. Dixit, A.K.; Agrawal, R.K.; Das, S.K.; Sahay, C.S.; Choudhary, M.; Rai, A.K.; Kumar, S.; Kantwa, S.R.; Palsaniya, D.R. Soil properties, crop productivity and energetics under different tillage practices in fodder sorghum + cowpea – wheat cropping system. Arch. Agron. Soil Sci. 2019, 65, 492–506. [Google Scholar] [CrossRef]
  68. Guo, Y.; Fan, R.; Zhang, X.; Zhang, Y.; Wu, D.; McLaughlin, N.; Zhang, S.; Chen, X.; Jia, S.; Liang, A. Tillage-induced effects on SOC through changes in aggregate stability and soil pore structure. Sci. Total Environ. 2020, 703, 134617. [Google Scholar] [CrossRef] [PubMed]
  69. Abdallah, A.M.; Jat, H.S.; Choudhary, M.; Abdelaty, E.F.; Sharma, P.C.; Jat, M.L. Conservation Agriculture Effects on Soil Water Holding Capacity and Water-Saving Varied with Management Practices and Agroecological Conditions: A Review. Agronomy 2021, 11, 1681. [Google Scholar] [CrossRef]
  70. Gathala, M.K.; Laing, A.M.; Tiwari, T.P.; Timsina, J.; Islam, M.S.; Chowdhury, A.K.; Chattopadhyay, C.; Singh, A.K.; Bhatt, B.P.; Shrestha, R.; et al. Enabling smallholder farmers to sustainably improve their food, energy and water nexus while achieving environmental and economic benefits. Renew. Sustain. Energy Rev. 2020, 120, 109645. [Google Scholar] [CrossRef]
  71. Munera-Echeverri, J.L.; Martinsen, V.; Strand, L.T.; Cornelissen, G.; Mulder, J. Effect of conservation farming and biochar addition on soil organic carbon quality, nitrogen mineralization, and crop productivity in a light textured Acrisol in the sub-humid tropics. PLoS ONE 2020, 15, e0228717. [Google Scholar] [CrossRef]
  72. Giannopoulos, G.; Pulleman, M.M.; Van Groenigen, J.W. Interactions between residue placement and earthworm ecological strategy affect aggregate turnover and N2O dynamics in agricultural soil. Soil Biol. Biochem. 2010, 42, 618–625. [Google Scholar] [CrossRef]
  73. Li, Y.; Li, Z.; Cui, S.; Jagadamma, S.; Zhang, Q. Residue retention and minimum tillage improve physical environment of the soil in croplands: A global meta-analysis. Soil Tillage Res. 2019, 194, 104292. [Google Scholar] [CrossRef]
  74. Le Bayon, R.C.; Moreau, S.; Gascuel-Odoux, C.; Binet, F. Annual variations in earthworm surface-casting activity and soil transport by water runoff under a temperate maize agroecosystem. Geoderma 2002, 106, 121–135. [Google Scholar] [CrossRef] [Green Version]
  75. Bhadauria, T.; Saxena, K.G. Role of earthworms in soil fertility maintenance through the production of biogenic structures. Appl. Environ. Soil Sci. 2010, 2010, 816073. [Google Scholar] [CrossRef]
  76. Tripathi, R.P.; Sharma, P.; Singh, S. Influence of tillage and crop residue on soil physical properties and yields of rice and wheat under shallow water table conditions. Soil Tillage Res. 2007, 92, 221–226. [Google Scholar] [CrossRef]
  77. Kumar, V.; Kumar, M.; Singh, S.K.; Jat, R.K. Impact of conservation agriculture on soil physical properties in rice-wheat system of eastern indo-gangetic plains. J. Anim. Plant Sci. 2018, 28, 1432–1440. [Google Scholar]
  78. Galdos, M.V.; Pires, L.F.; Cooper, H.V.; Calonego, J.C.; Rosolem, C.A.; Mooney, S.J. Assessing the long-term effects of zero-tillage on the macroporosity of Brazilian soils using X-ray Computed Tomography. Geoderma 2019, 337, 1126–1135. [Google Scholar] [CrossRef] [PubMed]
  79. Chhokar, R.S.Ã.; Sharma, R.K.; Jat, G.R.; Pundir, A.K.; Gathala, M.K. Effect of tillage and herbicides on weeds and productivity of wheat under rice – wheat growing system. Crop Prot. 2007, 26, 1689–1696. [Google Scholar] [CrossRef]
  80. Bengough, A.G.; Mullins, C. Mechanical impedance to root growth: A review of experimental techniques and root growth responses. J. Soil Sci. 1990, 41, 341–358. [Google Scholar] [CrossRef]
  81. Datta, A.; Jat, H.S.; Yadav, A.K.; Choudhary, M.; Sharma, P.C.; Rai, M.; Singh, L.K.; Majumder, S.P.; Choudhary, V.; Jat, M.L. Carbon mineralization in soil as influenced by crop residue type and placement in an Alfisols of Northwest India. Carbon Manag. 2019, 10, 37–50. [Google Scholar] [CrossRef]
  82. Bhadauria, T.; Ramakrishnan, P.S. Earthworm population dynamics and contribution to nutrient cycling during cropping and fallow phases of shifting agriculture (Jhum) in north-east India. J. Appl. Ecol. 1989, 26, 505. [Google Scholar] [CrossRef]
  83. Van Groenigen, J.W.; Van Groenigen, K.J.; Koopmans, G.F.; Stokkermans, L.; Vos, H.M.J.; Lubbers, I.M. How fertile are earthworm casts? A meta-analysis. Geoderma 2019, 338, 525–535. [Google Scholar] [CrossRef]
  84. Lipiec, J.; Frac, M.; Brzezinska, M.; Turski, M.; Oszust, K. Linking microbial enzymatic activities and functional diversity of soil around earthworm burrows and casts. Front. Microbiol. 2016, 7, 1361. [Google Scholar] [CrossRef] [Green Version]
Figure 1. Bulk density (BD, Mg m−3), infiltration rate (mm h−1), and mean weight diameter (MWD, mm) under different CSA-based crop management scenarios (for a detailed description of scenarios refer to Table 1). Pars with a similar lowercase letter (s) are not significantly different at 0.05 level of probability using Tukey’s HSD test. Letters apply only within each parameter.
Agronomy 12 00658 g001
Figure 2. Soil penetration resistance (MPa) as influenced by CSA-based crop management practices. Values with a similar lowercase letter (s) with in each soil depth are not significantly different at 0.05 level of probability using Tukey’s HSD test. (for a detailed description of scenarios refer to Table 1).
Agronomy 12 00658 g002
Figure 3. Dehydrogenase (μg TPF g−1 soil h−1), acid and alkaline phosphatase (μg p-NP g−1 soil h−1) activity in soil and earthworm cast (EWC) as influenced by different CSA-based crop management scenarios (data transformed through square-root method). Pars with a similar lowercase letter (s) are not significantly different at 0.05 level of probability using Tukey’s HSD test. Letters apply only within each parameter. (for a detailed description of scenarios refer to Table 1).
Agronomy 12 00658 g003
Figure 4. PCA between earthworm density (EW. D), earthworm biomass (EW. W), and physio-chemical soil parameters after 10 years of adopting CSA-based management practices. TOC—total organic carbon, N—nitrogen, P—phosphorus, K—potassium, BD—bulk density, IR—infiltration rate, MWD—mean weight diameter, DHA—dehydrogenase, ACP—acid phosphatase, ALP—alkaline phosphatase, SPR—soil Penetration resistance, EC—electrical conductivity.
Agronomy 12 00658 g004
Table 1. Climate-smart agriculture (CSA)-based management scenarios comprised of crop rotation, tillage, crop establishment, and residue and water management.
ScenariosCrop RotationsTillageCrop Establishment MethodResidue ManagementWater Management
Sc1Rice-wheat- fallowCT-CTRice: Transplanting
Wheat: Broadcast
All residue removedRice: Flood irrigation (FI) of 5-cm depth for 1 month, followed by irrigation applied at the hair-line crack
Wheat: Need-based flood irrigation
Sc2Rice-wheat-mungbeanZTDSR-ZT-ZTRice: Drill seeding
Wheat: Drill seeding
Mungbean: Drill/relay
Full (100%) rice and Mungbean; anchored wheat residue retained on the soil surfaceRice: FI and kept soil wet for first 20 days ‘fb’ irrigation at −20 to −30 kPa matric potential
Wheat: FI at −40 to−50 kPa matric potential
Sc3Rice-wheat-mungbeanZT-ZT-ZTSame as in scenario 3Same as in scenario 3Sub-surface drip irrigation (SDI) at −20 to −30 kPa in rice and −40 to−50 kPa matric potential in wheat
Sc4Maize-wheat- mungbeanZT-ZT-ZTMaize: Drill seeding
Wheat: Drill seeding
Mungbean: Drill/relay
Maize (65%) and full mungbean; anchored wheat residue retained on the soil surfaceFI at −40 to 50 kPa matric potential in both maize and wheat
Sc5Maize-wheat- mungbeanZT-ZT-ZTSame as in scenario 5Same as in scenario 5SDI at −40 to −50 kPa matric potential in both maize and wheat
CT—conventional tillage; ZT—zero tillage; DSR—direct-seeded rice; PB—permanent beds; FI—flood irrigation; SDI—subsurface drip irrigation.
Table 2. Earthworm density (individual m−2) and biomass weight (g m−2) under long-term CSA-based management practices (data transformed through square-root method).
Scenarios †Depth 0–15 cmDepth 15–30 cm
Small (<20 mm)Medium (20–40 mm)Large (>40 mm)TotalSmall (<20 mm)Medium (20–40 mm)Large (>40 mm)Total
DWDWDWDWDWDWDWDW
Sc10.71 Bb (0) ‡0.71 B (0) 0.71 A (0)0.71 A (0)0.71 B (0) 0.71 C (0) 2.12 C (0) 0.71 C (0)0.71 B (0) 0.71 B (0) 0.71 C (0)0.71 D (0)0.71 B (0)0.71 B (0)2.12 D (0)2.12 C (0)
Sc211.92 A (144)2.79 A (7.38)4.97 A (35)2.04 A (4.71)1.44 B (3) 1.12 BC (1.09) 18.34 B (181)3.66 B (13.18) 8.30 A (69) 2.01 A (3.58) 1.44 C (3) 0.91 CD (0.41) 0.71 B (0) 0.71 B (0) 10.45 C (72) 3.63 BC (9.80)
Sc311.91 A (144)2.91 A (8.12) 5.41 A (32)2.12 A (4.38)3.98 B (16)2.70 B (7.07) 21.30 B (192) 4.47 B (19.57) 8.33 A (69) 2.05 A (3.75) 3.98 B (16) 1.59 BC (2.11)0.71 B (0) 0.71 B (0)13.02 BC (85)4.36 B (14.48)
Sc412.87 A (168)3.37 A (11.34)6.18 A (40)2.43 A (5.60)8.15 A (69) 5.42 A (30.16) 27.30 AB (277)6.80 A (47.10) 9.05 A (83) 2.20 A (4.41) 6.36 A (40) 2.43 A (5.39) 3.24 A (13) 2.38 A (6.67)18.65 A (136) 7.01 A (20.84)
Sc515.05 A (229)3.76 A (13.81)8.36 A (77)3.23 A (10.91)8.32 A (75)6.26 A (39.63)31.73 A (381)7.95 A (64.35)7.73 A (61) 2.00 A (3.65) 5.13 AB (29)2.06 AB (4.15)4.36 A (19)2.95 A (8.29)17.21 AB (109)7.01 A (16.10)
D is earthworm density and W is the biomass weight of earthworms, † refer to Table 1 for scenario description, ‡ data in parenthesis represent the original values, b means followed by a similar uppercase letter (s) within a column in a size category are not significantly different at 0.05 level of probability using Tukey’s HSD test.
Table 3. Chemical properties of soil and earthworms cast (EWC) as influenced by mid-term CSA based management practices (data transformed through square-root method).
Scenarios aEC (dS m−1)pHTOC
(%)
N
(kg ha−1)
P
(kg ha−1)
K
(kg ha−1)
SoilEWCSoilEWCSoilEWCSoilEWCSoilEWCSoilEWC
Sc10.86 Ab (0.23) *0.71 C2.83 A (7.49)0.71 D1.07 B
(0.65)
0.71 B11.73 C (137)0.71 D5.26 A (27)0.71 D13.18 A (173)0.71 B
Sc20.87 A (0.25)1.11 A (0.74)2.82 A (7.44)2.80 A (7.34)1.20 A (0.95)1.53 A (1.84)12.40 ABC (154)13.07 AB (170)5.39 A
(29)
7.17 AB (51)14.45 A (209)23.99 A (578)
Sc30.85 A (0.22)1.11 A (0.74)2.79 A
(7.30)
2.75 B (7.05)1.21 A (0.97)1.53 A (1.83)12.73 AB (162)12.74 B (162)5.52 A (30)7.57 A (57)14.22 A (202)22.88 A (524)
Sc40.86 A (0.24)0.94 B (0.40)2.81 A
(7.38)
2.69 C (6.75)1.20 A (0.93)1.59 A (2.04)12.22 BC (149)12.57 B (158)5.75 A
(33)
6.82 B (46)14.39 A (207)23.33 A (545)
Sc50.89 A (0.28)0.96 B (0.42)2.75 A
(7.08)
2.68 C
(6.67)
1.26 A
(1.08)
1.57 A
(1.95)
13.02 A
(169)
13.38 A
(179)
5.94 A (35)7.01 B (49)15.10 A (228)23.30 A (544)
EC—electrical conductivity; TOC—total organic carbon; N—nitrogen; P—phosphorus, K—potassium; EWC—earthworms cast; a refer to Table 1 for scenario description; * data in parenthesis represent the original values; b means followed by a similar uppercase letter (s) within a column in a size category are not significantly different at 0.05 level of probability using Tukey’s HSD test.
Table 4. Significance effect of different management practices and their linear contrast and interactions on earthworm density, earthworm biomass weight, physio-chemical, and enzymes’ activities under long-term CSA-based management practices.
ParametersDepth or Soil-CastLinear ContrastInteractions
CT vs. ZTFI vs. SDIRW vs. MWScenarioDepth/Soil-CastScenario * Depth/Soil-Cast
Earthworm density (No. m−2)0–15**************
15–30*******
Earthworm biomass weight (g m−2)0–15******************
15–30********
EC (dS m−1)SoilNSNSNSNS***NS
Cast*****NS
pHSoilNS**NS****
Cast*********
TOC (%)Soil*****************
Cast*********
N (kg ha−1)Soil***NS***NS**
Cast*********
P (kg ha−1)SoilNSNSNS****NS***
Cast*********
K (kg ha−1)Soil***NS*******
Cast*********
DHA (μg TPF g−1 soil h−1Soil***NS**NSNS**
Cast*********
ACP (μg p-NP g−1 soil h−1)SoilNSNS***NS***
Cast*********
ALP (μg p-NP g−1 soil h−1)SoilNSNSNS*NS*
Cast*********
BD (Mg m−3)-*NS**---
IR (cm h−1)-*****---
MWD (mm)-***NS---
SPR (MPa)-NS***---
CT—conventional tillage, ZT—zero tillage, PB—permanent bed, FI—flood irrigation, SDI—sub-surface drip irrigation, RW—rice-wheat, MW—maize-wheat, EC—electrical conductivity, TOC—total organic carbon, N—nitrogen, P—phosphorus, K—potassium, DHA—dehydrogenase, ACP—acid phosphatase, ALP—alkaline phosphatase, BD—bulk density, IR—infiltration rate, MWD—mean weight diameter, SPR—soil penetration resistance. NS = Not Significant. * Significant at p < 0.05, ** significant at p < 0.05, *** significant at p < 0.01.
Publisher’s Note: MDPI stays neutral with regard to jurisdictional claims in published maps and institutional affiliations.

