Article

Variability of Root System Size and Distribution among Coffea canephora Genotypes

by
Raquel Schmidt
1,
Larícia Olária Emerick Silva
1,
Adesio Ferreira
1,
Ivoney Gontijo
2,
Rubens José Guimarães
3,
José C. Ramalho
4,5 and
Fábio Luiz Partelli
2,*
1
Centro de Ciências Agrárias e Engenharias, Universidade Federal do Espírito Santo, Alto Universitário, Alegre CEP 29500-000, Brazil
2
Departamento de Ciências Agrárias e Biológicas (DCAB), Centro Universitário do Norte do Espírito Santo (CEUNES), Universidade Federal Espírito Santo (UFES), Rod. BR 101 Norte, Km 60, Bairro Litorâneo, São Mateus CEP 29932-540, Brazil
3
Departamento de Agricultura, Campus Universitário, Universidade Federal de Lavras, Lavras CEP 37200-000, Brazil
4
Plant Stress & Biodiversity Lab, Centro de Estudos Florestais (CEF), Instituto Superior de Agronomia (ISA), Universidade de Lisboa (ULisboa), Quinta do Marquês, 2784-505 Oeiras, Portugal
5
Geobiociências, Geoengenharias e Geotecnologias (GeoBioTec), Faculdade de Ciências e Tecnologia (FCT), Universidade NOVA de Lisboa (UNL), 2829-516 Caparica, Portugal
*
Author to whom correspondence should be addressed.
Agronomy 2022, 12(3), 647; https://doi.org/10.3390/agronomy12030647
Submission received: 30 January 2022 / Revised: 18 February 2022 / Accepted: 28 February 2022 / Published: 7 March 2022
(This article belongs to the Special Issue Coffee—from Plant to Cup)

Abstract

:
This work aimed to evaluate the variability in the distribution of the root system among genotypes of C. canephora cv. Conilon and indicate management strategies for a more efficient mineral fertilization. Root distribution was evaluated in six genotypes. The experimental design was in randomized blocks with three replications. Soil monoliths measuring about 27 cm3 were collected at six different soil depths, at three row distances and nine distances of inter-row planting. The collections were carried out in one plant of each repetition. In total, 1296 samples were evaluated. The roots were washed, digitized and processed to quantify length density, volume, surface area and diameter. The distribution of the root system was characterized using semivariograms. It was observed that the highest concentration of roots occurred in the distances close to the irrigation drippers. There was variation in the distribution of the root system among the genotypes. However, in general, the root system is concentrated at a depth of 0 to 20 cm in the soil, at distances up to 50 cm in the planting row and up to 60 cm in inter-rows. Therefore, the greatest efficiency in nutritional management can be achieved by applying fertilizers within a radius of 50 cm around the plant.

1. Introduction

The Coffea arabica and Coffea canephora species are widely cultivated in the tropical region. The production and trade basis of coffee, one of the main commodity products on the international scene, is considered in this study. In 2020/21, around 10.18 million tons of green coffee from the two species was produced worldwide [1]. About 29% was produced in Brazilian plantations, of which C. canephora represented about 34% (that is, 0.98 million tons) [2].
The C. canephora species is diploid (2n = 2x = 22 chromosomes), allogamous and self-incompatible, with self-incompatibility controlled by the S. allele. These characteristics promote high heterogeneity in natural coffee fields of seminal origin [3,4]. Despite exhibiting some genotype dependency, the Conilon coffee cultivar stands out in the world scenario mainly for its robustness and ability to acclimate to different environmental constraints [5,6,7,8]. Therefore, this species is expected to have some capability to endure the ongoing and future climate changes, largely associated with a more frequent exposure to abiotic stress, namely, to unfavorable temperature and water availability conditions, which are also the main constraints for this crop’s sustainability [9].
The development of new varieties of Robusta and Conilon coffee, genetically characterized and with reproduction via cloning, has directly contributed to the advancement of coffee growing in Brazil, the second largest C. canephora producer worldwide [10,11]. The large number of new Conilon and Robusta genotypes has also greatly contributed to the generation of new hybrids, ensuring the necessary heterogeneity in crops to allow for the self-incompatibility of this species.
There are a number of attributes that are usually used to evaluated and select promising materials for cultivation with high productive and environmental stress acclimation capabilities [12]. Among them, the coffee tree root system has been targeted in studies of genetic improvement programs, with the aim of selecting more productive materials with greater endurance/adaptability. Plants with a deeper and well-developed root system are likely to be better adapted to environments with water and nutritive scarcity, in addition to ensuring better plant fixation in the soil due to its higher root/shoot ratio [13,14,15,16].
There are studies in the literature showing that in Conilon coffee crops that use localized irrigation systems (such as drip systems), it is common for root development to be concentrated mainly in the “wet bulb” region of the soil [14,17]. Consequently, when broadcast fertilization is carried out, the ability of plants to absorb nutrients outside the irrigated area may become restricted. In this sense, it is important to understand the root distribution between different genotypes so that nutritional management is more efficient.
Studying root systems is a heavy cost and laborious process that usually requires uprooting the plants, which can become disadvantageous in the field and in perennial crops such as coffee [15,18]. Tools such as root imaging diagnosis and geostatistics make it possible to map the dynamics of root profiles, ant to expand our knowledge regarding the distribution roots for nutritional and water absorption [14,19]. Therefore, knowing the spatial distribution of the roots along the soil profile both vertically and horizontally on the scales between the plants and between the planting lines (greater spacing) allows one to relate the distribution of roots in the soil profile to the plant capacity to explore the soil to nutrients and water ratio. In this context, this work aimed to evaluate the variability in the distribution of the root system among genotypes of C. canephora cv. Conilon and indicate management strategies for more efficient mineral fertilization.

2. Materials and Methods

2.1. Plant Material and Experimental Design

This study was carried out in the municipality of Nova Venécia, northern Espírito Santo state, Brazil (18°39′43″ S, 40°25′52″ W and 199 m asl). The average annual temperature in the region is 23° C, with an Aw climate, tropical with hot and humid summer and dry winter, according to Köppen’s classification [20]. Plant cropping systems were installed in commercial stands. The soil of region was classified as Yellow Latosol, according to the Brazilian Soil Classification System [21], with the physical and chemical characteristics as given in Table 1.
Coffee seedlings with about five pairs of leaves were transplanted in May 2014 with a spacing of 3 m × 1 m, which corresponds to a cultivation density of 3.333 coffee trees per hectare. To standardize the number of stems per plant, formation pruning was performed, where each plant remained with four orthotropic stems (13.332 stems ha−1), and the cleaning pruning of plagiotropic branches was carried out after each harvest. Agricultural management was carried out in order to meet nutritional and phytosanitary needs. Liming and fertilization were performed according to regional recommendations [22]. The annual fertilizations of N, P2O5 and K2O were 500, 100 and 400 kg ha−1, respectively. In relation to soil micronutrients, a total of 2 kg ha−1 of Zn, 1 kg ha−1 of B, 2 kg ha−1 of Cu and 10 kg ha−1 of Mn were applied annually. The culture was maintained under adequate water availability by means of a drip irrigation system since implantation.
In this experiment, we evaluated six genotypes of C. canephora Pierre ex A. Froehner cv. Conilon (AD1, Valcir P, Peneirão, Z21, A1 and P2), which were arranged in randomized blocks with three replications. The choice of genotypes was based on the average production capacity of five crops, the last being in 2020. The AD1, Valcir P, Peneirão, Z21, A1 and P2 genotypes had an average production of 116, 75, 105, 102, 106 and 124 bags per hectare, respectively. The studied genotypes were selected from the varieties Tributum, Andina, and Monte Pascoal from a group of 43 genotypes under evaluation [10,11,23].

2.2. Root Traits

Soil monoliths measuring about 27 cm3 were collected using auger type (tubular) at six different soil depths (0–10, 10–20, 20–30, 30–40, 40–50 and 50–60 cm). According to Santos et al. [24], up to 60 cm depth is the main region where water absorption and root emission occur. Moreover, soil monoliths were collected at three distances in the planting row (16, 32 and 48 cm) and nine distances in inter-row planting (16, 32, 48, 96, 112, 128 and 144 cm), both obtained from of the plant stem. For all distances, soil monoliths were collected at the six depths described above. The collections were made in one plant of each repetition. A total of 1296 samples was evaluated (6 genotypes × 3 replicates × 6 depths × 12 distances). These sampling distances were defined to know the dynamics and expansion capacity of the roots between the planting lines where fertilization and irrigation did not occur [14].
The samples were placed in plastic bags, sealed, and stored at –10° C for further evaluation. Then, the samples were washed in running water in a 30-mesh sieve (0.595 mm) to separate the roots from the soil. Roots with a diameter above 3 mm were excluded from the data set as they were considered outliers.
Roots were later digitized with a Nikon 18.2 MP camera (images were taken 50 cm above the roots), and the resulting images were analyzed with the Safira program [25]. The following characteristics were evaluated: root length density (mm cm−3), root volume (mm3 cm−3), root surface area (mm2 cm−3) and root diameter (mm).

2.3. Statistical Analyses
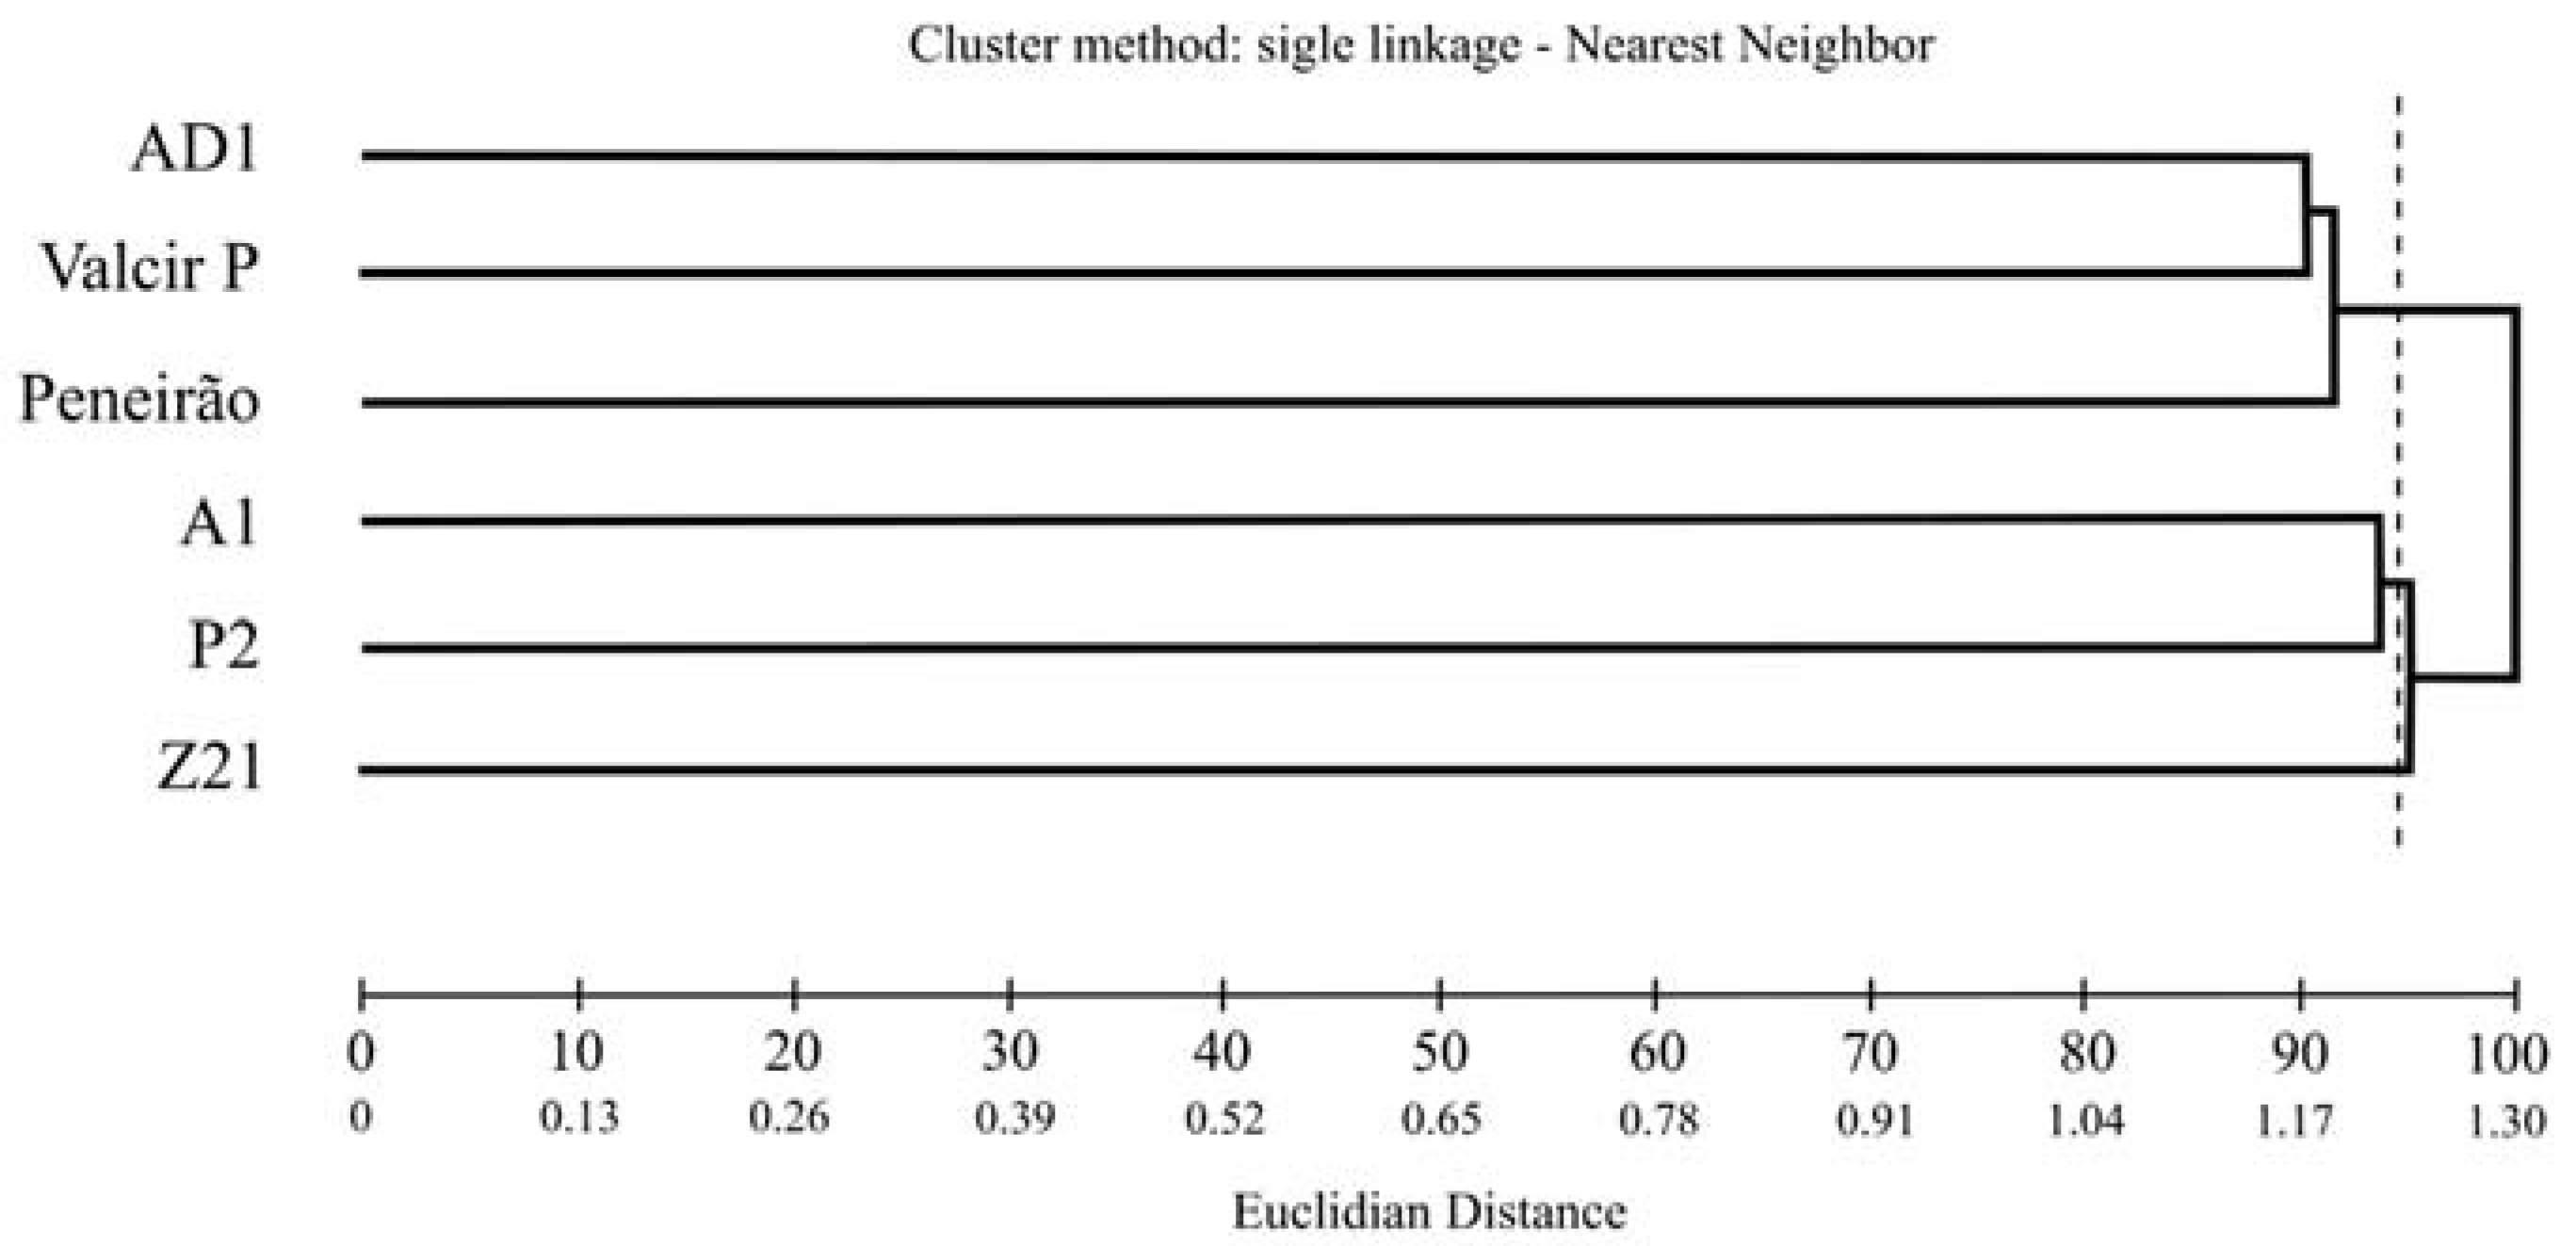
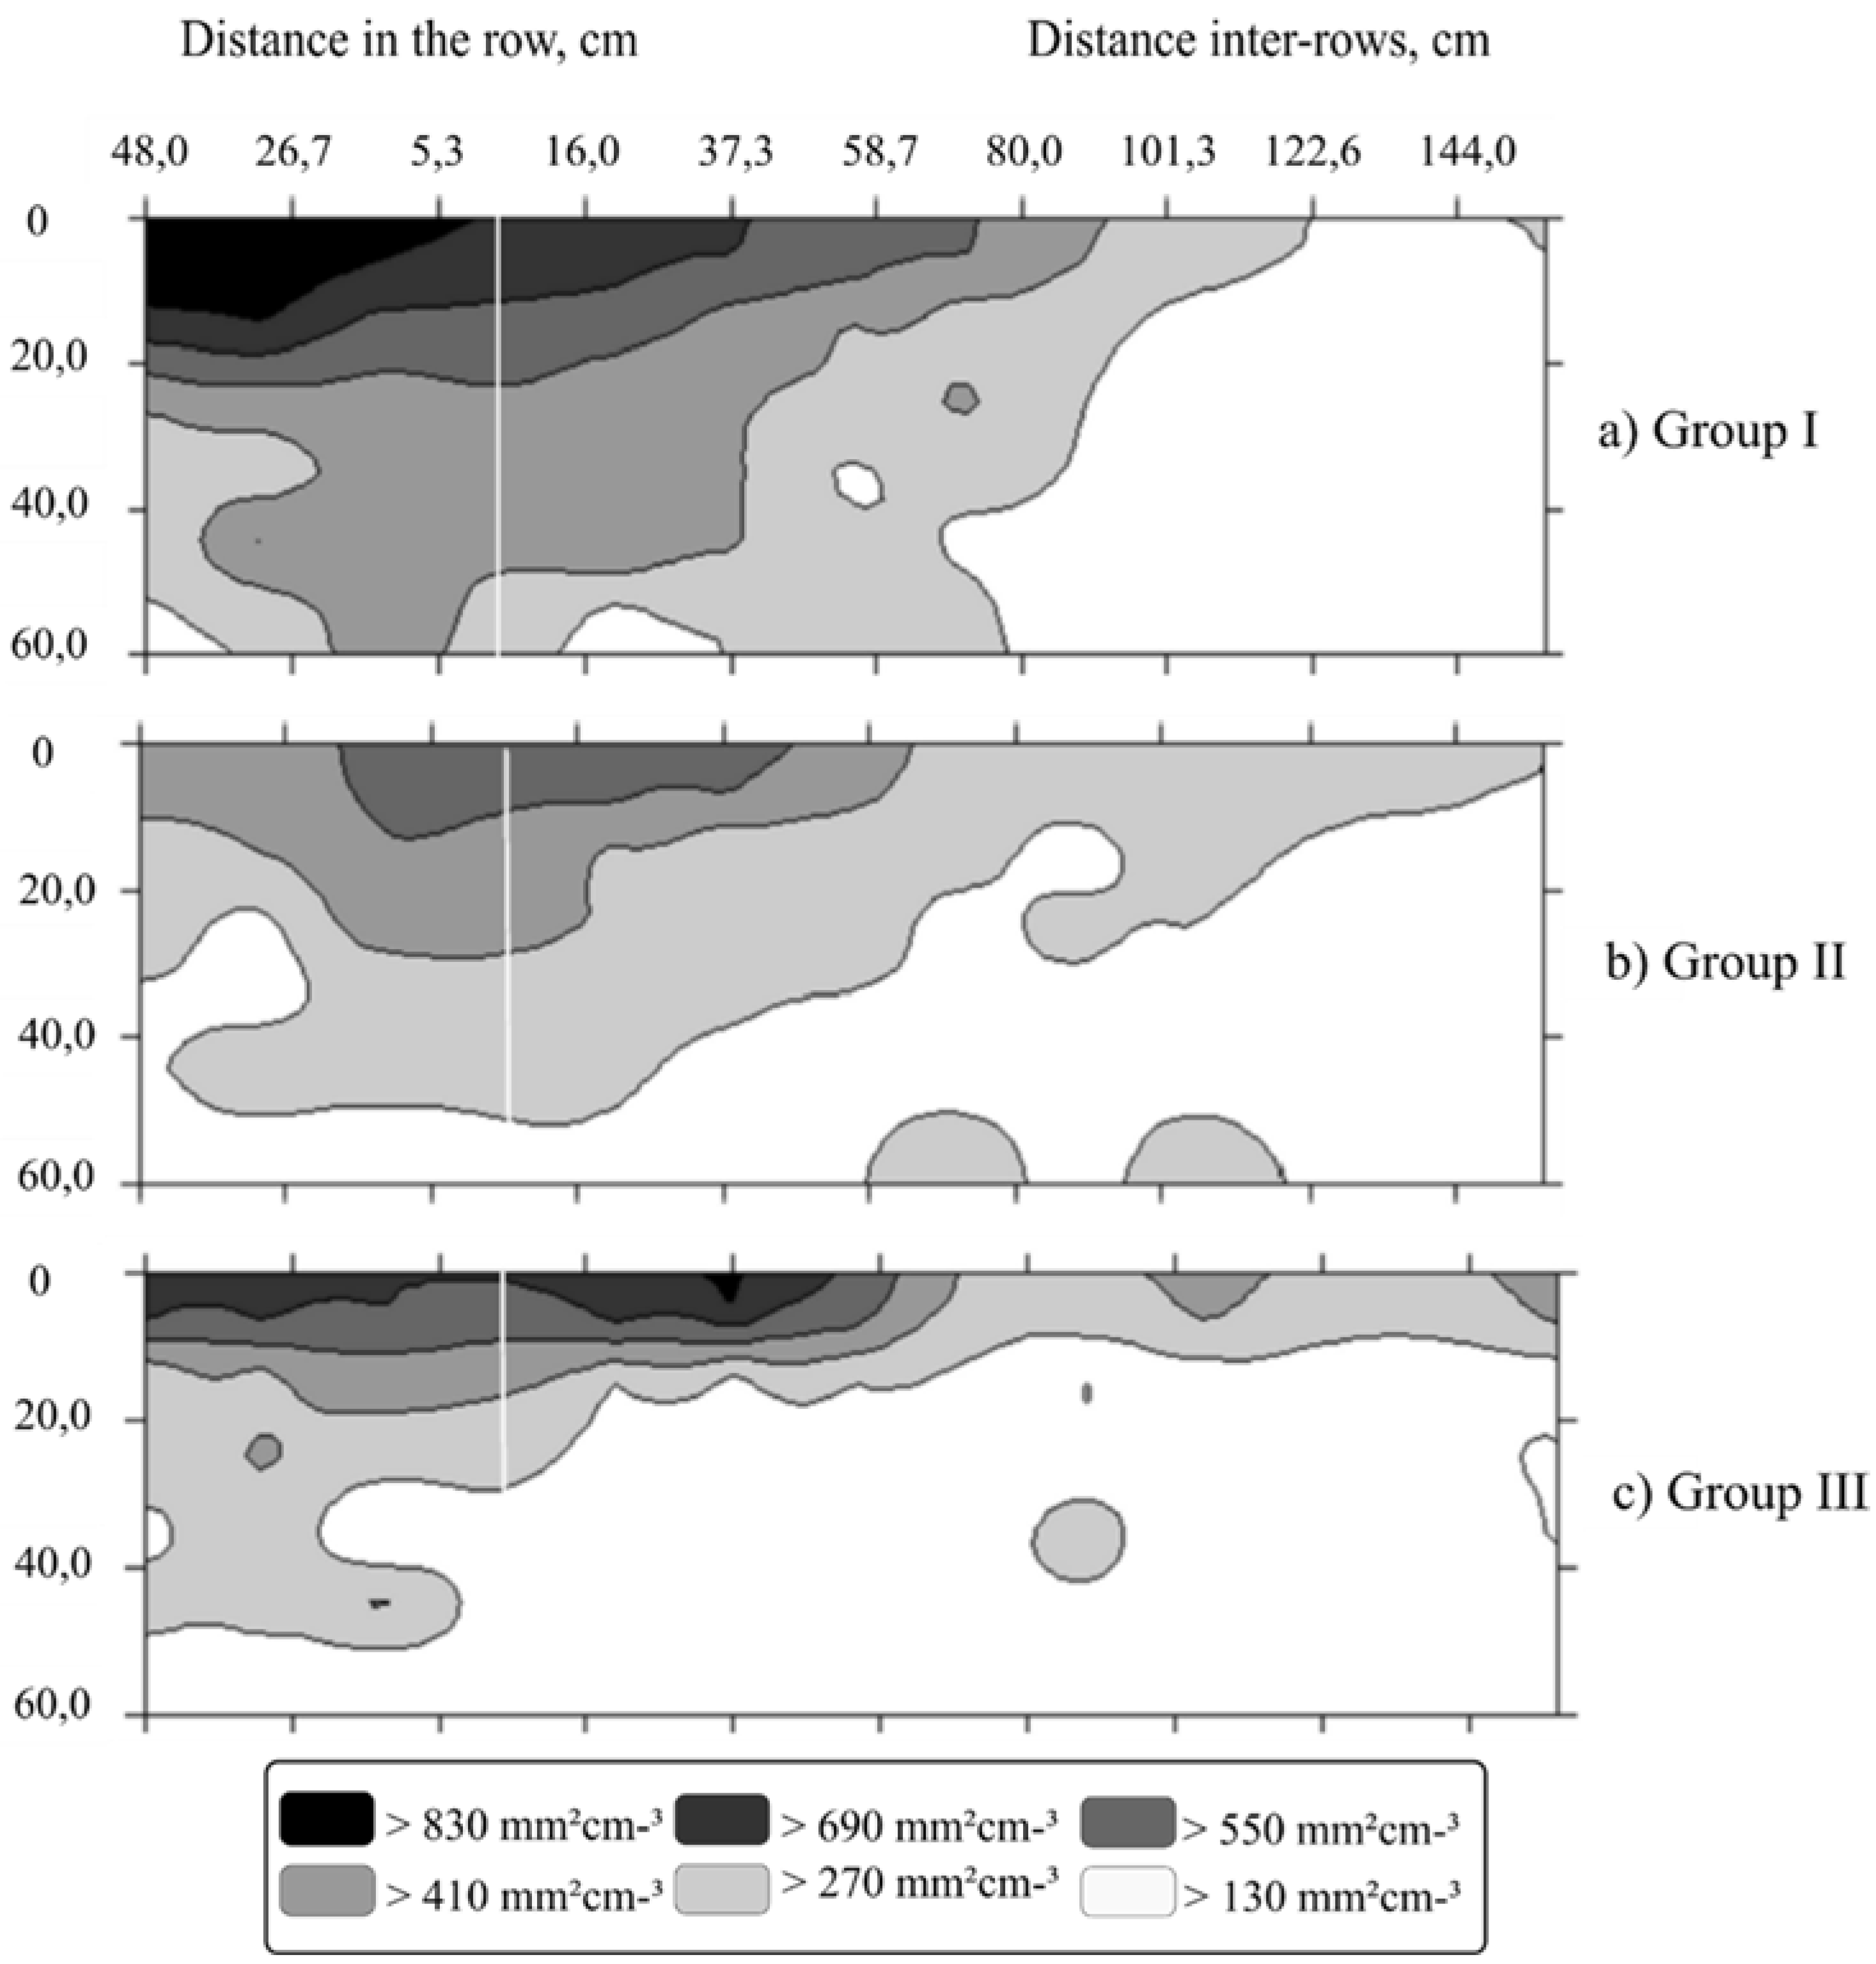
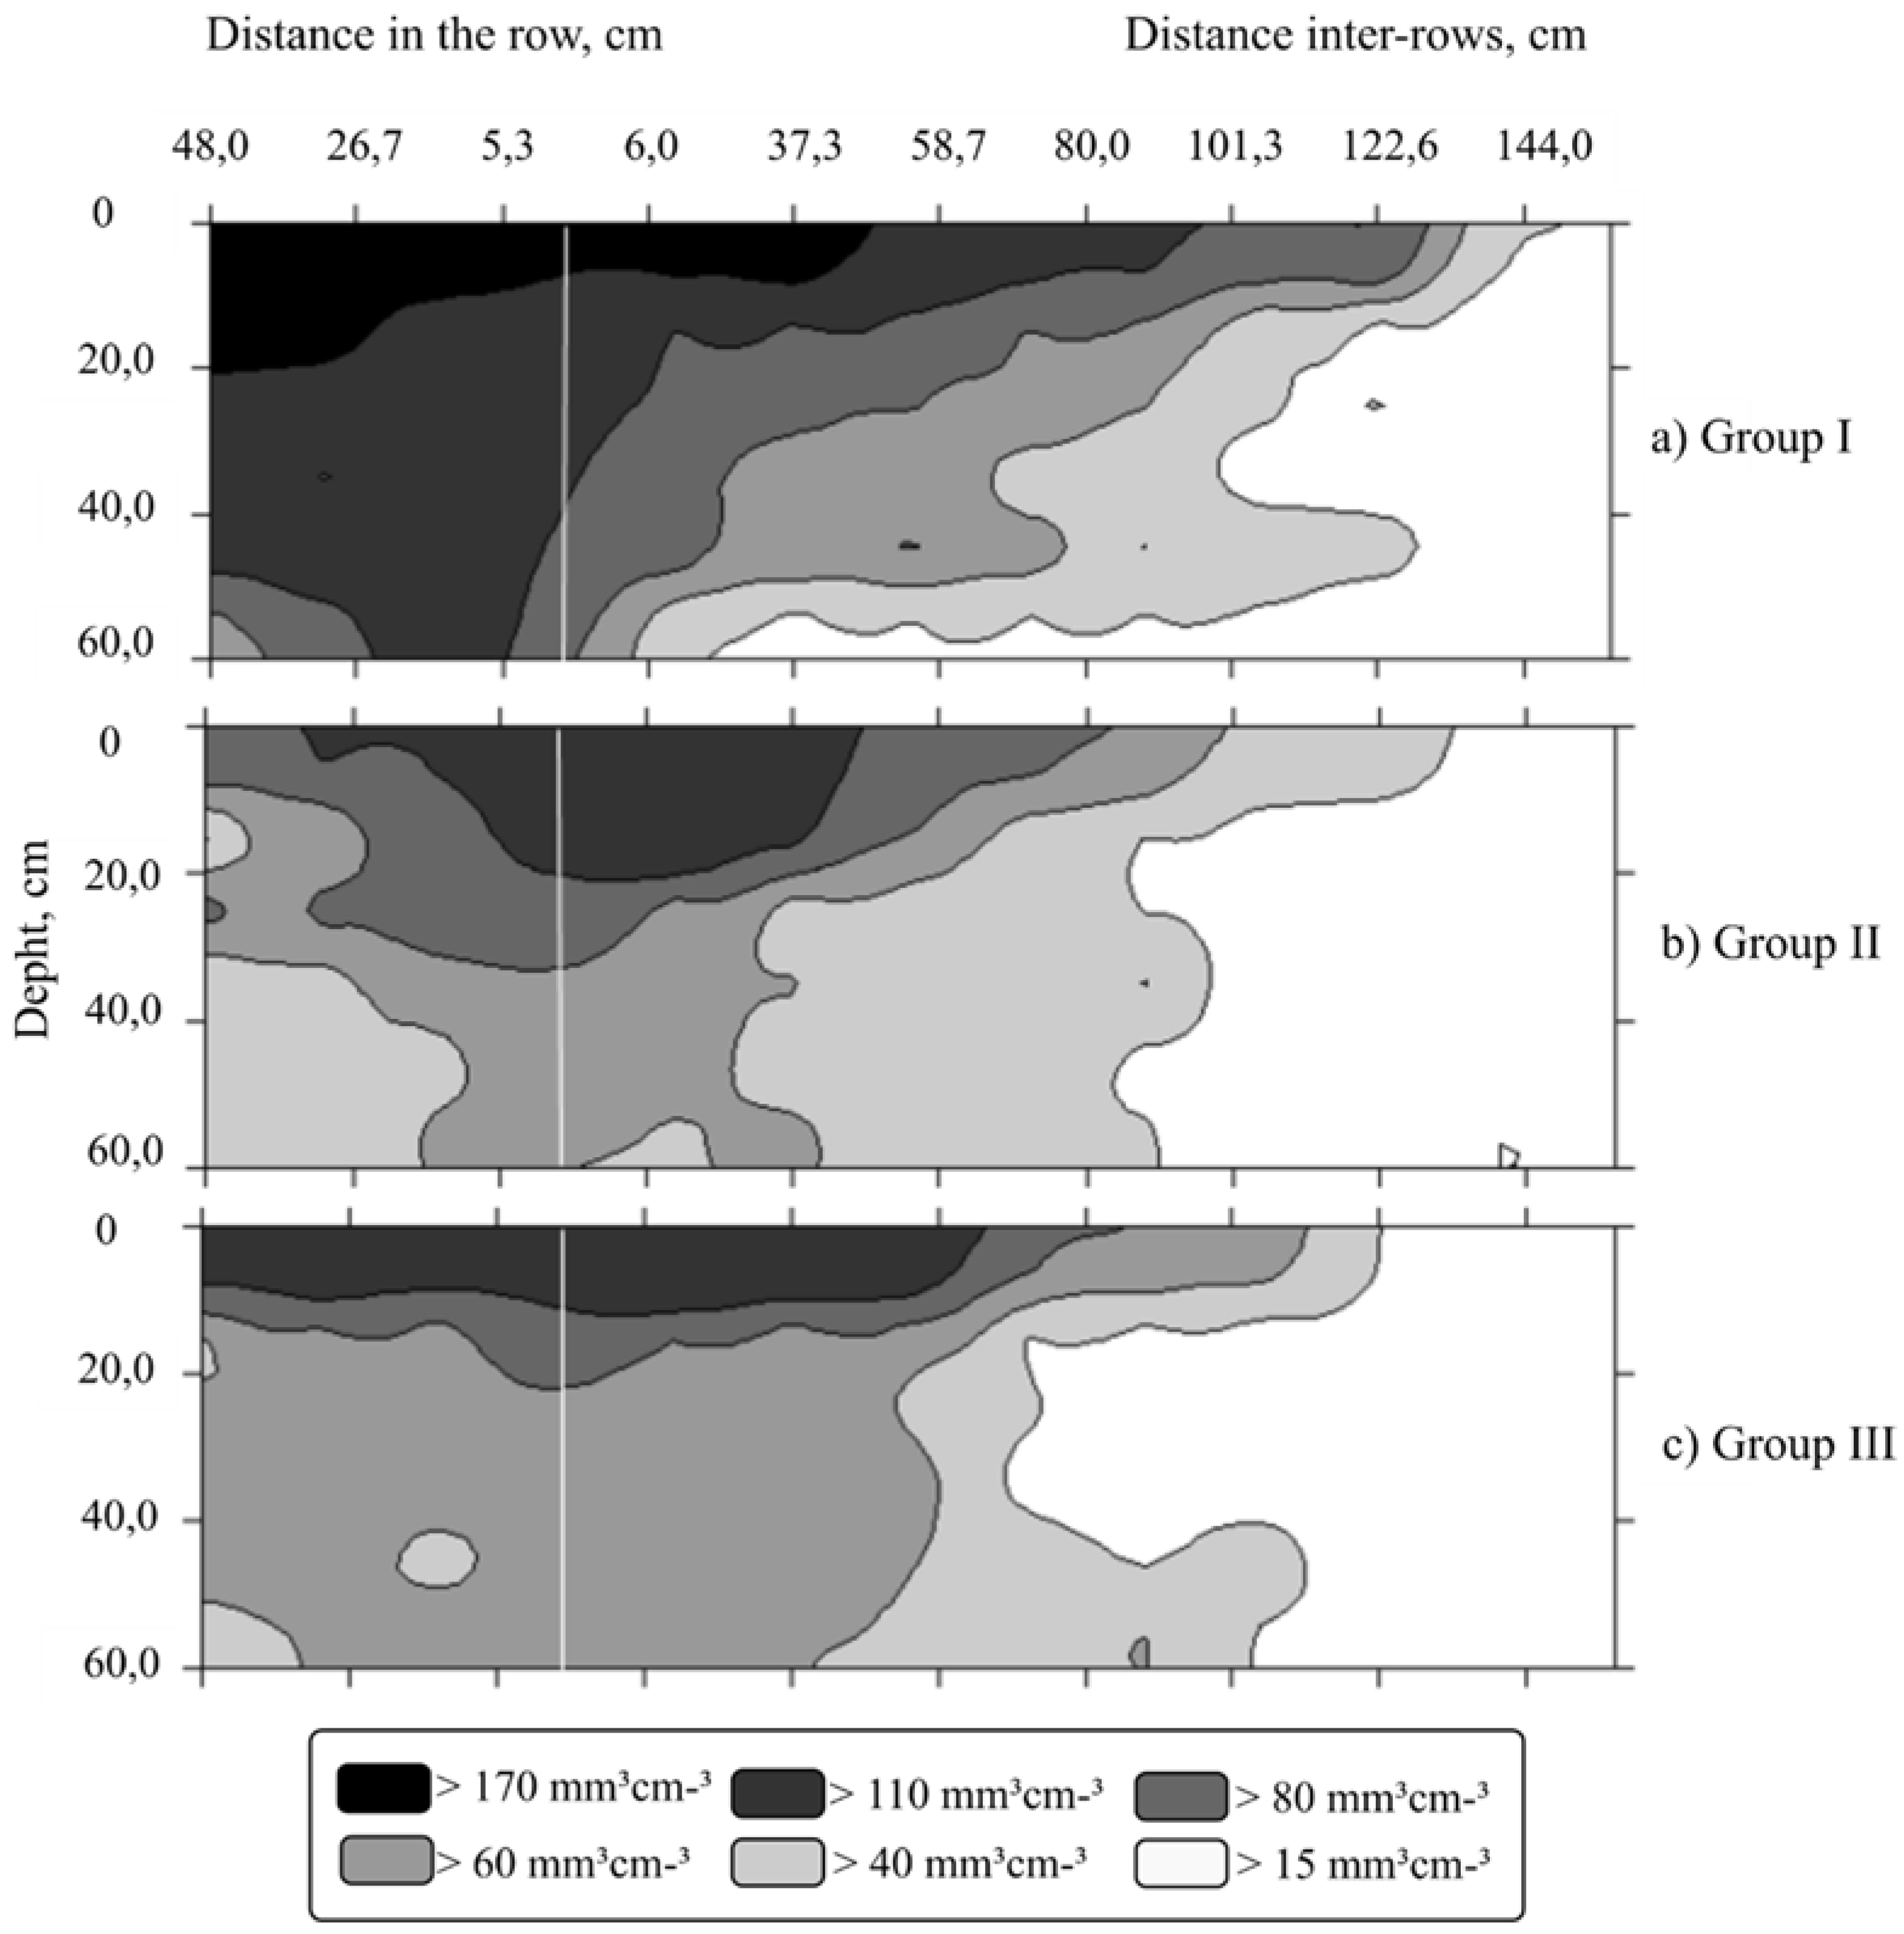
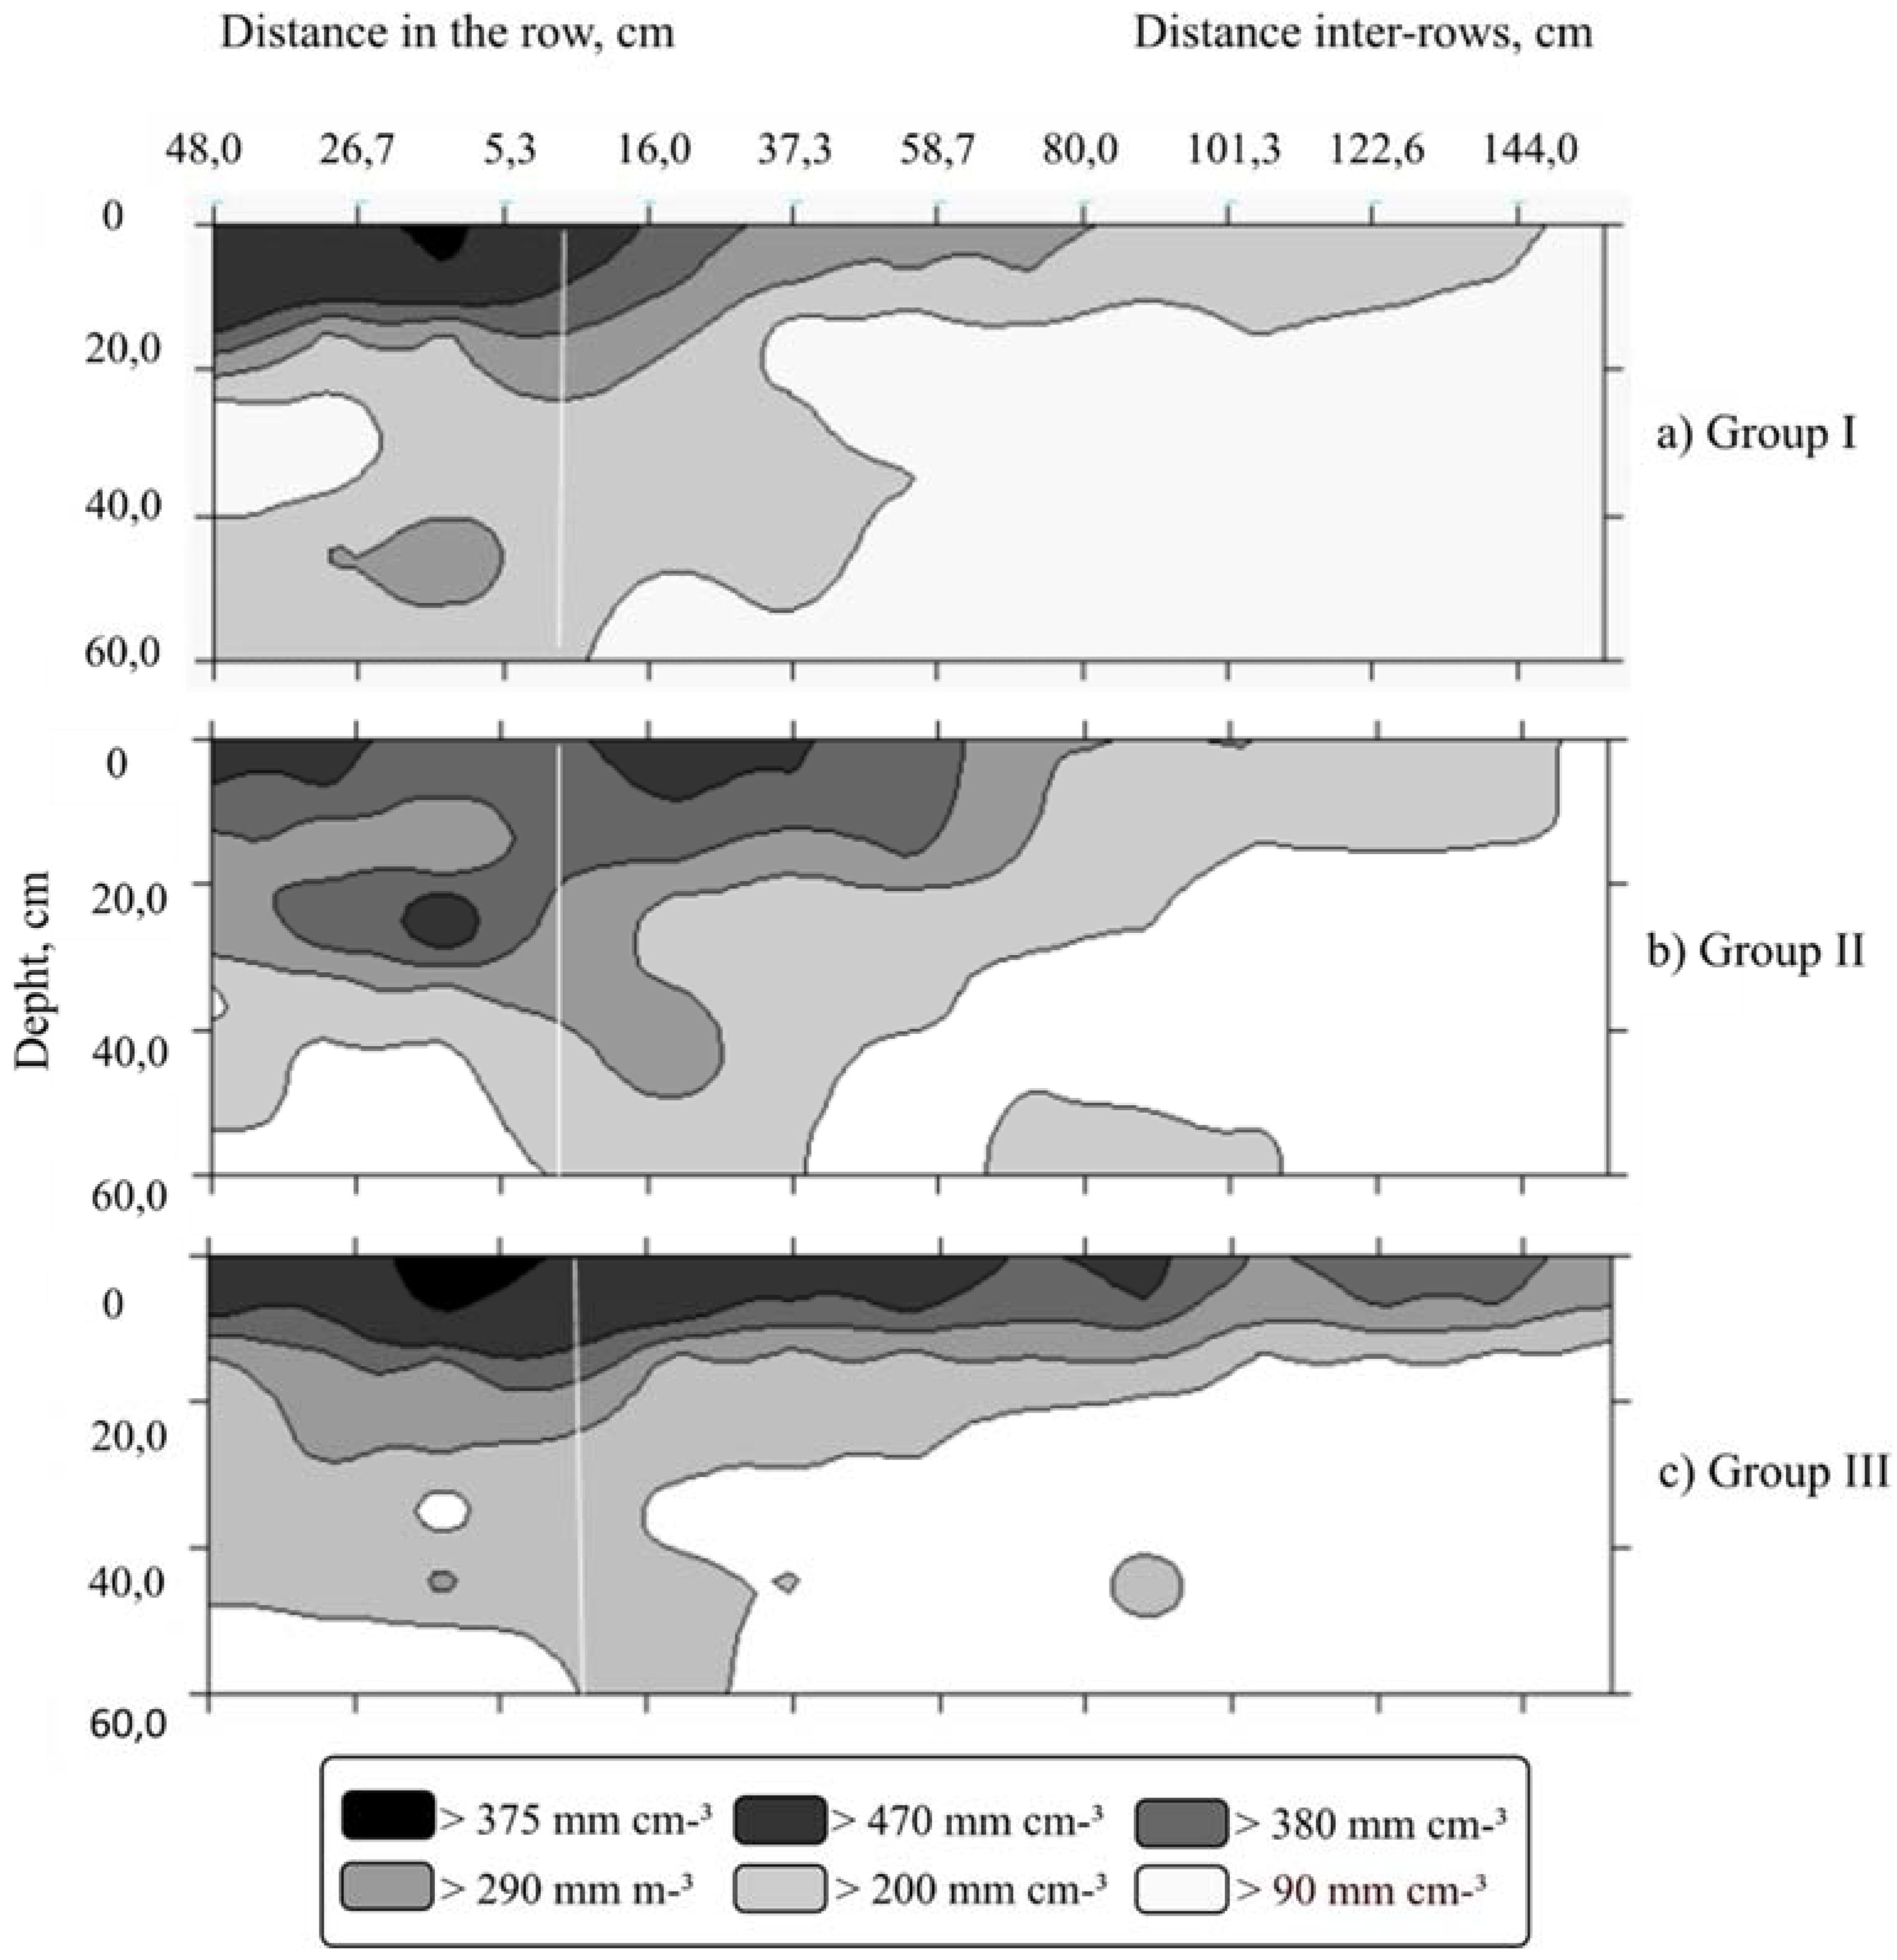
For the statistical analyses, data normality and homoscedasticity were verified, followed by analyses of the mean Euclidean distance and posterior grouping of genotypes by the method of single-link, nearest neighbor grouping. The R program was used for performing these analyses [26].
After grouping the genotypes, the spatial variability of the evaluated attributes was characterized using a geostatistical technique: the semivariogram [27]. The analysis of spatial dependence was performed by geostatistics, with the help of the GS + 7.0 program [28], which performs the calculation of sample semi-variance, which was estimated by the equation:
γ   ( h ) = i = 1 ( h ) [ z   ( x i + h ) z   ( x i   ) ] ²   2 n   ( h )
where γ (h) is the semivariogram function, n (h) is the number of sample pairs [z (xi); z (xi + h)] separated by vector h, and z (xi) and z (xi + h) are the numerical values of the analyzed attribute observed for points xi and xi + h separated by vector h.
The semivariograms were fitted by testing the spherical, exponential and Gaussian model, and their parameter nugget effect (Co), plateau (C), reach (Co + C) and range were determined. To choose between more than one model for the same semivariogram, the highest value of the correlation coefficient obtained by the cross-validation method was considered [29]. The spatial dependence index (SDI) showed the percentage ratio of Co in relation to Co + C and was evaluated by the equation:
SDI   = C o C o 100
SDIs were rated as: strong, ≤ 25%; moderate, 25 to 75%; and weak, ≥ 75% [19]. Kriging was performed using the Surfer program (Golden Software, LLC, USA), and variable maps from spatial distribution data were developed.

3. Results

Based on characteristics of the root system (root length density, root volume, root surface area and root diameter), for the evaluated distances to the plant and soil depths, the genotypes were divided into three groups considering a cutoff point of 96.23% of dissimilarity in the dendrogram, as recommended by Mojena [30]. Group I—AD1, Valcir P and Peneirão genotypes; Group II—A1 and P2 genotypes; Group III—Z21 genotype (Figure 1).
The variables root surface area, root volume per soil volume and root length density of these three groups of C. canephora genotypes showed dependence from the kriging analysis (Table 2). Only the root diameter variable did not show such dependence, thus not contributing to this study of the spatial arrangement of roots. The spatial dependence index (SDI) was less than 25% for all variables studied within the genotype groups (Table 2), indicating a high degree of spatial dependence. The coefficient of determination R2 of all groups and characteristics was greater than 0.9 and particularly close to 1 root length density, reflecting great reliability as regards the equation used to determine the models.
The cross-validation coefficients (RCV) ranged from 0.924 to 1.106, which indicates that the models and adjustments adopted were adequate enough to represent the spatial characteristic of the attributes evaluated for each genotype group. The residual sum value of the mean square RSS was also used as a parameter for choosing the model to be used.
The semivariograms were fitted to the spherical model for the three groups in the characteristic root surface area and root length density; for root volume, only for Group III was it better adjusted in the Gaussian form (Table 3).
The genotype groups showed a quite distinct distribution of the root system in the soil profile up to 60 cm depth. In Group I (Figure 2), the plants showed a more uniform root distribution in the soil profile (although with a higher concentration in the superficial layers, that is, up to ca. 20 cm), together with a higher global root concentration. Moreover, strong root presence occurred up to about 70 cm away from the stem of the plant in the planting line. Therefore, these plants denoted a good soil exploitation both in the surface as well in depth (up to 50–60 cm) with 27% in the superficial layer and 11% in the deeper layers evaluated.
The plants of Group II (Figure 2) showed the root system distributed in the first superficial layer (0–10 cm), and an extended presence in the inter-row space up to 1.44 m, although not in great depth. There was a predominance of the root system in the 0–30 cm layers, where about 70% of the root surface area was found.
The plants of Group III (Figure 2) presented the most superficial root system, with the root system evenly distributed in the 0–10 cm layer along with an extended presence in the inter-row up to 1.44 m of the plant trunk with around 34% of the observed surface area. For the deeper layers in the row, root emission was mostly uniformly from 30 to 50 cm.
With regard to the spatial distribution of roots in the volume of roots per volume of soil, plants in Group I (Figure 3) showed the highest values at all distances and depths. It was particularly clear at distances from 20 to 48 cm in the line where there were higher values of root surface. This uniform spatial distribution was reflected in the presence of 70% of the entire root volume up to 50 cm in depth. In the vicinity (5 cm) of the stem, the root system is not prominent, both in the planting row and inter-rows.
In the plants of Group II (Figure 3), the volume of roots was concentrated close to the plant stem and in the more superficial layers, 0–20 cm, with 60% of the root volume concentrated up to 30 cm depth, but with a relevant presence up to 60 cm, for both within the row and inter-rows.
In the plants of Group III (Figure 3), the root volume per soil volume was greater until 20 cm depth (mainly in the 0–10 cm layer), both in the row (until 50 cm) and in the inter-row space (until ca. 65 cm). The plants of this group showed greater uniformity between the depths analyzed with 27% of the root volume observed in the 0–10 cm layer.
For the root length density characteristic, distinct responses were observed between groups. The plants of Group I (Figure 4) showed the great values in the most superficial soil (0–10 cm) and up to 48 cm in the planting line; moreover, about 44% of the root length is in the 0–20 cm beds. On the other hand, in the inter-row direction, shorter roots can be observed in surface-layer soil (0–10 cm) along the evaluated distances, reaching up to 1.44 m away from the plant stem.
In the plants of Group II (Figure 4), unlike Group I, it was possible to observe medium-to-short roots throughout the profile (0–60 cm) analyzed, and along the inter-row remained the short roots in the superficial layers (0–20 cm). About 42% of the longest roots observed in this group of genotypes are located at a depth of 0–20 cm.
In the plants of Group III, the smaller size of roots was observed as the depth of evaluation and the distance observed increased; 35% of the roots of the plants in this group are located at depth 0–10 cm (Figure 4C). However, from the 30 cm layer onwards, there was a predominance of short roots close to the coffee tree stem. Only 10% of roots were located in the deepest layer, 50–60 cm; such roots were considered short and whitish.

4. Discussion

In genetic improvement programs, one should identify similar and distinct genotypes, as the more heterogeneous the population, the greater the possibilities of selecting individuals who are not related. Conilon coffee genotype groupings using genetic distances are important for crops and to ensure that flower cross-fertilization occurs, which will consequently result in higher productivity [12].
These six genotypes emerged from a group of 43 genotypes as regards their high rusticity observed in the biometric characteristics of the aboveground part of the plants and productive capacity [31,32]. In these works, the genotypes were grouped differently in relation to the actual study, where we grouped the genotypes according to their root system distribution, which resulted in three distinct groups.
The Z21 genotype remained isolated in one group. In previous trials, this genotype constituted larger groups, that is, it was formed by more genotypes (in addition to Z21) for characteristics of the root system. Silva et al. [16] observed a similarity between the Z21 and L80 genotypes, at a distance of 30 cm from the plant stem. For this second evaluation moment, the plants of the L80 genotype went through the programmed cycle pruning process, being discarded by the analysis requirements of this study. As for the biometric characteristics evaluated by Dubberstein et al. [31] verified the isolation of this genotype for the characteristics plant height and orthotropic branch length Z21.
The application of geostatistical techniques can contribute to the analysis regarding the development of root systems, especially in perennial crops such as coffee in which the evaluation of the root system without damaging the plant is difficult [15].
The results show that the spherical model was the best at representing the behavior of the spatial distribution of root attributes for all groups (Table 3), in agreement with reports showing that model as the most used to describe the relationships of soil [33]. For the initial selection of the best models, the following were mainly considered: the smallest residual sum of squares (RSS), the largest coefficient of determination of the adjusted model, and the highest values of the cross-validation regression coefficient between real and estimated data. Faraco et al. [34], studying several criteria for the validation of soil attributes, concluded that cross-validation was the most appropriate method for choosing the best fit.
The root systems in Conilon coffee plants can be considered shallow and well distributed horizontally [19]. This pattern was previously observed [13,13,16,19], and could be due to the cloning system, which it is not limited to a single pivot root, as observed in Arabica coffee trees, because their propagation is primarily by seeds [13,19].
Soil fertility and the management adopted in the planting row and the inter-row planting lines can influence the spatial root arrangement. When different genotypes receive the same cultural treatments, and yet there is variation in the spatial root arrangement, it is believed that this variation is due to the genetic constitution of the plant [35].
In this planting, the irrigation drippers are located every 50 cm towards the planting line, it was observed that the root system tends to be located preferably in the vicinity of the drippers. This influences the distribution of the root system in the line. In the distance from 30 to 48 cm, there is a higher concentration of roots compared to the proximity of the coffee stem. This behavior was observed at depths of up to 40 cm with considerable root volume in Group I (Figure 3). According to Covre et al. [14], the drip irrigation system promotes greater distribution of roots in irrigated plants, in the zone by the irrigation wet bulb. The non-irrigated plants presented greater surface area, length, and volume of roots per volume of soil, as well as less discrepant root distribution in the horizontal and vertical directions of the soil, in relation to irrigated plants.
In the three groups of genotypes, it was observed that the root system was distributed, although to a lesser extent, up to the center of the lines (1.44 cm). However, up to 60 cm away from the stem in the little stars and in the superficial layers of the soil (0–20 cm) there were roots with greater surface area, length, and volume of roots per volume of soil. This is probably because these plants are irrigated with drip irrigation, even receiving manual fertilization. When irrigation is located, there is a tendency for this fertilization to be close to the irrigated aerial. However, in Conilon coffee plantations without irrigation, the distribution of roots is less discrepant [14].
Therefore, adequate fertilization should be made in the crown projection, where there is greater root distribution, to ensure better absorption of nutrients and better plant development [17].
In the deeper layers, high levels of acidity in the soil were observed (Table 1), which consequently decrease the concentrations of nutrients. Additionally, below the B horizon, the soil layers can present a higher degree of compaction, hindering the propagation of the root system [35]. Genotypes that have deep roots tend to have a greater capacity to absorb water, nutrients and ensure plant anchorage. Evidently, a root system with deep roots and good distribution along the planting lines, as in the case of plants of Group I, for the characteristic surface area and root length, can be the positive key for the selection of more resistant and productive materials [36].
In addition to the fact that these genotypes stand out due to their high productivity and good plant performance, even after five years of harvests and without the application of programmed pruning, the root system seems to be well developed, similar to what has been observed in other studies already mentioned [16,19]. We can say that the distribution of the root system may be different between different genotypes, with those capable of accessing deeper soil layers and a greater area around the plant, as well as those in which the root system is concentrated in the more superficial layers of the soil. We can also say that its distribution parallel to the plant is more limited. In this case, the non-use of programmed pruning in these genotypes does not interfere in their root distribution. Knowing each of the situations, it is possible to indicate the best regions or best methods for applying fertilizer.

5. Conclusions

There is variation in the distribution of the root system among genotypes. However, in general, the root system is concentrated at a depth of 0 to 20 cm in the soil, at distances up to 50 cm in the planting row and distances up to 60 cm in inter-rows. Considering the root distribution, the efficiency in nutritional management can be improved by applying fertilizers within a radius of 50 cm around the plant.

Author Contributions

Investigation and original draft preparation, R.S.; project administration, supervision, draft revision and submission, F.L.P.; analysis of data, A.F. and I.G.; draft review, L.O.E.S.; final draft review, R.J.G., J.C.R. and F.L.P. All authors have read and agreed to the published version of the manuscript.

Funding

This research was funded by the Fundação de Amparo à Pesquisa e Inovação do Espírito Santo (FAPES, grant number 84320893), Conselho Nacional de Desenvolvimento Científico e Tecno-lógico, and Coordenação de Aperfeiçoamento de Pessoal de Nível Superior (CAPES, Finance Code 001). The support of Fundação para a Ciência e a Tecnologia, I.P. (FCT), Portugal, through the research units UIDB/00239/2020 (CEF) and UIDP/04035/2020 (GeoBioTec) is also greatly acknowledged.

Data Availability Statement

Not applicable.

Acknowledgments

The authors thank the first breeders (i.e., the farmers who performed the initial selection of most superior genotypes currently available) and the farmer Thekson Pianissoli.

Conflicts of Interest

The authors declare no conflict of interest.

References

  1. ICO—International Coffee Organization. Global Coffee Trade. Available online: https://www.ico.org/documents/cy2021-22/cmr-1221-e.pdf (accessed on 21 January 2022).
  2. Conab—Companhia Nacional de Abastecimento. Acompanhamento de Safra Brasileira de Café, 6, 1–71. Available online: http://www.conab.gov.br (accessed on 10 March 2021).
  3. Conagin, C.H.T.M.; Mendes, A.J.T. Pesquisas citológicas e genéticas em três espécies de Coffea: Auto-incompatibilidade em Coffea canephora Pierre ex Froehner. Bragantia 1961, 20, 788–804. [Google Scholar] [CrossRef]
  4. Moraes, M.S.; Teixeira, A.L.; Ramalho, A.R.; Espíndula, M.C.; Ferrão, M.A.G.; Rocha, R.B. Characterization of gametophytic self-incompatibility of superior clones of Coffea canephora. Genet. Mol. Res. 2018, 17, gmr16039876. [Google Scholar] [CrossRef]
  5. Rodrigues, W.P.; Martins, M.Q.; Fortunato, A.S.; Rodrigues, A.P.; Semedo, J.N.; Simões-Costa, M.C.; Pais, I.P.; Leitão, A.E.; Colwell, F.; Goulao, L.; et al. Long-Term Elevated Air [CO2] Strengthens Photosynthetic Functioning and Mitigates the Impact of Supra-Optimal Temperatures in Tropical Coffea arabica and C. canephora Species. GCB Bioenergy 2016, 22, 415–431. [Google Scholar] [CrossRef]
  6. Dubberstein, D.; Lidon, F.C.; Rodrigues, A.N.A.P.; Semedo, J.N.; Marques, I.; Rodrigues, W.P.; Gouveia, D.D.; Armengaud, J.; Semedo, M.C.; Martins, S.; et al. Resilient and Sensitive Key Points of the Photosynthetic Machinery of Coffea spp. to the Single and Superimposed Exposure to Severe Drought and Heat Stresses. Front. Plant. Sci. 2020, 11, 1049. [Google Scholar] [CrossRef] [PubMed]
  7. Semedo, J.N.; Rodrigues, A.P.; Lidon, F.C.; Pais, I.P.; Marques, I.; Gouveia, D.; Armengaud, J.; Martins, S.; Semedo, M.C.; Silva, M.J.; et al. Intrinsic Non-Stomatal Resilience to Drought of the Photosynthetic Apparatus in Coffea spp. Can Be Strengthened by Elevated Air CO2. Tree Physiol. 2021, 41, 708–727. [Google Scholar] [CrossRef] [PubMed]
  8. Marques, I.; Gouveia, D.; Gaillard, J.C.; Martins, S.; Semedo, M.C.; Lidon, F.C.; DaMatta, F.M.; Ribeiro-Barros, A.I.; Armengaud, J.; Ramalho, J.C. Next-Generation Proteomics Reveals a Greater Antioxidative Response to Drought in Coffea arabica Than in Coffea canephora. Agronomy 2020, 12, 148. [Google Scholar] [CrossRef]
  9. Ramalho, J.C.; DaMatta, F.M.; Rodrigues, A.P.; Scotti-Campos, P.; Pais, I.; Batista-Santos, P.; Partelli, F.L.; Ribeiro, A.; Lidon, F.C.; Leitão, A.E. Cold Impact and Acclimation Response of Coffea spp. Plants. Theor. Exp. Plant. Physiol. 2014, 26, 5–18. [Google Scholar] [CrossRef]
  10. Partelli, F.L.; Golynski, A.; Ferreira, A.; Martins, M.Q.; Mauri, A.L.; Ramalho, J.C.; Vieira, H.D. Andina-First clonal cultivar of high-altitude conilon coffee. Crop. Breed. Appl. Biotechnol. 2019, 19, 476–480. [Google Scholar] [CrossRef] [Green Version]
  11. Partelli, F.L.; Giles, J.A.D.; Oliosi, G.; Covre, A.M.; Ferreira, A.; Rodrigues, V.M. Tributun: A coffee cultivar developed in partnership with farmers. Crop. Breed. Appl. Biotechnol. 2020, 20. [Google Scholar] [CrossRef]
  12. Senra, J.F.B.; Ferrão, M.A.G.; Mendonça, R.F.; Fonseca, A.F.A.; Ferrão, R.G.; Volpi, P.S.; Verdin Filho, A.C.; Comério, M.; Silva, M.W. Genetic Variability of Access of the Active Germplasm Bank of Coffea canephora of Incaper in Southern Espírito Santo. J. Genet. Resour. 2020, 6, 172–184. [Google Scholar] [CrossRef]
  13. Partelli, F.L.; Covre, A.M.; Oliveira, M.G.; Alexandre, R.S.; Vitória, E.L.; Silva, M.B. Root system distribution and yield of “Conilon” coffee propagated by seeds or cuttings. Pesqui. Agropecu. Bras. 2014, 49, 349–355. [Google Scholar] [CrossRef] [Green Version]
  14. Covre, A.M.; Partelli, F.L.; Gontijo, I.; Zucoloto, M. Root system distribution of irrigated and nonirrigated conilon coffee. Pesqui. Agropecu. Bras. 2015, 50, 1006–1016. [Google Scholar] [CrossRef] [Green Version]
  15. Voss-Fels, K.P.; Snowdon, R.J.; Hickey, L.T. Designer Roots for Future Crops. Trends Plant. Sci. 2018, 23, 957–960. [Google Scholar] [CrossRef] [PubMed]
  16. Silva, L.O.E.; Schmidt, R.; Valani, G.P.; Ferreira, A.; Ribeiro-Barros, A.I.; Partelli, F.L. Root Trait Variability in Coffea canephora Genotypes and Its Relation to Plant Height and Crop Yield. Agronomy 2020, 10, 1394. [Google Scholar] [CrossRef]
  17. Ronchi, C.P.; Sousa Júnior, J.M.; Almeida, W.L.; Souza, D.S.; Silva, N.O.; Oliveira, L.B.; Guerra, A.M.N.M.; Ferreira, P.A. Morfologia radicular de cultivares de café arábica submetidas a diferentes arranjos espaciais. Pesqui. Agropecu. Bras. 2015, 50, 187–195. [Google Scholar] [CrossRef] [Green Version]
  18. Tracy, S.R.; Nagel, K.A.; Postma, J.A.; Fassbender, H.; Wasson, A.; Watt, M. Crop Improvement from Phenotyping Roots: Highlights Reveal Expanding Opportunities. Trends Plant. Sci. 2020, 25, 105–118. [Google Scholar] [CrossRef] [Green Version]
  19. Partelli, F.L.; Cavalcanti, A.C.C.; Menegardo, C.; Covre, A.M.; Gontijo, I.; Braun, H. Spatial distribution of the root system of Conilon and Arabica coffee plants. Pesqui. Agropecu. Bras. 2020, 55, e01333. [Google Scholar] [CrossRef]
  20. Alvares, C.A.; Stape, J.L.; Sentelhas, P.C.; Gonçalves, J.L.M.; Sparovek, G. Köppen’s climate classification map for Brazil. Meteorol. Z. 2013, 22, 711–728. [Google Scholar] [CrossRef]
  21. Santos, H.G.; Jacomine, P.K.T.; Anjos, L.H.C.; Oliveira, V.Á.; Lumbreras, J.F.; Coelho, M.R.; Almeida, J.A.; Araújo Filho, J.C.; Oliveira, J.B.; Cunha, T.J.F. Brazilian Soil Classification System, 5th ed.; Embrapa: Brasília, Brazil, 2018. [Google Scholar]
  22. Paye, H.S.; Partelli, F.L.; Martins, A.G.; Siebeneichler, E.A. Recomendação de adubação e calagem. In Café conilon: Conhecimento Para Superar Desafios; Partelli, F.L., Espíndula, M.C., Eds.; Caufes: Alegre, Brazil, 2019; pp. 75–97. [Google Scholar]
  23. Partelli, F.L.; Covre, A.M.; Oliosi, G.; Covre, D.T. Monte Pascoal: First clonal Conilon coffee cultivar for Southern Bahia-Brazil. Funct. Plant. Breed. J. 2021, 3, 107–112. [Google Scholar] [CrossRef]
  24. Santos, W.J.R.; Silva, B.M.; Oliveira, G.C.; Volpato, M.M.L.; Lima, J.M.; Curi, N.; Marques, J.J. Soil moisture in the root zone and its relation to plant vigor assessed by remote sensing at management scale. Geoderma 2014, 222, 91–95. [Google Scholar] [CrossRef]
  25. Jorge, L.A.C.; Silva, D.J.C. SAFIRA: Manual de Utilização; Embrapa Instrumentação Agropecuária: São Carlos, Brazil, 2010. [Google Scholar]
  26. R Core Team R: A Language and Environment for Statistical Computing; R Foundation for Statistica Computing: Viena, Austria, 2020; Available online: https://www.R-project.org (accessed on 20 February 2022).
  27. Vieira, S.R.; Hatfield, J.L.; Nielsen, D.R.; Biggar, J.W. Geostatistical theory and application to variability of some agronomical properties. Hilgardia 1983, 51, 1–75. [Google Scholar] [CrossRef] [Green Version]
  28. Robertson, G.P. GS+: “Geostatistics for the Environmental Sciences”; Gamma Design Software: Plainwell, MI, USA, 2008; Available online: https://geostatistics.com/files/GSPlusUserGuide.pdf (accessed on 20 February 2022).
  29. Amado, T.J.C.; Pontelli, C.B.; Santi, A.L.; Viana, J.H.M.; Sulzbach, L.A.S. Variabilidade espacial e temporal da produtividade de culturas sob sistema de plantio direto. Pesqui. Agropecu. Bras. 2007, 42, 1101–1110. [Google Scholar] [CrossRef] [Green Version]
  30. Mojena, R. Hierarchical grouping methods and stopping rules: An evaluation. Comput. J. 1977, 20, 359–363. [Google Scholar] [CrossRef] [Green Version]
  31. Dubberstein, D.; Partelli, F.L.; Guilhen, J.H.S.; Rodrigues, W.P.; Ramalho, J.C.; Ribeiro-Barros, A. Biometric traits as a tool for the identification and breeding of Coffea canephora genotypes. Genet. Mol. Res. 2020, 19, GMR18541. [Google Scholar] [CrossRef]
  32. Partelli, F.L.; Oliosi, G.; Dalazen, J.R.; Silva, C.A.; Vieira, H.D.; Espindula, M.C. Proportion of ripe fruit weight and volume to green coffee: Differences in 43 genotypes of Coffea canephora. Agron. J. 2021, 113, 1050–1057. [Google Scholar] [CrossRef]
  33. Salviano, A.A.C.; Vieira, S.R.; Sparovek, G. Variabilidade espacial de atributos de solo e de Crotalaria juncea L. em área severamente erodida. Rev. Bras. Cienc. Solo 1998, 22, 115–122. [Google Scholar] [CrossRef] [Green Version]
  34. Faraco, M.A.; Uribe-Opazo, M.A.; Silva, E.A.A.; Johann, J.A.; Borssoi, J.A. Seleção de modelos de variabilidade espacial para elaboração de mapas temáticos de atributos físicos do solo e produtividade da soja. Rev. Bras. Cienc. Solo 2018, 32, 463–476. [Google Scholar] [CrossRef]
  35. Rao, I.M.; Miles, J.W.; Beebe, S.E.; Horst, W.J. Root adaptations to soils with low fertility and aluminium toxicity. Ann. Bot. 2016, 118, 593–605. [Google Scholar] [CrossRef] [Green Version]
  36. Nunes, A.L.P.; Cortez, G.L.S.; Zaro, G.C.; Zorzenoni, T.O.; Melo, T.R.; Figueiredo, A.; Aquino, G.S.; Medina, C.C.; Ralisch, R.; Caramori, P.H.; et al. Soil morphostructural characterization and coffee root distribution under agroforestry system with Hevea Brasiliensis. Sci. Agric. 2021, 78, 1–12. [Google Scholar] [CrossRef]
Figure 1. Dissimilarity between six C. canephora genotypes using the Euclidean distance of the means and the single-link clustering method—nearest neighbor, considering four root characteristics (root length density, root volume, root surface area and root diameter), based on three distances in the planting row (16, 32 and 48 cm) and nine distances in inter-row planting (16, 32, 48, 64, 80, 96, 112, 128, 144 cm). Both the distances were measured from the stem of the plant and six depths from the ground (0–10, 10–20, 20–30, 30–40, 40–50 and 50–60 cm) at each distance.
Agronomy 12 00647 g001
Figure 2. Spatial distribution map of the roots in the soil profile for the characteristic surface area of the roots, based on the clustering of six C. canephora genotypes at three distances in the planting row (16, 32 and 48 cm) and nine distances in inter-row planting (16, 32, 48, 64, 80, 96, 112, 128, 144 cm). Both distances were measured from the stem of the plant and six depths from the ground (0–10, 10–20, 20–30, 30–40, 40–50 and 50–60 cm) at each distance. The transverse white line refers to the location of the plant. (a) Group I—AD1, Valcir P and Peneirão genotypes; (b) Group II—A1 and P2 genotypes and (c) Group III—Z21 genotype.
Agronomy 12 00647 g002
Figure 3. Spatial distribution map of roots in the soil profile for root volume per soil volume, based on the clustering of six C. canephora genotypes at three distances in the planting row (16, 32 and 48 cm) and nine distances in inter-row planting (16, 32, 48, 64, 80, 96, 112, 128, 144 cm). Both distances were measured from the stem of the plant and six depths from the ground (0–10, 10–20, 20–30, 30–40, 40–50 and 50–60 cm) at each distance. The transverse white line refers the location of the plant. (a) Group I—AD1, Valcir P and Peneirão genotypes; (b) Group II—A1 and P2 genotypes and (c) Group III—Z21 genotype.
Agronomy 12 00647 g003
Figure 4. Spatial distribution map of roots in the soil profile for the length root density, based on the clustering of six C. canephora genotypes at three distances in the planting row (16, 32 and 48 cm) and nine distances in inter-row planting (16, 32, 48, 64, 80, 96, 112, 128, 144 cm). Both distances were measured from the stem of the plant and six depths from the ground (0–10, 10–20, 20–30, 30–40, 40–50 and 50–60 cm) at each distance. The transverse white line refers the location of the plant. (a) Group I—AD1, Valcir P and Peneirão genotypes; (b) Group II—A1 and P2 genotypes and (c) Group III—Z21 genotype.
Agronomy 12 00647 g004
Table 1. Chemical and granulometric characteristics in six soil depths (Yellow Latosol) in an irrigated area with Conilon coffee (C. canephora) in Nova Venécia—Espírito Santo, Brazil.
Chemical AttributesSoil Layers (cm)
0–1010–2020–3030–4040–5050–60
K (mg dm−3)1109574575246
S (mg dm−3)151129151517
Ca (cmol dm−3)3.83.41.91.00.70.6
Mg (cmol dm−3)1.00.90.40.30.10.1
Al (cmol dm−3)0.00.00.30.70.80.8
H + Al (cmol dm−3)1.61.82.42.93.13.1
pH (H2O)6.66.55.34.84.84.8
Mat. Org. (dag dm−3)2.11.71.10.80.70.5
Fe (mg dm−3)140138126948887
Zn (mg dm−3)10.24.52.91.10.60.5
Cu (mg dm−3)3.44.33.01.91.21.0
Mn (mg dm−3)207174104464440
B (mg dm−3)0.810.830.580.550.560.61
Na (mg dm−3)11.037.08.06.05.04.0
Particle size fractions
Sand (g kg−1)434352188368366376
Silt (g kg−1)861682123274124
Clay (g kg−1)480480600600560500
Table 2. Estimated parameters of experimental semivariograms for the studied variables of the groups of six genotypes of C. canephora in Nova Venécia—Espírito Santo, Brazil.
ParametersRoot Surface Area (mm2 cm−3)Root Volume (mm3 cm3)Root Length Density (mm cm3)
Group IGroup IIGroup IIIGroup IGroup IIGroup IIIGroup IGroup IIGroup III
SDI0.2320.8117.980.0500.06913.030.0813.230.041
R20.9080.9220.9250.920.9740.9890.9960.990.992
RSS1.67 × 1081.01 × 1073.77 × 107547,40438,734.036,54216,115.01,822,9602,189,057
RCV1.0091.0581.0730.960.9241.0571.1061.0160.966
SDI: spatial dependence index; R2: coefficient of determination; RSS: mean square residual sum value; and RCV: cross-validation regression coefficient.
Table 3. Estimated models and parameters of experimental semivariograms for the variables studied of the groups of six C. canephora genotypes in Nova Venécia—Espírito Santo, Brazil.
ParametersRoot Surface Area (mm2 cm3)Root Volume (mm3 cm3)Root Length Density (mm cm3)
Group IGroup IIGroup IIIGroup IGroup IIGroup IIIGroup IGroup IIGroup III
ModelSphericalSphericalSphericalSphericalSphericalGaussianSphericalSphericalSpherical
Co100.03540.06420.01.01.022210.02650.010.0
Co + C42,621.017,010.035,700.01981.391430.01703.011,670.020,030.024,180.0
Range (m)93.7121.393.3089.60134.50139.9455.80180.1068.30
The semivariograms were adjusted by testing the spherical, exponential and Gaussian theoretical models, and their nugget effect (Co), landing (C), plateau (Co + C) and range parameters were determined for each group of genotypes and traits (root surface area, root volume and root length density).
Publisher’s Note: MDPI stays neutral with regard to jurisdictional claims in published maps and institutional affiliations.

