Article

Soil Organic Carbon and Nutrients Affected by Tree Species and Poultry Litter in a 17-Year Agroforestry Site

1
USDA-ARS, Poultry Production and Product Safety Research Unit, O-303 Poultry Science Center, University of Arkansas, Fayetteville, AR 72701, USA
2
Department of Crop, Soil, and Environmental Sciences, University of Arkansas, 115 Plant Sciences Building, Fayetteville, AR 72701, USA
3
Department of Soil Science, Universidade Federal de Lavras, 1001 Av. Doutor Silvio Menicucci, Lavras 37200-900, MG, Brazil
4
USDA-ARS, National Laboratory for Agriculture and the Environment, 2110 University Boulevard, Ames, IA 3120, USA
*
Author to whom correspondence should be addressed.
Agronomy 2022, 12(3), 641; https://doi.org/10.3390/agronomy12030641
Submission received: 10 January 2022 / Revised: 2 March 2022 / Accepted: 3 March 2022 / Published: 5 March 2022
(This article belongs to the Special Issue Agroforestry Systems in the Changing Climate)

Abstract

:
Tree species and fertilization sources may affect the soil organic carbon (SOC) and fertility in agroforestry (AF) systems in temperate regions, but this remains unexplored. This study assesses the longitudinal trends in the SOC and major nutrients in a 17-year AF site established on an Ultisol in Fayetteville, AR. We evaluated how management and fertilization (mineral vs. organic) affect the soil’s physical and chemical properties using the tree species: red oak (Quercus rubra L.) and pecan Carya illinoinensis (Wangenh.) K. Koch. Long-term applications of poultry litter increased the soil pH, whereas the Mg and S concentrations decreased compared to the baseline levels (1999). Poultry litter increased the soil P concentration in 53% compared to the baseline levels and reduced the soil C:N ratio. After 17 years, increased Ca, SOC, and N concentrations were observed in the soils under the pecan stands that received poultry litter. Positive correlations occurred between the SOC and N (r = 0.96) as well as the Ca (r = 0.71) and P (r = 0.61) at a soil depth of 0–15 cm. Our findings demonstrated that the changes in SOC and fertility in the AF soils vary according to tree species and fertilization, mostly due to distinctive leaf litter and nutrient inputs. Organic matter accumulation increased the SOC retention and nutrient availability in the temperate AF systems.

1. Introduction

Agroforestry (AF) systems are widely recognized for their economic relevance and associated ecosystem services. Multiple benefits of AF include soil organic carbon (SOC) sequestration [1,2,3], improved soil fertility [4] and soil structure [5], diversification of production, and biodiversity conservation [6,7]. In the face of climate change, AF systems have drawn attention as they represent an alternative that can enhance SOC sequestration and mitigate greenhouse gas (GHG) emissions relative to less complex, agricultural systems [8,9]. In addition, AF systems can promote more sustainable food production by improving food security while preventing land degradation [10]. A proper combination of tree species and fertility management can expand such benefits of the AF systems, although, in temperate AF systems, this remains largely unexplored.
More diverse and complex plant communities in agroecosystems promote niche differentiation [11] and complementation and may increase efficient use of resources (e.g., light, water, and nutrients), thus leading to greater above- and below-ground biomass [12] and, consequently, to greater C inputs into the soil. Accordingly, recent global estimates showed that the transition of agriculture to AF increased SOC stocks by 26 and 40% at the 0–15 and 0–30 cm soil depths, respectively [8], evidencing the potential of tree-based systems to enhance C sequestration. However, the extent of SOC sequestration in AF systems is greatly affected by environmental conditions and system management, which determine the balance between biomass production and soil organic matter decomposition and stabilization in soils. Plant species composition affects the quantity and quality of litter inputs in the system [13,14,15,16], which can affect soil organic matter (SOM) decomposition and turnover rates, even in subsurface soils [17].
Increased use efficiency of water and nutrients in AF systems can improve soil fertility, and soil and environment health. Such benefits, when they occur, are primarily due to increased biomass production, humification, and greater uptake and utilization of nutrients from deeper soil layers due to the presence of deep-rooted trees [6,7,18], in comparison to annual crops. Agroforestry systems are also thought to improve nutrient storage in the plant–soil system by reducing the loss of nutrients via leaching and runoff [19], which can contribute to improved surface and groundwater quality. In addition, plant functional traits can play an important role in nutrient cycling in AF systems [16]. Differences in the litter nutrient concentration and resistance to faunal and microbial decay are likely to affect litter decomposition rates and, thus, nutrient availability in soils. Moreover, varying canopy structure can alter micro-environmental conditions and change soil biotic activity [20,21], which may further affect the SOC mineralization and nutrient availability in soils.
Fertilization practices, especially those involving the addition of animal manures, such as poultry litter which is a mixture of manure, urine, and bedding material, can also impact C sequestration and soil fertility in AF systems [19,21,22,23]. The application of poultry litter in AF systems allows for the recycling of nutrients while mitigating environmental pollution and promoting sustainable production patterns [Sustainable Development Goal (SDG) 12; https://sdgs.un.org/goals, accessed on 9 January 2022] in regions of intensive poultry production, such as the southern U.S. However, little is known about the influence of poultry litter application or the choice of tree species on the long-term physical and chemical properties in AF systems, particularly in temperate regions. Such knowledge is critical to assess the potential SOC sequestration and nutrient supply in temperate AF systems. Therefore, the main objective of this study was to assess the effects of tree species and poultry litter application after 17 years on the soil bulk density and chemical properties (SOC, N, P, Ca, Mg, K and S) at two soil depths (0–15 and 15–30 cm) in an AF site containing pecan [Carya illinoinensis (Wangenh.) K. Koch] and red oak (Quercus rubra L.) trees. We hypothesized that the establishment of the AF system fertilized with poultry litter (i) will increase the SOC and total N concentration along the 17-yr time lapse, (ii) will improve the soil fertility over such time, and (iii) the soil properties will differ between the tree species and fertilizer source (poultry litter vs. inorganic control) combinations.

2. Materials and Methods

2.1. Site Description

This long-term experiment was established in a 4.25 ha agroforestry research site at the University of Arkansas Agricultural Research and Extension Center located in Fayetteville, AR (36°5′ N; 94°10′ W, 382 m a.s.l., 3.4% mean slope). According to the USDA soil taxonomy, soils in the study area are Captina silt loam (fine-silty, siliceous, active, mesic Typic Fragiudults), with some Pickwick silt loam (fine-silty mixed, semiactive, thermic Typic Paleudults) toward the north and small areas of Nixa cherty silt loam (loamy-skeletal, siliceous, active, mesic Glossic Fragiudults) and Johnsburg silt loam (fine-silty, mixed, active, mesic Aquic Fragiudults) along the central-west and southeast margins, respectively. The climate is temperate sub-humid with a mean annual ±SD precipitation of 1094 ± 231 mm and mean annual maximum and minimum air temperatures of 20.6 ± 1.0 °C and −4.7 ± 1.3 °C from 2000 to 2015 [24].
The experiment was established in 1999 on previously idle, ungrazed pasture, aiming to investigate nutrient cycling through the plant-soil-ground water continuum in an agroforestry system representative of those in northwest Arkansas. Site preparation procedures included glyphosate herbicide application, land-leveling operations, and two agricultural lime applications (8.4 Mg lime ha1). The site consists of 16 east–west-oriented tree rows of which the six southernmost rows were planted with pecan and the five northernmost rows with northern red oak. The remaining five rows in the middle have sections of three tree species: sycamore (Platanus occidentalis L.), cottonwood (Populus deltoides W. Bartram ex Marshall), and white pine (Pinus strobus L.) planted from east to west. Orchardgrass (Dactylis glomerata L.) and a big bluestem (Andropogon gerardii Vitman)-dominated native grass mix were seeded in alleys during 2015 [22].
Between 2001 and 2007, the eastern half of the experimental plot received broadcast applications of 3.9–6.7 Mg ha1 poultry litter (2–3% N) [25], whereas the western half of the site received 50–76 kg ha1 N as NH4NO3 fertilizer (control) annually each spring [22], except in 2005, when the poultry litter and fertilizer applications were made in both the spring and fall to evaluate nutrient source impacts on the soil physiochemical properties. The poultry litter application rates matched the local recommended practice and were intended to provide a comparable amount of plant-available N to the control treatment. The fertilizer application rate was adjusted as necessary to better match the N input from the poultry litter. Beginning in 2004, additional fertilizer was provided to the trees as an annual application of a slow-release fertilizer (Osmocote, the Scotts Miracle-Grow Co., Marysville, OH, USA) containing 5.6, 2.4, and 4.6 g of N, P, and K, respectively, which was surface-applied near each tree crown in June. Mineral fertilizer with N, P, K, S, and Ca was also applied at a rate of 112, 49, 56, 29, and 41 kg ha1 in March 2016, respectively. Detailed information on the establishment and management of this site can be found in Sauer et al. (2014) and Dold et al. (2019) [22,25].

2.2. Soil Sampling and Analysis

Soil cores of 0–15 cm depth were taken in 1999, 2001, and 2008, using a 3.3-cm diameter probe. In 2001 and 2008, soil cores were collected in a zig-zag pattern within the tree rows, and, in 2016, soil samples from 0–15 and 15–30 cm depths were collected in tree rows 1 m away from a tree. The original sampling design focused on characterizing changes in the soil properties in the alleys, since the trees were small and assumed to affect the soil properties only in a small area and at a shallow depth. By 2016, the red oak and pecan had grown to such a size that their roots, leaf deposition, and shading were now affecting a significant area of the alleys, which explains the shift in sampling design [26]. Bulk soil samples were taken similarly, air-dried, and sieved <2 mm, and their chemical and physical properties were determined. The major nutrients (P, K, Ca, Mg, and S) were determined using Mehlich-3 extractions [27] and an inductively coupled plasma emission spectroscopy. A 15 g-sample fine earth subsample was placed on a roller mill and ground <150 μm for a total C and N analysis using the dry combustion method (FisonNA 1500 Elemental Analyzer, ThermoQuest Corp., Austin, TX, USA). Samples of air dried, <2 mm-diameter soil also were used to determine pH (1:1 soil:water). For bulk density determination, soil cores of 0–15 and 15–30 cm depths were collected in 2016, using a 4.8-cm diameter probe [17,28]. The soil organic C stocks were calculated using the following equation [29]:
SOC stock = Σ volume ×   Bd   × SOC concentration 100  
where the SOC stock is in Mg ha1, n is the number of soil depths, Σ is the total soil volume per depth in m3 ha1, Bd is bulk density in Mg m3, and SOC concentration is in percent.

2.3. Statistical Analysis

Analysis of variance of the soil physical and chemical data (soil samples collected in 2016) was performed using the SAS GLIMMIX procedure (SAS V9.4; SAS Institute, 2014). The tree species, fertilizer type, and sampling depth (0–15 and 15–30 cm) were considered fixed effects and analyzed within a split-split-plot design, with replications considered random effects. Comparison of the soil properties over time was performed only for the 0–15 cm soil depth, with tree species (whole-plot), fertilization (split-plot), and year (sub-plot; 2001, 2008, and 2016) considered fixed effects, and replications considered random. Because years were treated as fixed effects, soil properties in 2016 are comparable with 2001 and 2008 (despite the shift in sampling design in 2016 described above). The results of each individual effect represent an average across the other individual effects. For example, the results of the nutrient concentration by soil depth were averaged across tree species and fertilization treatments. When main effects or interactions were found between the explanatory factors, mean separation was performed by the SAS macro “pdmix 800” [30] with Fisher’s least significant difference and a type I error rate of 5%. Pearson’s correlation was performed using the SAS PROC CORR procedure to investigate the relationship between the terminal (2016) soil properties, i.e., the SOC and N, the SOC and P, etc.

3. Results and Discussion

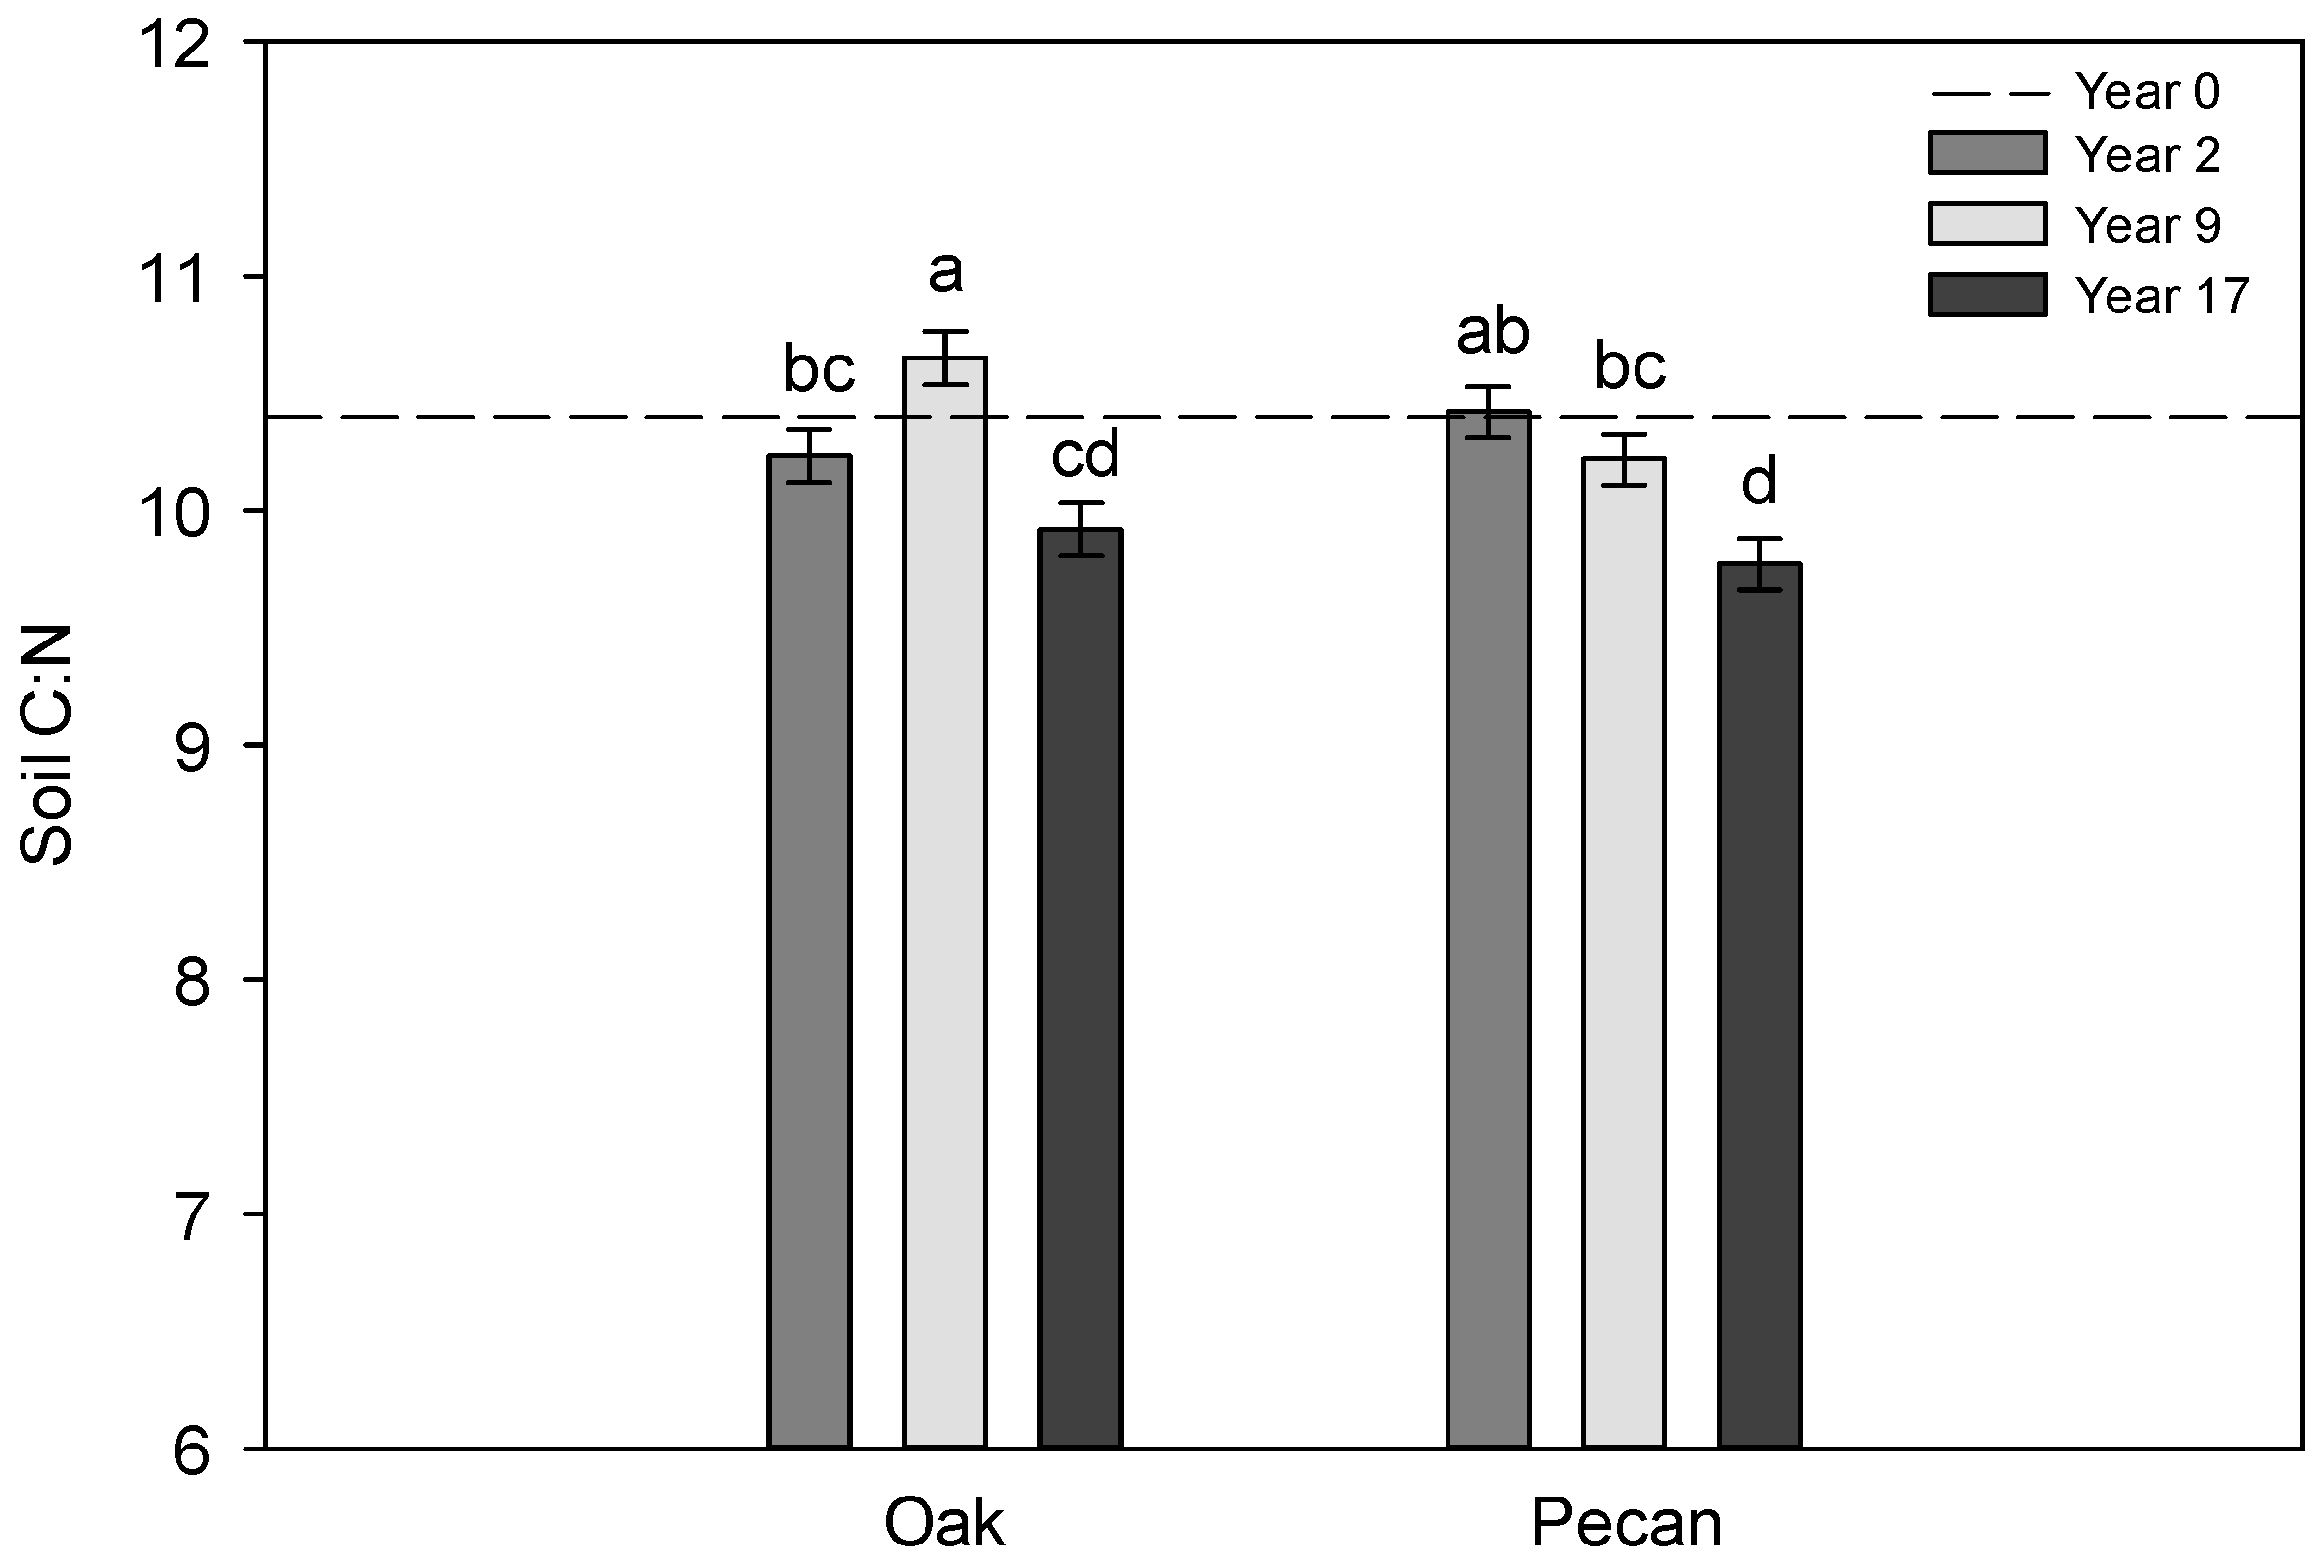
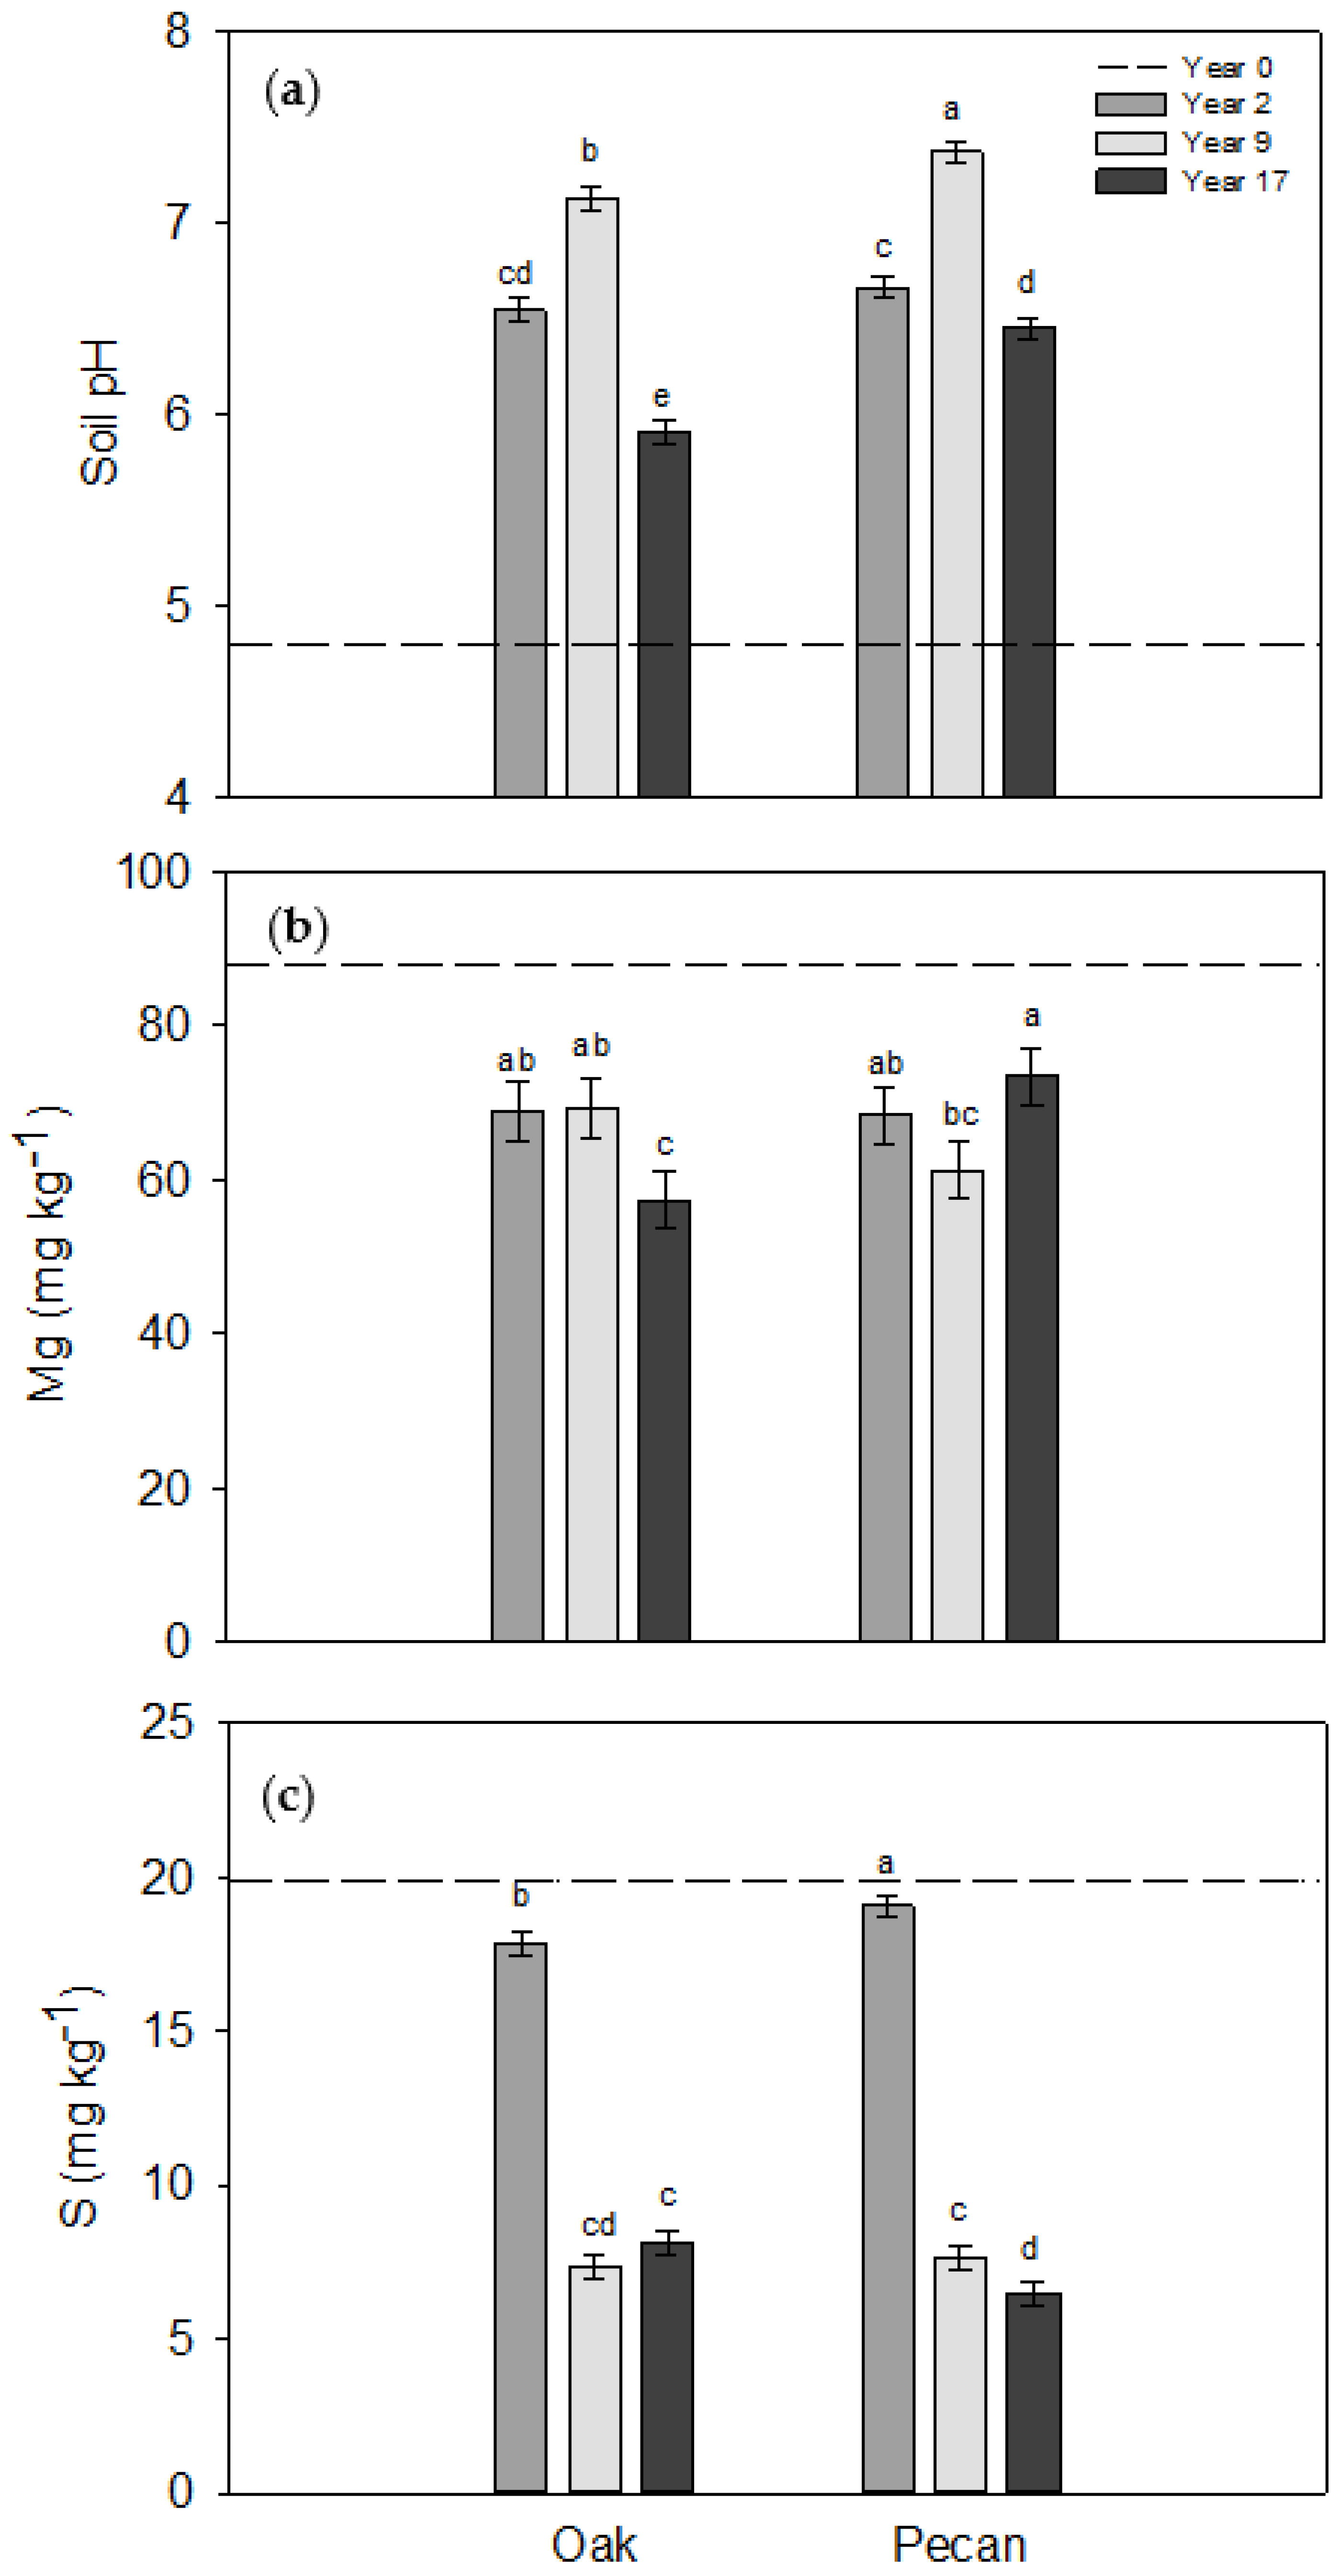
3.1. Trends in Soil Properties across Years

The interactive effects (p < 0.05; Table 1) of the year × tree species were found for the soil pH, Mg, S, and C:N ratios. The interactive effects of the year × fertilization (p < 0.05; Table 1) were observed for the P, K, Mg, and S. The individual main effects (p < 0.05; Table 1) of the year, tree species, and fertilization were found for selected soil chemical properties. Specifically, the soil Ca at the 0–15 cm soil depth differed by year, the soil P was affected by tree species, and the soil C:N ratio was affected by fertilization.
Contrary to our first hypothesis, the SOC and N were not affected by time (Table 1); therefore, we accepted the null hypothesis. In agreement with our results, Stefano and Jacobson (2018) [8] demonstrated that the conversion of pasture or grasslands to agroforestry did not lead to increases in the SOC storage at the 0–30 cm soil depth. As pointed out by Nair et al. (2009) [31], the extent of SOC sequestration in any AF system depends on site-specific biological, climate, edaphic, and management factors. In our study, the lack of changes in the SOC over time likely occurred because a steady state was reached within the 17 experimental years [32]. Accordingly, C sequestration is often greater during the early tree establishment phase, followed by a slower C accumulation with increasing tree age thereafter, and this accumulation pattern varies by tree species richness and regional climate [33].
Despite a lack of changes in the SOC and N, the soil C:N ratios varied over time and between tree species (Figure 1). In 2008, the soil C:N under oak stands increased up to 10.65, not differing from the soil C:N under pecan stands in 2001 (10.41). In 2016, the soil C:N reduced to 9.92 and 9.77 under oak and pecan stands, respectively. Although non-significant (Table 1), a numeric increase in the soil N was observed, particularly under pecan plantings (Supplemental Table S1). The constant inputs of leaf and poultry litter may have increased biological activity [34] and induced C losses through respiration [35,36], preventing SOC accumulation and favoring N retention in soils, which lowered the soil C: N ratios after 17 years of management.
In 1999 (year 0), the baseline average soil pH was 4.8 (Figure 2a) at the 0–15 cm soil depth. After the establishment of the AF system, an overall increase in soil pH was observed (regardless of fertilizer source). In 2001, the soil pH was approximately 6.5, with no differences observed in the soils between the tree species (oak and pecan). The greatest pH was observed in 2008, with the soils under pecan having an increased pH (p < 0.05; 7.4) compared to the soils under oak (7.1). In 2016, a reduction in pH was observed in the soils under both tree species, with an increased pH under pecan (6.4) compared to oak (5.9). The increase in pH resulted from the lime applications during the site development (8.4 Mg ha1) and the application of poultry litter (pH 6.8) between 2001 and 2007, whereas the reduction in 2016 likely reflects the lack of poultry litter applications after 2008. Poultry litter has been proven to ameliorate soil acidity [37,38], which may occur through the complexation of soluble Al with organic matter.
Contrary to soil pH, the Mg in the soils had an overall decrease with the AF system’s establishment (Figure 2b). Initially, the average Mg concentrations were 87 mg kg1 at the 0–15 cm soil depth. In 2001, the Mg concentration was approximately 68 mg kg1, with no differences between the oak and pecan. In 2016, the Mg concentration in the soils under pecan increased compared to 2008 and were higher than the Mg concentration in the soils under oak during the same year (p < 0.05). For S, the average initial concentration was approximately 20 mg kg1 (Figure 1c). In 2001, the S concentration under the pecan soils was similar to year 0 (19 mg kg1), which was greater (p < 0.05) than the soils under oak (17.8 mg kg1). In 2008, the S concentrations decreased approximately 60% (7 mg kg1 average), with no differences between the tree species occurring. In 2016, the S concentration in the soils under oak did not change compared to 2008; however, it decreased in the soils under pecan (6.5 mg kg1). The reductions in the Mg and S concentrations were unexpected, as AF are often thought to increase the nutrient availability in soils [10,32]. However, the study site was hayed for several years. This may have favored the removal of nutrients from this site, thus contributing to these reduced concentrations in the soils.
Effects of the fertilization over time are shown in Figure 3. In 1999, the average soil P concentrations were approximately 30 mg kg1 (Figure 3a). Under the control treatment, the soil P concentration did not change over time after tree establishment. Conversely, the soil P concentration under poultry litter increased approximately 53% in 2008 (70 mg kg1) compared to 2001, with an increased value also in 2016 (63 mg kg1). In 2008, the soil P concentration in the treatments that received PL was 56% greater than the positive control treatment (31 mg kg1). Poultry litter is regarded as a valuable source of nutrients, namely N and P, and its application on AF systems may enhance nutrient cycling and availability in soils long-term [22,23,39,40]. Indeed, the reduced soil C:N ratios observed in 2016 (Figure 1) may have been linked to the increased N concentrations (Supplemental Table S1), due to long-term poultry litter applications.
Overall, the soil K concentrations did not change across years for both fertilization treatments, with the terminal values being similar to the initial average (113 mg kg1; Figure 3b). The exception was in 2008, when the control treatment had a lower K concentration (77 mg kg1) compared to poultry litter (114 mg kg1). The concentrations of Mg and S in 2001 were similar to the baseline values for both fertilization treatments. In 2008, the Mg and S concentrations in the soils that received poultry litter were higher (p < 0.05) than in the control (Figure 3c). These results demonstrated that poultry litter applications increased the overall soil fertility compared to the control treatment (inorganic fertilizer), with more pronounced effects in 2008. Organic fertilizers, such as animal manures, have been shown to neutralize soil acidity, increase nutrient levels, and improve biological activity and diversity relative to inorganic fertilizers, thus contributing to improved soil health [41,42,43].

3.2. Soil Properties as Affected by Tree Species and Fertilization Sources after 17 Years

The soil organic C sequestration in no-tillage agrosystems represents an opportunity to offset anthropogenic CO2 emissions and improve soil quality [44]. As expected, all soil physical and chemical properties differed (p < 0.05; Table 2) by soil depth, except for pH. An interactive effect (p < 0.05) between the tree species and fertilization was observed for the P, Ca, SOC, and N concentrations and stocks, as well as for the C:N ratio. An interactive effect (p < 0.05) of the tree species and soil depth were observed for the P, Mg, and C:N ratio. Individual effects of the tree species were found for pH and S, whereas fertilization effects were observed for Mg. A three-way interaction (tree species × fertilization × soil depth; p < 0.05) was observed for Ca.
The 0–15 cm soil depth had a lower bulk density and greater nutrient (C, N, P, K, Ca, Mg, and S) concentrations and C:N ratio compared to the 15–30 cm soil depth (Table 3). Likewise, increased SOC and N stocks were found in the upper soil depth compared to the 15–30 cm layer. The phosphorus concentration was 68% greater at the 0–15 cm soil depth, whereas the S concentration was only 7% greater at the surface layer. For the SOC, N, and K concentrations, this value was approximately 50% and 30% for the Ca and Mg concentrations. The increased SOC and nutrient concentrations and reduced bulk density at the top 15 cm reflects higher soil organic matter (SOM) concentrations, as well as lime and poultry litter applications in the soil surface.
When investigating the interactive effects of the tree species and fertilization treatments on soil nutrients averaged across depths, it was observed that the soils under pecan receiving inorganic N fertilizer (control) had lower soil P (Table 4), likely due to the lesser P inputs relative to the poultry litter applications. The application of poultry litter in the soils under pecan led to an increased Ca concentration (1407 mg kg1) compared to the control (1098 mg kg1); however, it did not differ from the control treatment in the soils under oak (Table 4).
The soils under oak and poultry litter applications had a lower SOC concentration and stocks (Table 4) compared to the control. A similar trend was observed for the soil N. This was unexpected, since poultry litter is considered a valuable source of OM and nutrients [22,23,45]. Conversely, the soils under pecan that received poultry litter had greater SOC and N content and stocks compared to the control. The increase in SOC and N stocks in the poultry litter treatments under pecan corresponded to approximately 14 and 13% relative to inorganic-fertilizers, respectively. This was likely a result of increased SOM accumulation, following poultry litter applications, relative to synthetic fertilizers [34] and differential decomposition of pecan leaf litter. Accordingly, pecan leafy and woody materials have increased the N content compared to oak [25], which may increase the decomposition rates and humification [46]. As hypothesized, our results indicated that the SOC and fertility in AF soils varied by tree species and that past fertilization practices had a legacy effect on the soil fertility after 17 years of management. In addition, our findings demonstrate that the proper combination of trees and fertilization sources (organic vs. mineral) can enhance the SOC and N sequestration in temperate AF systems and, thus, help mitigate GHG emissions.

3.3. Soil Properties in 2016: Linkages

Pearson’s correlation coefficients demonstrated the relationship between terminal soil samples. At the 0–15 cm soil depth, the SOC and N had a strong, positive correlation (r = 0.96; p < 0.05; Table 5). Additionally, a strong, positive correlation was observed for the Ca and SOC as well as the Ca and N (r = 0.71). Moderate positive correlations were observed between the P and SOC as well as the P and N (approximately r = 0.60). A moderate, positive correlation was also observed between the Ca and pH, Ca and P (r = 0.55), and SOC and C: N (r = 0.49). Bulk density had a moderately negative correlation with the SOC and N (r = −0.57 and −0.61, respectively). Similar correlations were observed at the 15–30 cm soil depth, with S and pH presenting a moderate negative correlation (r = −0.58).
Overall, the positive relationships between the SOC and N with Ca and P at the 0–15 cm soil depth may be explained by accumulation of SOM on the soil surface via leaf litter deposition or poultry litter applications. Not surprisingly, the bulk density had a negative correlation with these nutrients, thereby indicating an inverse relationship between the SOM formation and bulk density. These results agreed with previous reports in the literature and demonstrated that SOM accumulation plays a major role in nutrient cycling and availability in AF systems [2,4]. Our findings may represent a guideline for improving the SOM accumulation, SOC retention, and fertility in temperate AF systems and, therefore, an opportunity to offset anthropogenic CO2 emissions and improve soil quality [43].

4. Conclusions

The establishment of an AF system led to varying trends in nutrient concentrations over 17 years of management. Long-term applications of poultry litter led to an overall increase in the pH and P concentrations in soils. After 17 years, the soils under pecan that received poultry litter had increased Ca, SOC, and N concentrations compared to the inorganic control, indicating a legacy effect of poultry litter and suggesting a differential effect of tree species on the SOM accumulation and nutrient availability in soils. From a practical perspective, applications of poultry litter in pecan plantings were more beneficial compared to applications of inorganic fertilizer, as the improved soil fertility may increase the biomass yield and pecan production. The positive correlations between SOC, N, and P at the 0–15 cm depth indicated that the improved soil fertility in AF systems is linked to the accumulation of OM. Thus, tree species and fertilization practices that improve the SOM levels in soils should be prioritized, due to their potential benefits for biomass yield and overall soil health. This understanding may serve as a guideline for improving the SOC retention and nutrient cycling in temperate AF sites, and, therefore, their ability to provide ecosystem and economic services. Investigating C dynamics under several management practices will help increase our knowledge on how to optimize both C storage and productivity under agroforestry system management strategies.

Supplementary Materials

The following are available online at https://www.mdpi.com/article/10.3390/agronomy12030641/s1, Table S1: soil organic C and N over time in a 17-year agroforestry site in Fayetteville, AR, per tree species, averaged across fertilization treatments.

Author Contributions

Conceptualization, A.J.A. and T.J.S.; methodology, T.J.S. and A.J.A.; formal analysis, H.C.S.A.; investigation, A.J.A., H.C.S.A. and T.J.S.; resources, A.J.A.; data curation, H.C.S.A.; writing—original draft preparation, H.A, A.J.A., T.J.S. and Y.L.Z.; writing—review and editing, H.A, A.J.A., T.J.S. and Y.L.Z.; supervision, A.J.A.; project administration, A.J.A.; funding acquisition, A.J.A. and T.J.S. All authors have read and agreed to the published version of the manuscript.

Funding

This research received no external funding.

Institutional Review Board Statement

Not applicable.

Informed Consent Statement

Not applicable.

Data Availability Statement

Not applicable.

Acknowledgments

The authors extend gratitude to Taylor Cass Adams for helping with soil sampling and laboratory analysis. We also thank the National Research and Development Council (CNPq), Brazil, for its support of H. Amorim and Y. Zinn. The USDA is an equal opportunity provider and employer. Mention of trade names or commercial products in this article is solely for the purpose of providing specific information and does not imply recommendation or endorsement by the USDA.

Conflicts of Interest

The authors declare no conflict of interest.

References

  1. Udawatta, R.P.; Jose, S. Agroforestry strategies to sequester carbon in temperate North America. Agrofor. Syst. 2012, 86, 225–242. [Google Scholar] [CrossRef]
  2. Lorenz, K.; Lal, R. Soil organic carbon sequestration in agroforestry systems. A review. Agron. Sustain. Dev. 2014, 34, 443–454. [Google Scholar] [CrossRef] [Green Version]
  3. Schoeneberger, M.M. Agroforestry: Working trees for sequestering carbon on agricultural lands. Agrofor. Syst. 2009, 75, 27–37. [Google Scholar] [CrossRef] [Green Version]
  4. Dollinger, J.; Jose, S. Agroforestry for soil health. Agrofor. Syst. 2018, 92, 213–219. [Google Scholar] [CrossRef] [Green Version]
  5. Gelaw, A.M.; Singh, B.R.; Lal, R. Soil quality indices for evaluating smallholder agricultural land uses in northern ethiopia. Sustainability 2015, 7, 2322–2337. [Google Scholar] [CrossRef] [Green Version]
  6. Jose, S. Agroforestry for ecosystem services and environmental benefits: An overview. Agrofor. Syst. 2009, 76, 1–10. [Google Scholar] [CrossRef]
  7. Nair, P.K.R. Agroforestry Systems and Environmental Quality: Introduction. J. Environ. Qual. 2011, 40, 784. [Google Scholar] [CrossRef] [Green Version]
  8. De Stefano, A.; Jacobson, M.G. Soil carbon sequestration in agroforestry systems: A meta-analysis. Agrofor. Syst. 2018, 92, 285–299. [Google Scholar] [CrossRef]
  9. Muchane, M.N.; Sileshi, G.W.; Gripenberg, S.; Jonsson, M.; Pumarino, L.; Barrios, E. Agroforestry boosts soil-mediated ecosystem services in the humid and sub- humid tropics: A meta-analysis. Agric. Ecosyst. Environ. 2020, 295, 106899. [Google Scholar] [CrossRef]
  10. Waldron, A.; Garrity, D.; Malhi, Y.; Girardin, C.; Miller, D.C.; Seddon, N. Agroforestry Can Enhance Food Security While Meeting Other Sustainable Development Goals. Trop. Conserv. Sci. 2017, 10, 1940082917720667. [Google Scholar] [CrossRef] [Green Version]
  11. Gurmessa, B.; Ashworth, A.J.; Yang, Y.; Adhikari, K.; Savin, M.; Owens, P.; Sauer, T.; Pedretti, E.F.; Cocco, S.; Corti, G. Soil Bacterial Diversity Based on Management and Topography in a Silvopastoral System. Appl. Soil Ecol. 2021, 163, 103918. [Google Scholar] [CrossRef]
  12. Niyigena, V.; Ashworth, A.J.; Nieman, C.; Acharya, M.; Coffey, K.P.; Philipp, D.; Meadors, L.; Sauer, T.J. Factors Affecting Sugar Accumulation and Fluxes in Warm- and Cool-Season Forages Grown in a Silvopastoral System. Agronomy 2021, 11, 354. [Google Scholar] [CrossRef]
  13. Augusto, L.; De Schrijver, A.; Vesterdal, L.; Smolander, A.; Prescott, C.; Ranger, J. Influences of evergreen gymnosperm and deciduous angiosperm tree species on the functioning of temperate and boreal forests. Biol. Rev. 2015, 90, 444–466. [Google Scholar] [CrossRef]
  14. Hoosbeek, M.R.; Remme, R.P.; Rusch, G.M. Trees enhance soil carbon sequestration and nutrient cycling in a silvopastoral system in south-western Nicaragua. Agrofor. Syst. 2018, 92, 263–273. [Google Scholar] [CrossRef] [Green Version]
  15. Baah-Acheamfour, M.; Carlyle, C.N.; Bork, E.W.; Chang, S.X. Trees increase soil carbon and its stability in three agroforestry systems in central Alberta, Canada. For. Ecol. Manag. 2014, 328, 131–139. [Google Scholar] [CrossRef]
  16. Casals, P.; Romero, J.; Rusch, G.M.; Ibrahim, M. Soil organic C and nutrient contents under trees with different functional characteristics in seasonally dry tropical silvopastures. Plant Soil 2014, 374, 643–659. [Google Scholar] [CrossRef]
  17. Zinn, Y.L.; Guerra, A.R.; Silva, C.A.; Faria, J.A.; Silva, T.A.C. Soil organic carbon and morphology as affected by pine plantation establishment in Minas Gerais, Brazil. For. Ecol. Manag. 2014, 318, 261–269. [Google Scholar] [CrossRef]
  18. Udawatta, R.P.; Gantzer, C.J.; Jose, S. Agroforestry Practices and Soil Ecosystem Services. In Soil Health and Intensification of Agroecosystems; Elsevier Inc.: Amsterdam, The Netherlands, 2017; pp. 305–333. ISBN 9780128054017. [Google Scholar]
  19. Nair, V.D.; Graetz, D.A. Agroforestry as an approach to minimizing nutrient loss from heavily fertilized soils: The Florida experience. Agrofor. Syst. 2004, 61, 269–279. [Google Scholar] [CrossRef]
  20. Tripathi, G.; Deora, R.; Singh, G. The influence of litter quality and micro-habitat on litter decomposition and soil properties in a silvopasture system. Acta Oecol. 2013, 50, 40–50. [Google Scholar] [CrossRef]
  21. Stigter, K.C.J. Agroforestry and (Micro) Climate Change. In Tree-Crops Interactions, Agroforestry in a Changing Climate, 2nd ed.; CABI: Selangor, Malaysia, 2015; pp. 119–145. [Google Scholar]
  22. Sauer, T.J.; Coblentz, W.K.; Thomas, A.L.; Brye, K.R.; Brauer, D.K.; Skinner, J.V.; Van Brahana, J.; DeFauw, S.L.; Hays, P.D.; Moffitt, D.C.; et al. Nutrient cycling in an agroforestry alley cropping system receiving poultry litter or nitrogen fertilizer. Nutr. Cycl. Agroecosyst. 2014, 101, 167–179. [Google Scholar] [CrossRef]
  23. Gaston, L.; Blazier, M.; Beasley, J.; Dodla, S.; Felicien, W.; Clason, T. Silvopasture Switchgrass Fertilized with Poultry Litter: Nutrient Removal, Soil Fertility, and Runoff Water Quality. Commun. Soil Sci. Plant Anal. 2019, 50, 948–958. [Google Scholar] [CrossRef]
  24. NOAA National Oceanic And Atmospheric Administration Net Work, Weather Station at the Northwest Arkansas Regional Airport. Available online: https://www.noaa.gov/opportunity-type/network (accessed on 25 February 2022).
  25. Dold, C.; Thomas, A.L.; Ashworth, A.J.; Philipp, D.; Brauer, D.K.; Sauer, T.J. Carbon sequestration and nitrogen uptake in a temperate silvopasture system. Nutr. Cycl. Agroecosyst. 2019, 114, 85–98. [Google Scholar] [CrossRef]
  26. Rhoades, C.C.; Rhodes, C. Single-tree influences on soil properties in agroforestry: Lessons from natural forest and savanna ecosystems. Agrofor. Syst. 1997, 35, 71–94. [Google Scholar] [CrossRef]
  27. Mehlich, A. Mehlich 3 soil test extractant: A modification of Mehlich 2 extractant. Commun. Soil Sci. Plant Anal. 1984, 15, 1409–1416. [Google Scholar] [CrossRef]
  28. Blake, G.R.; Hartge, K.H. Bulk Density. In Methods of Soil Analysis, Part 1: Physical and Mineralogical Methods; American Society of Agronomy—Soil Science Society of America: Madison, WI, USA, 1986; Volume 9, pp. 363–375. ISBN 9780891188643. [Google Scholar]
  29. Fialho, R.C.; Zinn, Y.L. Changes in soil organic carbon under eucalyptus plantations in brazil: A comparative analysis. Land Degrad. Dev. 2014, 437, 428–437. [Google Scholar] [CrossRef]
  30. Saxton, A.M. A macro for converting mean separation output to letter groupings in Proc Mixed. In Proceedings of the 23rd SAS Users Group International, Nashville, TN, USA, 22–25 March 1998; pp. 1243–1246. [Google Scholar]
  31. Nair, P.K.R.; Kumar, B.M.; Nair, V.D. Agroforestry as a strategy for carbon sequestration. J. Plant Nutr. Soil Sci. 2009, 172, 10–23. [Google Scholar] [CrossRef]
  32. West, T.O.; Post, W.M. Soil Organic Carbon Sequestration Rates by Tillage and Crop Rotation: A Global Data Analysis. Soil Sci. Soc. Am. J. 1997, 66, 1930–1946. [Google Scholar] [CrossRef] [Green Version]
  33. Ma, Z.; Chen, H.Y.H.; Bork, E.W.; Carlyle, C.N.; Chang, S.X. Carbon accumulation in agroforestry systems is affected by tree species diversity, age and regional climate: A global meta-analysis. Glob. Ecol. Biogeogr. 2020, 29, 1817–1828. [Google Scholar] [CrossRef]
  34. Ashworth, A.J.; Adams, T.; Kharel, T.; Philipp, D.; Owens, P.; Sauer, T. Root decomposition in silvopastures is influenced by grazing, fertility, and grass species. Agrosyst. Geosci. Environ. 2021, 4, e20190. [Google Scholar] [CrossRef]
  35. Kuzyakov, Y. Priming effects: Interactions between living and dead organic matter. Soil Biol. Biochem. 2010, 42, 1363–1371. [Google Scholar] [CrossRef]
  36. Adams, T.; Ashworth, A.J.; Sauer, T. Soil CO2 evolution is driven by forage species, soil moisture, grazing pressure, poultry litter fertilization, and seasonality in silvopastures. Agrosyst. Geosci. Environ. 2021, 4, e20179. [Google Scholar] [CrossRef]
  37. Kingery, W.L.; Wood, C.W.; Delaney, D.P.; Williams, J.C.; Mullins, G.L.; van Santen, E. Implications of Long-Term Land Application of Poultry Litter on Tall Fescue Pastures. J. Prod. Agric. 1993, 6, 390–395. [Google Scholar] [CrossRef]
  38. Mowrer, J.; Endale, D.M.; Schomberg, H.H.; Norris, S.E.; Woodroof, R.H. Liming potential of poultry litter in a long-term tillage comparison study. Soil Tillage Res. 2020, 196, 104446. [Google Scholar] [CrossRef]
  39. O’Brien, P.L.; Thomas, A.L.; Sauer, T.J.; Brauer, D.K. Foliar nutrient concentrations of three economically important tree species in an alley-cropping system. J. Plant Nutr. 2020, 43, 2557–2568. [Google Scholar] [CrossRef]
  40. Kharel, T.P.; Ashworth, A.J.; Owens, P.R.; Philipp, D.; Thomas, A.L.; Sauer, T.J. Teasing apart silvopasture system components using machine learning for optimization. Soil Syst. 2021, 5, 41. [Google Scholar] [CrossRef]
  41. Van Eekeren, N.; De Boer, H.; Bloem, J.; Schouten, T.; Rutgers, M.; de Goede, R.; Brussard, L. Soil biological quality of grassland fertilized with adjusted cattle manure slurries in comparison with organic and inorganic fertilizers. Biol Fertil. Soils 2009, 45, 595–608. [Google Scholar] [CrossRef]
  42. Ozlu, E.; Sandhu, S.S.; Kumar, S.; Arriaga, F.J. Soil health indicators impacted by long-term cattle manure and inorganic fertilizer application in a corn-soybean rotation of South Dakota. Sci. Rep. 2019, 9, 11776. [Google Scholar] [CrossRef] [Green Version]
  43. Ylagan, S.; Amorim, H.C.S.; Ashworth, A.J.; Sauer, T.; Wienhold, B.J.; Owens, P.R.; Zinn, Y.L.; Brye, K.R. Soil quality assessment of an agroforestry system following long-term management in the Ozark Highlands. Agrosyst. Geosci. Environ. 2021, 4, e20194. [Google Scholar] [CrossRef]
  44. Ashworth, A.J.; Allen, F.L.; Wight, J.P.; Saxton, A.M.; Tyler, D.D.; Sams, C.E. Soil Organic Carbon Sequestration Rates under Crop Sequence Diversity, Bio-Covers, and No-Tillage. Soil Sci. Soc. Am. J. 2014, 78, 1726–1733. [Google Scholar] [CrossRef]
  45. Blazier, M.A.; Gaston, L.A.; Clason, T.R.; Farrish, K.W.; Oswald, B.P.; Evans, H.A. Nutrient Dynamics and Tree Growth of Silvopastoral Systems: Impact of Poultry Litter. J. Environ. Qual. 2008, 37, 1546–1558. [Google Scholar] [CrossRef]
  46. Berg, B. Litter decomposition and organic matter turnover in northern forest soils. For. Ecol. Manag. 2000, 133, 13–22. [Google Scholar] [CrossRef]
Figure 1. Soil C:N over time in a 17-year agroforestry site in Fayetteville, AR, per tree species, and averaged across fertilization treatments. Dashed lines represent baseline values (1999). Means followed by the same letter do not differ at p < 0.05.
Agronomy 12 00641 g001
Figure 2. Selected soil chemical properties over time in a 17-year agroforestry site in Fayetteville, AR, per tree species, averaged across fertilization treatments. Dashed lines represent baseline values (1999). Means followed by the same letter within a panel do not differ at p < 0.05. (a) Soil pH; (b) Mg concentration in soil (mg kg-1); (c) S concentration in soil (mg kg-1).
Agronomy 12 00641 g002
Figure 3. Selected soil chemical properties over time in a 17-year agroforestry site in Fayetteville, AR, per fertilization treatment, averaged across tree species. Dashed lines represent baseline values (1999). PL, poultry litter. Means followed by the same letter within a panel do not differ at p < 0.05. (a) P concentration in soil (mg kg-1); (b) K concentration in soil (mg kg-1); (c) Mg concentration in soil (mg kg-1); (d) S concentration in soil (mg kg-1).
Agronomy 12 00641 g003
Table 1. Summary of analysis of variance of soil properties in 0–15 cm depth as affected by time (2001, 2008, and 2016), tree species, fertilization, and respective interactions in a 17-year agroforestry site in Fayetteville, AR.
Source of VariationSoil Properties †
pHPKCaMgSSOCNC:N
p-value
Year<0.01<0.010.77<0.010.60<0.010.660.09<0.01
Tree Species<0.01<0.010.530.210.420.820.250.090.16
Year × Tree Species<0.010.360.390.71<0.01<0.010.430.200.03
Fertilization0.09<0.01<0.010.98<0.010.130.750.41<0.01
Year × Fertilization0.10<0.01<0.010.710.03<0.010.820.980.11
Tree Species × Fertilization<0.01<0.010.19<0.010.84<0.01<0.01<0.010.04
Year × Tree Species × Fertilization0.730.690.180.580.080.820.790.660.29
† SOC, soil organic C. ‡ Significant interactions and main effects (p < 0.05) are indicated by bolded text.
Table 2. Summary of analysis of variance of soil properties by tree species, fertilization treatments, soil depth, and their interactions in a 17-year agroforestry site in Fayetteville, AR, in terminal (2016) soil samples.
Source of VariationSoil Properties †
BdpHPKCaMgSSOCNC:NSOC (Mg ha−1)N (Mg ha−1)
p-value
Tree Species 0.36<0.01<0.010.690.510.420.040.590.120.010.810.14
Fertilization0.720.32<0.010.110.69<0.010.640.960.470.060.680.68
Tree Species × Fertilization0.760.12<0.010.280.010.060.09<0.01<0.01<0.01<0.01<0.01
Depth<0.010.20<0.01<0.01<0.01<0.010.04<0.01<0.01<0.01<0.01<0.01
Tree Species × Depth0.560.760.020.540.28<0.010.530.170.370.010.220.52
Fertilization × Depth0.570.99<0.010.360.430.670.150.350.340.690.590.69
Tree Species × Fertilization × Depth0.630.510.130.62<0.010.090.830.060.140.980.390.60
† Bd, bulk density; SOC, soil organic C. ‡ Significant interactions and main effects (p < 0.05) are indicated by bolded text.
Table 3. Selected soil physical and chemical properties by depth in a 17-year agroforestry site in Fayetteville, AR (collected in 2016), averaged across tree species and fertilization treatments.
Depth Soil Properties †
BdpHPKCaMgSSOCNC: NSOCN
cmMg dm−31:1 H2Omg kg−1% Mg ha−1
0–151.16 b ‡6.18 a49.6 a101.6 a1421.4 a63.8 a7.2 a1.50 a0.15 a9.8 a25.8 a2.6 a
15–301.47 a6.12 a16.1 b47.6 b1016.1 b42.0 b6.7 b0.70 b0.08 b8.7 b15.4 b1.8 b
† Bd, bulk density; SOC, soil organic C. ‡ Means followed by the same letter do not differ at p < 0.05.
Table 4. Soil chemical properties in a 17-year agroforestry site in Fayetteville, AR (collected in 2016), per tree species and fertilization treatment, averaged across soil depth (0–15 and 15–30 cm).
Tree SpeciesFertilization Source †Soil Properties ‡
PCaSOCNC: NSOCN
mg kg−1% Mg ha−1
OakControl42.1 a ¶1302.5 ab1.19 a0.12 ab9.9 a22.4 a2.24 ab
PL39.3 a1067.1 b0.98 b0.11 b9.2 b18.6 b2.01 b
PecanControl9.7 b1098.4 b1.01 b0.11 b8.9 b19.2 b2.09 b
PL40.3 a1407.2 a1.22 a0.13 a9.1 b22.2 a2.39 a
† PL, poultry litter. ‡ SOC, soil organic C. ¶ Means followed by the same letter within a column do not differ at p < 0.05.
Table 5. Pearson’s correlation coefficients between soil properties at the 0–15 cm and 15–30 cm soil depth in a 17-year agroforestry site in Fayetteville, AR.
Soil Properties † (0–15 cm)
pHPKCaMgSSOCNC: N
Bd−0.24 ‡−0.35−0.25−0.55−0.35−0.07−0.57−0.61−0.10
pH −0.03−0.070.550.33−0.430.250.270.01
P 0.360.550.210.320.610.600.22
K 0.270.290.060.190.25−0.07
Ca 0.44−0.100.710.710.29
Mg −0.420.340.40−0.03
S 0.370.300.34
SOC 0.960.49
N 0.25
Soil Properties (15–30 cm)
pHPKCaMgSSOCNC: N
Bd−0.12−0.170.11−0.260.11−0.19−0.41−0.43−0.17
pH 0.15−0.140.67−0.02−0.580.320.350.09
P 0.220.580.270.050.570.560.25
K 0.260.590.070.310.40−0.07
Ca 0.39−0.260.710.690.36
Mg −0.080.240.250.08
S 0.210.120.28
SOC 0.930.60
N 0.27
† Bd, bulk density; SOC, soil organic C. ‡ Significant interactions (p < 0.05) are indicated by bolded text.
Publisher’s Note: MDPI stays neutral with regard to jurisdictional claims in published maps and institutional affiliations.

