Article

Cereal and Pulse Crops with Improved Resistance to Pratylenchus thornei Are Needed to Maximize Wheat Production and Expand Crop Sequence Options

1
Centre for Crop Health, Institute for Agriculture and the Environment, University of Southern Queensland, Toowoomba, QLD 4350, Australia
2
Leslie Research Facility, Department of Agriculture and Fisheries Queensland, Toowoomba, QLD 4350, Australia
*
Author to whom correspondence should be addressed.
This author has retired.
Agronomy 2022, 12(3), 573; https://doi.org/10.3390/agronomy12030573
Submission received: 22 December 2021 / Revised: 17 February 2022 / Accepted: 24 February 2022 / Published: 25 February 2022
(This article belongs to the Section Pest and Disease Management)

Abstract

:
In the subtropical grain region of eastern Australia, two experiments were conducted, one initially with 2490 P. thornei/kg soil, the other with 8150 P. thornei/kg soil at 0–0.9 m soil depth. We determined the effect of P. thornei, residual from a weed-free fallow and pre-cropping with several cultivars each of barley (Hordeum vulgare), faba bean (Vicia faba), chickpea (Cicer arietinum), and wheat (Triticum aestivum) (Phase 1), on the growth of wheat cultivars with intolerance or tolerance to P. thornei (Phase 2). Pratylenchus thornei substantially increased after growing all cultivars of the Phase 1 faba bean, barley, and most cultivars of chickpea and wheat, and decreased after two moderately resistant wheat cultivars and the fallow treatment. The biomass of the Phase 2 tolerant cultivar ranged from 5070 to 6780 kg/ha and the intolerant cultivar 1020 to 4740 kg/ha. There was a negative linear relationship between P. thornei population densities and biomass of the Phase 2 intolerant cultivar but not of the tolerant cultivar. Growers are at risk of financial loss because they are restricted in their choice of crops to reduce damaging population densities of P. thornei. The development of resistant and tolerant crop genotypes can maximize production in P. thornei-affected farming systems.

1. Introduction

Many wheat (Triticum aestivum) growers in Australia and internationally need to reduce damaging populations of the root-lesion nematode Pratylenchus thornei in their fields. This situation arises because the nematode has a broad host range and exhibits rapid, exponential population growth in-crop [1,2]. In addition, residual nematode populations, which are found throughout the soil profile, are capable of remarkable survival during extended weed-free fallow periods between crops [3,4]. Pratylenchus thornei can cause up to 76% grain yield loss in intolerant wheat because plants suffer water and nutrient deficiency as this migratory nematode feeds and reproduces within roots [5,6]. Reduced grain yield is a result of decreased number of tillers per plant and plant biomass during crop growth and at maturity [5,7,8]. Damage thresholds, that is, population densities that cause economic losses, can vary greatly for wheat and are influenced by cultivar tolerance and environmental factors [1,9]. The threshold of P. thornei population densities causing damage to intolerant wheat in the subtropical grain region of eastern Australia is estimated to be 2000 P. thornei/kg soil at any soil depth interval in the soil profile [10].
Management to reduce damaging population densities of P. thornei relies on selecting crops that are not only tolerant but also resistant (that is, crops that do not suffer yield loss when grown in infested soil and do not allow the nematode to reproduce) and are also profitable for growers [11,12]. There has been excellent progress in the subtropical grain region of eastern Australia to breed wheat with tolerance to P. thornei, which ensures yield loss is minimised. Currently in the region, 60% of bread wheat cultivars are rated as moderately tolerant to P. thornei. However, of the 27 cultivars recommended for the region, none are completely tolerant and the highest rating of resistance for 4 out of the 27 cultivars, is moderately resistant–moderately susceptible [13]; all other cultivars are susceptible. In response to this, efforts to breed resistant wheat are on-going; however, it will be some time before the majority of wheat cultivars are both tolerant and resistant [14,15]. Growers, therefore rely on growing resistant crops, such as sorghum (Sorghum bicolor), in rotation with wheat to reduce population densities of P. thornei [5,7].
A wide variety of both summer (sown in late Spring and mid-Summer) and winter crops (sown in late Autumn and early Winter), including cereals, pulses, and oilseeds, are grown in the subtropical grain region of eastern Australia (also known as the northern grains region). The majority of Australia’s production of high-protein bread wheat and chickpea (Cicer arietinum) are from this rain-fed zone, while barley (Hordeum vulgare) and faba bean (Vicia faba) make up 11% and 10% of national crop production respectively [16,17,18]. The region has a summer dominant rainfall of 600–800 mm annually [10]. However, winter crops can be grown when in-crop rainfall is sporadic and unreliable because the soils have a high clay content and a high water-holding capacity to store soil water during fallow periods [19]. The diversity of winter and summer cropping options available to growers offers the potential to improve wheat production due to the benefits offered by break crops, particularly with legumes, to improve weed control, soil water management, and soil nitrogen [20,21]. However, the broad host range of P. thornei can mitigate these benefits. If P. thornei population densities increase through a sequence of susceptible host crops, the risks of yield losses within those crops, and subsequent wheat crops, increases substantially.
Our previous research demonstrated that the summer grain crops, millets (Echinochloa esculenta, E. frumentacea, Pennisetum glaucum, P. miliaceum, and Setaria italica), sorghum, sunflowers (Helianthus annuus), and most maize cultivars (Zea mays) tested were partially resistant to P. thornei [7]. In contrast, most cultivars of mungbean (Vigna radiata), blackgram (V. mungo) and soybean (Glycine max) were susceptible and caused marked increases in population densities of P. thornei. Currently there is no information directly comparing the impact of several cultivars of winter grain crops grown in rotation with wheat on the management of P. thornei in the farming systems of the subtropical grain region of eastern Australia.
The objective of the present study was to assess the role of winter grain crops in the management of P. thornei. Population densities of P. thornei were determined after growing several cultivars of wheat, barley, chickpea, and faba bean and a weed-free fallow treatment in replicated experiments at two adjacent field sites that differed in initial P. thornei population densities. In the next season, following a 7-month weed-free fallow, we measured the effect of those residual P. thornei population densities on the growth of one intolerant and one tolerant wheat cultivar.

2. Materials and Methods

2.1. Field Site

Both experiments were conducted in 2009–2010 near Formartin, Queensland, Australia, on a rain-fed 15 ha area of farmland (27.464° S, 151.426° E; 364 m elevation) managed for testing the tolerance of crops to P. thornei [22]. This research location is divided into four cropping strips each with a 4-year crop sequence of long fallow, sorghum, long fallow, wheat, short fallow followed typically by winter crop experiments [22]. The sequence of crops within each strip produces a uniform population density of P. thornei and minimizes other diseases. Experiment 1 was sown on a cropping strip following the sorghum and long fallow sequence, and Experiment 2 was sown following the wheat and short fallow sequence (Table 1). At this site, weeds are controlled with non-residual herbicides during crop growth and between crops to maintain weed-free fallow periods. Stubble was left standing after harvest of each crop and zero tillage was practised during fallow periods. Soil at the site is a haplic, self-mulching, endohypersodic, black Vertosol [23] of the Waco Series [24]. Fertilizer, drilled into the soil at ~50 mm depth, was applied as urea at the rate of 100 kg N/ha in April each year of the experiment. At sowing, StarterZ (Incitec Pivot Limited, Southbank, Victoria, Australia) was applied at the rate of 40 kg/ha in the drill rows to a depth of ~50 mm to supply 4.0 kg N/ha, 8.2 kg P/ha, and 1.0 kg Zn/ha. The average annual rainfall is 637 mm (Bureau of Meteorology station, Jondaryan Post Office; Station Number 41053, 27.37° S, 151.59° E, elevation 382 m, 123 years of records).

2.2. Field Experiment and Design

Each experiment consisted of Phase 1 cultivars of several winter crop species (Table 2) and a weed-free fallow treatment. The fallow treatment was maintained by hand-weeding as required. In Phase 2 of the experiments, two wheat cultivars that differed in their tolerance to P. thornei were grown. The previous cropping history, P. thornei population densities and available water content (AWC) (mm) at 0–0.9 m soil depth before each experiment started, timing of field operations and soil sampling, and rainfall are listed in Table 1 and Table 3. Agronomic procedures followed local practices. The design of each experiment was three replicates of factorial treatments in randomized complete blocks. The treatments were formed by the factorial of 24 Phase 1 treatments ×two Phase 2 wheat cultivars. The Phase 1 treatments were each replicated to allow for two, Phase 2 wheat cultivars to be sown (total of 144 plots in each experiment).
In Experiment 1, one month before starting the experiment, P. thornei population densities and available water content at 0–0.9 m soil depth were 2490/kg soil and 110 mm, respectively. Before starting Experiment 2, P. thornei population densities and available water content were 8150/kg soil and 98 mm, respectively. Population densities of P. thornei, and M. brevidens, free-living nematodes, and available soil water content at each soil depth interval to 0.90 m are shown in Supplementary Table S1.
The Phase 1 crops in Experiments 1 and 2 were six cultivars or fixed breeding lines each of the winter crops, barley (Hordeum vulgare), chickpea (Cicer arietinum), and faba bean (Vicia faba) and five of wheat (Triticum aestivum) (Table 2). Crops were sown in seven drill rows with 0.25 m row spacing forming plots that were 13 m long × 1.75 m wide. Plant population densities were 100/m2 for wheat and barley, 35/m2 for faba bean, and 25/m2 for chickpea. Rhizobia inoculant (Mesorhizobium ciceri, ‘Group N’ for chickpea and Rhizobium leguminosarum bv. viciae ‘Group F’ for faba bean in a peat formulation) was mixed with the seed just prior to sowing. Grain from each plot was mechanically harvested as each crop reached maturity. Following a 7-month weed-free fallow, wheat cvs EGA Wylie and Strzelecki respectively rated as tolerant–moderately tolerant and intolerant to P. thornei [13], were sown in July into the Phase 1 plots following the experimental design, with fertilizer and sowing as described for Phase 1. Wheat plants were sampled to measure biomass at grain filling (plant growth stage 71 [25]) by cutting whole plants level with the soil from two 1-metre lengths within the middle rows of each plot in two positions, selected arbitrarily. Plant samples were dried at 80 °C for 4 days in a forced-draught oven and dry weights were recorded. Flooding rains in November prevented harvest of grain yield.

2.3. Soil Sampling

Soil was collected in May in each year before sowing. Before starting the experiments (Phase 1), a characterisation of each site used for each experiment was carried out. Two soil cores were collected at each of nine sampling points selected in a grid pattern within each of the areas allocated to Experiments 1 and 2. Following the Phase 1 treatments, in the second year of each experiment (Phase 1), two soil cores were collected at each of nine sampling points selected in a grid pattern across each experimental site. In the second year (Phase 2), three cores were collected at ~3 m intervals from each plot on the three middle rows. In both years, soil cores were taken to 1.5 m depth using a hydraulically operated push-tube with an internal diameter of 43 mm, which was mounted on a custom-built soil sampling platform that straddled the plots. Each soil core was cut into seven depth intervals (0–0.15, 0.15–0.3, 0.3–0.45, 0.45–0.6, 0.6–0.9, 0.9–1.2, and 1.2–1.5 m) and the composite samples (two cores before the Phase 1 of the experiments; three cores before sowing Phase 2 of the experiments) for each depth interval were placed in a plastic bag, sealed, and then stored at 4 °C until processing.

2.4. Nematode Extraction and Soil Water

The composited soil samples were broken manually into <5 mm aggregates, mixed, and nematodes extracted from a 150 g field-moist sub-sample for 48 h at 22 °C by the Whitehead tray method [26]. Nematodes were collected on a 200 mm diameter sieve with a 20 µm aperture size (Glenammer Engineering Ltd., Ayrshire, UK). Pratylenchus thornei and Merlinius brevidens were morphologically identified [27,28] and counted in a 1 mL nematode counting chamber (Chalex Corporation, Centreville, MD, USA) under a compound microscope at ×40 and ×100 magnification. Non-parasitic nematodes were counted without speciation. Counts were expressed on a dry-soil weight basis after arithmetic correction for soil moisture content. Gravimetric soil moisture was determined by oven-drying a 100 g field-moist sub-sample at 105 °C for 48 h. Average nematodes/kg dry soil were also calculated for accumulated soil depth intervals (0–0.15, 0–0.3, 0–0.45, 0–0.6, and 0–0.9 m). Available soil water content (mm) above wilting point was calculated for each depth interval using bulk density to convert gravimetric to volumetric soil water content [29].

2.5. Statistical Analysis

Linear mixed models were used in the analyses of the data from the two experiments. The REML (Residual Maximum Likelihood) procedure in GenStat [30] was used to fit all of the models and the level of significance was set at 5% for all testing.
For the data collected before sowing in each year, separate residual variances were fitted for each experiment, the fixed effects were experimental site, depth, and their interaction; the correlation across depths was fitted with the power model as a random effect. For the across experimental sites analyses of the Phase 1 winter crop yields, each crop (barley, chickpea, faba bean, and wheat) was analysed separately with the replicate block and residuals variance fitted separately for each site as random terms, and cultivar, site, and their interaction fitted as fixed terms.
In the analyses of the nematode population, densities averaged over the whole soil profile, the fixed effects were crop cultivars, experimental site, and their interaction, and if the interaction was significant then these effects were partitioned by crop to test whether the interaction persisted within each crop. Nematode count data were transformed by ln(x + c) where x equals P. thornei/kg dry soil including roots and c equals a constant chosen to stabilise the variances of the residuals across the range of fitted values [31,32]. Nematode population densities were very low or zero below 0.9 m and were not included in the statistical analyses.
The relationship between biomass of each of the Phase 2 wheat cultivars (as the dependent variable) and nematode population densities and available soil water after the Phase 1 treatments (measured 2 months prior to sowing the Phase 2 wheat) as the independent variables were explored in a grouped regression approach within the REML analysis as described above. Non-significant terms were dropped from the analysis and slopes were fitted separately to find a parsimonious model. The adjusted R2 value was determined by a simple linear regression of observed biomass of the Phase 2 wheat cultivars versus the fitted values of P. thornei population densities and available water content from REML. Predicted biomass loss (%) was determined within the range of the data from the regression equations by solving them with the minimum and maximum population densities of P. thornei and available water content.

3. Results

3.1. Grain Yield of the Phase 1 Crop Cultivars

In an analysis of grain yield across Experiments 1 and 2, the barley cultivars Gairdner, Grout, and Grimmett were significantly lower in Experiment 2 compared to Experiment 1 (p = 0.02; 19, 13 and 13% lower yield, respectively). For chickpea, faba bean, and wheat grain yield there was a significant effect of cultivar (p = 0.039; < 0.001; < 0.001, respectively) but not of Experimental site (Supplementary Table S2).

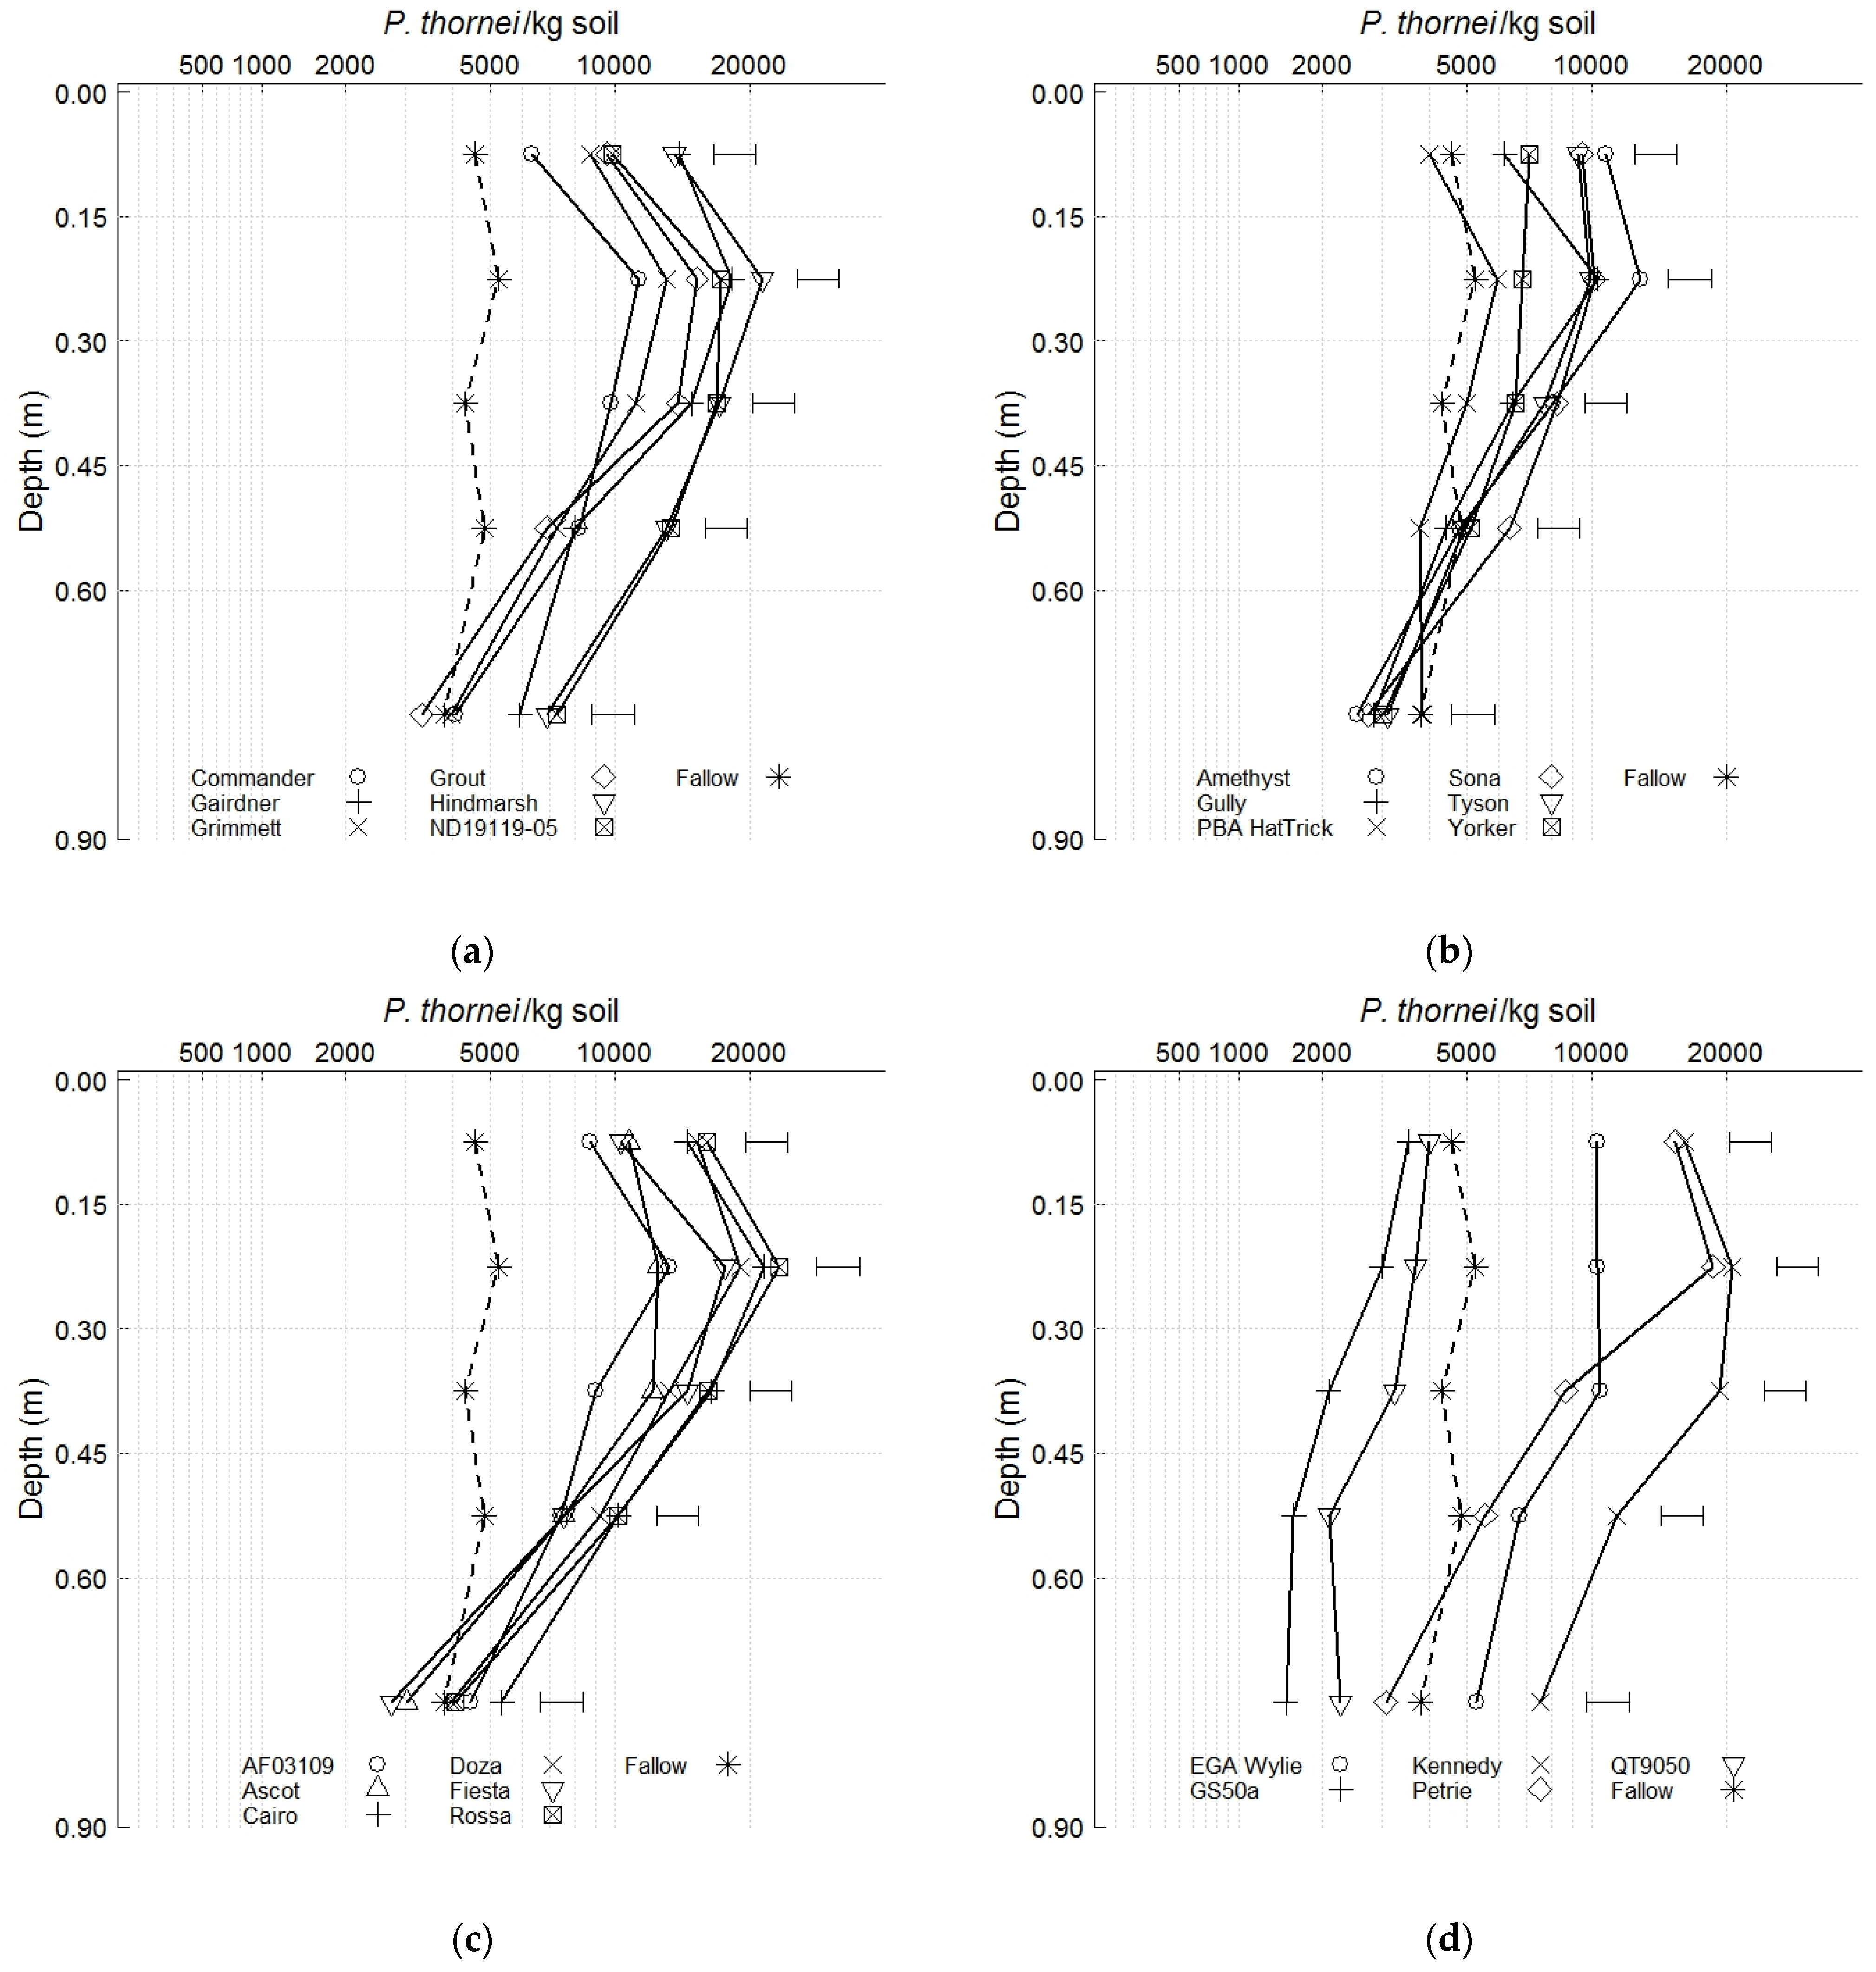
3.2. Nematode Population Densities and Soil Water before Sowing the Phase 2 Wheat Cultivars

For population densities of P. thornei at individual soil depth intervals 6 months after harvest of the Phase 1 winter crops, there was a significant interaction for soil depth x cultivars (p = 0.001); there was no significant effect of experimental site (p > 0.05). In an analysis across both experiments, population densities of P. thornei were noticeably greater at each soil depth interval to 0.6 m after all cultivars of barley and faba bean (Figure 1a,c) compared to the fallow treatment. For chickpea, population densities were greater than the fallow treatment after cvs Amethyst, Tyson, Sona, and Gully but were similar to the fallow treatment for cv. PBA HatTrick; cv. Yorker was intermediate compared to the other cultivars (Figure 1b). For wheat, population densities of P. thornei increased markedly in the top 0.3 m soil depth interval after cvs Kennedy, Petrie, and EGA Wylie, whereas after cv. GS50a population densities were significantly less than the fallow at each depth interval from 0.15 to 0.9 m and for cv. QT9050 at 0.45 to 0.9 m soil depth (Figure 1d). The distribution of P. thornei after wheat cv. Petrie differed compared to the other cultivars with large population densities at 0–0.3 m soil depth and a marked decrease after that depth interval to 0.9 m. Across all of the Phase 1 crop cultivars, population densities were generally greatest at 0.15–0.3 m soil depth, and ranged from 2080/kg soil after wheat cv. GS50a to 23,080/kg soil after faba bean cv. Rossa (Figure 1).
Comparison of cultivars within each crop species at 0–0.9 m soil depth showed that there was no significant interaction between sites (p > 0.05). For barley, population densities of P. thornei at 0–0.9 m soil depth, were least after cv. Commander and greatest after cv. Hindmarsh (8060–14,070/kg soil, p < 0.001). For chickpea, population densities among cultivars were not significantly different (p = 0.224) and ranged from 4965/kg soil for cv. PBA HatTrick to 7160/kg soil for cv. Amethyst. For faba bean, population densities were least after cv. AF03109 and greatest after cv. Rossa (8510–13,240/kg soil, p = 0.007). For wheat, population densities were significantly least after cv. GS50a and greatest after cv. Kennedy (2337–14,400/kg soil, p < 0.001) (Figure 2a). A comparison of the final population densities for each crop cultivar compared to wheat cv. GS50a (the lowest population density) showed increases of 3- to 6-fold for barley, 2- to 3-fold for chickpea, 3- to 5-fold for faba bean, and 1- to 6-fold for wheat (Figure 2a). For P. thornei population densities after the fallow treatment there was a significant effect of experimental site (p = 0.004); population densities were 2950/kg and 7820/kg soil in Experiments 1 and 2, respectively (Figure 2a).
For available soil water content at 0–0.9 m soil depth 6 months after harvest of the Phase 1 treatments, there was a significant effect only for cultivars within barley and wheat (p < 0.001 for both crops). For barley, available water was least after cv. Grout (71 mm) and greatest after cv. Gairdner (92 mm). For wheat, available water was least after cv. EGA Wylie (64 mm) and greatest after cv. Petrie (106 mm) (Figure 2b). There were no significant differences (p > 0.05) in available water between cultivars of chickpea (87–106 mm), faba bean (87–105 mm) (Figure 2b), or between the fallow treatments in Experiments 1 and 2 (99 and 120 mm, respectively).
For M. brevidens at 0–0.9 m soil depth, there was a significant effect of experimental site for barley, chickpea, and faba bean (p = 0.014, 0.008, and 0.016, respectively). Population densities were least in Experiment 1 (135–468/kg soil) and greatest in Experiment 2 (944–1376/kg soil) (Supplementary Table S2).
For non-parasitic nematodes there was an effect of crop species or fallow treatments only (p < 0.001). Population densities were least after the fallow (1970/kg soil) and greatest after the crops (3128–3919/kg soil) (data not shown).

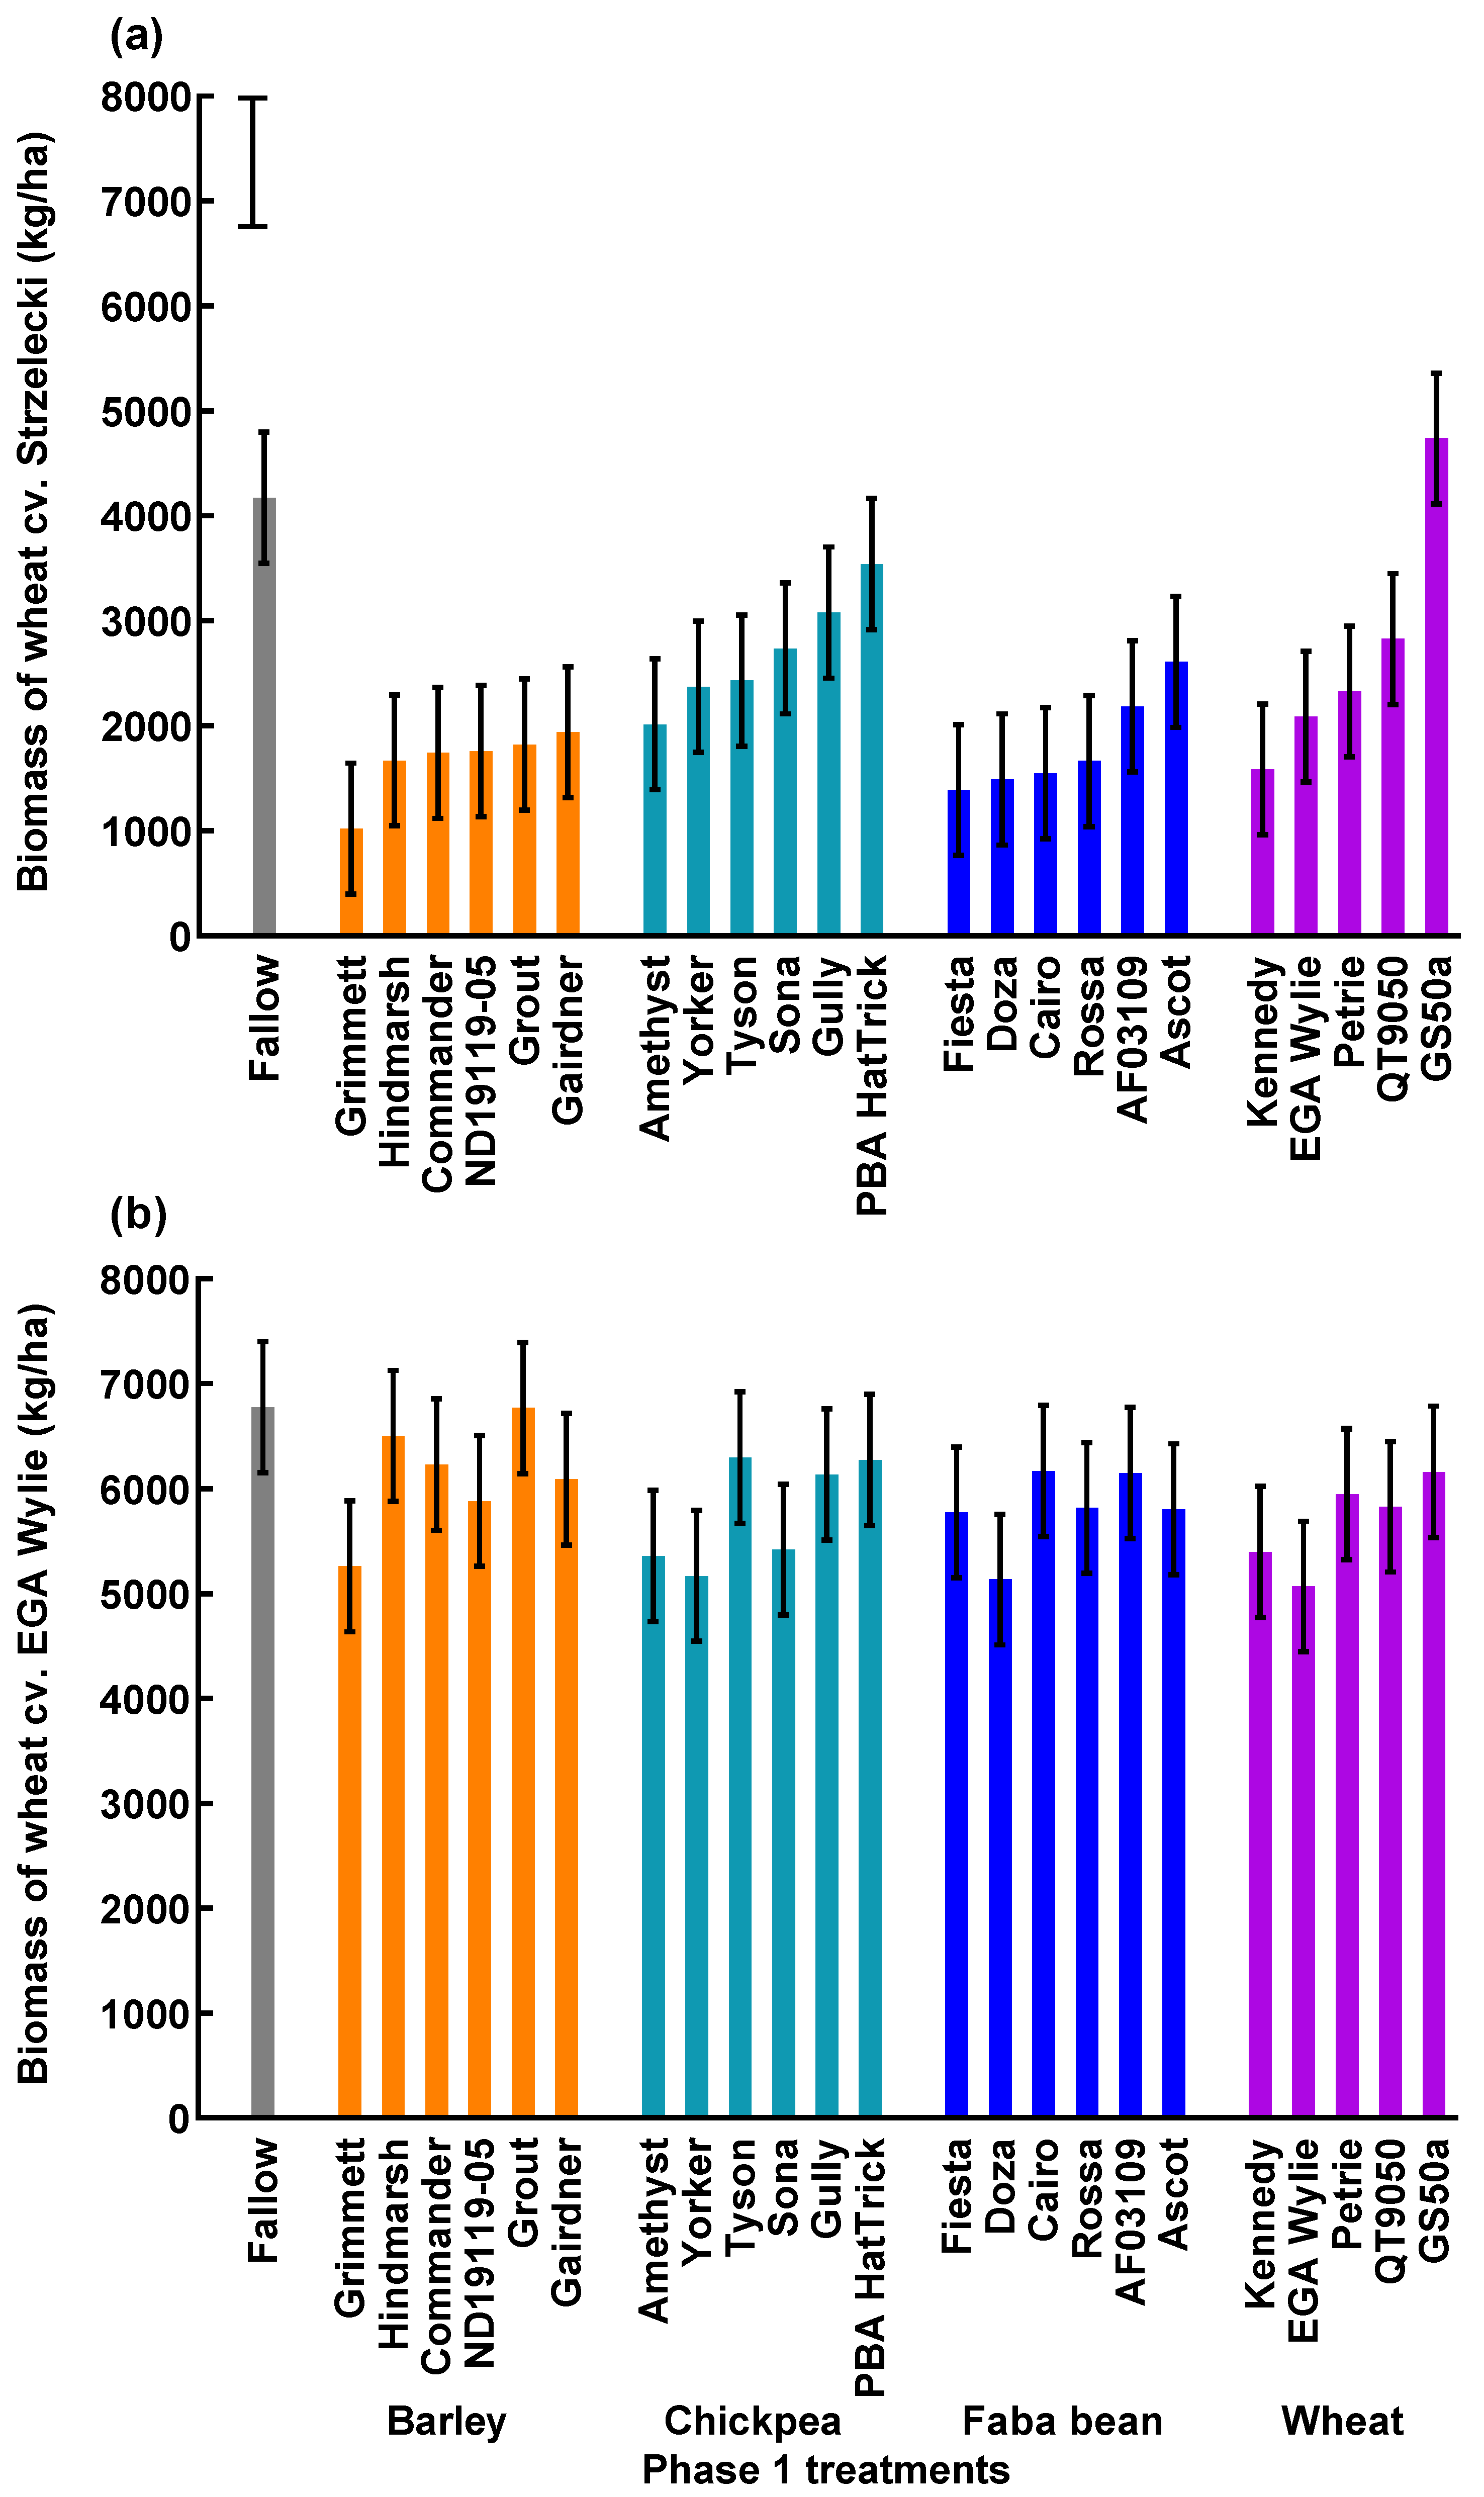
3.3. Biomass of the Phase 2 Wheat

There was no significant effect of experimental site (p = 0.103) on the biomass at grain filling of the Phase 2 wheat cultivars. There was a significant interaction between the Phase 1 treatments and the Phase 2 wheat cultivars (p = 0.008) where wheat cv. Strzelecki ranged from 1020 kg/ha after first year barley cv. Grimmett to 4740 kg/ha after wheat cv. GS50a (Figure 3a). In contrast, biomass of EGA Wylie ranged from 5017 kg/ha after the first-year wheat cv. EGA Wylie to 6780 kg/ha after the fallow treatment (Figure 3b).

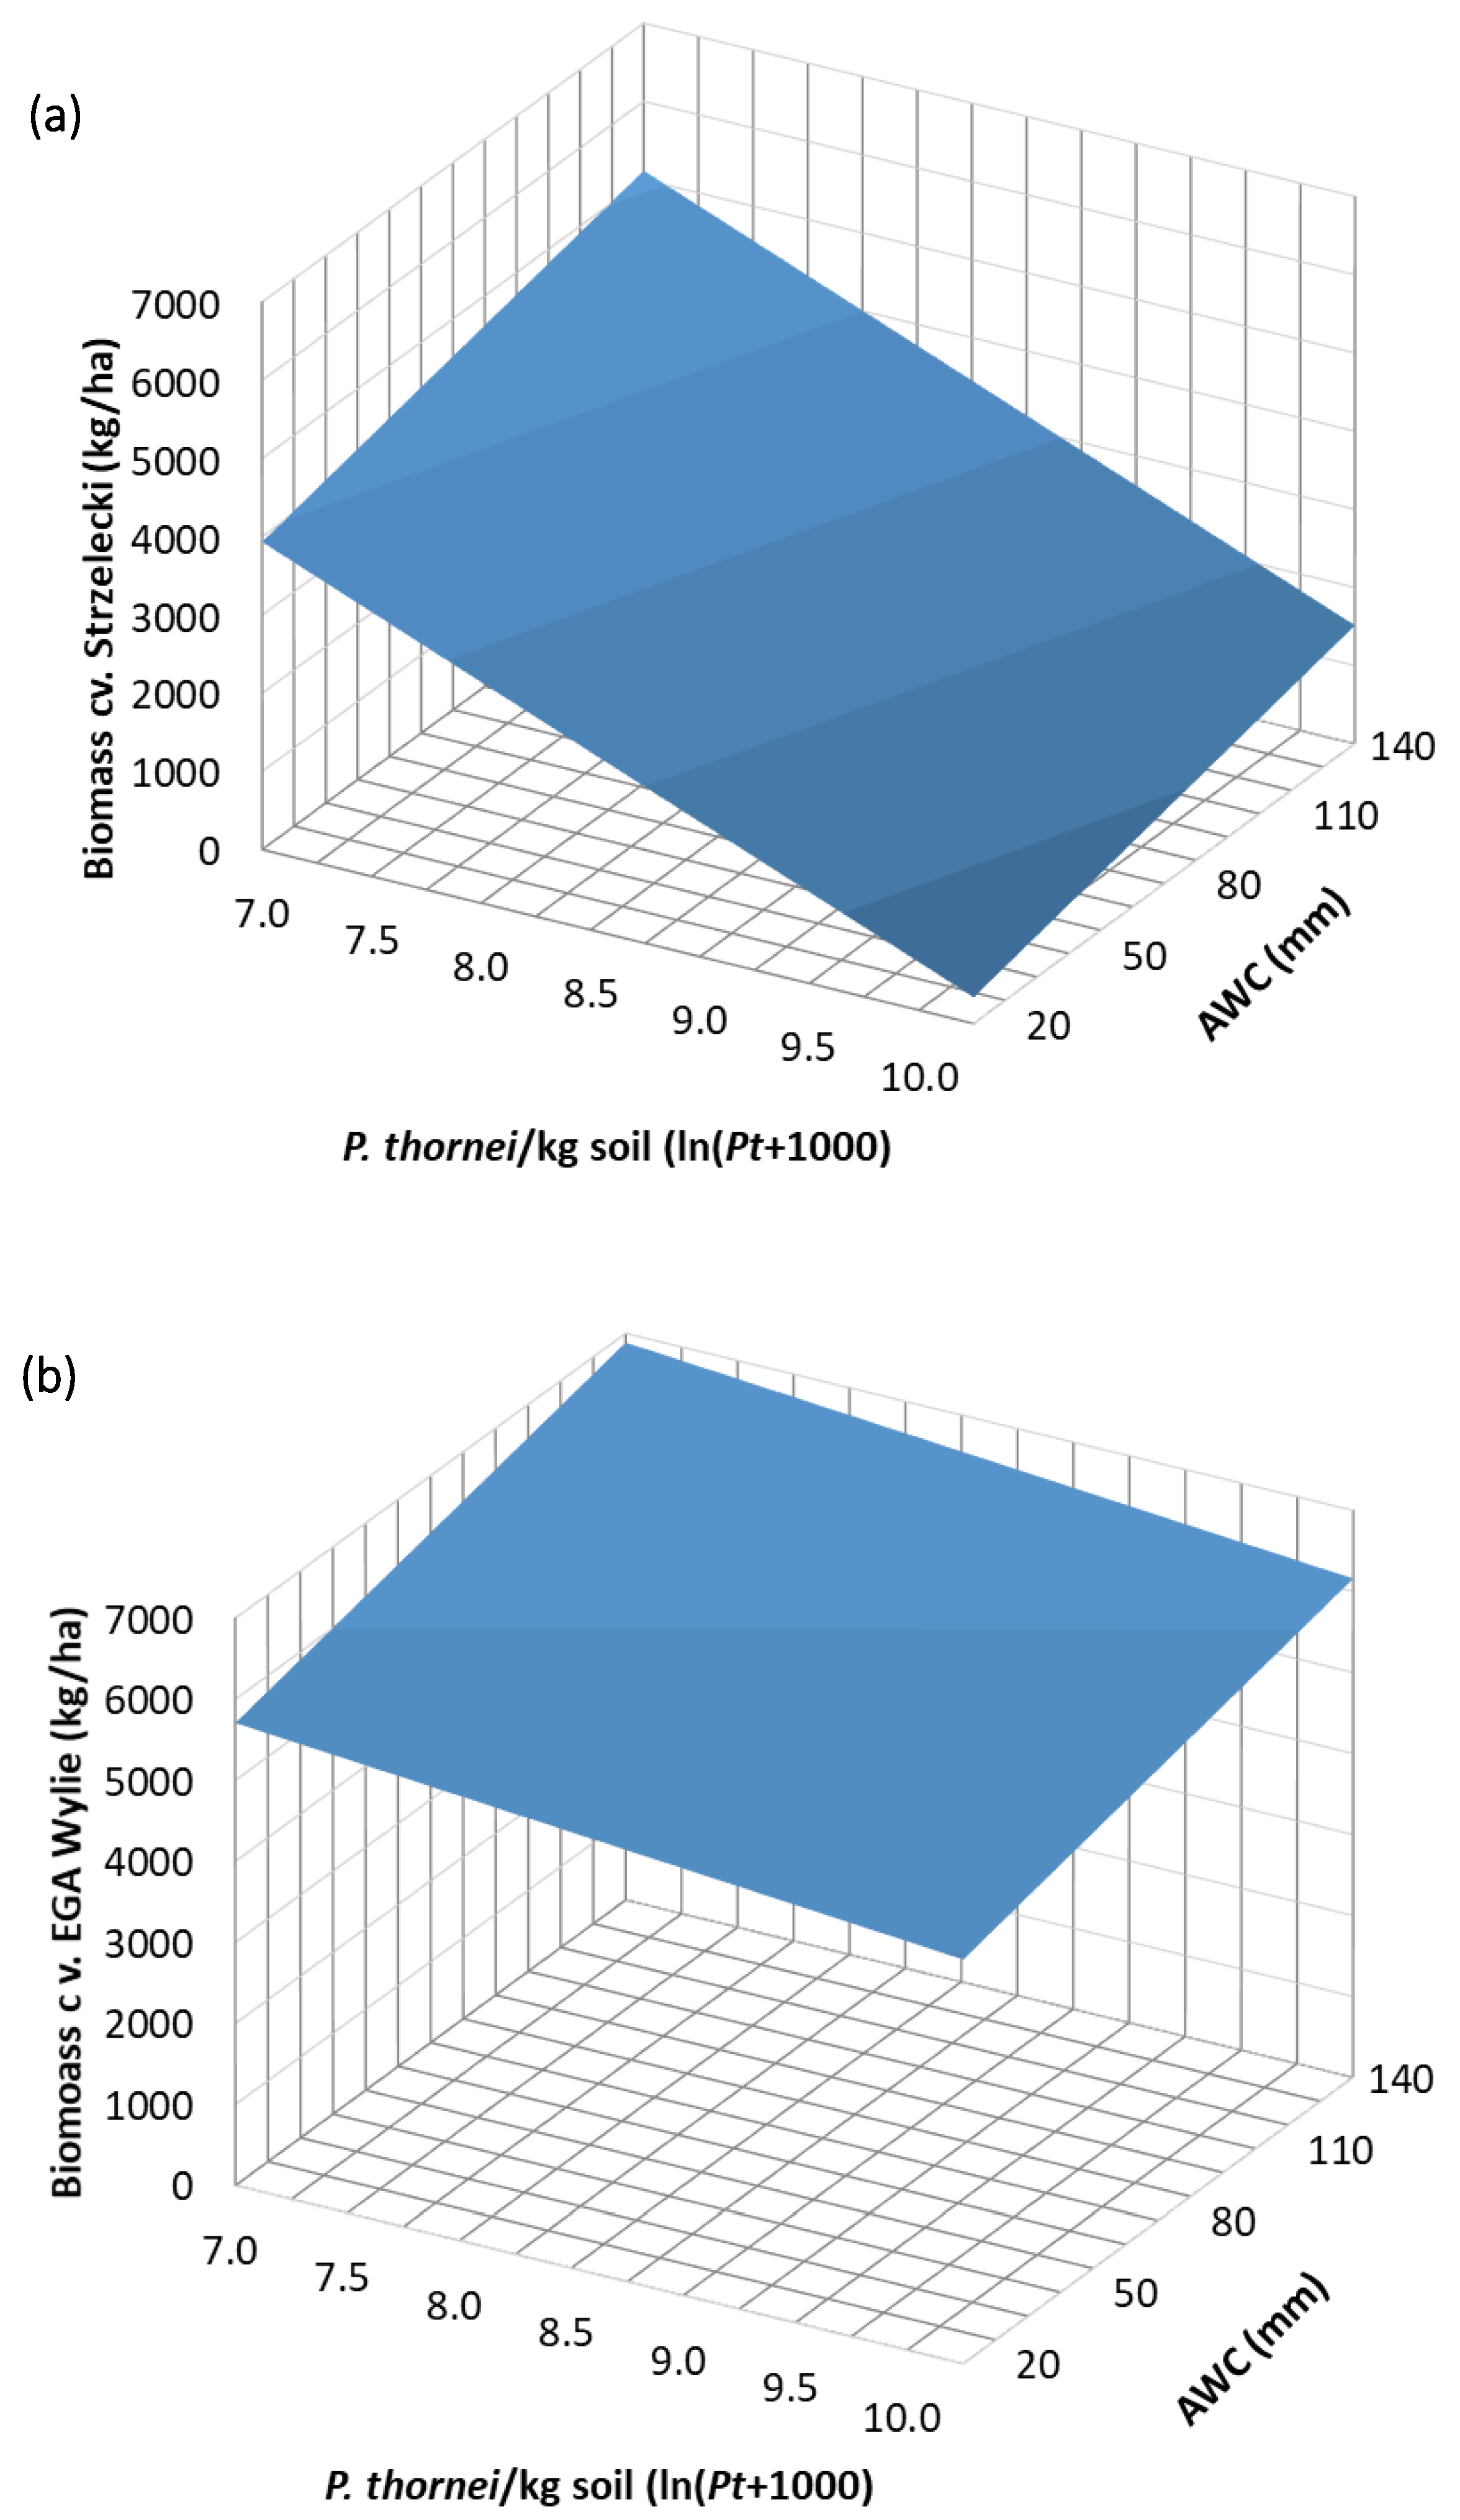
3.4. Regression Analysis

Biomass of the Phase 2 wheat cultivars at grain filling was explained by multiple regression analyses of P. thornei (ln(P. thornei + 1000)) and available water content at 0–0.90 m soil depth following the Phase 1 treatments (Figure 4). The adjusted coefficient of determination (R2) value for the regression of observed versus fitted values was 0.73. The relationship between biomass and P. thornei population densities differed between wheat cultivars, with a significant (p < 0.001) slope for Strzelecki (Figure 4a) but for EGA Wylie, the slope was not significantly different from zero (p = 0.215) (Figure 4b). The biomass of Strzelecki decreased by 1107 kg/ha per unit of ln(P. thornei/kg soil + 1000). For AWC, there was a positive, common linear slope for both wheat cultivars (p < 0.001) with an increase in biomass of 9.8 kg/ha per unit of AWC (Figure 4). Predicting biomass of cv. Strzelecki for the range of P. thornei (back-transformed 97–27,283 P. thornei/kg soil) and AWC (20–140 mm) resulted in a difference of 3653 kg/ha. The loss of predicted biomass at the highest population density of P. thornei compared with the lowest population density was 71% and 93% at maximum and minimum AWC values respectively. There was no significant effect of M. brevidens or non-parasitic nematodes on biomass of the second-year wheat cultivars (data not shown).
B i o m a s s   c v .   S t r z e l e c k i = 11487   ( SE   1684 ) + 9.822 ( A W C )   ( SE   2.888 ) 1107 ( ln ( P t + 1000 )   ( SE   183.1 ) AWC   p <   0.001 ;   P. thornei   p <   0.001 B i o m a s s   c v .   E G A   W y l i e = 7081   ( SE   1702 ) + 9.822 ( A W C ) ( SE   2.888 ) 224.1 ( ln ( P t + 1000 )   ( SE   180.2 ) AWC   p <   0.001 ;   P. thornei   p = 0.215

4. Discussion

The objective of this study was to compare the effect of 23 cultivars of 4 major winter grain crops and a weed-free fallow on the management of P. thornei by measuring (1) changes in population densities of P. thornei throughout the soil profile, and (2) the growth of the next intolerant and tolerant wheat cultivars in the cropping sequence. Of the Phase 1 crops, only two wheat cultivars caused population densities of P. thornei to decrease compared to the weed-free fallow treatment. The majority of cultivars of barley, chickpea, faba bean, and wheat caused population densities to increase compared to the weed-free fallow treatment. Importantly, P. thornei population densities remained above minimum damaging levels (>2000 P. thornei/kg soil) in both experiments, following all Phase 1 treatments, including the weed-free fallow.
Consequently, in the next crop sequence, biomass of the intolerant wheat cultivar was reduced 71% in a linear relationship between biomass of the Phase 2 wheat and the Phase 1 population densities of P. thornei at 0–0.9 m soil depth at the highest AWC. This percentage loss increased further to 93% at the lowest AWC. In contrast, the mean biomass of a Phase 2 tolerant wheat cultivar (EGA Wylie) was 2.6 times greater than the mean biomass of the intolerant cv. Strzelecki. The biomass of cv. Strzelecki was significantly reduced by P. thornei population densities, but that of EGA Wylie was not. Although grain yield of the second-year wheat cultivars could not be measured in the current study, biomass of wheat cv. Strzelecki in an experiment at the same location [7] was strongly predictive of grain yield by the following regression:
G r a i n   y i e l d   c v .   S t r z e l e c k i = 994.9 + 0.425 x
where x = biomass of cv. Strzelecki at anthesis (kg/ha), n = 96, p < 0.001, R2 = 0.78. Additionally, other studies on P. thornei from the same region have demonstrated similar, negative linear responses of intolerant wheat biomass and grain yield in response to P. thornei population densities [5,7,29].

4.1. Crop Rotation to Manage P. thornei

Pratylenchus thornei is difficult to control because of its broad host range and its survival in fallow periods. In the present study, population densities of P. thornei decreased after growing the moderately resistant wheat cultivars, but population densities remained above the economic threshold for damage to an intolerant wheat cultivar. In other studies, growing two moderately resistant crops sequentially had a compounding effect, resulting in decreased P. thornei population densities compared to when only one moderately resistant crop was included in the cropping sequence [5,7,33]. In some situations, like those in the present study, more than two resistant crops are needed. For example, in Experiment 1 sorghum, which is moderately resistant, was grown before the experiment started followed by the moderately resistant wheat cultivar treatments, but population densities remained at high levels.
Notably in Experiment 1, in the weed-free fallow treatment (which was crop-free for 26 months), population densities also remained at damaging levels. In the subtropical grain region of eastern Australia, there was an exponential decline of population densities of P. thornei during periods of continuous fallow and sorghum; however, it took up to 600 days to reduce population densities from 80,000/kg soil to below the economic threshold of 2000/kg soil [4]. Fallow periods also have detrimental effects on soil carbon and biology, including free-living nematodes [34], and this was supported by our study in which population densities of non-parasitic nematodes were markedly reduced after the weed-free fallow treatment compared to after the Phase 1 crops. On the other hand, the poor survival of the ecto-parasitic nematode, Merlinius brevidens in the extended fallow period (population densities of M. brevidens were reduced 4.3 times after the fallow treatment compared to the crop treatments) may limit its potential to cause yield loss in the region, despite being more frequently detected in grain fields than P. thornei [10].
The value of deliberate, targeted breeding to produce wheat cultivars with high levels of tolerance and/or moderate resistance to counteract the impact of P. thornei was demonstrated in the present study by the low P. thornei population densities and high grain yield of the Phase 1 cultivars GS50a and its derivative QT9050. Serendipitous release of cultivars with improved resistance to P. thornei may occur, for example, the chickpea cv. PBA HatTrick, which had resistance to strains of ascochyta blight (Ascochyta rabiei) [35], was less susceptible to P. thornei than the other cultivars tested. Recently, superior resistance to P. thornei was identified in a new collection of wild relatives of chickpea and these resistant accessions will offer Australian plant breeders new material to improve resistance of commercial cultivars [36]. Other winter crops with resistance to P. thornei include oats (Avena sativa), canaryseed grass, linseed (Linum usitatissimum), and canola (Brassica napus ssp. olifera var. annua) [29,37,38,39,40]. The usefulness of these crops is limited if there are poor economic returns, insufficient market access, limits to production such as frost risk or disease, or negative impacts of rotation crops in the farming system, such as the non-mycorrhizal status of canola.

4.2. Growth of Phase 1 Crops and Residual P. thornei Population Densities

Broadly, the published rankings of resistance and tolerance to P. thornei, which are based on multiple experiments, for the winter crop cultivars tested agree with results in the present study. A discrepancy was noted for faba bean cv. Ascot, which rated as resistant from a single glasshouse experiment [41], but in the present study, population densities increased substantially under cv. Ascot, indicating susceptibility. Ascot was developed as a short season cultivar suited to the temperate, winter dominant rainfall zone in South Australia and Victoria, Australia [42] and is not adapted to the subtropical grain region. This is supported by its poor yield in the first year of the experiment, and may have also influenced its growth in glasshouse experiments described previously [41].
The interaction of wheat cultivar tolerance and susceptibility on residual P. thornei population densities in the soil profile was demonstrated in the present study. Wheat cv. Petrie is rated as very susceptible and moderately intolerant–intolerant to P. thornei, and Kennedy susceptible–very susceptible and moderately tolerant–moderately intolerant [9,10]. Despite these differences, population densities of P. thornei increased to a greater extent after cv. Kennedy than after cv. Petrie in the soil profile to 0.9 m. It is likely that this was due to the combination of greater P. thornei reproduction initially in the more susceptible/intolerant cv. Petrie than in the susceptible/moderately intolerant–moderately tolerant cv. Kennedy. Consequently, limited root development into the deeper soil layers by cv. Petrie, is likely to have retarded increases in P. thornei population densities at depth. In support of this, available soil water was greatest after cv. Petrie indicating poor root function and extraction of soil water at depth compared to the other wheat cultivars tested, correlating with the relative tolerance of the other cultivars. Reduced water use by intolerant wheat cultivars at the same location was attributed to P. thornei reducing root function, particularly when large population densities were present early in the growing season [6].
The moderate resistance of the wheat breeding lines cvs GS50a and QT9050 was very effective compared to the other cultivars tested and caused residual nematode population densities to decrease throughout the soil profile at both sites. Other studies, both in Australia and internationally, have described the distribution of P. thornei to 1.2 m soil depth [22,29,43,44], indicating that monitoring changes in P. thornei population densities throughout the soil profile for both management and research purposes is important. The reduction in P. thornei population densities after growing cvs GS50a and QT9050 to below that of the weed-free fallow treatment, suggested that the mechanism of resistance was not due to the absence of a food source alone, but that other plant resistance mechanism(s) may have reduced nematode survival or fecundity. Constitutively expressed levels plant metabolites, such as quercetin and linoleic acid in resistant wheat cultivars, are likely to act as defence mechanisms to limit nematode penetration and movement within plant roots [45].
Of all the cultivars of the crops tested only three barley cultivars had greater yields in Experiment 1 with lower population densities of P. thornei, compared to Experiment 2 (9–13% loss). This effect was most likely due to greater soil water content in Experiment 1, particularly below 0.45 m soil depth alone or in-combination with the lower P. thornei population densities at that site. There is a strong positive linear relationship between grain yield of barley and wheat and plant available water in the Australian subtropical region [46].
Yield loss due to P. thornei was not detected in chickpea, faba bean, and wheat cultivars between the two experimental sites in the current study and may be partially explained by the relatively high population densities in both experiments, reflecting the difficulty in reducing P. thornei population densities. In another experiment at the same site [29], yield loss ranged from 5% for chickpea cv. Lasseter to 20% for cv. Tyson where there were larger ranges of P. thornei population densities at sowing (190 to 11,600/kg soil at 0–0.6 m soil depth) compared to the current study. Additionally in that study, the yield of chickpea was also influenced by arbuscular fungi [29]. In faba bean, there was up to 60% reduction in biomass of plant tops due to P. thornei, measured in glasshouse experiments [47]. Chickpea and faba bean have high to moderate dependence on arbuscular mycorrhizal fungi (AMF) [39] and a reduction in AMF due to the 14-month fallow before starting Experiment 1 may have altered plant growth and reproduction of P. thornei. Nevertheless, the susceptibility of both faba bean and chickpea cultivars to P. thornei in the current study emphasises the urgent need for new cultivars with resistance to P. thornei for use in crop rotations in this region When a greater number of resistant cultivars are available, growers can take advantage of the benefits that pulse crops offer to farming systems without compromising their management of P. thornei.

5. Conclusions

The susceptibility to P. thornei of the four major winter grain crops counteracts their economic and agronomic benefits to the farming systems of the subtropical grain region of eastern Australia. Cultivars with moderate resistance such as the breeding lines of wheat used in this investigation can reduce population densities of P. thornei throughout the soil profile. However, more than two consecutive resistant crops may be required where large population densities of P. thornei are present initially. With strategic breeding, selection and release of resistant and tolerant cultivars of wheat, barley, chickpea, and faba bean, growers will be able to diversify their choice of winter grain and pulse crops to reduce population densities of P. thornei.

Supplementary Materials

The following are available online at https://www.mdpi.com/article/10.3390/agronomy12030573/s1, Table S1: Nematode populations and available water content (AWC, mm) at each depth interval sampled, one month before sowing Phase 1 treatments in each experiment. Nematode data were transformed by ln(x + 500) for Experiments 1 and 2. Numbers in parentheses are back-transformed means; SE, standard error of the mean; n = 9 for each depth interval in each experiment. Table S2: Grain yield (kg/ha) of the Phase 1 winter crop cultivars. For barley, there was a significant effect of experiment x cultivar, n = 6; for all other crops, there was significant effect of cultivar only, n = 12; number in parentheses is average standard error of difference. Table S3: Standard error of the mean (SE) for each data point plotted in Figure 1. Pratylenchus thornei/kg soil to 0.9 m soil depth 6 months after harvest of the Phase 1 crops (2 months prior to sowing the Phase 2 wheat) for cultivars of (a) barley, (b) chickpea, (c) faba bean, and (d) wheat; with the weed-free fallow treatment shown in each figure as a broken line. Means from analysis across the two experiments are presented. Points are plotted on the transformed scale with the back-transformed means indicated on the horizontal axis. Bar markers, l.s.d. (p = 0.05) for each soil depth × first year cultivar, n = 12 for each Phase 1 treatment. Figure S1: Merlinius brevidens/kg soil at 0–0.9 m soil depth, 6 months after harvest of the Phase 1 treatments (2 months prior to sowing the Phase 2 wheat cultivars). Bar marker above barley, chickpea and faba bean indicates l.s.d. (p = 0.05) experimental site x crop; BTM, back-transformed means; error bar indicates standard error of the mean; n = 36 for barley, chickpea, and faba bean; n = 30 for wheat; n = 6 for fallow.

Author Contributions

Conceptualization, K.J.O., T.G.C. and J.P.T.; methodology, K.J.O. and T.G.C.; formal analysis, K.L.B.; investigation, K.J.O.; writing—original draft preparation, K.J.O.; writing—review and editing, K.J.O., T.G.C., J.P.T. and K.L.B. All authors have read and agreed to the published version of the manuscript.

Funding

This research was co-funded by the Grains Research and Development Corporation, grant number DAQ00154 and the Queensland Department of Agriculture and Fisheries.

Data Availability Statement

The data are available on request to the corresponding author.

Acknowledgments

Thank you to Alex Gwynne and family for their on-going support and use of their land for our experiments. Thank you to Jeff Paull (University of Adelaide) for faba bean seed, Abdus Sadeque and Ted Knights (NSW Department of Primary Industries) for chickpea seed, and Jerry Franckowiak (Queensland Department of Agriculture and Fisheries) for barley seed. We also thank Susan Fletcher for initial statistical support; Jing Lin, Kelly Purnell, Mei Wang, and Jan Wood, for technical assistance.

Conflicts of Interest

The authors declare no conflict of interest. The funders had no role in the design of the study; in the collection, analyses, or interpretation of data; in the writing of the manuscript, or in the decision to publish the results.

References

  1. Castillo, P.; Vovlas, N. Pratylenchus (Nematoda: Pratylenchidae): Diagnosis, biology, pathogenicity and management. In Biologyy and Ecology of Pratylenchus, Nematology Monographs and Perspectives 6; Series 9; Hunt, D.J., Perry, R.N., Eds.; Brill: Leiden, The Netherlands; Boston, MA, USA, 2007. [Google Scholar]
  2. Thompson, J.P.; Clewett, T.G.; O’Reilly, M.M. Temperature response of root-lesion nematode (Pratylenchus thornei) reproduction on wheat cultivars has implications for resistance screening and wheat production. Ann. Appl. Biol. 2015, 167, 1–10. [Google Scholar] [CrossRef]
  3. Talavera, M.; Vanstone, V.A. Monitoring Pratylenchus thornei densities in soil and roots under resistant (Triticum turgidum durum) and susceptible (Triticum aestivum) wheat cultivars. Phytoparasitica 2001, 29, 29–35. [Google Scholar] [CrossRef]
  4. Whish, J.P.M.; Thompson, J.P.; Clewett, T.G.; Wood, J.; Rostad, H.E. Predicting the slow decline of root lesion nematodes (Pratylenchus thornei) during host-free fallows to improve farm management decisions. Europ. J. Agron. 2017, 91, 44–53. [Google Scholar] [CrossRef]
  5. Thompson, J.P.; Mackenzie, J.; Sheedy, G.H. Root-lesion nematode (Pratylenchus thornei) reduces nutrient response, biomass and yield of wheat in sorghum-fallow-wheat cropping systems in a subtropical environment. Field Crops Res. 2012, 137, 126–140. [Google Scholar] [CrossRef]
  6. Whish, J.P.M.; Thompson, J.P.; Clewett, T.G.; Lawrence, J.L.; Wood, J. Pratylenchus thornei populations reduce water uptake in intolerant wheat cultivars. Field Crops Res. 2014, 161, 1–10. [Google Scholar] [CrossRef]
  7. Owen, K.J.; Clewett, T.G.; Bell, K.B.; Thompson, J.P. Wheat biomass and yield increased when populations of the root-lesion nematode (Pratylenchus thornei) were reduced through sequential rotation with partially resistant winter and summer crops. Crop Pasture Sci. 2014, 65, 227–241. [Google Scholar] [CrossRef]
  8. Thompson, J.P.; Clewett, T.G. Impacts of root-lesion nematode (Pratylenchus thornei) on plant nutrition, biomass, grain yield and yield components of susceptible/intolerant wheat cultivars determined by nematicide applications. Agronomy 2021, 11, 296. [Google Scholar] [CrossRef]
  9. Owen, K.J.; Fanning, J.P.; Reeves, K.L.; Hollaway, G.J. Consistent responses of yield and resistance of wheat cultivars to the root-lesion nematode, Pratylenchus thornei, in the Australian northern subtropical region, but not in the temperate southern region. Plant Pathol. 2021, 70, 1790–1806. [Google Scholar] [CrossRef]
  10. Thompson, J.P.; Clewett, T.G.; Sheedy, J.G.; Reen, R.A.; O’Reilly, M.M.; Bell, K.L. Occurrence of root-lesion nematodes (Pratylenchus thornei and P. neglectus) and stunt nematode (Merlinius brevidens) in the northern grain region of Australia. Australas. Plant Pathol. 2010, 39, 254–264. [Google Scholar] [CrossRef]
  11. Starr, L.J.; Bridge, J.; Cook, R. Resistance to plant-parasitic nematodes: History, current use and future potential. In Plant Resistance to Parasitic nematodes; Starr, J.L., Cook, R., Bridge, J., Eds.; CABI Publishing: Wallingford, UK, 2002; pp. 1–22. [Google Scholar]
  12. Roberts, P.A. Concepts and consequences of resistance. In Plant Resistance to Parasitic nematodes; Starr, J.L., Cook, R., Bridge, J., Eds.; CABI Publishing: Wallingford, UK, 2002; pp. 23–41. [Google Scholar]
  13. GRDC. 2022 Queensland Wheat Varieties Guide; Grains Research and Development: Kingston, ACT, Australia, 2021; ISSN 2652-3590. [Google Scholar]
  14. Thompson, J.P.; Sheedy, J.G.; Robinson, N.A.; Clewett, T.G. Tolerance of wheat (Triticum aestivum) genotypes to root-lesion nematode (Pratylenchus thornei) in the subtropical grain region of eastern Australia. Euphytica 2021, 217, 48. [Google Scholar] [CrossRef]
  15. Thompson, J.P.; Sheedy, J.G.; Robsinson, N.A. Resistance of wheat genotypes to root-lesion nematode (Pratylenchus thornei) can be used to predict final nematode population densities, crop greenness, and grain yield in the field. Phtyopathology 2020, 110, 505–516. [Google Scholar] [CrossRef] [PubMed]
  16. Murray, G.M.; Brennan, J.P. Estimating disease losses to the Australian wheat industry. Australas. Plant Pathol. 2009, 38, 558–570. [Google Scholar] [CrossRef]
  17. Murray, G.M.; Brennan, J.P. Estimating disease losses to the Australian barley industry. Australas. Plant Pathol. 2010, 39, 85–96. [Google Scholar] [CrossRef]
  18. Murray, G.M.; Brennan, J.P. The Current and Potential Costs from Diseases of Pulse Crops in Australia; Grains Research and Development Corporation: Kingston, ACT, Australia, 2012; ISBN 978-1-921779-19-0. [Google Scholar]
  19. Webb, A.A.; Grundy, M.L.; Powell, B.; Littleboy, M. The Australian subtropical cereal belt: Soils, climate and agriculture. In Sustainable Crop Production in the Sub-Tropics—An Australian Perspective; Clarke, A.L., Wylie, P.B., Eds.; Queensland Department of Primary Industries: Brisbane, Australia, 1997; pp. 8–23. [Google Scholar]
  20. Cox, H.W.; Kelly, R.M.; Strong, W.M. Pulse crops in rotation with cereals can be a profitable alternative to nitrogen fertiliser in central Queensland. Crop Pasture Sci. 2010, 61, 752–762. [Google Scholar] [CrossRef]
  21. Angus, J.F.; Kirkegaard, J.A.; Hunt, J.R.; Ryan, M.H.; Ohlander, L.; Peoples, M.B. Break crops and rotations for wheat. Crop Pasture Sci. 2015, 66, 523–552. [Google Scholar] [CrossRef]
  22. Thompson, J.P.; Brennan, P.S.; Clewett, T.G.; Sheedy, J.G.; Seymour, N.P. Progress in breeding wheat for tolerance and resistance to root-lesion nematode (Pratylenchus thornei). Australas. Plant Pathol. 1999, 28, 45–52. [Google Scholar] [CrossRef]
  23. Isbell, R.F. The Australian Soil Classification, Revised ed.; CSIRO Publishing: Melbourne, Australia, 1996. [Google Scholar]
  24. Beckmann, G.C.; Thompson, C.H. Soils and land use in the Kurrawa Area, Darling Downs, Queensland. In CSIRO Division of Soils, Soils and Land Use Series No. 37; CSIRO Publishing: Melbourne, Australia, 1960. [Google Scholar]
  25. Zadoks, J.C.; Chang, T.T.; Konzak, C.F. A decimal code for the growth stages of cereals. Weeds Res. 1974, 14, 415–421. [Google Scholar] [CrossRef]
  26. Whitehead, A.G.; Hemming, J. A comparison of some quantitative methods of extracting small vermiform nematodes from the soil. Ann. App. Biol. 1965, 55, 25–38. [Google Scholar] [CrossRef]
  27. Fortuner, R. Pratylenchus thornei. C.I.H. Description of Plant-Parasitic Nematodes; Set 7; Commonwealth Institute of Helminthology: St Albans, UK, 1997; No. 93. [Google Scholar]
  28. Siddiqi, M.R. Merlinius brevidens. C.I.H. Description of Plant-Parasitic Nematodes, Set 1; Commonwealth Institute of Helminthology: St Albans, UK, 1972; No. 8. [Google Scholar]
  29. Reen, R.A.; Thompson, J.P.; Clewett, T.G.; Sheedy, J.G.; Bell, K.L. Yield response in chickpea cultivars and wheat following crop rotation affecting population densities of Pratylenchus thornei and arbuscular mycorrhizal fungi. Crop Pasture Sci. 2014, 65, 428–441. [Google Scholar] [CrossRef]
  30. VSN International. Genstat for Windows, 18th ed.; VSN International: Hemel Hempstead, UK, 2015; Available online: https://vsni.co.uk/software/genstat (accessed on 30 June 2017).
  31. Proctor, J.R.; Marks, C.F. Determination of normalizing transformations for nematode count data from soil samples and of efficient sampling schemes. Nematologica 1974, 20, 395–406. [Google Scholar] [CrossRef]
  32. Berry, D.A. Logarithmic transformations in ANOVA. Biometrics 1987, 43, 439–456. [Google Scholar] [CrossRef] [PubMed]
  33. Van Gundy, S.D.; Jose Gustavo Perez, B.; Stolzy, L.H.; Thomason, I.J. A pest management approach to the control of Pratylenchus thornei on wheat in Mexico. J. Nematol. 1974, 6, 107–116. [Google Scholar] [PubMed]
  34. Bell, M.J.; Seymour, N.P.; Stirling, G.R.; Stirling, A.M.; Van Zwieten, L.; Vancov, T.; Sutton, G.; Moody, P. Impacts of management of soil biota in Vertosols supporting the broadacre grains industry in northern Australia. Aust. J. Soil Res. 2006, 44, 433–451. [Google Scholar] [CrossRef] [Green Version]
  35. Elliott, V.; Taylor, P.; Ford, R. Pathogenic variation within the 2009 Australian Ascochyta rabiei population and implications for future disease management strategy. Australas. Plant Pathol. 2011, 40, 568–574. [Google Scholar] [CrossRef]
  36. Reen, R.A.; Mumford, M.H.; Thompson, J.P. Novel sources of resistance to root-lesion nematode (Pratylenchus thornei) in a new collection of wild Cicer species (C. reticulatum and C. echinospermum) to improve resistance in cultivated chickpea (C. arietinum). Phytopathol 2019, 109, 1270–1279. [Google Scholar] [CrossRef]
  37. Hollaway, G.; Taylor, S.P.; Eastwood, R.F.; Hunt, C. Effect of field crops on density of Pratylenchus in South eastern Australia; Part 2: P. thornei. Supp. J. Nematol. 2000, 32, 600–608. [Google Scholar]
  38. Hollaway, G.J. Effect of oat (Avena sativa) on the population density of Pratylenchus thornei in the field Australas. Plant Pathol. 2002, 31, 147–149. [Google Scholar] [CrossRef]
  39. Thompson, J.P. Concurrent management of symbiotic VAM fungi and pathogenic root-lesion nematodes through crop rotation. In Soil Biota—Management in Sustainable Farming Systems; Pankhurst, C.E., Doube, B.M., Gupta, V.V.S.R., Grace, P.R., Eds.; CSIRO Publishing: Melbourne, Australia, 1994; pp. 119–120. [Google Scholar]
  40. Owen, K.J.; Clewett, T.G.; Thompson, J.P. Pre-cropping with canola decreased Pratylenchus thornei populations, arbuscular mycorrhizal fungi, and yield of wheat. Crop Pasture Sci. 2010, 61, 399–410. [Google Scholar] [CrossRef]
  41. Sheedy, J.G.; Clewett, T.G.; Thompson, J.P.; Paull, J. Resistance to root-lesion nematode of Australian faba bean cultivars. In Pratylenchus thornei. Plant Disease Management Reports; The American Phytopathological Society: St. Paul, MN, USA, 2008; Volume 3, p. N035. [Google Scholar]
  42. Paull, J.; (University of Adelaide, Adelaide, South Australia, Australia). Personal communication, 2017.
  43. Doyle, A.D.; McLeod, R.W.; Wong, P.T.W.; Hetherington, S.E.; Southwell, R.J. Evidence for the involvement of the root lesion nematode Pratylenchus thornei in wheat yield decline in northern New South Wales. Aust. J. Exp. Agric. 1987, 27, 563–570. [Google Scholar] [CrossRef]
  44. Smiley, R.W.; Sheedy, J.G.; Easley, S.A. Vertical distribution of Pratylenchus spp. in silt loam soil and Pacific Northwest dryland crops. Plant Dis. 2008, 92, 1662–1668. [Google Scholar] [CrossRef] [Green Version]
  45. Rahaman, M.M.; Zwart, R.S.; Rupasinghe, T.W.T.; Hayden, H.L.; Thompson, J.P. Metabolomic profiling of wheat genotypes resistant and susceptible to root-lesion nematode Pratylenchus thornei. Plant Mol. Biol. 2021, 106, 381–406. [Google Scholar] [CrossRef] [PubMed]
  46. Dalal, R.C.; Strong, W.M.; Weston, E.J.; Cooper, J.E.; Thomas, G.A. Prediction of grain protein in wheat and barley in a subtropical environment from available water and nitrogen in Vertisols at sowing. Aust. J. Exp. Agric. 1997, 37, 351–357. [Google Scholar] [CrossRef]
  47. Di Vito, M.; Zaccheo, G.; Catalano, F. Effect of Pratylenchus neglectus and P. thornei on the growth of faba bean. Nematol. Mediterr. 2000, 28, 261–265. [Google Scholar]
Figure 1. Pratylenchus thornei/kg soil to 0.9 m soil depth 6 months after harvest of the Phase 1 crops (2 months prior to sowing the Phase 2 wheat) for cultivars of (a) barley, (b) chickpea, (c) faba bean, and (d) wheat; with the weed-free fallow treatment shown in each figure as a broken line. Means from analysis across the two experiments are presented. Points are plotted on the transformed scale with the back-transformed means indicated on the horizontal axis. Bar markers represent, l.s.d. (p = 0.05) for each soil depth x first year cultivar interaction, n = 12; standard error of the mean for each data point are shown in Supplementary Table S3.
Agronomy 12 00573 g001
Figure 2. (a) Pratylenchus thornei/kg soil and (b) available water content (mm) at 0–0.9 m soil depth, 6 months after harvest of the Phase 1 treatments (2 months prior to sowing the Phase 2 wheat). For cultivars, means are for the combined experiments (bar markers above the crop groups indicate l.s.d. (p = 0.05) for cultivars within crop; crop groups with no bar marker indicates no significant difference between cultivars p > 0.05), n = 12; number above the bars in (a) indicates the fold change in population densities above the wheat cv. GS50a. For the weed-free fallow treatment, means are for each experimental site, n = 6. Error bars indicate standard error of the mean. BTM, back-transformed means; Expt, Experiment.
Agronomy 12 00573 g002
Figure 3. Plant biomass (kg/ha) of the Phase 2 wheat cvs (a) Strzelecki and (b) EGA Wylie at grain-filling after the Phase 1 crop cultivars or weed-free fallow treatment. Bar marker in (a) indicates l.s.d (p = 0.05) for Phase 1 treatments × Phase 2 wheat, n = 6. Error bars indicate standard error of the mean. Cultivars of Phase 1 crops are arranged in ascending order for the biomass of the Phase 2 wheat cv. Strzelecki.
Agronomy 12 00573 g003
Figure 4. Relationship between biomass (kg/ha) of the Phase 2 wheat cvs (a) Strzelecki or (b) EGA Wylie at grain filling and population densities of Pratylenchus thornei/kg soil (ln(Pt + 1000)) and available water content (AWC mm) at 0–0.9 m soil depth following the Phase 1 crop cultivars and weed-free fallow treatment; for combined wheat cultivars p < 0.001; n = 288; R2 = 0.73; SE, standard error of the equation parameters.
Agronomy 12 00573 g004
Table 1. The previous cropping history of each experimental site, Pratylenchus thornei/kg soil and available water content (mm) (calculated from data from individual soil depth intervals shown in Supplementary Table S1) at 0–0.9 m soil depth one month before starting the experiments at Formation, Queensland, Australia.
Experiment 1Experiment 2
Previous cropping history 1
(most recent at top)
Sorghum (LF)
Wheat (SF)
Wheat (LF)
Sorghum (LF)
Wheat (SF)
Wheat (SF)
Sorghum (LF)
Wheat (SF)
Wheat (LF)
Sorghum (LF)
P. thornei/kg soil24908150
Available water content (mm)11098
1 LF, long fallow, ~18 month weed-free fallow; SF, short fallow, ~6 month weed-free fallow following each crop as indicated.
Table 2. Crop cultivars sown in Phase 1 of the experiments at Formartin, Queensland, Australia.
CropPhase 1 Cultivars
Barley (Hordeum vulgare)Commander
Gairdner
Grimmett
Grout
ND-19119-05a
Hindmarsh
Chickpea (Cicer arietinum)Amethyst
Gully
PBA HatTrick
Sona
Tyson
Yorker
Faba bean (Vicia faba)AF03109
Ascot
Cairo
Doza
Fiesta
Rossa
Wheat (Triticum aestivum)EGA Wylie
GS50a
Kennedy
Petrie
QT9050
Table 3. The timing of operations and rainfall during Phase 1 and Phase 2 of the experiments.
Phase 1Phase 2
Sown10 June 200915 July 2010
Biomass collectionND 120 October 2010
Grain harvestNovember 2009ND 2
Soil collectionMay 2009May 2010
3 Annual rainfall (mm)373885
In-crop rainfall (mm)87202
Fallow rainfall (mm) (7 months)298
1 ND, not determined; 2 Grain was not harvested due to flooding in early December 2010 (163 mm rainfall from 1 November to 15 December); 3 Jondaryan Post Office; Bureau of Meteorology Station Number 41053, 27.37° S, 151.59° E, elevation 382 m.
Publisher’s Note: MDPI stays neutral with regard to jurisdictional claims in published maps and institutional affiliations.

