
Yields and Yield Gaps in Lowland Rice Systems and Options to Improve Smallholder Production

 , ,
, , 
 and
and
Abstract
:
1. Introduction
1.1. Food Demand in Sub-Saharan Africa
1.2. Crop Yield Gap Concept
1.3. Rationale of the Study
2. Materials and Methods
2.1. Study Site
2.2. Study Description
2.3. Experimental Design
2.4. Treatments and Management
2.5. Data Collection and Analysis
2.6. Yield Gap Analysis
3. Results
3.1. Grain Yield under Different Management Levels
3.2. Yield Gaps under Different Management Levels
3.3. Causes of Yield Variation among Fields
3.4. Options for Intensification of Lowland Rice Production
4. Discussion
5. Conclusions
Supplementary Materials
Author Contributions
Funding
Institutional Review Board Statement
Informed Consent Statement
Data Availability Statement
Acknowledgments
Conflicts of Interest
References
- Saito, K.; Vandamme, E.; Johnson, J.-M.; Tanaka, A.; Senthilkumar, K.; Dieng, I.; Akakpo, C.; Gbaguidi, F.; Segda, Z.; Bassoro, I.; et al. Yield-limiting macronutrients for rice in sub-Saharan Africa. Geoderma 2019, 338, 546–554. [Google Scholar] [CrossRef]
- van Ittersum, M.K.; van Bussel, L.G.J.; Wolf, J.; Grassini, P.; van Wart, J.; Guilpart, N.; Cassman, K.G. Can sub-Saharan Africa feed itself? Proc. Natl. Acad. Sci. USA 2016, 113, 14964. [Google Scholar] [CrossRef] [PubMed] [Green Version]
- United Nations Department of Economic and Social Affairs. World Population Prospects 2019: Highlights. In Population Division; United Nations Department of Economic and Social Affairs: New York, NY, USA, 2019; Volume 46, ISBN 9789210042352. [Google Scholar]
- Vollset, S.E.; Goren, E.; Yuan, C.W.; Cao, J.; Smith, A.E.; Hsiao, T.; Bisignano, C.; Azhar, G.S.; Castro, E.; Chalek, J.; et al. Fertility, mortality, migration, and population scenarios for 195 countries and territories from 2017 to 2100: A forecasting analysis for the Global Burden of Disease Study. Lancet 2020, 22, 1285–1306. [Google Scholar] [CrossRef]
- Foley, J.A.; Ramankutty, N.; Brauman, K.A.; Cassidy, E.S.; Gerber, J.S.; Johnston, M.; Mueller, N.D.; O’Connell, C.; Ray, D.K.; West, P.C.; et al. Solutions for a cultivated planet. Nature 2011, 478, 337–342. [Google Scholar] [CrossRef] [Green Version]
- Lobell, D.B.; Cassman, K.G.; Field, C.B. Crop Yield Gaps: Their Importance, Magnitudes, and Causes. Annu. Rev. Environ. Resour. 2009, 34, 179–204. [Google Scholar] [CrossRef] [Green Version]
- Mauser, W.; Klepper, G.; Zabel, F.; Delzeit, R.; Hank, T.; Putzenlechner, B.; Calzadilla, A. Global biomass production potentials exceed expected future demand without the need for cropland expansion. Nat. Commun. 2015, 6, 8946. [Google Scholar] [CrossRef] [Green Version]
- Mueller, N.D.; Gerber, J.S.; Johnston, M.; Ray, D.K.; Ramankutty, N.; Foley, J.A. Closing yield gaps through nutrient and water management. Nature 2012, 490, 254–257. [Google Scholar] [CrossRef]
- Pradhan, P.; Fischer, G.; van Velthuizen, H.; Reusser, D.E.; Kropp, J.P. Closing Yield Gaps: How Sustainable Can We Be? PLoS ONE 2015, 10, e0129487. [Google Scholar] [CrossRef] [Green Version]
- van Wart, J.; Kersebaum, K.C.; Peng, S.; Milner, M.; Cassman, K.G. Estimating crop yield potential at regional to national scales. Field Crops Res. 2013, 143, 34–43. [Google Scholar] [CrossRef] [Green Version]
- Fischer, R.A. Definitions and determination of crop yield, yield gaps, and of rates of change. Field Crops Res. 2015, 182, 9–18. [Google Scholar] [CrossRef]
- Stuart, A.M.; Pame, A.R.P.; Silva, J.V.; Dikitanan, R.C.; Rutsaert, P.; Malabayabas, A.J.B.; Lampayan, R.M.; Radanielson, A.M.; Singleton, G.R. Yield gaps in rice-based farming systems: Insights from local studies and prospects for future analysis. Field Crops Res. 2016, 194, 43–56. [Google Scholar] [CrossRef] [Green Version]
- Van Ittersum, M.K.; Cassman, K.G.; Grassini, P.; Wolf, J.; Tittonell, P.; Hochman, Z. Yield gap analysis with local to global relevance—A review. Field Crops Res. 2013, 143, 4–17. [Google Scholar] [CrossRef] [Green Version]
- Laborte, A.G.; de Bie, K.; Smaling, E.M.A.; Moya, P.F.; Boling, A.A.; van Ittersum, M.K. Rice yields and yield gaps in Southeast Asia: Past trends and future outlook. Eur. J. Agron. 2012, 36, 9–20. [Google Scholar] [CrossRef]
- Senthilkumar, K.; Rodenburg, J.; Dieng, I.; Vandamme, E.; Sillo, F.S.; Johnson, J.M.; Rajaona, A.; Ramarolahy, J.A.; Gasore, R.; Abera, B.B.; et al. Quantifying rice yield gaps and their causes in Eastern and Southern Africa. J. Agron. Crop Sci. 2020, 206, 478–490. [Google Scholar] [CrossRef]
- Tanaka, A.; Diagne, M.; Saito, K. Causes of yield stagnation in irrigated lowland rice systems in the Senegal River Valley: Application of dichotomous decision tree analysis. Field Crops Res. 2015, 176, 99–107. [Google Scholar] [CrossRef]
- Tanaka, A.; Johnson, J.M.; Senthilkumar, K.; Akakpo, C.; Segda, Z.; Yameogo, L.P.; Bassoro, I.; Lamare, D.M.; Allarangaye, M.D.; Gbakatchetche, H.; et al. On-farm rice yield and its association with biophysical factors in sub-Saharan Africa. Eur. J. Agron. 2017, 85, 1–11. [Google Scholar] [CrossRef]
- Van Oort, P.A.J.; Saito, K.; Tanaka, A.; Amovin-Assagba, E.; Van Bussel, L.G.J.; van Wart, J.; Wopereis, M.C.S. Assessment of rice self-sufficiency in 2025 in eight African countries. Glob. Food Secur. 2015, 5, 39–49. [Google Scholar] [CrossRef] [Green Version]
- Chamberlin, J.; Jayne, T.S.; Headey, D. Scarcity amidst abundance? Reassessing the potential for cropland expansion in Africa. Food Policy 2014, 48, 51–65. [Google Scholar] [CrossRef] [Green Version]
- Arment, C.J. Food Dependency in Sub-Saharan Africa: Simply a Matter of ‘Vulnerability’, or Missed Development Opportunity? Dev. Chang. 2020, 51, 283–323. [Google Scholar] [CrossRef] [Green Version]
- Manitra, A.R.; Massimo, I.; Marianna, P. Why Has Africa Become a Net Food Importer? Explaining Africa Agricultural and Food Trade Deficits; Trade and Markets Division Food and Agriculture Organization of the United Nations: Rome, Italy, 2012; p. 89. [Google Scholar]
- Foley, J.A.; De Fries, R.; Asner, G.P.; Barford, C.; Bonan, G.; Carpenter, S.R.; Chapin, F.S.; Coe, M.T.; Daily, G.C.; Gibbs, H.K.; et al. Global Consequences of Land Use. Science 2005, 309, 570. [Google Scholar] [CrossRef] [Green Version]
- Sala, O.E.; Stuart, C.F.; Armesto, J.J.; Berlow, E.; Bloomfield, J.; Dirzo, R.; Huber-Sanwald, E.; Huenneke, L.F.; Jackson, R.B.; Kinzig, A.; et al. Global Biodiversity Scenarios for the Year 2100. Science 2000, 287, 1770. [Google Scholar] [CrossRef] [PubMed]
- Zabel, F.; Delzeit, R.; Schneider, J.M.; Seppelt, R.; Mauser, W.; Václavík, T. Global impacts of future cropland expansion and intensification on agricultural markets and biodiversity. Nat. Commun. 2019, 10, 2844. [Google Scholar] [CrossRef] [PubMed] [Green Version]
- Kangalawe, R.Y.M.; Liwenga, E.T. Livelihoods in the wetlands of Kilombero Valley in Tanzania: Opportunities and challenges to integrated water resource management. Phys. Chem. Earth 2005, 30, 968–975. [Google Scholar] [CrossRef]
- Turyahabwe, N.; Kakuru, W.; Tweheyo, M.; Tumusiime, D.M. Contribution of wetland resources to household food security in Uganda. Agric. Food Secur. 2013, 2, 5. [Google Scholar] [CrossRef] [Green Version]
- Nhamo, N.; Rodenburg, J.; Zenna, N.; Makombe, G.; Luzi-Kihupi, A. Narrowing the rice yield gap in East and Southern Africa: Using and adapting existing technologies. Agric. Syst. 2014, 131, 45–55. [Google Scholar] [CrossRef]
- Seck, P.A.; Ali, A.T.; Jeanne, Y.C.; Aliou, D.; Wopereis, M.C.S. Africa’s Rice Economy Before and After the 2008 Rice Crisis. In Realizing Africa’s Rice Promise; Wopereis, M.C.S., Johnson, D.E., Ahmadi, N., Tollens, E., Jalloh, A., Eds.; CAB International: Cotonou, Benin, 2013; pp. 24–34. [Google Scholar]
- Balasubramanian, V.; Sie, M.; Hijmans, R.J.; Otsuka, K. Increasing Rice Production in Sub-Saharan Africa: Challenges and Opportunities. In Advances in Agronomy; Sparks, D.L., Ed.; Academic Press: Tokyo, Japan, 2007; Volume 94, pp. 55–133. [Google Scholar] [CrossRef]
- Tsujimoto, Y.; Rakotoson, T.; Tanaka, A.; Saito, K. Challenges and opportunities for improving N use efficiency for rice production in sub-Saharan Africa. Plant Prod. Sci. 2019, 22, 413–427. [Google Scholar] [CrossRef] [Green Version]
- Niang, A.; Becker, M.; Ewert, F.; Dieng, I.; Gaiser, T.; Tanaka, A.; Senthilkumar, K.; Rodenburg, J.; Johnson, J.; Akakpo, C.; et al. Variability and determinants of yields in rice production systems of West Africa. Field Crops Res. 2017, 207, 1–12. [Google Scholar] [CrossRef]
- Bado, V.B.; Djaman, K.; Mel, V.C. Developing fertilizer recommendations for rice in Sub-Saharan Africa, achievements and opportunities. Paddy Water Environ. 2018, 16, 571–586. [Google Scholar] [CrossRef] [Green Version]
- Hu, A.; Tang, T.; Liu, Q. Nitrogen use efficiency in different rice-based rotations in southern China. Nutr. Cycl. Agroecosyst. 2018, 112, 75–86. [Google Scholar] [CrossRef]
- Jinsen., Z.; Mwari, W.N.; Tomohiro, N.; Kilasara, M.M.; Shinya, F. Nitrogen availability to maize as affected by fertilizer application and soil type in the Tanzanian highlands. Nutr. Cycl. Agroecosyst. 2018, 112, 197–213. [Google Scholar] [CrossRef]
- Kaizzi, K.C.; Byalebeka, J.; Semalulu, O.; Alou, I.; Zimwanguyizza, W.; Nansamba, A.; Musinguzi, P.; Ebanyat, P.; Hyuha, T.; Wortmann, C.S. Maize Response to Fertilizer and Nitrogen Use Efficiency in Uganda. Agron. J. 2012, 104, 73–82. [Google Scholar] [CrossRef]
- Rurinda, J.; Mapfumo, P.; van Wijk, M.T.; Mtambanengwe, F.; Rufino, M.C.; Chikowo, R.; Giller, K.E. Comparative assessment of maize, finger millet and sorghum for household food security in the face of increasing climatic risk. Eur. J. Agron. 2014, 55, 29–41. [Google Scholar] [CrossRef]
- Kihara, J.; Njoroge, S. Phosphorus agronomic efficiency in maize-based cropping systems: A focus on western Kenya. Field Crops Res. 2013, 150, 1–8. [Google Scholar] [CrossRef]
- Kihara, J.; Nziguheba, G.; Zingore, S.; Coulibaly, A.; Esilaba, A.; Kabambe, V.; Njoroge, S.; Palm, C.; Huising, J. Understanding variability in crop response to fertilizer and amendments in sub-Saharan Africa. Agric. Ecosyst. Environ. 2016, 229, 1–12. [Google Scholar] [CrossRef] [Green Version]
- Ndungu-Magiroi, K.W.; Kasozi, A.; Kaizzi, K.C.; Mwangi, T.; Koech, M.; Kibunja, C.N.; Wamae, D.; Wortmann, C.S. Finger millet response to nitrogen, phosphorus and potassium in Kenya and Uganda. Nutr. Cycl. Agroecosyst. 2017, 108, 297–308. [Google Scholar] [CrossRef]
- Vanlauwe, B.; Kihara, J.; Chivenge, P.; Pypers, P.; Coe, R.; Six, J. Agronomic use efficiency of N fertilizer in maize-based systems in sub-Saharan Africa within the context of integrated soil fertility management. Plant Soil 2011, 339, 35–50. [Google Scholar] [CrossRef]
- Senthilkumar, K.; Tesha, B.J.; Mghase, J.; Rodenburg, J. Increasing paddy yields and improving farm management: Results from participatory experiments with good agricultural practices (GAP) in Tanzania. Paddy Water Environ. 2018, 16, 749–766. [Google Scholar] [CrossRef] [Green Version]
- Stuart, A.M.; Pame, A.R.P.; Vithoonjit, D.; Viriyangkura, L.; Pithuncharurnlap, J.; Meesang, N.; Suksiri, P.; Singleton, G.R.; Lampayan, R.M. The application of best management practices increases the profitability and sustainability of rice farming in the central plains of Thailand. Field Crops Res. 2018, 220, 78–87. [Google Scholar] [CrossRef]
- Haefele, S.M.; Johnson, D.E.; Diallo, S.; Wopereis, M.C.S.; Janin, I. Improved soil fertility and weed management is profitable for irrigated rice farmers in Sahelian West Africa. Field Crops Res. 2000, 66, 101–113. [Google Scholar] [CrossRef]
- Tippe, D.E.; Bastiaans, L.; van Ast, A.; Dieng, I.; Cissoko, M.; Kayeke, J.; Rodenburg, J. Fertilisers differentially affect facultative and obligate parasitic weeds of rice and only occasionally improve yields in infested fields. Field Crops Res. 2020, 254, 107845. [Google Scholar] [CrossRef]
- Jamil, M.; Kanampiu, F.K.; Karaya, H.; Charnikhova, T.; Bouwmeester, H.J. Striga hermonthica parasitism in maize in response to N and P fertilisers. Field Crops Res. 2012, 134, 1–10. [Google Scholar] [CrossRef]
- Touré, A.; Becker, M.; Johnson, D.E.; Koné, B.; Kossou, D.K.; Kiepe, P. Response of lowland rice to agronomic management under different hydrological regimes in an inland valley of Ivory Coast. Field Crops Res. 2009, 114, 304–310. [Google Scholar] [CrossRef]
- Becker, M.; Johnson, D.E. Improved water control and crop management effects on lowland rice productivity in West Africa. Nutr. Cycl. Agroecosyst. 2001, 59, 119–127. [Google Scholar] [CrossRef]
- Wanyama, J.; Ssegane, H.; Kisekka, I.; Komakech, A.J.; Banadda, N.; Zziwa, A.; Oker, E.T.; Mutumba, C.; Kiggundu, N.; Kato, K.R.; et al. Irrigation Development in Uganda: Constraints, Lessons Learned, and Future Perspectives. J. Irrig. Drain Eng. 2017, 143, 1–10. [Google Scholar] [CrossRef] [Green Version]
- Namyenya, A. Farmers’ Willingness to Pay for Irrigation Water: The Case of Doho Rice Irrigation Scheme in Eastern Uganda. Master’s Thesis, Makerere University, Kampala, Uganda, 2014. [Google Scholar]
- Tenywa, M.M.; Majaliwa, J.G.M.; Yazidhi, B.; Luswata, K.C.; Geofrey, G.I. The effect of Land Use Practices on Pollution Dynamics in the Highlands of Uganda. In Management and Area-Wide Evaluation of Water Conservation Zones in Agricultural Catchments for Biomass Production; International Atomic Energy Agency: Vienna, Austria, 2016; pp. 79–101. [Google Scholar]
- Awio, T.; Senthilkumar, K.; Dimkpa, C.O.; Otim-Nape, G.W.; Kempen, B.; Struik, P.C.; Stomph, T.J. Micro-nutrients in East African lowlands: Are they needed to intensify rice production? Field Crops Res. 2021, 270, 108219. [Google Scholar] [CrossRef]
- Banayo, N.P.M.C.; Bueno, C.S.; Haefele, S.M.; Desamero, N.V.; Kato, Y. Site-specific nutrient management enhances sink size, a major yield constraint in rainfed lowland rice. Field Crops Res. 2018, 224, 76–79. [Google Scholar] [CrossRef]
- Ju, C.; Liu, T.; Sun, C. Panicle Nitrogen Strategies for Nitrogen-Efficient Rice Varieties at a Moderate Nitrogen Application Rate in the Lower Reaches of the Yangtze River, China. Agronomy 2021, 11, 192. [Google Scholar] [CrossRef]
- Kamiji, Y.; Yoshida, H.; Palta, J.A.; Sakuratani, T.; Shiraiwa, T. Napplications that increase plant N during panicle development are highly effective in increasing spikelet number in rice. Field Crops Res. 2011, 122, 242–247. [Google Scholar] [CrossRef]
- Zhang, Z.; Chu, G.; Liu, L.; Wang, Z.; Wang, X.; Zhang, H.; Yang, J.; Zhang, J. Mid-season nitrogen application strategies for rice varieties differing in panicle size. Field Crops Res. 2013, 150, 9–18. [Google Scholar] [CrossRef]
- Zhou, W.; Tengfei, L.; Yong, C.; Hu, J.; Zhang, Q.; Ren, W. Late nitrogen application enhances spikelet number in indica hybrid rice (Oryza sativa L.). Sci. Agric. 2017, 74, 127–133. [Google Scholar] [CrossRef] [Green Version]
- Koussoubé, E.; Nauges, C. Returns to fertiliser use: Does it pay enough? Some new evidence from Sub-Saharan Africa. Eur. Rev. Agric. Econ. 2017, 44, 183–210. [Google Scholar] [CrossRef] [Green Version]
- Sanchez, P.A. En route to plentiful food production in Africa. Nat. Plants 2015, 1, 14014. [Google Scholar] [CrossRef]
- Becker, M.; Johnson, D.E.; Wopereis, M.C.S.; Sow, A. Rice yield gaps in irrigated systems along an agro-ecological gradient in West Africa. J. Plant Nutr. Soil Sci. 2003, 166, 61–67. [Google Scholar] [CrossRef]
- Rodenburg, J.; Johnson, D.E. Weed Management in Rice-Based Cropping Systems in Africa. In Advances in Agronomy; Sparks, D.L., Ed.; Academic Press: Tokyo, Japan, 2009; Volume 103, pp. 149–218. [Google Scholar] [CrossRef]
- Waddington, S.R.; Li, X.; Dixon, J.; Hyman, G.; de Vicente, M.C. Getting the focus right: Production constraints for six major food crops in Asian and African farming systems. Food Secur. 2010, 2, 27–48. [Google Scholar] [CrossRef]
- De Bauw, P.; Vandamme, E.; Senthilkumar, K.; Lupembe, A.; Smolders, E.; Merckx, R. Combining phosphorus placement and water saving technologies enhances rice production in phosphorus-deficient lowlands. Field Crops Res. 2019, 236, 177–189. [Google Scholar] [CrossRef]
- Vandamme, E.; Ahouanton, K.; Mwakasege, L.; Mujuni, S.; Mujawamariya, G.; Kamanda, J.; Senthilkumar, K.; Saito, K. Phosphorus micro-dosing as an entry point to sustainable intensification of rice systems in sub-Saharan Africa. Field Crops Res. 2018, 222, 39–49. [Google Scholar] [CrossRef]
- Rodenburg, J.; Saito, K.; Irakiza, R.; Makokha, D.W.; Onyuka, E.A.; Senthilkumar, K. Labor-Saving Weed Technologies for Lowland Rice Farmers in sub-Saharan Africa. Weed Technol. 2015, 29, 751–757. [Google Scholar] [CrossRef] [Green Version]
- Kyalo, G.; Chemining’wa, G.; Nhamo, N.; Mussgnug, F. Effects of Improved Nursery Management, Seedling Transplanting Age and Split Nitrogen Fertilizer Application on Growth and Yield of Lowland Rice in Eastern Uganda. J. Agric. Sci. 2020, 12, 144–151. [Google Scholar] [CrossRef]
- Liu, Q.; Zhou, X.; Li, J.; Xin, C. Effects of seedling age and cultivation density on agronomic characteristics and grain yield of mechanically transplanted rice. Sci. Rep. 2017, 7, 14072. [Google Scholar] [CrossRef] [Green Version]
- Lampayan, R.M.; Faronilo, J.E.; Tuong, T.P.; Espiritu, A.J.; de Dios, J.L.; Bayot, R.S.; Bueno, C.S.; Hosen, Y. Effects of seedbed management and delayed transplanting of rice seedlings on crop performance, grain yield, and water productivity. Field Crops Res. 2015, 183, 303–314. [Google Scholar] [CrossRef]
- Menete, M.Z.L.; van Es, H.M.; Brito, R.M.L.; DeGloria, S.D.; Famba, S. Evaluation of system of rice intensification (SRI) component practices and their synergies on salt-affected soils. Field Crops Res. 2008, 109, 34–44. [Google Scholar] [CrossRef]
- Pasuquin, E.; Lafarge, T.; Tubana, B. Transplanting young seedlings in irrigated rice fields: Early and high tiller production enhanced grain yield. Field Crops Res. 2008, 105, 141–155. [Google Scholar] [CrossRef]
- Kewat, M.L.; Agrawal, S.B.; Agrawal, K.K.; Sharma, R.S. Effect of divergent plant spacings and age of seedlings on yield and economics of hybrid rice (Oryza sativa). Indian J. Agron. 2002, 47, 367–371. [Google Scholar]
- Khatun, A.; Mollah, M.I.U.; Rashid, M.H.; Islam, M.S.; Khan, A.H. Seasonal Effect of Seedling Age on the Yield of Rice. Pak. J. Biol. Sci. 2002, 5, 40–42. [Google Scholar] [CrossRef] [Green Version]


| Treatment | Management Practices |
|---|---|
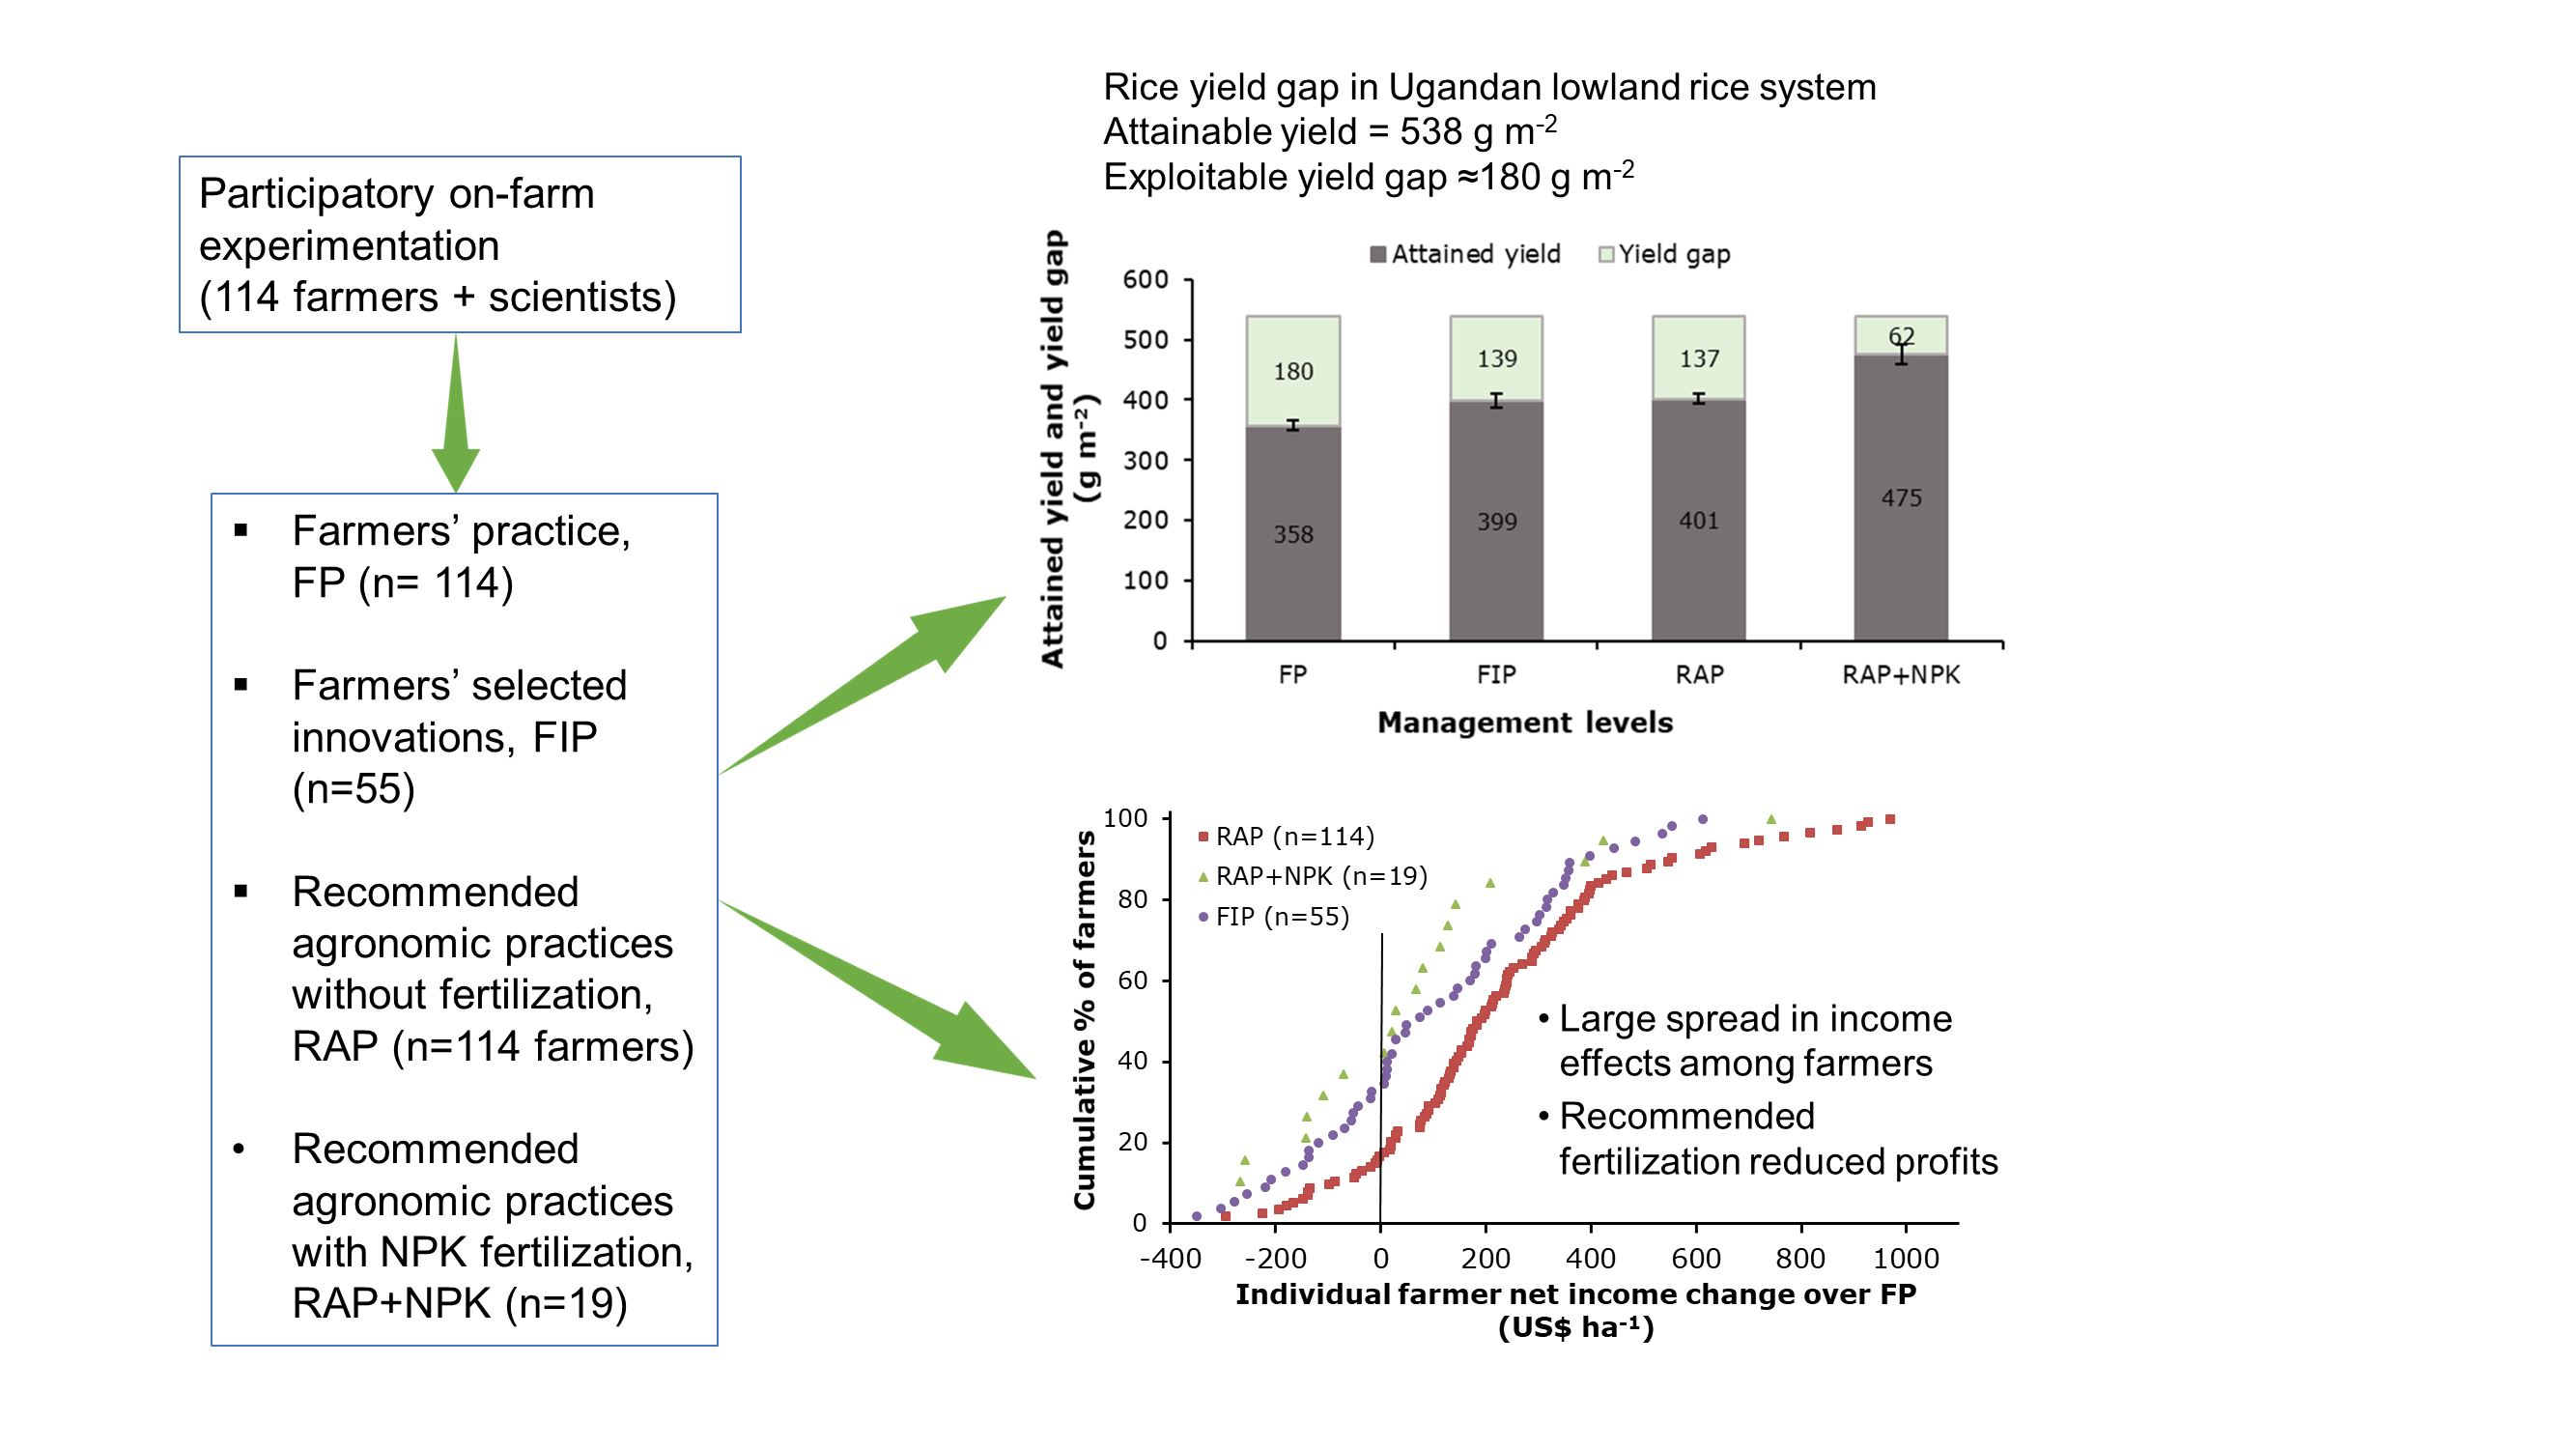
| Farmers’ practice (FP, n = 114) | Farmers implemented different management practices: transplanting time (21–39 DAS), transplanting method (random or line), weeding time (15–48 DAT), and N rate (13.8–46.0 kg ha−1), no P and K. |
| Recommended agronomic practices without fertilization (RAP, n = 114) | Transplanting time (21–33 DAS), line transplanting, timely weeding (14–25 DAT), and no fertilization. |
| Recommended agronomic practices with NPK fertilization (RAP+NPK, n = 19) | Transplanting time (25–33 DAS), line transplanting, timely weeding (15–22 DAT), and 100, 50.0 and 50.0 kg ha−1 N, P and K. |
| Farmers’ intensification practice (FIP, n = 55) | Farmers implemented different management practices: transplanting time (23–39 DAS), transplanting method (random or line), weeding time (15–40 DAT), and N (6.80–46.0 kg ha−1), P and K (0.00–27.2 kg ha−1) 1. |
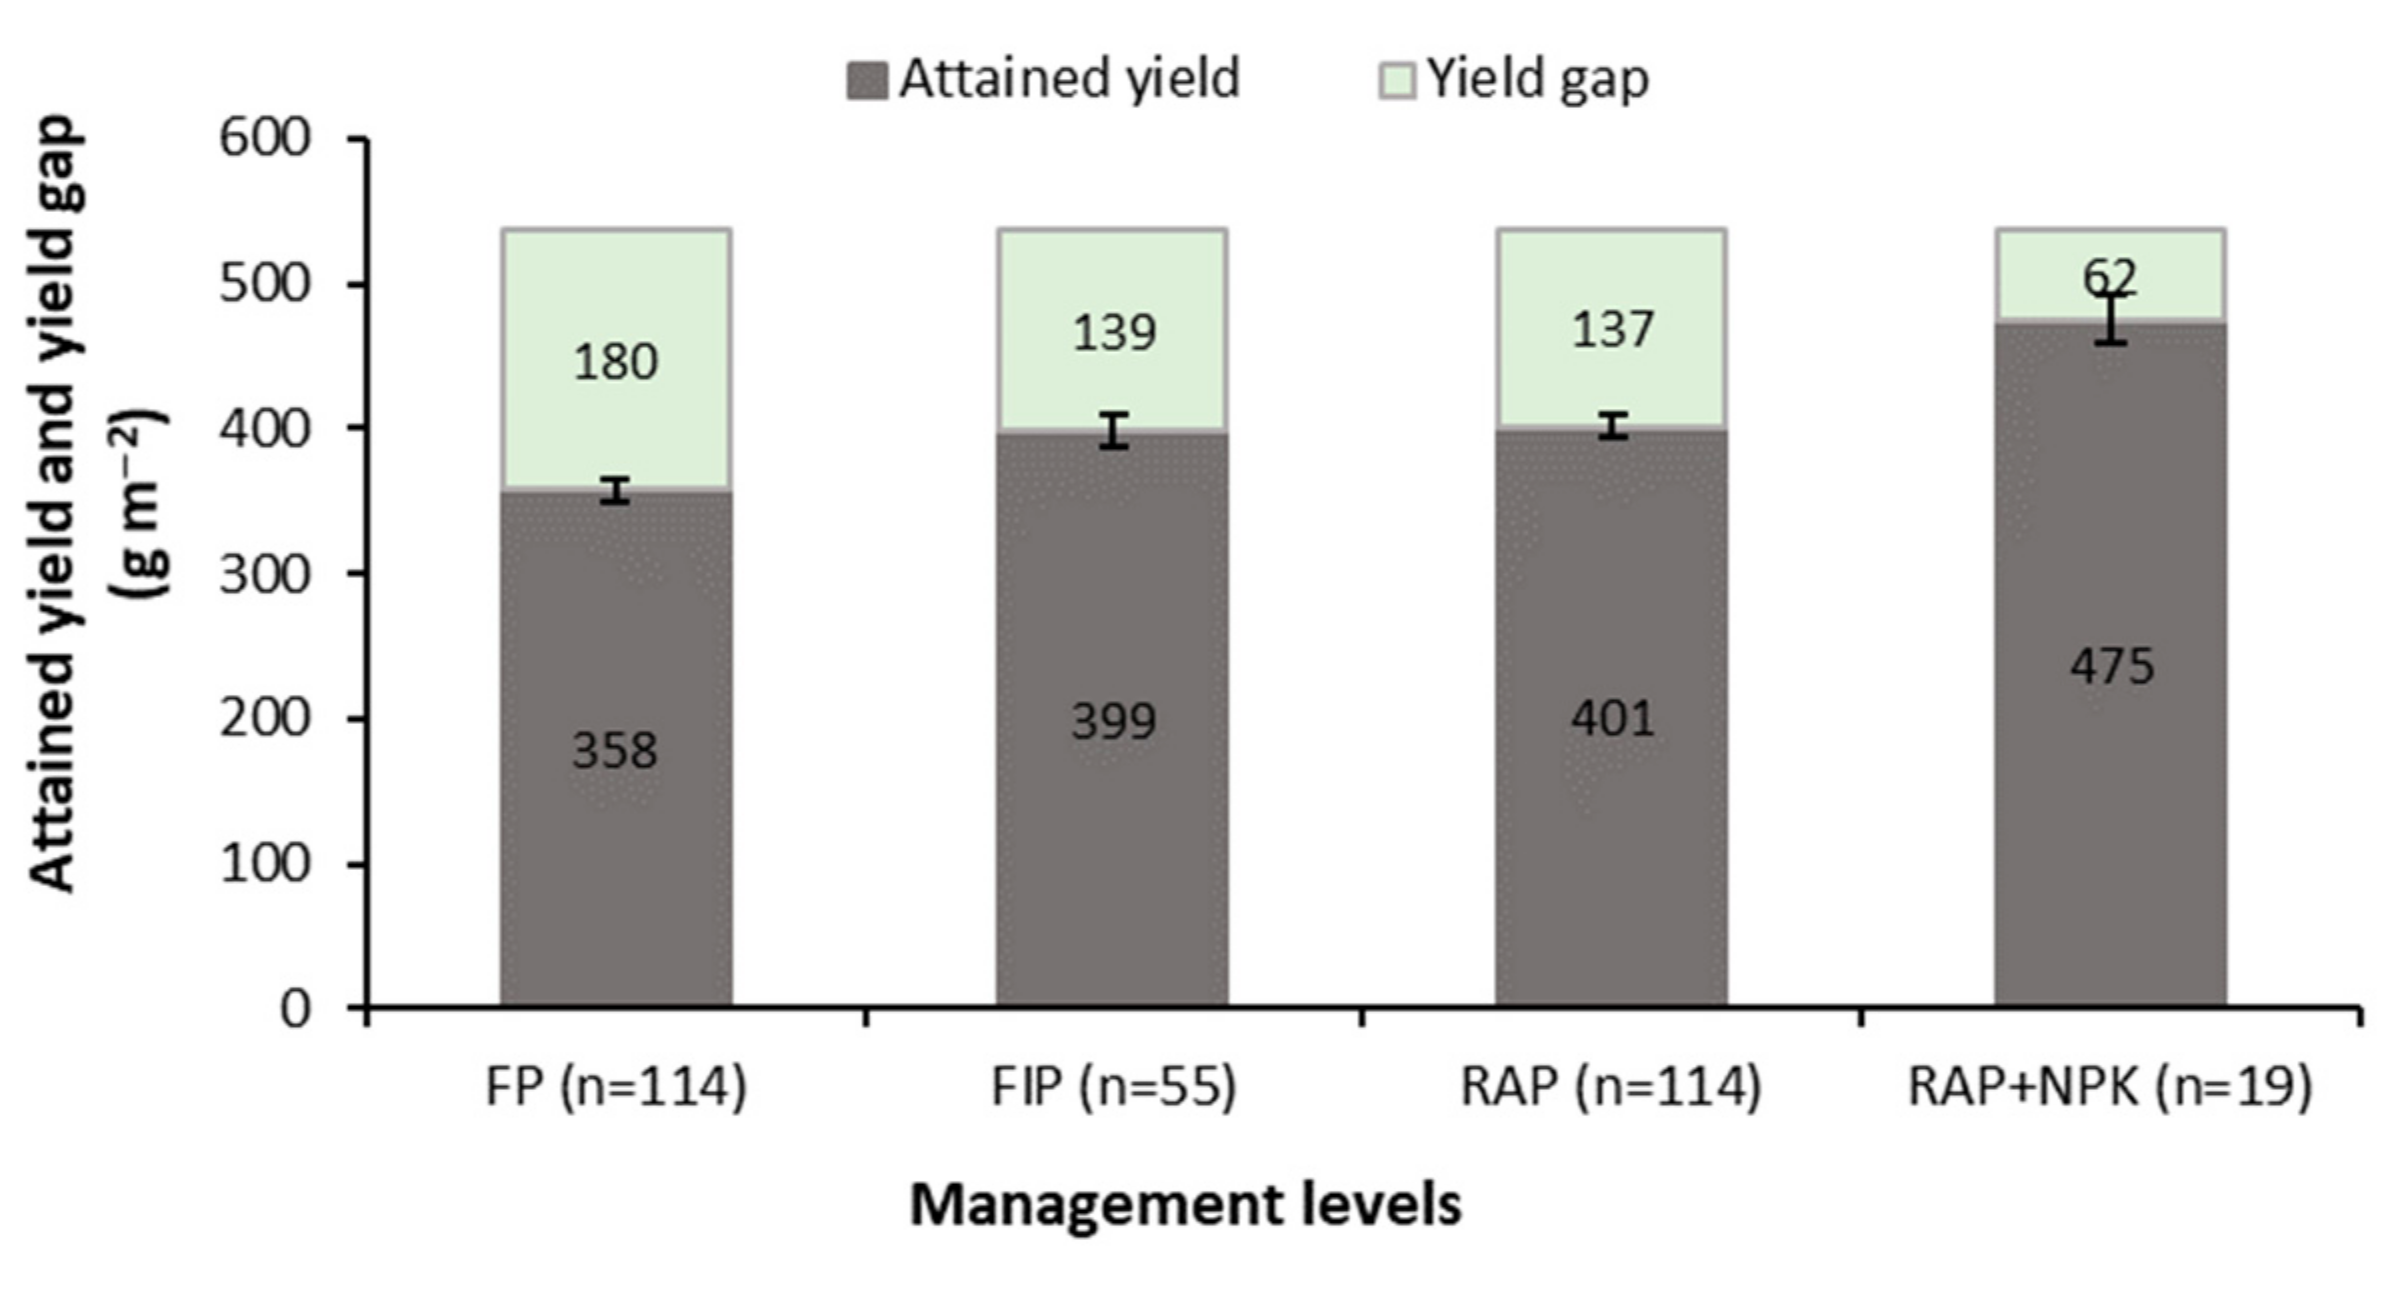
| Treatments 1 | Yield (g m−2) | Panicles m−2 | Filled Grains/Panicle | Filled Grains m−2 (×103) | Filled Grains (%) | 1000-Grain Weight (g) | HI 2 (%) |
|---|---|---|---|---|---|---|---|
| FP (n = 114) | 358 a | 340 a | 49.6 a | 16.5 a | 68.4 b | 21.7 c | 42.2 b |
| FIP (n = 55) | 399 b | 365 b | 52.2 b | 18.5 b | 68.9 b | 21.6 bc | 42.7 bc |
| RAP (n = 114) | 401 b | 364 b | 52.7 b | 18.7 b | 68.9 b | 21.5 b | 43.0 c |
| RAP+NPK (n = 19) | 475 c | 431 c | 52.9 b | 22.5 c | 63.1 a | 21.2 a | 40.2 a |
| Mean | 408 | 375 | 51.8 | 19.1 | 67.3 | 21.5 | 42.0 |
| SED | 7.0 | 10.1 | 1.2 | 0.3 | 1.0 | 0.1 | 0.5 |
| p-value | <0.001 | <0.001 | 0.01 | <0.001 | 0.05 | 0.02 | 0.03 |
| Treatment | Yield (g m−2) | Exploitable Yield Gap (g m−2) | ||||
|---|---|---|---|---|---|---|
| FP (504) n = 11 | FIP (542) n = 5 | RAP (555) n = 11 | RAP+NPK (592) n = 2 | All Treatments (543) n = 32 | ||
| FP | 358 | 147 | 184 | 197 | 234 | 186 |
| FIP | 399 | 105 | 142 | 156 | 193 | 144 |
| RAP | 401 | 103 | 140 | 154 | 191 | 142 |
| RAP+NPK | 475 | 29 | 66 | 80 | 117 | 68 |
| Management Practice | Slope Estimate | Unit of Slope Estimate | Standard Error | p-Value | Lower 95% Confidence Limit | Upper 95% Confidence Limit | Adjusted R2 |
|---|---|---|---|---|---|---|---|
| Weeding time (DAT) 1 | −5.3 | g m−2 day−1 | 0.54 | <0.001 | −6.4 | −4.2 | 0.22 |
| Fertilization timing (DAT) | −1.9 | g m−2 day−1 | 0.48 | <0.001 | −2.8 | −0.9 | 0.13 |
| N (g m−2) | 11.0 | 0.19 | <0.001 | 7.2 | 14.7 | 0.09 | |
| P+K (g m−2) | 18.8 | 0.40 | <0.001 | 11.0 | 26.7 | 0.06 |
| Management Practice | Higher Yielding Plots (n = 39) | Median Yielding Plots (n = 39) | Lower Yielding Plots (n = 39) | |
|---|---|---|---|---|
| Crop establishment method | Line transplanting (%) | 76.9 | 51.3 | 48.7 |
| Random transplanting (%) | 23.1 | 48.7 | 51.3 | |
| Weeding time | 14–21 DAT (%) | 84.6 | 69.2 | 17.9 |
| 22–28 DAT (%) | 12.8 | 10.3 | 0.0 | |
| ≥29 DAT (%) | 2.6 | 20.5 | 82.1 | |
| Average weeding time (DAT) | (p < 0.001, SED = 1.5) | 19.5 | 21.9 | 32.4 |
| Fertilizer use | Yes (%) | 46.2 | 35.9 | 2.6 |
| No (%) | 53.8 | 64.1 | 97.4 | |
| Average nutrient rate (g m−2) | N (p < 0.001, SED = 0.64) | 2.69 | 1.71 | 0.04 |
| P+K (p = 0.008, SED = 0.33) | 1.06 | 0.56 | 0.0 | |
| Fertilization time | 14–21 DAT (%) | 55.6 | 28.6 | 0.0 |
| 22–28 DAT (%) | 5.6 | 14.3 | 0.0 | |
| ≥29 DAT (%) | 38.9 | 57.1 | 100 | |
| Average fertilization time (DAT) | (p = 0.24, SED = 9.7) | 25.3 | 32.0 | 61.0 |
Publisher’s Note: MDPI stays neutral with regard to jurisdictional claims in published maps and institutional affiliations. |
© 2022 by the authors. Licensee MDPI, Basel, Switzerland. This article is an open access article distributed under the terms and conditions of the Creative Commons Attribution (CC BY) license (https://creativecommons.org/licenses/by/4.0/).
Share and Cite
Awio, T.; Senthilkumar, K.; Dimkpa, C.O.; Otim-Nape, G.W.; Struik, P.C.; Stomph, T.J. Yields and Yield Gaps in Lowland Rice Systems and Options to Improve Smallholder Production. Agronomy 2022, 12, 552. https://doi.org/10.3390/agronomy12030552
Awio T, Senthilkumar K, Dimkpa CO, Otim-Nape GW, Struik PC, Stomph TJ. Yields and Yield Gaps in Lowland Rice Systems and Options to Improve Smallholder Production. Agronomy. 2022; 12(3):552. https://doi.org/10.3390/agronomy12030552
Chicago/Turabian StyleAwio, Thomas, Kalimuthu Senthilkumar, Christian O. Dimkpa, George William Otim-Nape, Paul C. Struik, and Tjeerd Jan Stomph. 2022. "Yields and Yield Gaps in Lowland Rice Systems and Options to Improve Smallholder Production" Agronomy 12, no. 3: 552. https://doi.org/10.3390/agronomy12030552
APA StyleAwio, T., Senthilkumar, K., Dimkpa, C. O., Otim-Nape, G. W., Struik, P. C., & Stomph, T. J. (2022). Yields and Yield Gaps in Lowland Rice Systems and Options to Improve Smallholder Production. Agronomy, 12(3), 552. https://doi.org/10.3390/agronomy12030552