Article

Morphological and Biochemical Variation in Carrot Genetic Resources Grown under Open Field Conditions: The Selection of Functional Genotypes for a Breeding Program

1
Department of Horticulture, College of Agriculture & Life Sciences, Jeonbuk National University, Jeonju 54896, Korea
2
Core Research Institute of Intelligent Robots, Jeonbuk National University, Jeonju 54896, Korea
3
National Agrobiodiversity Center, National Institute of Agricultural Sciences, Rural Development Administration, Jeonju 54874, Korea
4
Breeding Research Institute, Koregon Co., Ltd., Gimje 54324, Korea
5
Department of Horticultural Science, College of Agriculture & Life Sciences, Kyungpook National University, Daegu 41566, Korea
6
Institute of Agricultural Science & Technology, Kyungpook National University, Daegu 41566, Korea
7
Institute of Agricultural Science & Technology, Jeonbuk National University, Jeonju 54896, Korea
*
Author to whom correspondence should be addressed.
Agronomy 2022, 12(3), 553; https://doi.org/10.3390/agronomy12030553
Submission received: 11 January 2022 / Revised: 21 February 2022 / Accepted: 22 February 2022 / Published: 23 February 2022

Abstract

:
Carrot (Daucus carota), one of the most economically important root vegetables, shows a wide range of morphological and biochemical diversity. However, there is a lack of simultaneous systematic study regarding the biochemical composition and morphological characteristics in carrot genetic resources, which is crucial for crop improvement. For this reason, the morphological characteristics, carotenoids, and free sugar content of 180 carrot genetic resources grown in open field conditions from March to June 2020 were accessed to select the lines for a potential breeding program. Altogether, 15 qualitative and 4 quantitative agronomical characteristics were evaluated and grouped into four categories based on root color (orange, yellow, white, and purple). Three carotenoids (lutein, α-carotene, and β-carotene) and three free sugars (fructose, glucose, and sucrose) were also analyzed. The results revealed wide genetic variation in both qualitative and quantitative traits. Most of the genetic resources were orange (n = 142), followed by white (n = 16), yellow (n = 14), and purple (n = 8). Carotenoid profile and content were highly dependent on root color and showed wide genetic variability, while sugar content and profile were independent of the root color. Alpha- and β- carotene were the major carotenoids in orange carrots representing 43.3 and 41.0% of total carotenoids. In contrast, lutein was most dominant in other colored carrots (79.7–98.6% of total carotenoids). In most of the genetic resources, sucrose was the most dominant free sugar, followed by glucose and fructose. The results of this study showed that some genetic resources elevated carotenoid and sugar content. The morphological and biochemical diversity observed in this study might be useful for improving the agronomic traits and biochemical content of carrot lines for breeding programs.

1. Introduction

Carrot (Daucus carota L.; 2n = 18), an economically important root vegetable crop, ranks as one of the 10 most cultivated crops in the world with a worldwide annual production (carrot and turnips) of ~44.76 million tons and a total cultivation area of 1.12 million ha [1]. Several epidemiological studies showed that increased consumption of carrots is associated with a reduced risk of cancer, several chronic diseases, cardiovascular diseases, and age-related macular degeneration. The protective effects of carrots are mainly due to the presence of carotenoids, phenolics, flavonoids, minerals, and fatty acids [2,3,4]. Among them, carotenoids are one of the most important phytochemicals in carrots, of which alpha- and β-carotene are the most abundant, accounting for 80–90% of the total carotenoid content in most of the carrot genotypes [5]. The other major carotenoids found in carrots are lutein, zeaxanthin, cryptoxanthin, lycopene, phytoene, and phytofluene, and the composition of carotenoids is greatly affected by root color. For example, phytoene and phytofluene are generally found in white color carrots while α- and β-carotene are dominant in orange carrots [6]. Carotenoids show a wide range of health benefits [7,8]. A positive correlation between the dietary intake of carotenoids and protection of DNA and proteins, lower risk of non-alcoholic fatty liver disease (NAFLD), heart diseases, lipids from oxidative damage, cancer prevention, and normal vision is reported [5,7,9,10,11,12,13]. Carotenoids are also associated with a reduced risk of age-related macular degeneration, cataracts, and coronary heart diseases [3,14]. There is also evidence of a beneficial effect on cognitive function [15]. Furthermore, high concentrations of α and β-carotene are negatively correlated with the risk of atherosclerosis [16].
Carbohydrates are the primary compounds of plant metabolism that can be used as energy sources for vegetable growth and development. Free sugars, which are primary compounds necessary to increase palatability, determine the sweetness in fruits and vegetables. They also alter the flavor, acceptability, and perception of flavor sensations associated with other organic compounds [17,18]. The concentrations of three sugars (fructose, glucose, and sucrose) are responsible for increasing the sweetness of any fruit or vegetable, which in turn increases consumer acceptance. Sucrose, glucose, and fructose are the main types of carbohydrates in carrot roots; among them, sucrose is the major storage carbohydrate [19], but its proportion is considerably affected by genotype and the environment [4,20,21].
Morphological traits are also important parameters for the identification and selection of favorable genotypes as plant breeders can use this information for the development of breeding populations [22]. Both qualitative and quantitative morphological characteristics are useful for germplasm studies. Generally, qualitative parameters are useful for varietal identification, while quantitative parameters are required for the development of new varieties [23]. Although there are some reports about the morphological traits of carrots, they are limited to a few germplasms [24,25]. In those cases, only quantitative parameters were studied. Therefore, a detailed analysis of morphological variability in carrot core collection is required to understand the diversity in both the qualitative and quantitative parameters. This characterization of morphological parameters is considered an important step in the description and classification of germplasm.
The functional quality and composition of beneficial compounds in carrot roots, such as carotenoids and free sugars, are significantly influenced by both genetic and environmental factors. These include the genotypes, fruit developmental stage, climatic conditions, physiological status, growing seasons, agricultural practices, postharvest storage conditions, and root color [6,21,26,27,28,29,30,31,32,33,34]. Among them, genotype plays a key role in the differential accumulation of bioactive compounds and alters their health-beneficial properties [6]. As wide genetic variability is necessary for the improvement of desired characteristics, the formulation of breeding programs is also required to develop high-quality cultivars rich in health-beneficial compounds. Previous reports presented genetic differences in carotenoids and total soluble sugars in widely diversified carrot genotypes [6,26]. However, these studies mainly focused on either carotenoid accumulation [26,28] or morphological variation in carrots of different origins [24]. Furthermore, there is limited research on both agronomic parameters and biochemical analysis at the same time in carrot genotypes.
The main objectives of this study were to investigate genotypic variations in the agronomic parameters, carotenoids and free sugar content in carrot genetic resources, and to evaluate the potential carrot genetic resources rich in carotenoids and sugars. Genotypes with higher carotenoids and enhanced agronomic parameters can be further used for commercial breeding. Plant breeders can use the selected genotypes with improved nutritional value and favorable agronomic parameters to develop new cultivars.

2. Materials and Methods

2.1. Chemicals and Reagents

Four carotenoid standards (lutein, lycopene, α-carotene, and β-carotene) and three sugar standards (glucose, fructose, and sucrose) were purchased from Sigma-Aldrich (St. Louis, MO, USA). HPLC-grade acetonitrile, methanol, chloroform, and water were obtained from Avantor Performance Materials (Center Valley, PA, USA).

2.2. Plant Material and Cultivation of Carrot

A total of 180 carrot genetic resources collected from 40 countries were used in this study. The individual names, accession numbers, and source details are provided in Table S1. The seeds were provided by the National Agrobiodiversity Center, Jeonju, Korea. The seeds were directly sown in an experimental field with a line spacing of 20 cm × 100 cm at the Breeding Research Institute of Koregon (Gimje, Korea). Base fertilizer N (110 kg ha−1), P (70 kg ha−1), K (70 kg ha−1), M (18 kg ha−1), and B (1.8 kg ha−1), and compost fertilizer (3700 kg ha−1) were used in the experimental field during cultivation. Five seeds per hole were sown, and post-germination, healthy seedlings were identified at the three-leaf stage; all other seedlings were removed. Irrigation was performed daily in the morning using sprinklers. Meteorological data were recorded from a weather station close to the cultivation field during the cultivation period (Figure 1). Carrot roots were harvested on 22 and 24 June 2020 at the marketable stage after visual evaluation by plant breeders.

2.3. Evaluation of Qualitative and Quantitative Morphological Parameters

The qualitative and quantitative traits of the plants were observed. The qualitative parameters included in this study were leaf posture, leaf color, flowering, leaf emerging area, petiole anthocyanin coloring, root shoulder shape, tip shape, external color, internal color, lengthwise root shape, muscle skin condition (surface curvature), curvature depth, shoulder epidermis anthocyanin pigmentation, green area of the shoulder epidermis, and the intensity of the outer color of the muscle. These parameters were evaluated visually. The quantitative parameters included leaf length, root weight, root diameter, and root length.
Leaf posture, leaf color, and flowering were evaluated in the experimental field just before harvest. After harvest, carrot roots were washed with tap water to remove the dust or soil particles and dried using a paper towel. The remaining qualitative and quantitative parameters were then evaluated. The leaf length (cm), root length (cm), and root diameter (cm) were measured using a measuring tape, whereas the weight (g) of the root was measured using a weighing machine. The root tips and heads were discarded, the remaining parts were sliced vertically, and half of the sliced part was cut into small pieces, freeze-dried, ground into a fine powder, and stored at −20 °C until the analysis of carotenoids and free sugars was conducted. The remaining half of the sliced part was used to evaluate the color attributes.

2.4. Evaluation of Color Value

Color values were measured using a Konica Minolta CM 2002 spectrophotometer (Konica Minolta®, Osaka, Japan) per the guidelines of the International Commission on Illumination. The values were recorded as L* (lightness; black = 0, white = 100), a* (redness > 0, greenness < 0), b* (yellowness > 0, blueness < 0), C (chroma), and hue° (hue angle, H°, red = 0°, yellow = 90°, 180° = green, 270° = blue). Three carrot roots were used for each genetic resource to evaluate the color value.

2.5. Extraction and Analysis of Carotenoids

Carotenoid analysis was performed according to the method described by Bhandari and Lee [35]. The extraction was performed under dim light to minimize the carotenoid degradation that occurs during sample preparation under light. The freeze-dried and powdered carrot samples (0.2 g) were extracted with 5 mL chloroform:methanol (1:1, v/v) in the dark for 30 min, centrifuged at 3500 rpm for 10 min, and the supernatant was then collected. The pellet was re-extracted using the same solvent and protocol. After centrifugation, the supernatant was combined and diluted five times with methanol (100%), vortexed, filtered using a 0.2 µm PVDF (polyvinylidene fluoride) syringe filter, and stored in a 1.5 mL amber vial. The carotenoids were then analyzed using a 1260 high-performance liquid chromatography (HPLC) system (Agilent Technologies, Santa Clara, CA, USA) equipped with an auto-injector and photodiode array (PDA) detector set at 470 nm. The Nova-Pak® C18 4 µm (3.9 × 150 mm) column (Waters, Milford, MA, USA) was used to separate the carotenoid peaks. The peaks were separated using an isocratic system with a mobile phase (100% methanol) at a flow rate of 1.4 mL min−1. The individual carotenoid was then identified and quantified using a commercial standard with their retention time and peak area, respectively. Different concentrations (0.5–10.0 µg mL−1) of each carotenoid was used to generate the calibration curve. All the carrot genetic resources were analyzed using three biological replications, and the individual carotenoid was expressed as mg 100 g−1 of dry weight (DW).

2.6. Extraction and Analysis of Free Sugars and Total Sweetness Index (TSI) Analysis

Sugar content was assessed according to the method described by Bhandari et al. [36]. Freeze-dried carrot samples (0.2 g) were extracted in distilled water (5.0 mL) for 20 min in a water bath at 80 °C with shaking at 150 rpm. The solution was then immediately cooled, centrifuged (3500 rpm for 10 min), filtered through a 0.22 µm syringe filter, and analyzed using a 1260 HPLC system (Agilent Technologies, Santa Clara, CA, USA) equipped with a quaternary HPLC pump, an auto-sampler, and a refractive index detector. Peaks were separated using a carbohydrate analysis column (4.6 × 250 mm, 5 µm; ZORBAX, Agilent Technologies) in a column oven temperature at 30 °C. Isocratic conditions of the mobile phase [acetonitrile/distilled water (75/25, v/v)] at a flow rate of 1.4 mL min−1 were used for the separation of peaks. Individual free sugar peaks were identified based on retention times and quantified based on peak areas relative to authentic standards (0.5–10.0 mg mL−1). The results were expressed as mg g−1 dry weight (DW).
The total sweetness index (TSI) was calculated using the sugar concentration and sweetness coefficient of each sugar according to the method described by Magwaza and Opara [37].

2.7. Statistical Analyses

The means of three biological replicates were used for statistical analyses. Data were analyzed using SPSS Statistics 20.0 (ver. 20; IBM, Armonk, NY, USA). Analysis of variance followed by Duncan’s range multiple tests among the mean values of orange (n = 142), purple (n = 8), white (n = 16), and yellow (n = 14) root color genetic resources were used to analyze the statistical differences at p ≤ 0.05. Correlations were tested using Pearson’s correlation coefficient (r) at p ≤ 0.05. All the figures were generated through SigmaPlot® 12 (Systat Software Inc., San Jose, CA, USA).

3. Results and Discussion

3.1. Variation in Qualitative and Quantitative Morphological Traits

Fifteen qualitative parameters [leaf posture, leaf color, flowering, leaf emerging area, petiole anthocyanin coloring, root shoulder shape, tip shape, external color, internal color, lengthwise root shape, muscle skin condition (surface curvature), curvature depth, shoulder epidermis anthocyanin pigmentation, green area of the shoulder epidermis, and the intensity of the outer color of the muscle] were studied. These parameters showed a wide variation among the genetic resources (Table 1 and Table S1). The majority of the genetic resources had a slightly standing leaf posture (58.9% of the total genetic resources), the remaining genetic resources had upright (40.6%) and lying down (0.6%) postures. Green (60.6% of the genetic resources) was the dominant color of leaves, followed by non-green (28.3%) and dark green (11.1%). Strong flowering was dominant among the genetic resources during maturity, and approximately 10.3% of genetic resources exhibited weak flowering. Approximately one-third of the genetic resources (n = 59) exhibited anthocyanin coloring in the petiole. The shoulders of the roots were of five types: flat, flat round, round, round flat, or sharp. The majority of genetic resources exhibited the flat-round shoulder shape (n = 86), whereas only four genetic resources showed the sharp shoulder shape. The tip of the root exhibited one of the three different shapes (blunt, little sharp, and sharp), out of which blunt (40.6% of the genetic resources) and little sharp (41.1% of the genetic resources) were observed in the majority of the genetic resources. Four different root colors were observed: white, yellow, orange, and purple. The different root color was conferred by the Y and Y2 loci in the chromosomes 5 and 7, respectively, in which Y_Y2_, yyY2_, Y_y2y2, and yyy2y2 genotypes represent white, yellow, pale orange, and orange root color, respectively [38,39]. Moreover, the purple root color was due to the deposition of anthocyanin, which was regulated by the genes in the P1 and P3 regions of chromosome 3 [40,41]. The majority of the genotypes were orange (n = 142), whereas the least dominant root color was purple (n = 8). The longitudinal shape of the carrot root was of one of these five different types: Doran, middle inverted triangle (1), narrow inverted triangle (2), middle of the 1 and 2, and narrow long ellipse. The majority of the genetic resources showed either a middle inverted triangle (n = 57) or a narrow inverted triangle (n = 55) shape. Only 4.4% of the total genetic resources exhibited the narrow long ellipse shape (Table 1).
The smoothness of the muscle skin also showed a wide variation. Skin surface curvature was found in many of the genetic resources. Only 23.3% of the genetic resources showed no surface curvature in their muscle skin, whereas approximately half of the genetic resources (n = 91) had small or no curvature. A small number of genetic resources (n = 13) had relatively large curvature in their muscles. Anthocyanin pigmentation in the shoulder of the root was found in 40% of the genetic resources. Most of the genetic resources had none or a small green region in the shoulder epidermis. The intensity of the outer color of the muscle (green region) was medium in most of the genotypes (n = 101), which was followed by light green (n = 53) and dark green (n = 26).
Four quantitative agronomic traits (leaf length, root length, root diameter, and root weight) were also evaluated. They showed wide genetic variation among the genetic resources (Table 2 and Table S2). Leaf length showed a differential range depending on the root color. Purple-colored carrot exhibited the longest leaf length, with a range of 65.0–112.0 cm. Generally, the shortest leaf length was found in carrots with orange roots. The overall leaf length ranged from 30.0 to 112.0 cm, with an average value of 55.9 cm. Root length ranged from 8.1 to 22.5 cm with an average of 14.2 cm regardless of root color, thereby showing the non-significant difference in their average value among the four different root colors. The root diameter showed an approximately 4-fold difference between the lowest and highest values and ranged from 1.8 to 7.7 cm. The weight of the carrot root exhibited 10-fold differences between the lowest and highest values and ranged from 22.6 to 223.1 g. Among the four different colored carrots, orange carrots exhibited wide genetic variation with a 9-fold difference in root weight, which might be due to a large number of genetic resources from diverse origins.
Purple-colored carrots exhibited the highest average root weight (140.0 g), ranging from 63.2 to 223.1 g, followed by orange- and yellow-colored carrots. The lowest weight was found in white carrots. However, the average root weight was statistically similar in orange, white, and yellow roots. Overall, six genetic resources (two purple-colored: 301847 and 301849, and four orange-colored: 204232, 210173, 303005, and 210174) had relatively higher root weights (>200 g) than the others. These six genotypes could be considered for future breeding programs as yield is one of the parameters that is considered in commercial breeding programs [25]. However, analysis of seasonal and yearly variations might be useful for gathering information for stable production. The wide variability in both qualitative and quantitative traits found in this study might be useful for identifying genotypes and might be required for the genetic improvement of crops [23,42]. The genetic analyses showed that the differential expression of a number of genes located in chromosomes 1, 2, and 7 are responsible for the differences in root characteristics of carrots [43,44]. The selected genotypes with higher weight and uniform size can be used for future breeding programs. Overall, the results of this study might be useful for selecting candidate genotypes with better growth performance and higher yield. To the best of our knowledge, this is the first report showing morphological variability in carrot genetic resources of diverse origins.

3.2. Variation in Color Attributes

Color is an important quality parameter of fruits and vegetables evaluated by consumers as it highly affects their marketability [45]. In the present study, all five color components varied greatly among the genetic resources (Table 3 and Table S2). Most of the genotypes showed a differential range of color attributes between the outer and inner parts of the root. Most of the carrot genetic resources were of orange color and exhibited statistically higher C values (44.6 and 54.2 in the outer and inner parts, respectively), suggesting the higher quantitative attributes of colorfulness [45], whereas the average yellowness (b) value was significantly higher in yellow carrot, followed by orange, white, and purple carrot. Both white and yellow carrots exhibited the lowest average redness (a) values (<5.5), with a higher genetic variation compared to orange and purple carrots. Likewise, the average lightness was relatively higher in the white and yellow roots in both the inner and outer parts than the other roots. Similar to Jourdan et al. (2015), each color component varied greatly in tissues among the genetic resources. In both the outer and inner tissue, redness (a) showed the highest variation (52.6% in inner and 40.3% in outer tissue) in all carrot genetic resources, followed by hue angle (h), lightness (L), and chroma (C). This information might be useful for selecting the desired colored carrots because an appropriate color increases consumer acceptance [46].

3.3. Variation in Biochemical Parameters

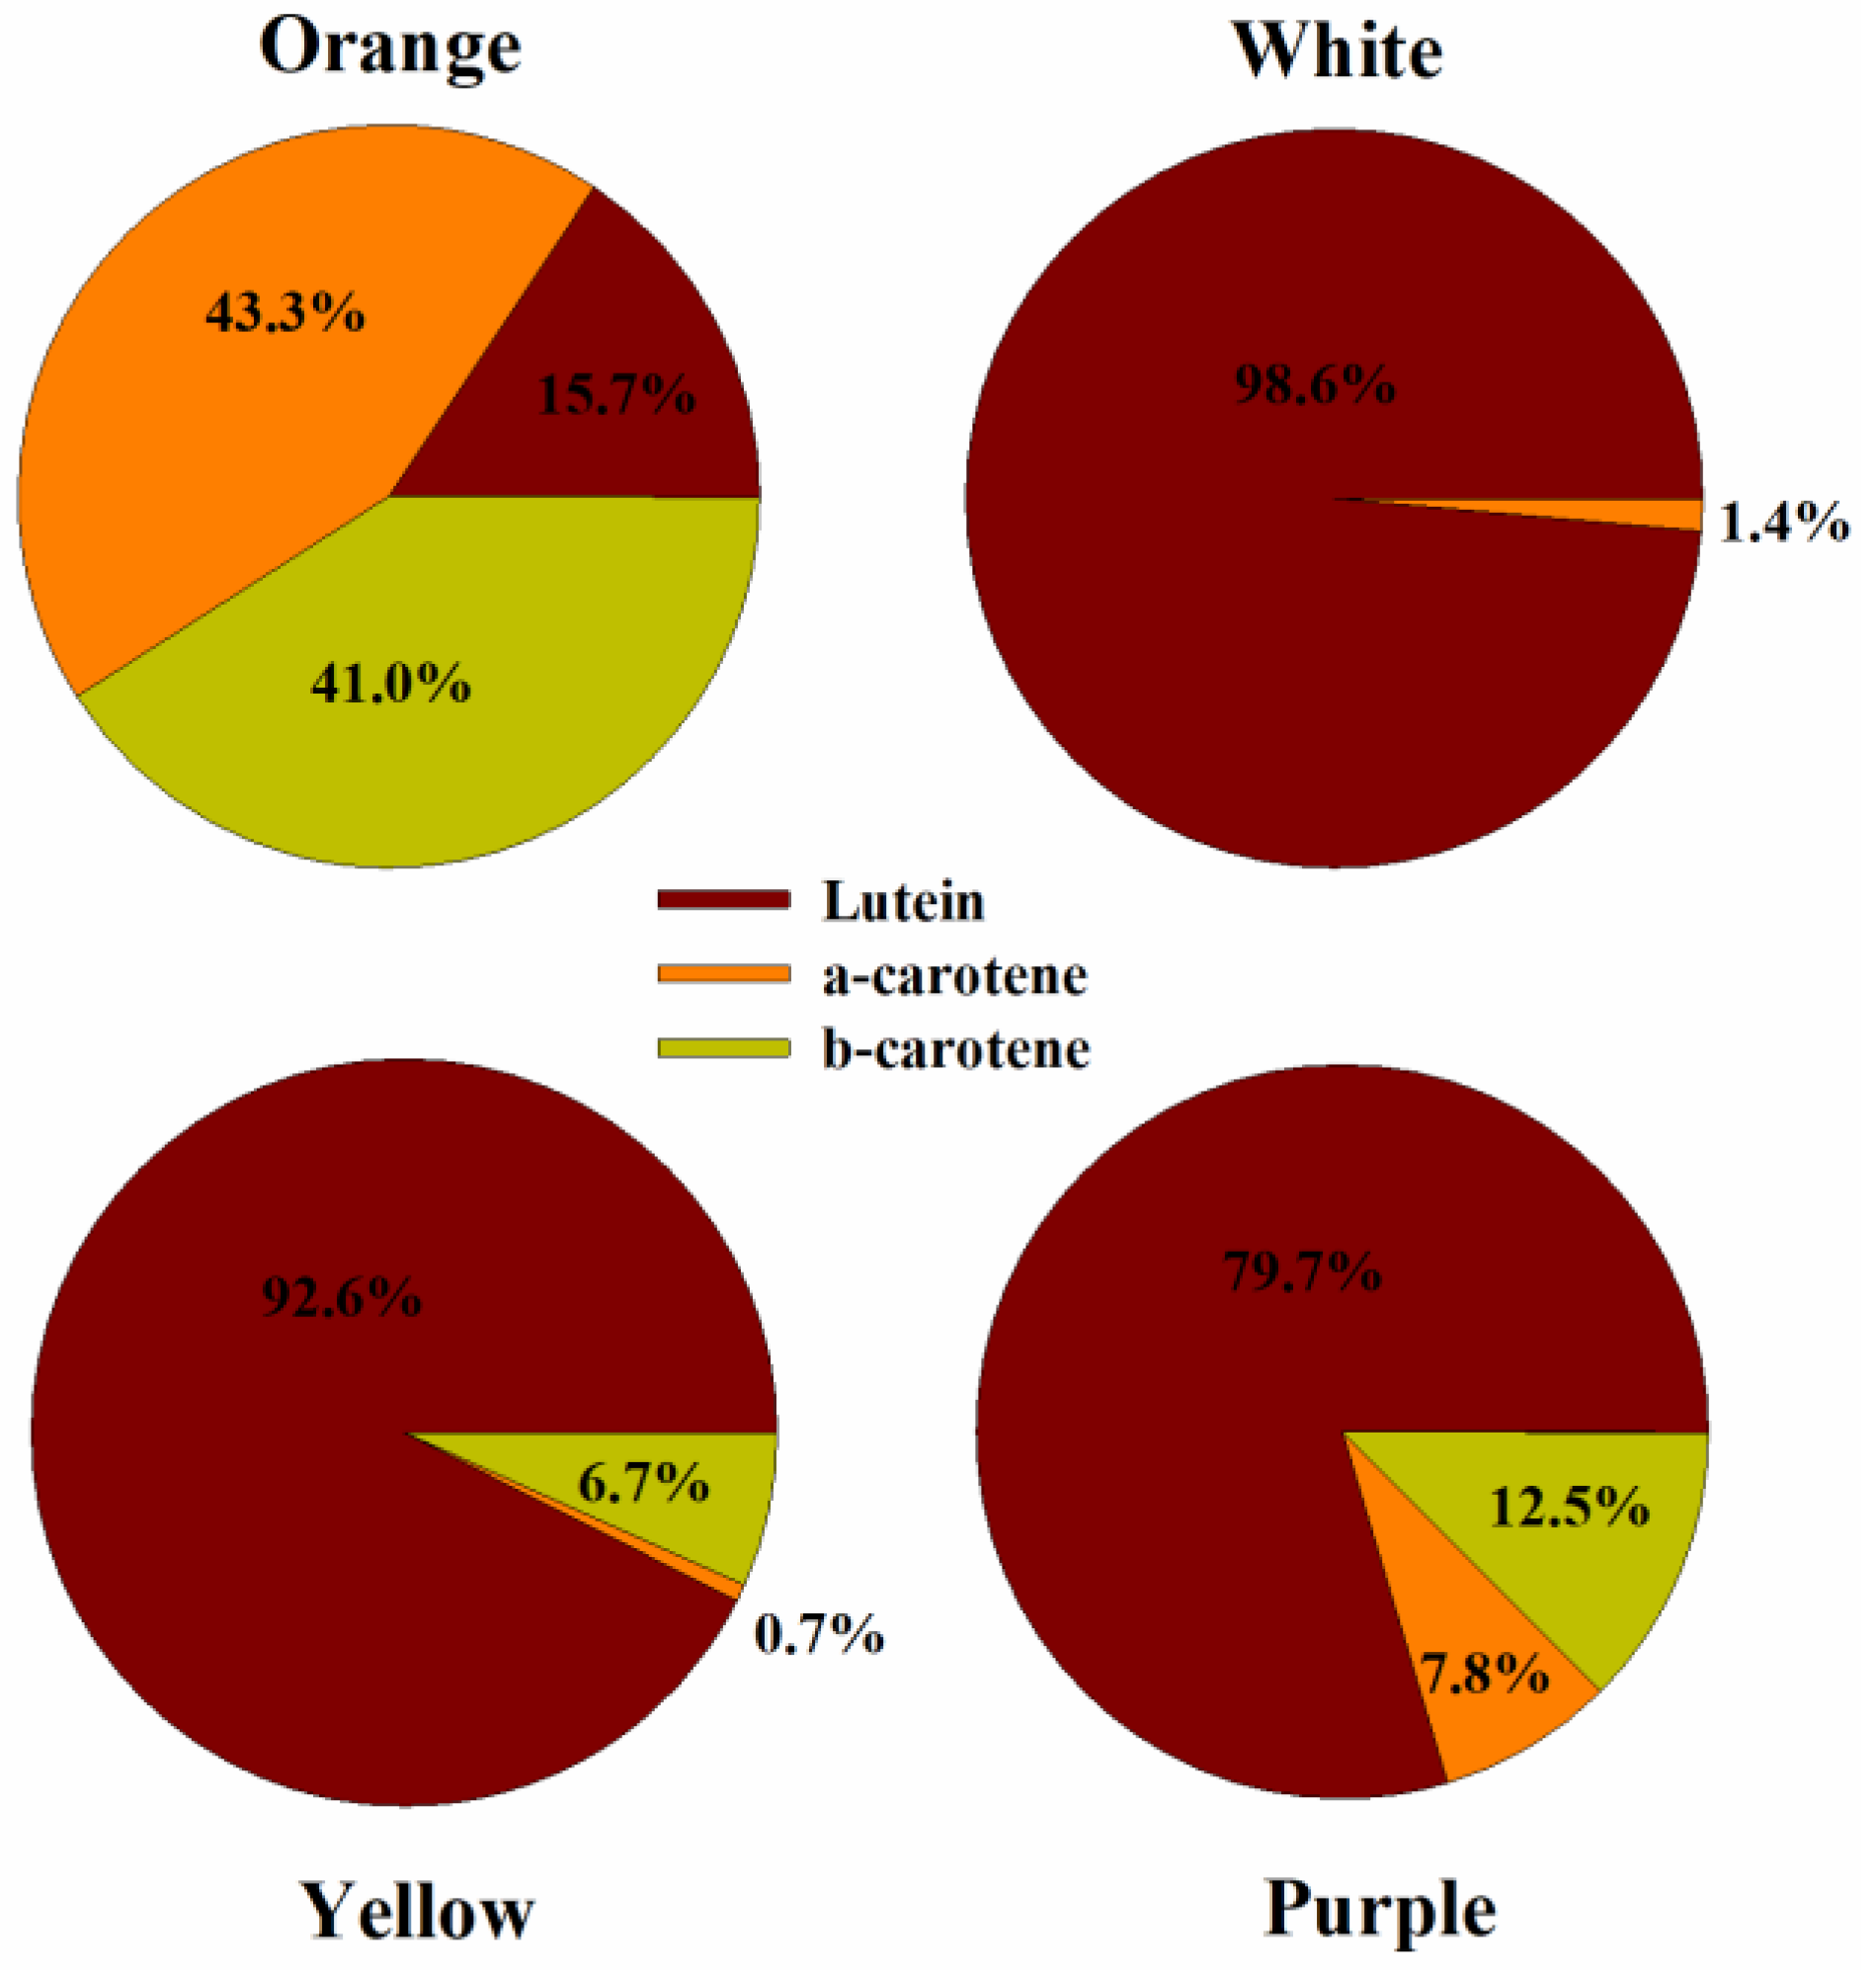
3.3.1. Variation in Carotenoids Profile and Content

Carotenoid content was highly dependent on the root color of carrots and showed wide genotypic variation, which is similar to the previous reports [6,34] (Table 4 and Table S2). Among the four carotenoids analyzed in this study, only three carotenoids, namely lutein, α-carotene, and β-carotene, were detected. Alpha- or β-carotene were the most dominant carotenoid in orange-colored carrots depending upon the genetic resources, whereas lutein was the most dominant carotenoid in white-, yellow-, and purple-colored carrots. These findings were consistent with those of previous reports by Jourdan et al. [6]. The amount of lutein, a-carotene, and β-carotene in orange-colored carrot ranged from 4.87 to 23.48 mg 100 g−1, 12.40 to 73.23 mg 100 g−1, and 12.65 to 71.10 mg 100 g−1, respectively, and showed average values of 11.82, 35.75, and 33.35 mg 100 g−1, respectively (Table 4). Average lutein content was statistically higher in carrots with purple and yellow roots compared to other root colors.
On average, α-carotene, β-carotene, and lutein content formed 43.3%, 41.0%, and 15.7%, respectively, of the total carotenoid content in orange carrot (Figure 2). This result was slightly different from the previous reports by Jourdan et al. [6]; they reported α- carotene and β-carotene approximately at a 1:2 ratio. Such discrepancies might be due to differences in the genetic resources. Branski et al. [26] also found higher genetic variation in total carotenoid content in 104 carrot accessions from the European Gene Bank, although they estimated the total carotenoids using spectrophotometric methods only.
In the present study, six genetic resources; 100527, 210175, 100541, 301938, 220541, and 210171, showed relatively higher α-carotene (>60.00 mg 100 g−1) content compared to the other genetic resources (Table S2). Similarly, genotypes 331120, 100541, 302276, 283365, and 301947 were found to be rich in β-carotene (>50.00 mg 100 g−1) in orange-colored carrot. Lutein, the least dominant carotenoid in orange-colored carrot, was relatively higher (>19.00 mg 100 g−1) in 203368, 276366, 203364, 300048, and 325079 genetic resources. The dominant carotenoid in purple carrot was lutein, which accounted for about 80% of the total carotenoid content; it was followed by β-carotene (12.5%) and α-carotene (7.8%). The average contents of lutein, α-carotene, and β-carotene in purple carrots were 14.81, 2.40, and 3.56 mg 100 g−1, respectively. In purple carrots, lutein and β-carotene were found in all the genetic resources (n = 8), whereas α-carotene was found only in four genetic resources (Table S2). Similarly, lutein and β-carotene were exhibited in all the genetic resources of yellow-colored carrots and had a range of 4.31 to 23.47 mg 100 g−1 and 0.11 to 1.79 mg 100 g−1, respectively; in contrast, α-carotene was found in only one genetic resource. Almost all of the yellow carrots exhibited higher lutein content (>10.0 mg 100 g−1), and the genotype 204228 showed the highest lutein content (23.47 mg 100 g−1) among yellow carrot genotypes. Lutein was also found in all white carrots (0.91–12.79 mg 100 g−1), whereas α-carotene was found only in two genetic resources, and β-carotene was not found in all the genetic resources (n = 16). However, the content of α-carotene was too low (<1.13 mg 100 g−1) in white carrots, comprising 1.4% of the total carotenoid content (Figure 2); this might be due to the downregulation of carotene hydroxylase genes [47]. Lutein accounted for >90.0% of total carotenoid content in both yellow and white carrots. These results were consistent with those of Ma et al. [47] and Arscott and Tanumihardjo [48], who also found lutein to be the most dominant carotenoid in yellow carrots.
Overall, the results showed the differential accumulation of carotenoids in different root colors, which might be due to the differences in the expression patterns of carotenoid biosynthesis genes [47,49]. It is well known that the homozygous recessive genes (yyy2y2) located at chromosomes 3 and 7 are responsible for the higher accumulation of carotenoids in orange roots [39,50]. The average total carotenoid content in orange-colored carrots (80.93 mg 100 g−1) was significantly higher, showing about 4, 6, and 20 times higher values than that in the purple (20.77 mg 100 g−1), yellow (13.99 mg 100 g−1), and white carrots (5.09 mg 100 g−1), respectively. These results are consistent with those of previous reports [6,34,51]. The overall range of a-and β-carotene among the 180 genetic resources was similar to that reported by Jourdan et al. [6], who analyzed carotenoids in 380 samples, whereas some genetic resources of this study exhibited higher lutein content in comparison. Such differences might be due to differences in genotype and growing conditions, as carotenoid accumulation is highly dependent on genotype [26]. Genotypes with higher total carotenoids might be useful for breeding programs as carotenoids exhibit a wide range of health beneficial properties [7,9,12,13]. However, to confirm the stability of these carotenoids, the selected genotypes should be cultivated under altered environmental conditions.

3.3.2. Variation in Sugar Content and Total Sweetness Index

Free sugars are the primary compounds that increase palatability. Among the three free sugars, fructose is the sweetest sugar [37], while sucrose is a major transport and storage facilitator of sugar in the underground organs of plants, including carrots [20]. The results showed the presence of all three sugars in all the genetic resources. These resources exhibited wide variability in individual free sugar among the genotypes; however, overall variation in individual sugar content in different colored roots was not prominent compared to the carotenoid content (Table 5). Regardless of the root color, sucrose was the most dominant free sugar in almost all the genotypes, followed by glucose and fructose. This observation was consistent with the results of Bufler et al. [52] and Clausen et al. [53]. However, our results were inconsistent with the previous reports by Benamor et al. [54] and Yusuf et al. [55], who found all the three sugars, glucose, sucrose, and fructose, as dominant free sugars that are dependent upon genotypes. Such discrepancies might be due to the difference in growing conditions, e.g., temperature, fertilization, and genotypes, as these are the key factors that alter the sugar composition [55]. Sucrose content in orange, purple, white, and yellow genetic resources varied from 65.6 to 284.5 mg g−1, 84.4 to 259.4 mg g−1, 74.6 to 303.2 mg g−1, and 115.0 to 244.2 mg g−1; however, they showed a non-significant average value of 191.7, 174.0, 193.3, and 195.5 mg g−1, respectively. White and yellow carrots exhibited the highest sucrose content (~72% of total sugar content), followed by orange (~62%) and purple carrots (~56%) (Figure 3). Three orange carrots (274184, 136752, and 311590) and two white carrots (288843 and 301862) possessed relatively higher sucrose content (>275.0 mg g−1) than the other carrots.
Glucose, the second most abundant free sugar in carrots, also showed differential content depending on the carrot color. Glucose content exhibited the highest variability among the genetic resources, which ranged from 5.8 to 150.2 mg g−1 dw, regardless of root color (Table 5). Orange and purple carrots had a higher percentage of average glucose (>20.0% of total sugar content) than the white and yellow carrots (~15%) (Figure 3). Furthermore, purple and orange carrots showed statistically higher average values compared to yellow and white carrots. Three purple carrots (301847, 301848, and 301849) and two orange carrots (180790 and 261799) possessed relatively higher glucose content (>130.0 mg g−1) than other carrots (Table S2).
Fructose was the least dominant free sugar in almost all of the genetic resources regardless of root color. It ranged from 10.3 to 98.4, 11.9 to 117.6, 5.4 to 76.6, and 7.9 to 72.1 mg g−1 in orange, purple, white, and yellow carrot roots, respectively. The average fructose content was significantly higher in purple carrots, which was followed by orange, yellow and white carrots. Three genetic resources (301847, 301849, and 301848) had relatively higher fructose content (>100.0 mg g−1). The results also identified the lowest fructose content (~11% of the total sugar content) among the white carrots, which was followed by yellow, orange, and purple carrots (Figure 3). Among the four carrot root color, some genetic resources of purple carrot with a higher glucose content also showed higher fructose and lower sucrose content. Total sugar content ranged from 130.7 to 381.0 mg g−1 with an average value of 302.7 mg g−1. Purple carrots had the highest average total free sugar content (321.5 mg g−1), followed by orange (308.7 mg g−1), yellow (274.4 mg g−1), and white carrots (265.4 mg g−1). Nine genetic resources (331126, 325075, 210175, 274037, 274184, 288909, 204087, and 210171) with orange roots and one genetic resource (301847) with purple roots showed relatively higher total sugar content (>355.0 mg g−1) than other genetic resources (Table S2), conferring the higher consumer acceptance of these genetic resources as sugar is the main contributor to increasing palatability [37]. To the best of our knowledge, this is the first report dealing with free sugar composition in a large number of carrot genetic resources, as most of the previous reports were based on only the total soluble sugar content or a smaller number of genotypes [26,54].
The average total sweetness index (TSI) was also significantly higher in purple carrots (333.9), followed by orange (315.9), yellow (281.1), and white carrots (271.2). In contrast, the highest variation was found in white carrots, showing >2-fold differences between the lowest and highest values. It ranged from 132.3 to 388.0, with an average value of 310.1 in the 180 genetic resources. Almost all of the genotypes with higher total sugar content had higher TSI. Therefore, selected genotypes with higher TSI can be considered for breeding programs, as sweetness is one of the important factors that increase palatability and consumer acceptance [56].

3.4. Selection of Nutritionally Valuable Genetic Resources

After the analysis of individual carotenoids, free sugars, and TSI, we found some of genetic resources with relatively higher individual and total carotenoids as well as free sugar content (Table 6), which could be applicable for breeding and research. The selected genotypes with higher carotenoids exhibit health benefits, as different carotenoids have health beneficial properties [7,9,57]. We found higher lutein content in five genetic resources (203368, 276366, 203364, 300048, and 325079) possessing orange root color; however, their contribution to the total carotenoids was small compared to the α- and β-carotene. The genotypes with higher lutein content suggest potential health benefits, as lutein is positively linked with the reduction of light-induced oxidative stress in the eyes as well as with a low risk of age-related macular degeneration and the development of cataracts; itis also responsible for preventing the production of harmful free radicals [7,58]. Furthermore, six genetic resources, namely 100527, 210175, 100541, 301938, 220541, and 210171, showed relatively higher α-carotene (≥60.00 mg 100 g-1) content compared to the other genetic resources. This suggests beneficial health effects associated with these genotypes, as α-carotene is positively related to the reduced risk of prostate and breast cancer [59]. We found higher β-carotene (>50.00 mg 100 g−1) in some of the selected genotypes (331120, 100541, 302276, 283365, and 301947). The presence of higher β-carotene in selected genotypes increases the interest of those genotypes to consumers and researchers, as β-carotene has pro-vitamin activity, which is essential for normal organogenesis, immune functions, tissue differentiation, and antioxidant and anti-inflammatory properties [28,59]. The genotypes with higher α-or β-carotene had relatively higher total carotenoids, which was due to the higher contribution of carotenoids to the total carotenoid content, which can also be seen through the correlation results (Table 7).
Altogether, 18 carrot genetic resources showed relatively higher total carotenoid content (>100 mg 100 g−1), which could be grown under different environmental conditions for the possible use of the candidate genotypes in research and breeding (Table 6).
Based on the individual and total free sugar results, some genetic resources were rich in particular free sugars. As free sugars are responsible for sweetness and increase consumer acceptance by altering the palatability, genetic resources with high sugar content might be useful for breeding purposes [19,26]. Since the overall total sweetness is the sum of the differential contribution of each free sugar [37], genotypes with a high total sweetness index (TSI) could be practically considered for the selection of sweeter genotypes [37]. Ten genotypes (331126, 325075, 210175, 301847, 274037, 100541, 274184, 288909, 204087, and 210171) had relatively higher TSI (>360.0) compared to other genetic resources (Table 6). These genotypes could be used as potential germplasms for breeding programs. Based on the carotenoid and free sugar analysis results, only three genetic resources (210175, 210171, and 100541) with orange root color showed higher total carotenoid content and TSI, suggesting that these genetic resources could be used as promising genetic material in terms of nutritional properties for commercial breeding and research.

3.5. Correlation and Principal Component Analysis (PCA) and Hierarchical Cluster Analysis

Correlation analysis was performed to determine the association between carotenoids, color attributes, free sugar content, and root weight (Table 7). Lutein showed a non-significant correlation with both α- and β-carotene. Alpha-carotene exhibited the highest significantly positive correlation with β-carotene (r = 0.886**) as both of them are synthesized from a common precursor molecule named lycopene by α- and β-lycopene synthase, respectively [6]. Among the color attributes, L and h exhibited a significant negative correlation with all the carotenoids, while lutein showed a non-significant correlation with other color attributes. In contrast, α- and β-carotene contents had positively significant correlations with a, b, and C. Both the α- and β-carotene showed the highest correlation (r = ~0.720**) with redness (a). The highest correlation was found between β-carotene and glucose (r = 0.291**) with carotenoids and free sugars. Among the three free sugars, fructose showed the highest positive correlation with glucose (r = 0.953**), while sucrose exhibited a negative correlation with both fructose and glucose. Total sugar was significantly positively correlated with TSI (data not shown). The results also showed the negative correlation between color attributes and individual free sugars. To elucidate the possible relationship between the color attributes, carotenoids, and sugars, correlation analysis was also performed separately in orange-, yellow-, white-, and purple-colored carrots (Table S3). All the color attributes showed non-significant correlations with free sugars in purple and white carrots, while only sucrose was significantly correlated with only redness (a) in orange and yellow carrots, suggesting that the accumulation of free sugars in carrots is independent of the root color, which was also previously reported by Baranski et al. [26]. Based on the content results and correlation analysis of this study, carotenoid content is highly associated with root color, as previously observed by Jourdan et al. [6]. In contrast, there is not a clear association between root color and free sugar content, which was consistent with the previous reports [26,54].
PCA was performed to determine any connection among the color attributes (outer part of the root), root weight, carotenoids, free sugars, and TSI in the studied genetic resources. We identified the similarities and differences in carotenoid, free sugars, and total sweetness index based on the PCA score chart. PCA showed a clear trend of separation between the groups, indicating significant differences among the genetic resources (Figure 4). PCA revealed the two highest principal components, showing approximately 56.62% of the total variations (Figure 4). The first principal component (PC1) exhibited 37.46% of the total variance, whereas the second principal component (PC2) exhibited 19.16% of the variation. PC1 was associated with most of the parameters, while PC2 was only associated with color attributes (lightness and hue angle). Among the parameters used in PCA, two carotenoids, α- and β-carotene, along with total carotenoid, exhibited the highest variation, which is probably due to the differences in root color, as carotenoids are differentially accumulated in carrots depending on the color of the root [6,54].
Color attributes of the outer part of carrot root, root weight, carotenoids, free sugars, and total sweetness index of 180 genetic resources were used to construct the heat map and two-dimensional hierarchical clustering. The color intensity ranging from blue to red in the given figure represents the range from low to high values of individual parameters, respectively. The results showed two major clusters among the parameters used in this study (Figure S1). Cluster 1 included color parameters, carotenoids, root weight, fructose, and glucose, whereas cluster 2 included sucrose, total sugar, and sweetness index. In cluster 1, the root weight was clearly separated from the other parameters. The results also showed two major clusters among the genetic resources in which the first cluster included only seven genetic resources with almost all the genetic resources having white root color, and the remaining (n = 173) were grouped in the second cluster. In the second cluster, several subgroups were identified as having orange, purple, and yellow carrots. The information obtained through hierarchical clustering might help breeders to discriminate between highly differentiated genetic resources, which can be used for plant breeding programs.

4. Conclusions

The variation in morphological parameters and nutritional properties (carotenoids and free sugars) in this study suggests that the morphology and potential health benefits of carrots are highly dependent on the genotype. Furthermore, the compositions of carotenoids and their contents were highly dependent on the root color when compared to the free sugars and TSI. Variations in the qualitative agronomic characters might be useful for the identification of varieties, while the variation in quantitative agronomic parameters would be of direct interest to plant breeders and researchers. Genetic resources with higher carotenoids and free sugars should be studied in detail as these phytochemicals show health beneficial properties and increase the taste of the carrots, respectively. The results of this study may be applied for the identification and selection of genetic resources for the development of new varieties with enhanced carotenoid and sugar content.

Supplementary Materials

The following supporting information can be downloaded at: https://www.mdpi.com/article/10.3390/agronomy12030553/s1, Table S1: The source details and agronomic parameters of carrot genotypes (n = 180); Table S2: Color parameters, carotenoid content, and free sugar content in carrot genetic resources (n = 180); Table S3: Correlation analysis among the color attributes, carotenoids, free sugars, and total sweetness index (TSI) in orange (n = 142), purple (n = 8), white (n = 16), and yellow carrots (n = 14), and Figure S1: Two-dimensional hierarchical clustering heat map of the color parameters, root weight, carotenoid, free sugars, and total sweetness index (TSI) in 180 carrot genetic resources.

Author Contributions

Conceptualization, J.G.L., J.R. and C.S.C.; methodology, S.R.B. and C.S.C.; formal analysis, S.R.B., Y.K.S., S.-H.K., J.W.S. and J.S.J.; investigation, S.R.B. and C.S.C.; data curation, C.S.C. and S.R.B.; writing—original draft preparation, S.R.B.; writing—review and editing, S.R.B. and J.G.L.; visualization, S.R.B.; supervision, J.G.L.; project administration, Y.K.S.; funding acquisition, J.G.L. and J.R. All authors have read and agreed to the published version of the manuscript.

Funding

This research was funded by the National Institute of Horticultural & Herbal Science, Rural Development Administration, Korea (PJ014255).

Institutional Review Board Statement

Not applicable.

Informed Consent Statement

Not applicable.

Data Availability Statement

Not applicable.

Conflicts of Interest

The authors declare no conflict of interest.

References

  1. FAO (Food and Agriculture Organization). Agricultural Statistical Database for 2019. Available online: http://www.fao.org/faostat/en/#data/QCL (accessed on 29 July 2021).
  2. Ahmad, T.; Cawood, M.; Iqbal, Q.; Arino, A.; Batool, A.; Tariq, R.M.S.; Azam, M.; Akhtar, S. Phytochemicals in Daucus carota and their health benefits-review article. Foods 2019, 8, 424. [Google Scholar] [CrossRef] [PubMed] [Green Version]
  3. Kulczynski, B.; Gramza-Michalowska, A.; Kobus-Cisowska, J.; Kmiecik, D. The role of carotenoids in the prevention and treatment of cardiovascular disease-current state of knowledge. J. Funct. Foods 2017, 38, 45–65. [Google Scholar] [CrossRef]
  4. Smolen, S.; Sady, W. The effect of various nitrogen fertilization and foliar nutrition regimes on the concentrations of sugar, carotenoids and phenolic compounds in carrot (Daucus carota L.). Sci. Hortic. 2009, 120, 315–324. [Google Scholar] [CrossRef]
  5. Soltoft, M.; Bysted, A.; Madsen, K.H.; Mark, A.B.; Bugel, S.G.; Nielsen, J.; Knuthsen, P. Effects of organic and conventional growth systems on the content of carotenoids in carrot roots, and on intake and plasma status of carotenoids in humans. J. Sci. Food Agric. 2011, 91, 767–775. [Google Scholar] [CrossRef]
  6. Jourdan, M.; Gagne, S.; Dubois-Laurent, C.; Maghraoui, M.; Huet, S.; Suel, A.; Hamama, L.; Briard, M.; Peltier, D.; Geoffriau, E. Carotenoid content and root color of cultivated carrot: A candidate-gene association study using an original broad unstructured population. PLoS ONE 2015, 10, e0116674. [Google Scholar] [CrossRef] [Green Version]
  7. Clugston, R.D. Carotenoids and fatty liver disease: Current knowledge and research gaps. BBA-Mol. Cell Biol. Lipids 2020, 1865, 158597. [Google Scholar] [CrossRef] [PubMed]
  8. Eggersdorfer, M.; Wyss, A. Carotenoids in human nutrition and health. Arch. Biochem. Biophys. 2018, 652, 18–26. [Google Scholar] [CrossRef]
  9. Britton, G. Carotenoid research: History and new perspectives for chemistry in biological systems. BBA-Mol. Cell Biol. Lipids 2020, 1865, 158699. [Google Scholar] [CrossRef]
  10. Christensen, K.; Lawler, T. Dietary carotenoids and non-alcoholic fatty liver disease among US adults, NHANES 2003−2014. Nutrients 2019, 11, 1101. [Google Scholar] [CrossRef] [Green Version]
  11. Elvira-Torales, L.I.; García-Alonso, J.; Periago-Castón, M.J. Nutritional importance of carotenoids and their effect on liver health: A review. Antioxidants 2019, 8, 229. [Google Scholar] [CrossRef] [Green Version]
  12. Rowles III, J.L.; Erdman, J.W., Jr. Carotenoids and their role in cancer prevention. BBA-Mol. Cell Biol. Lipids 2020, 1865, 158613. [Google Scholar] [CrossRef] [PubMed]
  13. Yoshida, H.; Yanai, H.; Ito, K.; Tomono, Y.; Koikeda, T.; Tsukahara, H.; Tada, N. Administration of natural astaxanthin increases serum HDL-cholesterol and adiponectin in subjects with mild hyperlipidemia. Atherosclerosis 2010, 209, 520–523. [Google Scholar] [CrossRef] [PubMed]
  14. Milani, A.; Basirnejad, M.; Shahbazi, S.; Bolhassani, A. Carotenoids: Biochemistry, pharmacology and treatment. Br. J. Pharmacol. 2017, 174, 1290–1324. [Google Scholar] [CrossRef] [PubMed] [Green Version]
  15. Johnson, E.J. A possible role for lutein and zeaxanthin in cognitive function in the elderly. Am. J. Clin. Nutr. 2012, 96, 1161S–1165S. [Google Scholar] [CrossRef] [Green Version]
  16. D’Odorico, A.; Martines, D.; Kiechl, S.; Egger, G.; Oberhollenzer, F.; Bonvicini, P.; Sturniolo, G.C.; Naccarato, R.; Willeit, J. High plasma levels of alpha- and beta-carotene are associated with a lower risk of atherosclerosis: Results from the Bruneck study. Atherosclerosis 2000, 153, 231–239. [Google Scholar] [CrossRef]
  17. Auerswald, H.; Schwarz, D.; Kornelson, C.; Krumbein, A.; Bruckner, B. Sensory analysis, sugar and acid content of tomato at different EC values of the nutrient solution. Sci. Hortic. 1999, 82, 227–242. [Google Scholar] [CrossRef]
  18. VandenLangenberg, K.M.; Bethke, P.C.; Nienhuis, J. Patterns of fructose, glucose, and sucrose accumulation in snap and dry bean (Phaseolus vulgaris) pods. HortScience 2012, 47, 874–878. [Google Scholar] [CrossRef]
  19. Li, B.W.; Andrews, K.W.; Pehrsson, P.R. Individual sugars, soluble, and insoluble dietary fiber contents of 70 high consumption foods. J. Food Compos. Anal. 2002, 15, 715–723. [Google Scholar] [CrossRef] [Green Version]
  20. Bonasia, A.; Conversa, G.; Lazzizera, C.; Gambacorta, G.; Elia, A. Morpho-biometrical, nutritional and phytochemical characterization of carrot landraces from Puglia region (Southern Italy). Sustainability 2021, 13, 3940. [Google Scholar] [CrossRef]
  21. Tsukakoshi, Y.; Naito, S.; Ishida, N.; Yasui, A. Variation in moisture, total sugar, and carotene content of Japanese carrots: Use in sample size determination. J. Food Compos. Anal. 2009, 22, 373–380. [Google Scholar] [CrossRef]
  22. Greene, S.L.; Gritsenko, M.; Vandewark, G. Relating morphologic and RAPD marker variation to collecting site environment in wild population of red clover (Trifolium pretense L.). Genet. Resour. Crop Evol. 2004, 51, 643–653. [Google Scholar] [CrossRef]
  23. Luitel, B.P.; Ro, N.-Y.; Ko, H.-C.; Sung, J.-S.; Rhee, J.-H.; Hur, O.-S. Phenotypic variation in a germplasm collection of pepper (Capsicum chinense Jacq.) from Korea. J. Crop Sci. Biotechnol. 2018, 21, 499–506. [Google Scholar] [CrossRef]
  24. Chen, C.; Ma, J.; Ma, J.; Ma, W.; Yang, J. Analysis of main agronomic traits in different varieties of carrots. J. Phys. 2020, 1549, 032053. [Google Scholar] [CrossRef]
  25. Tabor, G.; Yesuf, M.; Haile, M.; Kebede, G.; Tilahun, S. Performance of some Asian carrot (Daucus carota L. spp. sativa Hoffm.) cultivars under Ethiopian conditions: Carrot and seed yields. Sci. Hortic. 2016, 207, 176–182. [Google Scholar] [CrossRef]
  26. Baranski, R.; Allender, C.; Klimek-Chodacka, M. Towards better testing and more nutritious carrots: Carotenoid and sugar content variation in carrot genetic resources. Food Res. Int. 2012, 47, 182–187. [Google Scholar] [CrossRef]
  27. Bolton, A.; Simon, P. Variation for salinity tolerance during seed germination in diverse carrot [Daucus carota (L.)] germplasm. HortScience 2019, 54, 38–44. [Google Scholar] [CrossRef] [Green Version]
  28. Bozalan, N.K.; Karadeniz, F. Carotenoid profile, total phenolic content, and antioxidant activity of carrots. Int. J. Food Prop. 2011, 14, 1060–1068. [Google Scholar] [CrossRef]
  29. Kenny, O.; O’Beirne, D. Antioxidant phytochemicals in fresh-cut carrot disk as affected by peeling method. Postharvest Biol. Technol. 2010, 58, 247–253. [Google Scholar] [CrossRef]
  30. Philippe, D.; Dominique, D.; Sophie, B.-M.; Maxime, D.; Franck, V.; Jacques, D.; Francois, K. Spatial variation of root yield within cultivated carrot fields is strongly impacted by plant spacing. Sci. Hortic. 2018, 241, 29–40. [Google Scholar] [CrossRef]
  31. Que, F.; Hou, X.-L.; Wang, G.-L.; Xu, Z.-S.; Tan, G.-F.; Li, T.; Wang, Y.-H.; Khadr, A.; Xiong, A.-S. Advances in research on the carrot, an important root vegetable in the Apiaceae family. Hortic. Res. 2019, 6, 69. [Google Scholar] [CrossRef] [Green Version]
  32. Rodriguez-Concepcion, M.; Stange, C. Biosynthesis of carotenoids in carrot: An underground story comes to light. Arch. Biochem. Biophys. 2013, 539, 110–116. [Google Scholar] [CrossRef] [PubMed]
  33. Stinco, C.M.; Szczepanska, J.; Marszalek, K.; Pinto, C.A.; Inacio, R.S.; Mapelli-Brahm, P.; Barba, F.J.; Lorenzo, J.M.; Saraiva, J.A.; Melendez-Martinez, A.J. Effect of high-pressure processing on carotenoid profile, color, microbial and enzymatic stability of cloudy carrot juice. Food Chem. 2019, 299, 125112. [Google Scholar] [CrossRef] [PubMed]
  34. Yoo, K.S.; Bang, H.; Pike, L.; Patil, B.S.; Lee, E.J. Comparing carotene, anthocyanins, and terpenoid concentrations in selected carrot lines of different colors. Hortic. Environ. Biotechnol. 2020, 61, 385–393. [Google Scholar] [CrossRef]
  35. Bhandari, S.R.; Lee, J.G. Ripening-dependent changes in antioxidants, color attributes, and antioxidant activities of seven tomato (Solanum lycopersisum L.) cultivars. J. Anal. Method Chem. 2016, 2016, 5498618. [Google Scholar] [CrossRef] [PubMed] [Green Version]
  36. Bhandari, S.R.; Choi, C.S.; Rhee, J.; Jo, J.S.; Shin, Y.K.; Song, J.W.; Lee, J.G. Seasonal variation in agronomic characteristics and sugar content of cabbage genotypes. Chilean J. Agric. Res. 2021, 81, 80–91. [Google Scholar] [CrossRef]
  37. Magwaza, L.S.; Opara, U.L. Analytical methods for determination of sugars and sweetness of horticultural crops- A review. Sci. Hortic. 2015, 184, 179–192. [Google Scholar] [CrossRef]
  38. Cavagnaro, P.F.; Chung, S.-M.; Manin, S.; Yildiz, M.; Ali, A.; Alessandro, M.S.; Iorizzo, M.; Senalik, D.A.; Simon, P.W. Microsatellite isolation and marker development in carrot genomic distribution, linkage mapping, genetic diversity analysis and marker transferability across Apiaceae. BMC Genomics 2011, 12, 386. [Google Scholar] [CrossRef] [PubMed] [Green Version]
  39. Ellison, S.; Senalik, D.; Bostan, H.; Iorizzo, M.; Simon, P. Fine mapping, transcriptome analysis, and marker development for Y2, the gene that conditions b-carotene accumulation in carrot (Daucus carota L.). G3 2017, 7, 2665–2675. [Google Scholar] [CrossRef] [PubMed] [Green Version]
  40. Bannoud, F.; Ellison, S.; Paolinelli, M.; Horejsi, T.; Senalik, D.; Fanzone, M.; Iorizzo, M.; Simon, P.W.; Cavagnaro, P.F. Dissecting the genetic control of root and leaf tissue-specific anthocyanin pigmentation in carrot (Daucus carota L.). Theor. Appl. Genet. 2019, 132, 2485–2507. [Google Scholar] [CrossRef] [PubMed]
  41. Bannoud, F.; Carvajal, S.; Ellison, S.; Senalik, D.; Gomez Talquenca, S.; Iorizzo, M.; Simon, P.W.; Cavagnaro, P.F. Genetic and transcription profile analysis of tissue-specific anthocyanin pigmentation in carrot root phloem. Genes 2021, 12, 1464. [Google Scholar] [CrossRef]
  42. Hooks, T.; Niu, G.; Masabni, J.; Sun, Y.; Ganjegunte, G. Performance and phytochemical content of 22 pomegranate (Punica granatum) varieties. HortScience 2021, 56, 217–225. [Google Scholar] [CrossRef]
  43. Macko-Podgorni, A.; Stelmach, K.; Kwolek, K.; Machaj, G.; Ellison, S.; Senalik, D.A.; Simon, P.W.; Grezebelus, D. Mining for candidate genes controlling secondary growth of the carrot storage root. Int. J. Mol. Sci. 2020, 21, 4263. [Google Scholar] [CrossRef]
  44. Turner, S.D.; Ellison, S.L.; Senalik, D.A.; Simon, P.W.; Spalding, E.P.; Miller, N.D. An automated image analysis pipeline enables genetic studies of shoot and root morphology in carrot (Daucus carota L.). Front. Plant Sci. 2018, 9, 1703. [Google Scholar] [CrossRef] [PubMed] [Green Version]
  45. Pathare, P.B.; Opara, U.L.; Al-Said, F.A.J. Colour measurement and analysis in fresh and processed foods: A review. Food Bioprocess Technol. 2013, 6, 36–60. [Google Scholar] [CrossRef]
  46. Nisha, P.; Singhal, R.S.; Pandit, A.B. Kinetic modelling of colour degradation in tomato puree (Lycopersicon esculentum L.). Food Bioprocess Technol. 2011, 4, 781–787. [Google Scholar] [CrossRef]
  47. Ma, J.; Xu, Z.; Tan, G.; Wang, F.; Xiong, A. Distinct transcription profile of genes involved in carotenoid biosynthesis among six different color carrot (Daucus carota L.) cultivars. Acta Biochim. Biophys. Sin. 2017, 49, 817–826. [Google Scholar] [CrossRef] [Green Version]
  48. Arscott, S.A.; Tanumihardjo, S.A. Carrots of many colors provide basic nutrition and bioavailable phtyochemicals acting as a functional food. Compr. Rev. Food Sci. Food Saf. 2010, 9, 223–239. [Google Scholar] [CrossRef]
  49. Perrin, F.; Hartmann, L.; Dubois-Laurent, C.; Welsch, R.; Huet, S.; Hamama, L.; Briard, M.; Peltier, D.; Gange, S.; Geoffriau, E. Carotenoid gene expression explains the difference of carotenoid accumulation in carrot root tissues. Planta 2017, 245, 737–747. [Google Scholar] [CrossRef] [Green Version]
  50. Iorizzo, M.; Ellison, S.; Senalik, D.; Zeng, P.; Satapoomin, P.; Huang, J.; Bowman, M.; Iovene, M.; Sanseverino, W.; Cavagnaro, P.; et al. A high-quality carrot genome assembly provides new insights into carotenoid accumulation and asterid genome evolution. Nat. Genet. 2016, 48, 657–666. [Google Scholar] [CrossRef] [Green Version]
  51. Singh, D.P.; Beloy, J.; McInerney, J.K.; Day, L. Impact of boron, calcium and genetic factors on vitamin C, carotenoids, phenolic acids, anthocyanins and antioxidant capacity of carrot (Daucus carota). Food Chem. 2012, 132, 1161–1170. [Google Scholar] [CrossRef]
  52. Bufler, G. Accumulation and degradation of starch in carrot roots. Sci. Hortic. 2013, 150, 251–258. [Google Scholar] [CrossRef]
  53. Clausen, M.R.; Edelenbos, M.; Bertram, H.C. Mapping the variation of the carrot metabolome using 1H NMR spectroscopy and consensus PCA. J. Agric. Food Chem. 2014, 62, 4392–4398. [Google Scholar] [CrossRef] [PubMed]
  54. Benamor, J.; Mezghani, N.; Periago, M.J.; Navarro-Gonzalez, I.; Elvira-Torales, L.I.; Mezghani, N.; Ouakrim, Y.; Tarchoun, N. Variations in the sugars and antioxidant compounds related to root color in Tunisian carrot (Daucus carota subsp. sativus) landraces. Ital. J. Food Sci. 2020, 32, 654–673. [Google Scholar]
  55. Yusuf, E.; Tkacz, K.; Turkiewics, I.P.; Wojdylo, A.; Nowicka, P. Analysis of chemical compounds’ content in different varieties of carrots, including qualification and quantification of sugars, organic acids, minerals, and bioactive compounds by UPLC. Eur. Food Res. Technol. 2021, 247, 3053–3062. [Google Scholar] [CrossRef]
  56. Nookaraju, A.; Upadhyaya, C.P.; Pandey, S.K.; Young, K.E.; Hong, S.J.; Park, S.K.; Park, S.W. Molecular approaches for enhancing sweetness in fruits and vegetables. Sci. Hortic. 2010, 127, 1–15. [Google Scholar] [CrossRef]
  57. Bernstein, P.S.; Li, B.; Vachali, P.P.; Gorusupudi, A.; Shyam, R.; Henriksen, B.S.; Nolan, J.M. Lutein, zeaxanthin, and meso-zeaxanthin: The basic and clinical science underlying carotenoid-based nutritional interventions against ocular disease. Prog. Retin. Eye Res. 2016, 50, 34–66. [Google Scholar] [CrossRef] [Green Version]
  58. Wang, Y.L.; Cui, R.; Xiao, Y.Y.; Fang, J.M.; Xu, Q. Effect of carotene and lycopene on the risk of prostate cancer: A systematic review and dose-response meta-analysis of observational studies. PLoS ONE 2015, 10, e0137427. [Google Scholar] [CrossRef]
  59. Sommer, A.; Vyas, K.S. A global clinical view on vitamin A and carotenoids. Am. J. Clin. Nutr. 2012, 96, 1204S–1206S. [Google Scholar] [CrossRef] [Green Version]
Figure 1. Changes in air temperature and air humidity (A), and cumulative radiation and rainfall (B) of the experimental field during the cultivation period. Horizontal dotted lines represent average values.
Agronomy 12 00553 g001
Figure 2. Individual carotenoid content (%) in orange, white, yellow, and purple carrot genetic resources.
Agronomy 12 00553 g002
Figure 3. Individual free sugar content (%) in orange, white, yellow and purple colored carrot genetic resources.
Agronomy 12 00553 g003
Figure 4. Principal component analysis (PCA) of color attributes, root weight, carotenoids (lutein, α-carotene, and β-carotene), free sugars (glucose, fructose, and sucrose), and total sweetness index (TSI) in carrot root (n = 180). The lines starting from the center point of the bi-plot show the positive or negative associations of the parameters.
Agronomy 12 00553 g004
Table 1. Frequency distribution of 15 qualitative parameters in 180 carrot genetic resources.
ParametersClassificationFrequencyPercentage (%)
Leaf PostureStanding upright7340.6
Standing slightly10658.9
Lying down10.6
Leaf colorDark green2011.1
Green10960.6
Non-green5128.3
FloweringWeak168.9
Medium3720.6
Strong12770.6
The leaf emerging areaNarrow5128.3
Medium8346.1
Wide4625.6
Petiole anthocyanin coloringNo12167.2
Yes5932.8
Shoulder shapeFlat5329.4
Flat-round8647.8
Round179.4
Round-flat2011.1
Sharp42.2
Tip shapeBlunt7340.6
Little sharp7441.1
Sharp3318.3
External color (Internal color)White16 (16)8.9 (8.9)
Yellow14 (18)7.8 (10.0)
Orange142 (146)78.9 (81.1)
Purple8 (0)4.4 (0.0)
Carrot shape (lengthwise)Doran type1810.0
Middle inverted triangle (1)5731.7
Narrow inverted triangle (2)5530.6
Middle of 1 and 24223.3
Narrow long ellipse84.4
Muscle skin condition (Surface curvature)None4223.3
Weak4927.2
Moderate5329.4
Severe168.9
Very severe2011.1
Curvature depthMissing or very small9150.6
Small4525.0
Middle3117.2
Many137.2
Shoulder epidermis anthocyanin pigmentationNo 10860.0
Yes7240.0
Green area in the shoulder epidermisNone7139.4
Small7843.3
Middle2815.6
Many31.7
Intensity of the outer color of the muscleLight5329.4
Medium10156.1
Dark green2614.4
Table 2. Variation in quantitative traits in carrot genetic resources (n = 180).
ParameterDescriptiveRoot ColorOverall
Orange
(n = 142)
Purple
(n = 8)
White
(n = 16)
Yellow
(n = 14)
Leaf Length (cm)Range30.0–76.065.0–112.042.0–70.040.0–94.030.0–112.0
Average53.3 a86.8 c57.3 ab63.0 b55.9
RootWeight (g)Range24.2–223.063.2–223.122.6–128.843.3–133.922.6–223.1
Average107.2 a140.0 b77.4 a88.7 a104.6
Length (cm)Range8.1–22.59.1–21.5 9.2–17.510.1–18.78.1–22.5
Average14.3 a13.0 a13.89 a13.64 a14.2
Diameter (cm)Range2.0–5.73.5–7.71.8–5.52.90–4.971.8–7.7
Average3.9 a5.5 b3.6 a3.84 a4.0
Average value followed by different letters within a row were significantly different in Duncan’s multiple range test at p < 0.05.
Table 3. Variation in outer and inner color of the carrot root (n = 180).
ParameterDescriptiveRoot Color
Orange (n = 142)Purple (n = 8)White (n = 16)Yellow (n = 14)
LRange44.5(45.1)–59.1(70.0)26.3(60.6)–50.9(71.1)52.3(50.7)–68.6(78.3)55.9(61.2)–80.5(72.8)
Average52.8 B(53.4 a)40.6 A(65.4 b)63.2 C(68.7 b)62.4 C(67.0 b)
aRange13.4(0.6)–61.1(38.0)13.2(0.7)–24.2(6.5)2.3(0.6)–7.4(32.1)1.5(0.5)–8.9(6.4)
Average25.0 C(25.3 b)18.5 B(2.8 a)5.4 A(3.5 a)5.3 A(2.1 a)
bRange29.6(35.0)–44.6(64.0) 2.6(43.4)–32.5(54.7)25.0(26.3)–42.2(52.2)33.7(42.2)–44.4(65.8)
Average36.9 B(48.0 b)14.7 A(47.9 b)35.5 B(38.4 a)40.3 C(54.7 c)
CRange37.1(36.2)–53.7(65.6)18.8(43.9)–35.6(54.1)25.1(26.4)–42.6(52.3)34.1(42.3)–44.8(65.8)
Average44.6 D(54.2 c)25.5 A(48.1 b)36.3 B(38.7 a)40.8 C(54.9 c)
hRange48.9(54.7)–69.0(89.6)6.0(49.1)–64.4(89.2)77.5(84.2)–85.8(90.8)66.4(83.0)–88.2(90.4)
Average56.4 B(62.7 a)38.6 A(81.7 b)81.5 C(87.3 c)81.2 C(87.9 c)
Values in brackets are the respective color attributes in the inner part of the carrot root. Average values followed by different capital and small letters within a row were significantly different using Duncan’s multiple range test at p < 0.05 in the outer and inner part of the carrot root, respectively.
Table 4. Variation in carotenoids in carrot genetic resources (n = 180).
Carotenoid (mg 100 g−1)DescriptiveRoot ColorOverall
(n = 180)
Orange (n = 142)Purple (n = 8)White (n = 16)Yellow (n = 14)
LuteinRange4.87–23.4812.10–17.650.91–12.794.31–23.470.91–23.48
Average11.82 b14.81 c4.95 a13.04 bc11.44
α-caroteneRange12.40–73.320.00–8.930.00–1.130.00–0.980.00–73.23
Average35.75 b2.40 a0.13 a0.07 a28.33
β-caroteneRange12.65–71.100.30–12.080.00–0.000.11–1.790.00–71.10
Average33.35 b3.56 a0.00 a0.88 a26.54
Total carotenoidRange42.29–142.4212.41–38.220.91–13.185.00–25.260.91–142.42
Average80.93 c20.77 b5.09 a13.99 ab66.31
Average values followed by different letters within a row were significantly different in Duncan’s multiple range test at p < 0.05.
Table 5. Variation in free sugars and total sweetness index (TSI) in carrot genetic resources (n = 180).
ParameterDescriptiveRoot ColorOverall
(n = 180)
Orange (n = 142)Purple (n = 8)White (n = 16)Yellow (n = 14)
Fructose (mg g−1)Range10.3–98.411.91–117.615.4–76.67.9–72.15.4–117.6
Average47.7 b64.6 c31.2 a34.6 ab46.0
Glucose
(mg g−1)
Range13.4–144.914.92–150.255.8–112.210.6–97.05.8–150.2
Average69.2 b82.9 b40.9 a44.1 a65.4
Sucrose
(mg g−1)
Range65.6–284.584.4–259.474.6–303.2115.0–244.265.6–303.2
Average191.7 a174.0 a193.3 a195.8 a191.4
Total sugar (mg g−1)Range201.0–381.0259.8–356.7130.7–333.7159.5–332.0130.7–381.0
Average308.7 b321.5 b265.4 a274.4 a302.7
TSIRange206.0–388.0262.2–379.4132.3–345.9164.4–344.8132.3–388.0
Average315.9 b333.9 b271.2 a281.1 a310.1
Average values followed by different letters within a row were significantly different in Duncan’s multiple range test at p < 0.05.
Table 6. Selected carrot genetic resources with higher carotenoids, free sugar, and total sweetness index (TSI).
S.N. IT No.NameCarotenoid Content (mg 100 g−1)Free Sugar Content (mg g−1) TSI
Luα-Cβ-CTotalFruGluSucTotal
1100527Yeoleum 5 Chon12.7 ± 0.660.3 ± 7.444.8 ± 4.3117.7 ± 11.551.3 ± 6.261.4 ± 5.6221.5 ± 5.5334.2 ± 6.9345.1 ± 8.6
2100541Yangchun 5 Chun8.2 ± 1.269.7 ± 4.255.8 ± 6.0133.8 ± 8.651.4 ± 1.271.0 ± 5.3243.6 ± 7.4366.0 ± 6.7374.6 ± 6.1
3200315NPL-KIK-1996-507111.6 ± 0.749.6 ± 2.743.5 ± 1.7104.7 ± 1.611.7 ± 1.418.4 ± 2.7232.1 ± 6.2262.2 ± 5.8263.6 ± 6.2
4203364Local-Bukhara21.6 ± 1.512.4 ± 0.918.3 ± 1.052.2 ± 3.435.0 ± 0.652.1 ± 5.0114.0 ± 9.2201.0 ± 14.3206.0 ± 13.3
5203368Mirzoi Krasnaya23.5 ± 0.815.5 ± 0.921.4 ± 3.160.4 ± 4.536.5 ± 3.258.8 ± 4.4166.2 ± 14.7261.5 ± 19.5265.6 ± 18.9
6204087A130-1-8-1167.5 ± 1.446.7 ± 3.134.1 ± 4.488.4 ± 5.043.9 ± 5.358.2 ± 13.0253.1 ± 7.4355.2 ± 11.0363.2 ± 10.7
7204229Gonsenheimer Treib11.9 ± 0.455.0 ± 5.347.4 ± 0.7114.3 ± 4.874.9 ± 1.589.4 ± 5.5140.8 ± 1.4305.1 ± 7.4321.1 ± 7.0
8210170Inari 5 Sun12.4 ± 1.351.7 ± 3.741.7 ± 2.0105.9 ± 4.059.5 ± 3.7101.1 ± 16.5192.1 ± 10.7352.7 ± 8.9358.1 ± 6.5
9210171Koushin 5 Sun10.0 ± 1.660.0 ± 1.033.7 ± 2.9104.7 ± 3.868.8 ± 2.5102.7 ± 7.8179.0 ± 10.9350.4 ± 0.9360.2 ± 1.3
10210175Youmei 5 Sun8.6 ± 1.573.3 ± 4.145.1 ± 0.4127.1 ± 3.166.0 ± 11.287.7 ± 21.2221.3 ± 27.5375.0 ± 19.1386.9 ± 19.7
11220541NPL-GYS-2004-147.1 ± 0.660.5 ± 4.539.8 ± 2.3107.3 ± 3.930.0 ± 6.046.8 ± 10.4236.9 ± 7.9313.7 ± 17.5317.5 ± 17.9
12261793Moskovskaya
Zimnaya A-515
9.2 ± 0.953.1 ± 1.644.2 ± 3.3106.5 ± 4.964.5 ± 6.292.5 ± 10.2183.7 ± 17.5340.7 ± 4.2350.8 ± 5.3
13274037WIR231318.6 ± 2.228.8 ± 1.231.9 ± 2.979.3 ± 2.840.4 ± 3.568.0 ± 7.4262.7 ± 13.5371.1 ± 6.9374.9 ± 8.4
14274184UZB-KJG-2006-6114.5 ± 0.516.4 ± 0.813.9 ± 1.444.9 ± 2.436.0 ± 8.447.0 ± 1.9284.5 ± 14.3367.5 ± 4.7374.2 ± 2.3
15276366Shantane22.5 ± 0.313.8 ± 1.512.7 ± 2.349.0 ± 3.017.8 ± 2.420.6 ± 2.1239.2 ± 1.6277.6 ± 4.9281.6 ± 5.8
16283365Zavyalovskaya Mestnaya14.3 ± 2.246.2 ± 3.750.7 ± 3.5111.3 ± 6.727.9 ± 2.448.9 ± 4.3266.7 ± 10.0343.5 ± 5.2345.7 ± 4.9
17288816NIIOKH 33616.7 ± 0.952.2 ± 3.248.8 ± 2.8117.6 ± 5.956.1 ± 5.378.7 ± 2.5173.1 ± 12.2307.9 ± 18.2317.0 ± 20.7
18288869Corozon De Buey14.7 ± 1.249.4 ± 1.046.5 ± 2.7110.7 ± 3.345.0 ± 1.959.8 ± 4.3180.2 ± 4.5285.0 ± 1.5293.1 ± 3.3
19288909Nantskaya10.8 ± 1.134.7 ± 2.740.4 ± 0.685.9 ± 2.356.3 ± 4.090.3 ± 8.0211.0 ± 13.3357.6 ± 13.8364.1 ± 11.0
20300048Mirzoi krasniy20.4 ± 3.120.5 ± 2.326.2 ± 3.167.0 ± 3.521.9 ± 2.233.6 ± 2.9208.4 ± 12.2263.8 ± 17.1266.8 ± 17.5
21301847PI 28845917.2 ± 0.88.9 ± 1.512.1 ± 2.238.2 ± 3.5117.6 ± 8.5150.2 ± 20.888.8 ± 18.7356.7 ± 11.2379.4 ± 9.7
22301938Kuroda8.2 ± 0.868.4 ± 2.643.3 ± 2.5119.9 ± 5.739.4 ± 4.269.6 ± 16.5226.7 ± 20.6335.8 ± 4.2338.8 ± 6.4
23301947Piliwsky Zbior13.4 ± 1.045.6 ± 0.950.2 ± 4.4109.2 ± 4.983.4 ± 10.3111.5 ± 10.1149.7 ± 12.3344.6 ± 7.9359.6 ± 10.2
24302276Local Nevinnomysskaya15.5 ± 0.559.5 ± 3.151.2 ± 4.2126.2 ± 7.540.8 ± 7.457.5 ± 9.1189.3 ± 11.1287.6 ± 5.1294.2 ± 6.8
25325075PI 34120810.4 ± 0.735.0 ± 4.735.3 ± 1.180.6 ± 5.581.4 ± 7.3126.0 ± 4.8169.6 ± 7.5377.0 ± 3.6387.5 ± 6.6
26325079PI 50234719.3 ± 1.435.4 ± 2.430.9 ± 2.085.6 ± 2.835.0 ± 3.763.4 ± 5.0180.8 ± 10.2279.2 ± 7.9281.4 ± 7.7
27325093PI 65221611.6 ± 0.558.2 ± 5.036.2 ± 1.5106.0 ± 3.742.6 ± 2.545.4 ± 3.6252.3 ± 9.5340.4 ± 12.1350.8 ± 11.2
28331120PI 51599614.5 ± 0.956.8 ± 2.571.1 ± 3.1142.4 ± 3.931.9 ± 3.854.6 ± 6.6214.1 ± 9.3300.5 ± 12.8303.4 ± 12.8
29331126Pien Kan Hung6.3 ± 1.050.1 ± 1.538.7 ± 2.895.1 ± 3.353.0 ± 6.981.2 ± 2.6246.8 ± 15.4381.0 ± 9.3388.0 ± 5.6
30910240Fertodi Voros9.1 ± 0.357.6 ± 2.648.6 ± 2.9115.3 ± 1.115.3 ± 1.020.3 ± 2.0242.5 ± 6.4278.1 ± 8.0280.9 ± 7.6
Lu: lutein; α-C: α-carotene; β-C: β-carotene; Fru: fructose; Glu: glucose; Suc: sucrose. Each value is the mean ± SD of three biological replicates.
Table 7. Correlation analysis among the color attributes, carotenoids, and free sugars in carrots (n = 180).
ParameterabChLuteinα-Caroteneβ-CaroteneT CarotenoidFructoseGlucoseSucrose
L−0.578 **0.506 **0.0690.853 **−0.211 **−0.354 **−0.348 **−0.384 **−0.198 **−0.209 **−0.086
a 0.0490.504 **−0.734 **0.1170.723 **0.722 **0.750 **0.190 *0.245 **0.091
b 0.802 **0.484 **−0.0170.223 **0.232 **0.229 **−0.156 *−0.1260.099
C −0.0460.0640.598 **0.592 **0.614 **−0.020.0290.131
h −0.193 **−0.543 **−0.545 **−0.578 **−0.234 **−0.278 **−0.034
Lutein −0.0460.1080.153 *0.0710.069−0.06
α-carotene 0.886 **0.958 **0.168 *0.233 **0.116
β-carotene 0.969 **0.203 **0.291 **0.023
T carotenoid 0.197 **0.273 **0.067
Fructose 0.953 **−0.682 **
Glucose −0.660 **
* and ** indicate significance at p < 0.05 and p < 0.01, respectively. T: total.
Publisher’s Note: MDPI stays neutral with regard to jurisdictional claims in published maps and institutional affiliations.

