Article

Effects of Short-Term Tillage Managements on CH4 and N2O Emissions from a Double-Cropping Rice Field in Southern of China

Farming Ecology Department, Hunan Soil and Fertilizer Institute, Changsha 410125, China
*
Author to whom correspondence should be addressed.
Agronomy 2022, 12(2), 517; https://doi.org/10.3390/agronomy12020517
Submission received: 9 January 2022 / Revised: 28 January 2022 / Accepted: 14 February 2022 / Published: 18 February 2022
(This article belongs to the Special Issue In Memory of Professor Longping Yuan, the Father of Hybrid Rice)

Abstract

:
Soil carbon (C) content plays an important role in maintaining or increasing soil quality and soil fertility. However, the impacts of different tillage and crop residue incorporation managements on greenhouse gas (GHG) emissions from paddy fields under the double-cropping rice (Oryza sativa L.) system in southern China still need further study. Therefore, a field experiment was conducted to determine the impacts of different short-term (5-years) tillage and crop residue incorporation managements on soil organic carbon (SOC) content, SOC stock, and GHG emissions from paddy fields under the double-cropping rice system in southern China. The field experiment included four tillage treatments: rotary tillage with all crop residues removed as a control (RTO), conventional tillage with crop residue incorporation (CT), rotary tillage with crop residue incorporation (RT), and no-tillage with crop residue retention (NT). These results indicated that SOC stock in paddy fields with CT, RT, and NT treatments increased by 4.64, 3.60, 3.50 Mg ha−1 and 4.68, 4.21, and 4.04 Mg ha−1 in 2019 and 2020, respectively, compared with RTO treatment. The results showed that early rice and late rice yield with CT treatment increased by 7.22% and 19.99% in 2019 and 6.19% and 6.40% in 2020, respectively, compared with RTO treatment. A two-year (2019–2020) investigation of GHG results indicated that methane emissions from paddy fields with NT treatment were decreased, but nitrous oxide emissions from paddy fields were increased. The lowest mean global warming potential (GWP) and per yield GWP carbon dioxide were found with NT treatment, compared to RT and CT treatments. Therefore, it was a beneficial practice for maintaining SOC stock and decreasing GHG mitigation under the double-cropping rice system in southern China by applying no-tillage with crop residue retention management.

1. Introduction

Soil organic carbon (SOC) content plays an important role in cycling carbon (C) in terrestrial ecosystems and maintaining methane (CH4) and nitrous oxide (N2O) emissions from agricultural soil [1]. In a previous study, these results demonstrated that soil quality and soil fertility were mainly affected by SOC content, as higher SOC content represents a significant contribution to reducing C emission through C sequestration and greenhouse gas (GHG) emissions from agricultural soil [2]. Therefore, it was a beneficial strategy for increasing soil productivity and SOC content by reducing CH4 and N2O emissions from agricultural soil.
Some results indicated that SOC content and its stock were sensitive to changes with field management practices, including crop system, tillage, crop residue, and fertilizer regime [3,4]. It has been confirmed that SOC content and its stock were increased by the combined application of tillage with crop residue incorporation management under long-term field experiment conditions. Smith et al. [5] found that SOC stock with no-tillage (NT) treatment was higher than that of the other tillage treatments. Some results indicated that SOC content at the 0–30 cm soil layer with conventional tillage (CT) and NT treatments increased, while C storage (0–5 cm) at the surface layer with NT treatment increased [6,7,8]. However, Chen et al. [9] indicated that SOC stock at the 0–20 cm soil layer was not significantly impacted by tillage and crop residue management. However, the impacts of different short-term tillage treatments on SOC content and its stock in paddy fields still need further study, including NT, CT, RT, and crop residue return to paddy fields.
GHG emissions from agricultural soil mainly included CH4, N2O, and carbon dioxide (CO2). Some results demonstrated that CH4 and N2O emissions from paddy fields were obviously changed under different tillage and crop residue return conditions [9,10]. NT was a beneficial practice in increasing SOC stock and reducing GHG emissions from paddy fields [5]. Soil C sequestration and crop yield were improved under the incorporation of crop residue conditions [11]. However, some studies indicated that the benefits of increasing SOC stock and reducing GHG emissions from paddy fields were limited with the application of no-tillage and crop residue practices. Dendooven et al. [12] showed that SOC stock and GHG emissions were not obviously changed under tillage with crop residue incorporation conditions. Furthermore, some results indicated that N2O emission from paddy fields with CT treatment was lower than that of NT treatment with crop residue incorporation [10,13]. Tang et al. [14] showed that rice yield was decreased with NT practice, compared with CT and RT practices. Global warming potential (GWP) was generally considered a vital indicator for the effects of GHG emissions, with the GWP of CO2 defined as 1. There was a close relationship between decreasing GWP emissions and enhancing rice yield in paddy ecosystems [15]; some results suggested that GWP of GHG from paddy fields was obviously promoted by tillage with crop residue incorporation management [10,12].
Double-cropping rice (Oryza sativa L.) planting systems (early rice and late rice) are mainly cropping systems in southern China [16]. It is generally believed that tillage (CT, RT, and NT) and crop residue practices play an important role in maintaining or increasing soil quality and soil fertility in paddy fields. In our previous study, the results showed that soil properties were obviously influenced by the combined application of short-term tillage with crop residue management, including soil pH, soil bulk density, and soil microbes, which in return influence SOC content and rice yield [17]. However, related information about the effects of different tillage with crop residue incorporation treatments on SOC stock and GHG emissions from the double-cropping rice field in southern China needed further study. Therefore, a field experiment including different tillage with crop residue incorporation treatments was set up in southern China. The object of this study was: (1) to explore the impacts of different short-term tillage managements on SOC content and SOC stock under a double-cropping rice system; and (2) to measure the characteristics of CH4 and N2O emissions from paddy fields, per yield GWP with different tillage managements in southern China.

2. Materials and Methods

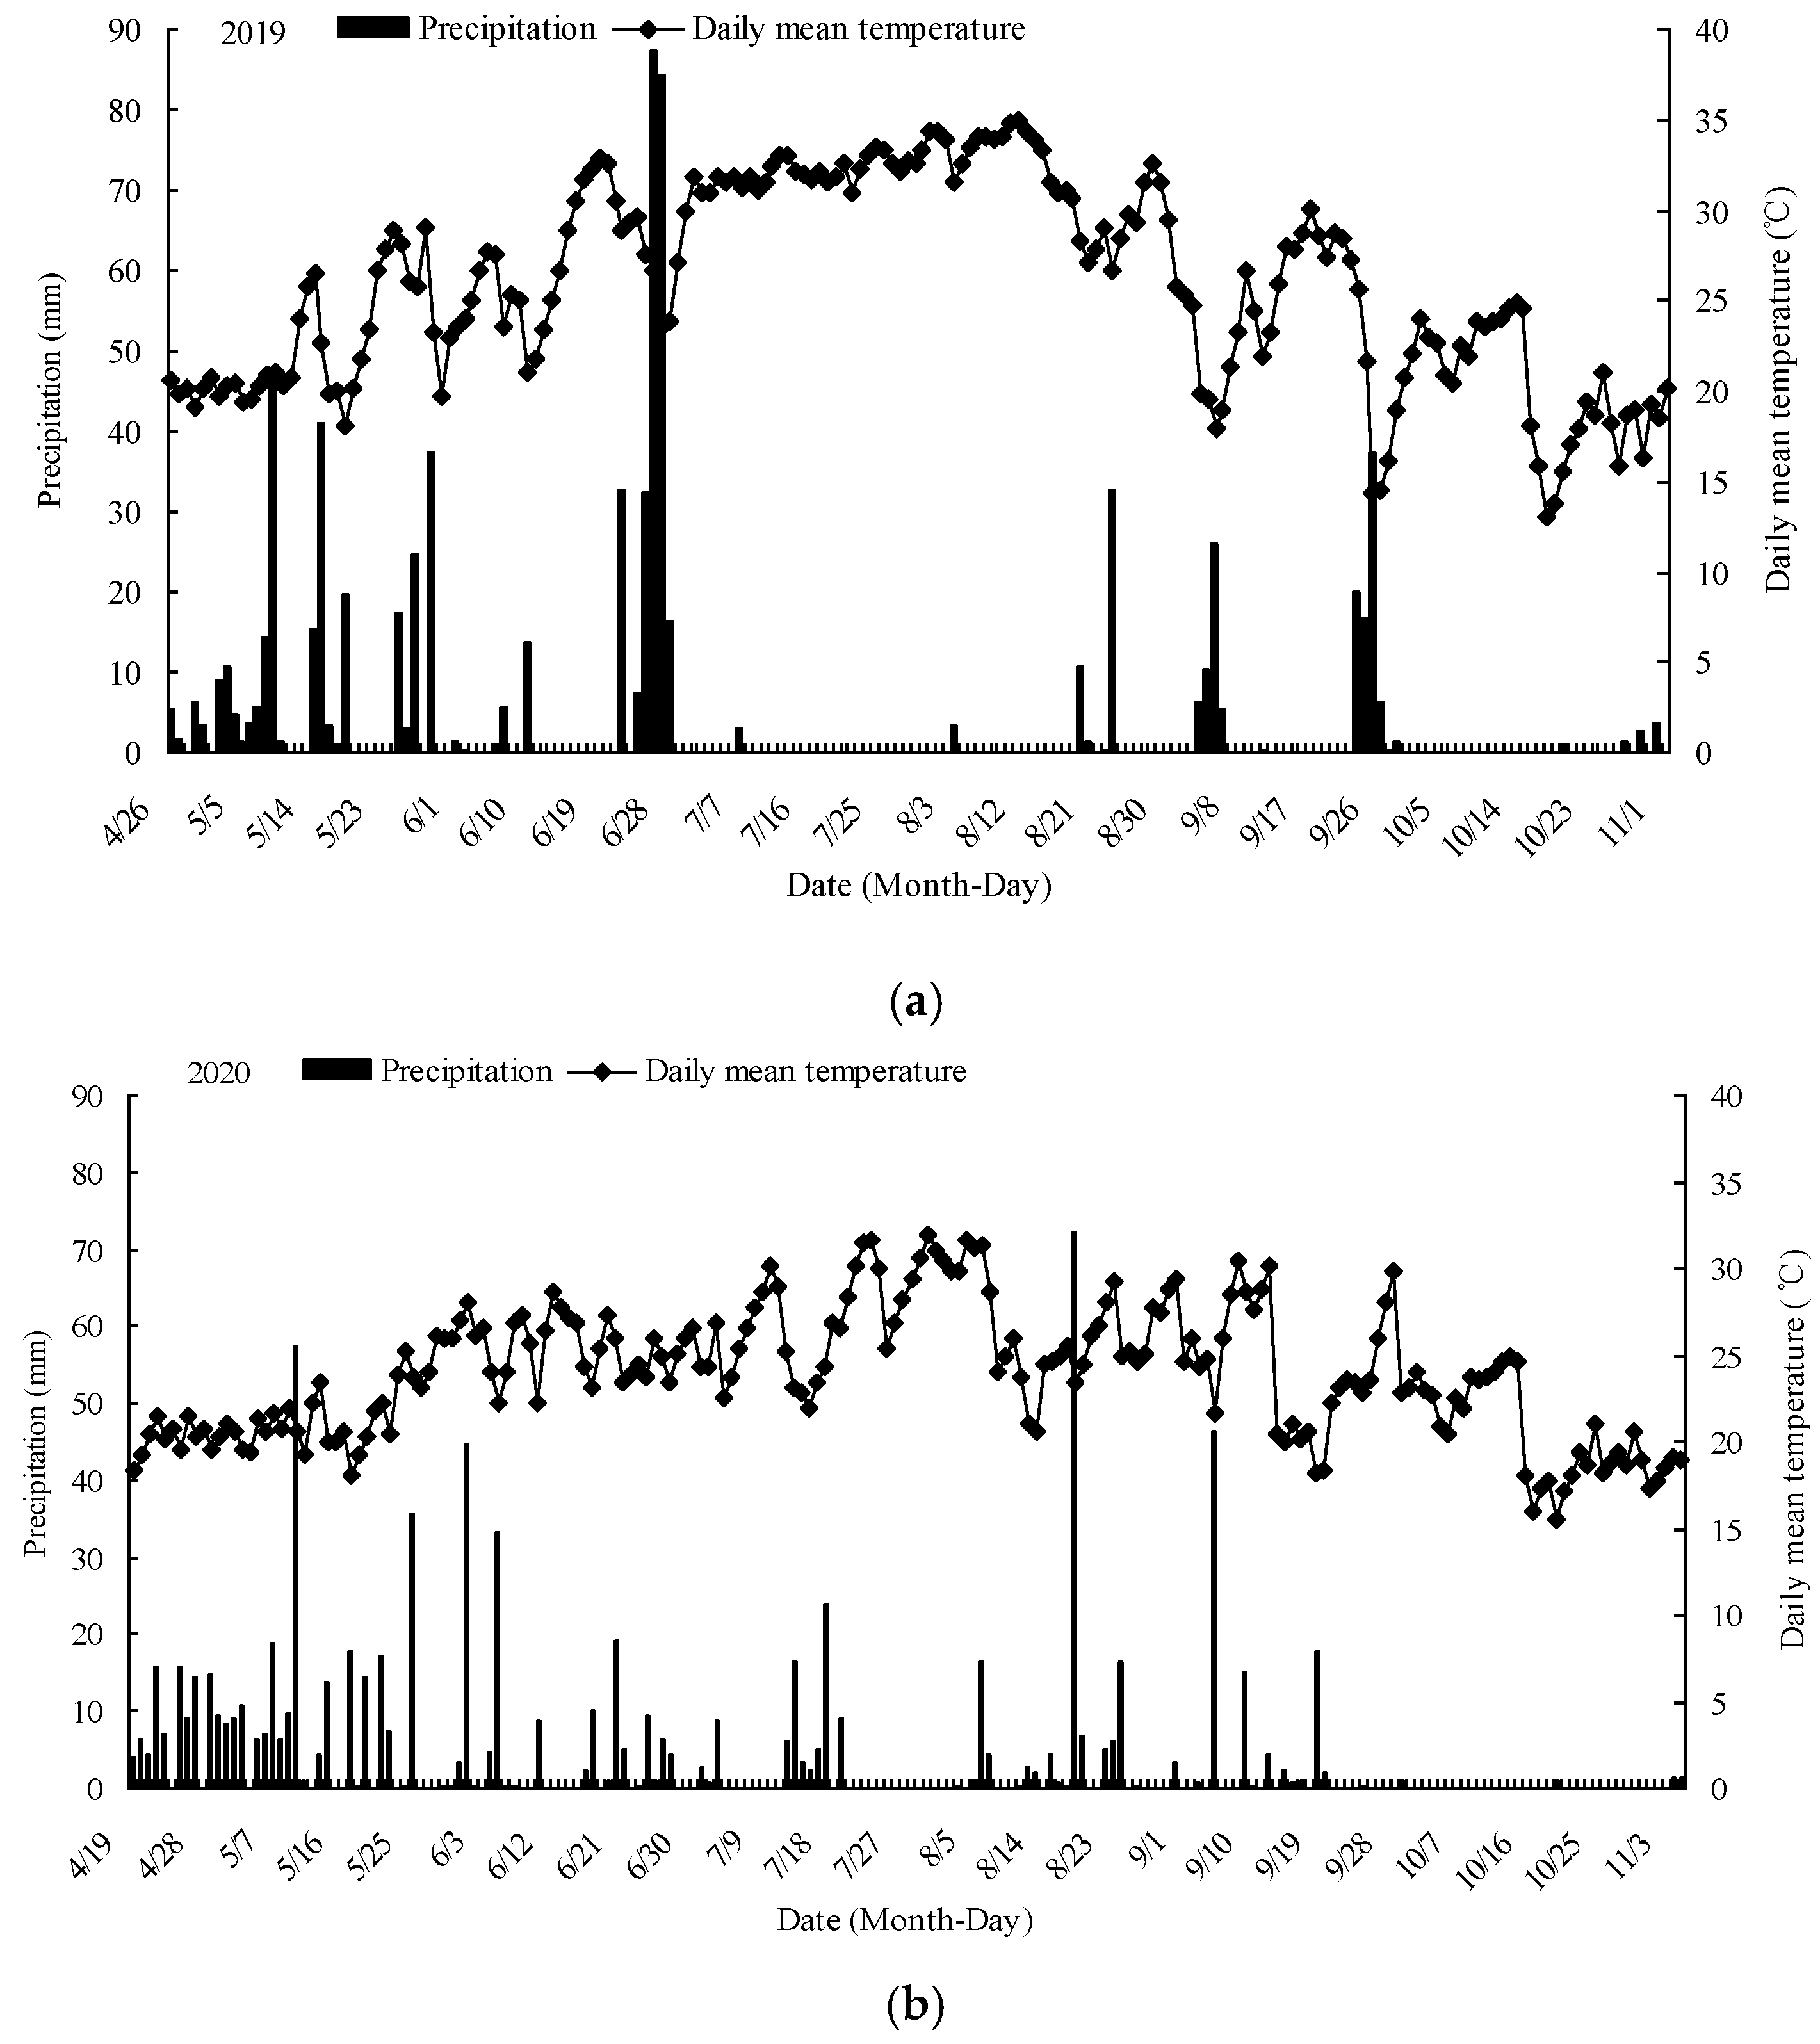
2.1. Sites and Cropping System

This field experiment was located in Ningxiang City (28°07′ N, 112°18′ E) of Hunan Province, China, and began in November 2015. The cropping system of the field experiment was Chinese milk vetch (Astragalus sinicus L.), early rice, and late rice (Oryza sativa L.). The daily precipitation and daily mean temperature of the paddy field during the experimental period are shown in Figure 1. The type of soil in the paddy field was Stagnic Anthrosols, and it was developed from Quaternary red earth. Soil physicochemical characteristics at plough layer (0–20 cm) before this field experiment were as follows: total nitrogen (N) 2.14 g kg−1, available N 192.20 mg kg−1, total phosphorous (P) 0.82 g kg−1, available P 13.49 mg kg−1, total potassium (K) 13.21 g kg−1, available K 81.91 mg kg−1, soil organic carbon (SOC) 22.07 g kg−1.

2.2. Experimental Design

This field experiment included four tillage treatments: rotary tillage with all crop residues removed as a control (RTO), conventional tillage with crop residue incorporation (CT), rotary tillage with crop residue incorporation (RT), and no-tillage with crop residue retention (NT). Each tillage treatment was laid out in a random complete block design with three repeats. The other more detail related information about cropping system, tillage management, applied with total number of Chinese milk vetch and rice straw, inorganic fertilizer, dates of transplanting and harvesting of rice were described according to Tang et al. [17].

2.3. Soil Sample and Greenhouse Gas Collection

The field experiments were conducted by combined application of tillage with crop residue incorporation management from 2015 to 2019. Soil samples were collected from paddy fields at maturity stages of late rice in November 2019 and 2020. Six soil cores were collected from the paddy field in the form of a composite soil sample, and three repeats were collected from each tillage treatment at the time of soil sample collection. Organic material, small stone, and rice roots were removed from the soil, and soil samples were air dried and sieved through a 0.15 mm mesh to investigate the SOC content [18].
N2O and CH4 gas samples were collected using the static chamber technique at 09:00–11:00 during the early rice and late rice whole growth periods. N2O and CH4 gas samples were collected weekly after early or late rice seedling transplant to paddy fields, respectively. More detailed information about greenhouse gas sample collection can be found in Zhang et al. [10].

2.4. Laboratory Analysis

2.4.1. Soil Bulk Density

Soil bulk density (BD) at 0–20 cm of paddy field were conducted at maturity stages of late rice in November 2019 and 2020. The soil BD of the paddy field was investigated using metallic cores of a known volume, and the investigation of soil BD was performed according to the method described by Blake and Hartge [19].

2.4.2. SOC and SOC Stock

The SOC content of each soil sample was investigated using the rapid titration method. More detailed information about this method was described by Ellert and Bettany [20].
SOC stock at 0–20 cm of the paddy field was calculated by multiplying soil BD, SOC content, and thickness of the soil layer, and the units were expressed as Mg ha−1. The SOC stock of the paddy field was calculated using the following equivalent:
Me = Ms × conc × 0.001
Ms i = ρb i × Ti × 10,000
where Me was SOC stock (Mg ha−1), conc was SOC content at 0–20 cm (kg Mg−1), Ms i was soil mass at 0–20 cm (kg ha−1), ρb i was soil BD at 0–20 cm (Mg·m−3), Ti was depth of soil layer (m); 10,000 was the coefficient that area units of m2 converted into ha, 0.001 was the coefficient that mass units of kg converted into Mg.

2.4.3. N2O and CH4 Emissions

CH4 and N2O emissions flux and cumulative were investigated according to the method described by Zhang et al. (2013) [10]. Briefly, N2O and CH4 emissions flux of gas samples were investigated with a gas chromatograph equipped with an electron capture detector (ECD) and flame ionization detector (FID). N2O and CH4 emissions flux were investigated using a stainless-steel column, Porapak Q (80/100 mesh), and 13XMS column (60/80 mesh), with ECD and FID at 330 °C and 200 °C, respectively. The GWP of CH4 and N2O from the paddy field were calculated according to the method described by Thelen et al. [21].

2.5. Rice Yield

At maturity stages of early rice and late rice, rice yield with all tillage treatments was investigated in each plot.

2.6. Statistical Analysis

All data in the present manuscript were expressed as the mean ± standard error. All statistical analysis for each item with all tillage treatments were conducted using SPSS statistical software (v3.11). The data of each investigated item with different tillage treatments were compared by using one-way analysis of variance (ANOVA) following the standard procedure at the 5% probability level.

3. Results

3.1. SOC Content and SOC Stock

Soil bulk density (BD) of paddy fields with CT, RT, NT, and RTO treatments ranged from 1.10 to 1.22 g cm−3, and this result showed that soil BD with NT treatment was significantly higher (p < 0.05) than that of CT and RT treatments in 2019 and 2020 (Table 1). Compared with NT treatment, soil BD with CT and RT treatments were significantly decreased (1.10 and 1.10 g m−3 for CT, 1.14 and 1.15 g m−3 for RT in 2019 and 2020, respectively). There was no significant difference (p > 0.05) in soil BD between NT and RTO treatments in either year.
The SOC content and SOC stock of paddy fields were obviously changed under short-term (5-year) continuous crop residue incorporation conditions (Table 1). These results indicated that SOC content and SOC stock of paddy field with CT, RT, and NT treatments were significantly higher (p < 0.05) than that of RTO treatment, storing as much as 3.60 to 4.68 Mg ha−1 more C than that of the RTO treatment in 2019 and 2020. Meanwhile, CT treatment significantly increased SOC content and SOC stock in the paddy field. These results indicated that SOC content and SOC stock of paddy field with CT, RT, and NT treatments were increased, but there was no significant difference (p > 0.05) in SOC stock between RTO treatment and RT and NT treatments in 2019 and 2020.

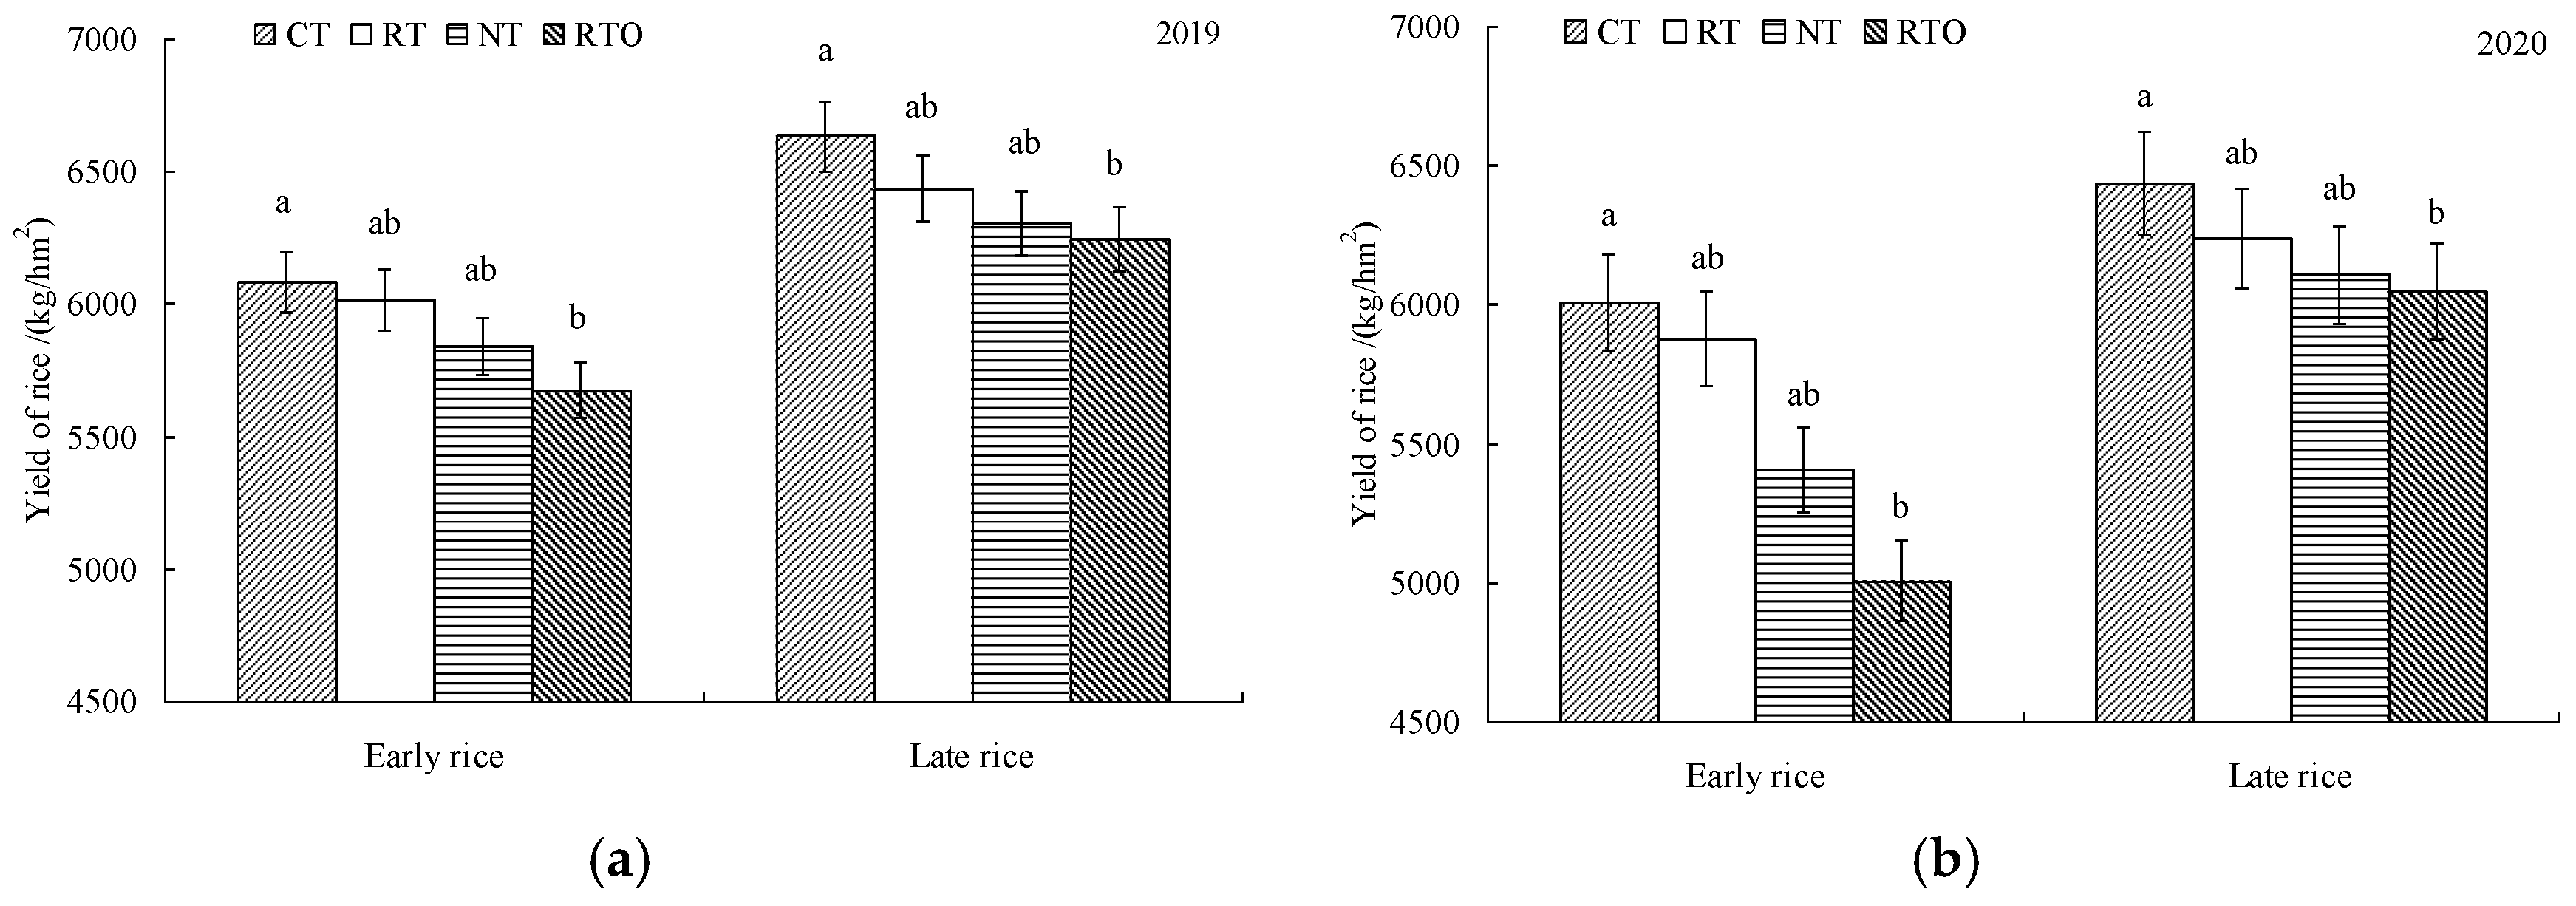
3.2. Early Rice and Late Rice Yield

The results indicated that early rice and late rice yield with RTO treatment were lower than that of CT, RT, and NT treatments, and double-cropping rice yield with RTO treatment was significantly lower (p < 0.05) than that of CT treatment. There was no significant difference (p > 0.05) in double-cropping rice yield between NT treatment and CT and RT treatments in 2019 and 2020 (Figure 2). Compared to RTO treatment, early rice and late rice yield with CT treatment increased by 7.22% and 19.99% in 2019 and 6.19% and 6.40% in 2020. The results indicated that double-cropping rice yield with RT and NT treatments was increased, but there was no significant difference (p > 0.05) in double-cropping rice yield between RT, NT, and RTO treatments.

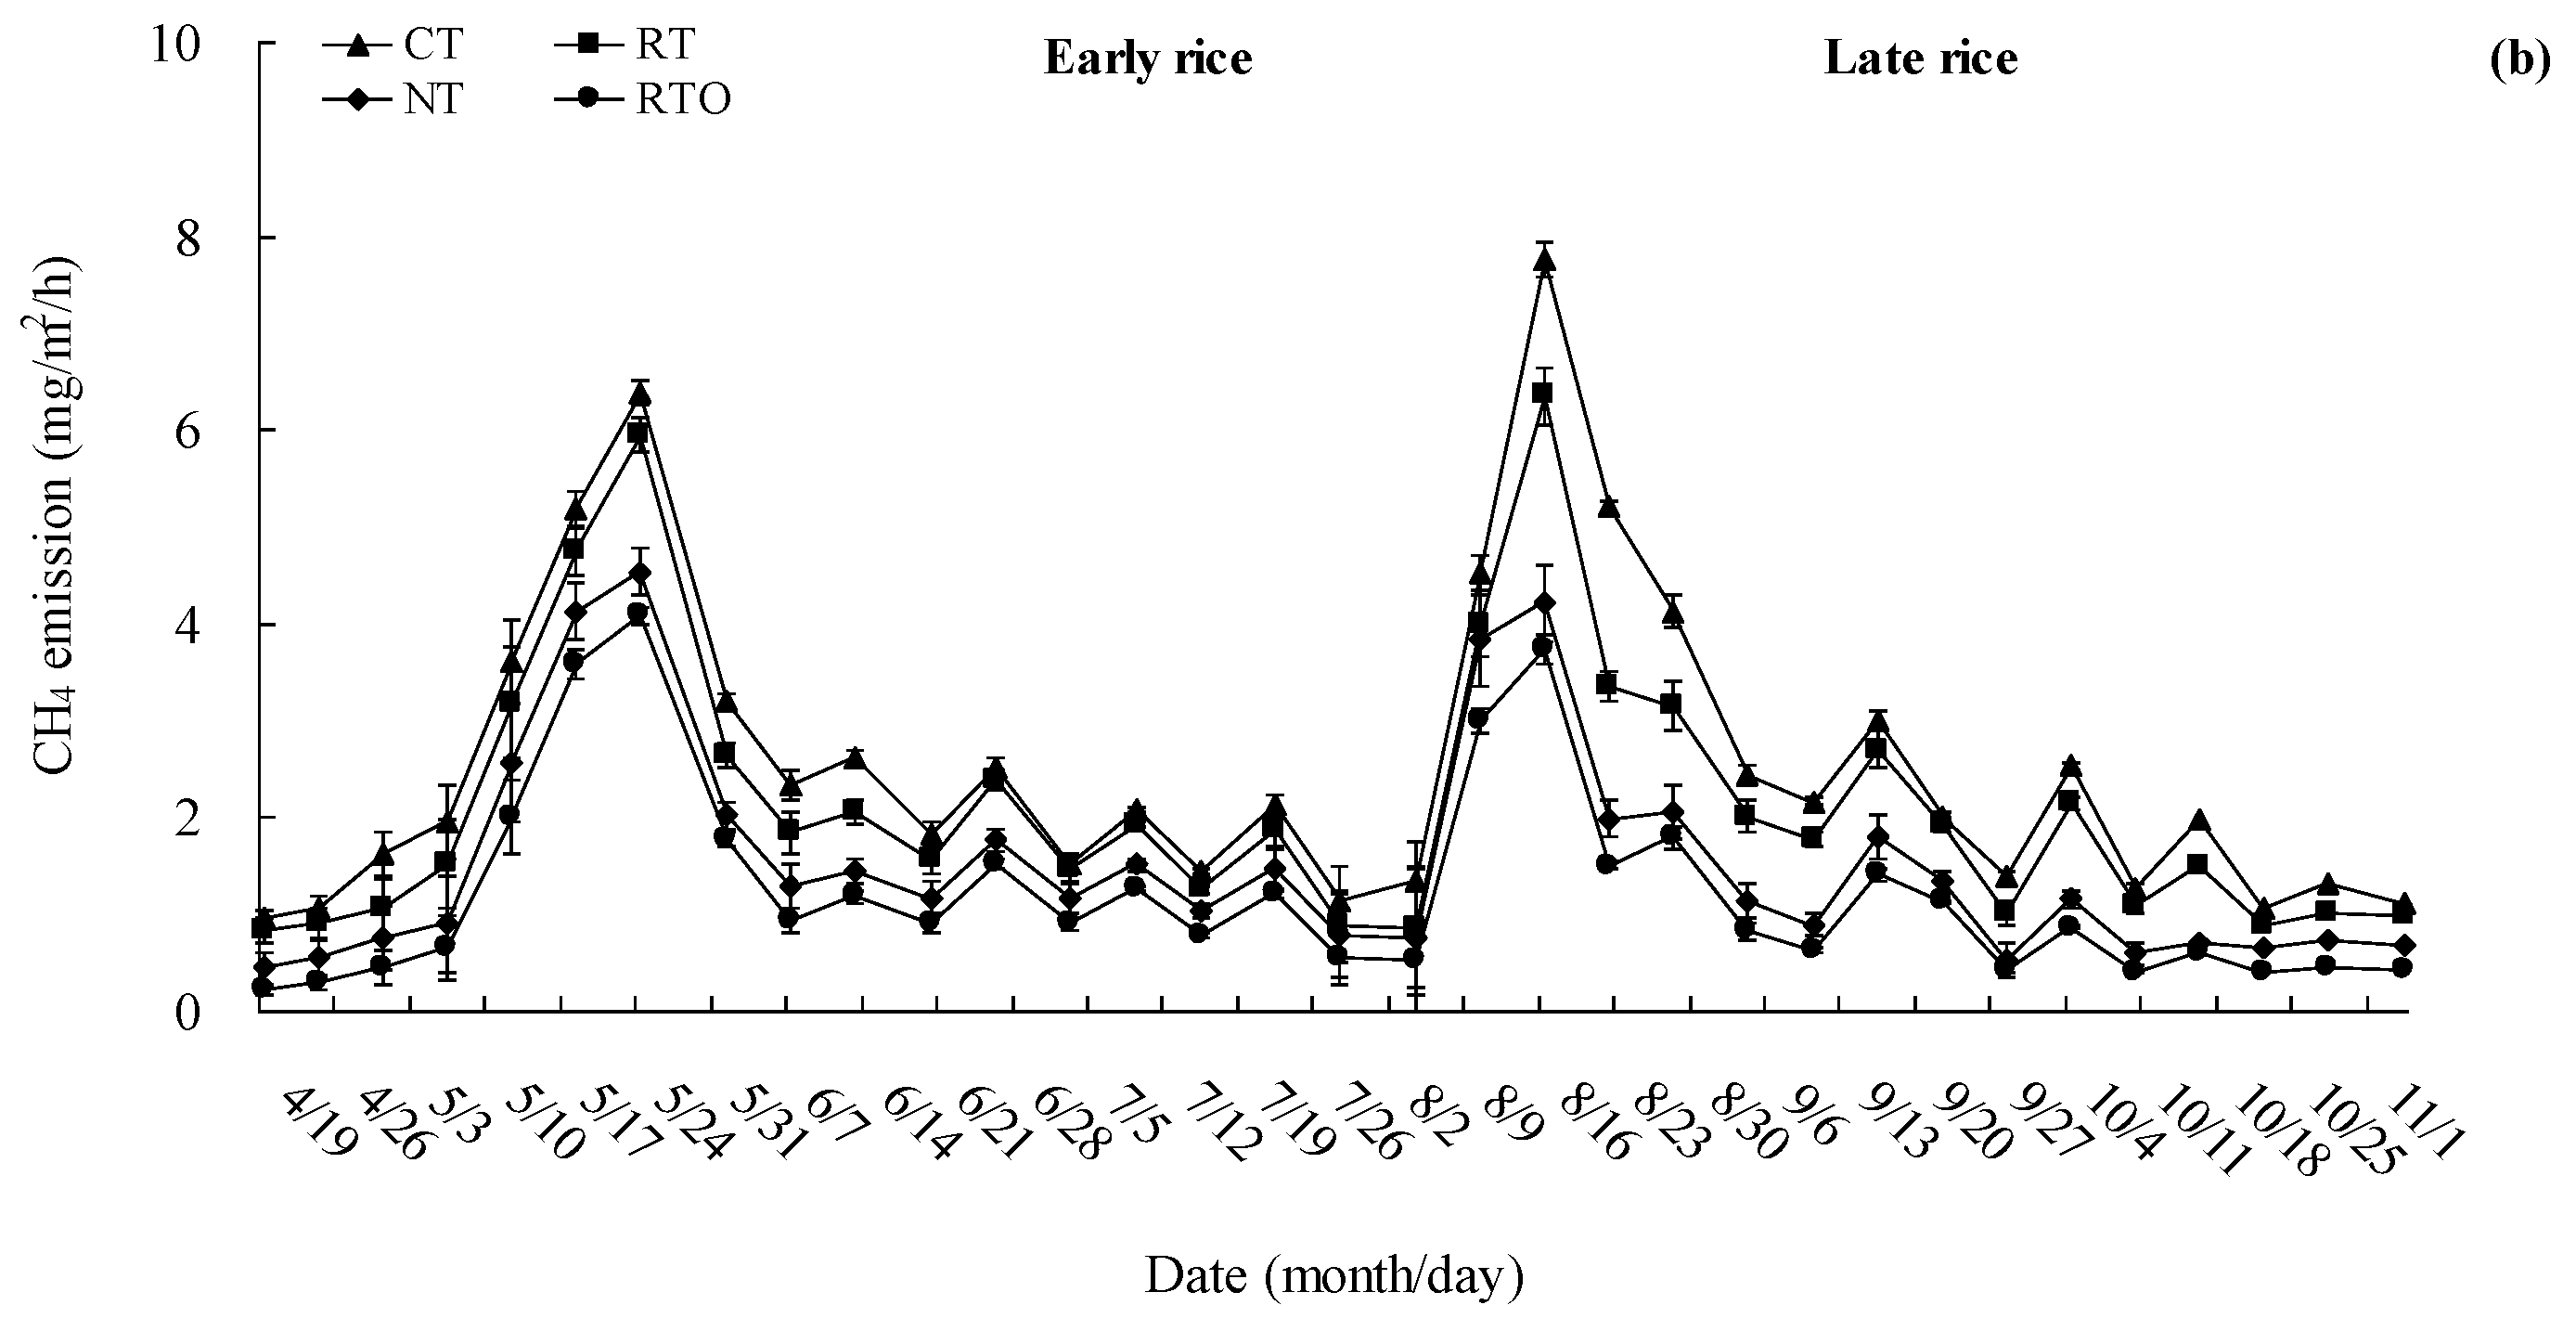
3.3. CH4 Emission Flux

These results indicated that CH4 emission flux from paddy field with RTO treatment was significantly lower than that of CT, RT, and NT treatments. During the early rice growth stage, CH4 emission flux was lower at the early stage, but CH4 emission flux peaked at 27 d and 28 d after rice seedling transplanting to paddy fields in 2019 and 2020, respectively, and then dropped to a lower level (Figure 3a). During the early rice growth stage, the order of CH4 emission flux from paddy field with all tillage treatments was as follows: RTO < NT < RT < CT.
During the late rice growth stage, characteristics of CH4 emission flux from paddy fields with all tillage treatments were similar to the early rice growth stage. CH4 emission flux from the paddy field was lower following rice seedling transplant to the paddy field, but CH4 emission flux peaked at 25 d and 23 d after rice seedling transplant to the paddy field in both years, respectively. These results showed that the order of CH4 emission flux from the paddy field with all tillage treatments was as follows: RTO < NT < RT < CT (Figure 3b).

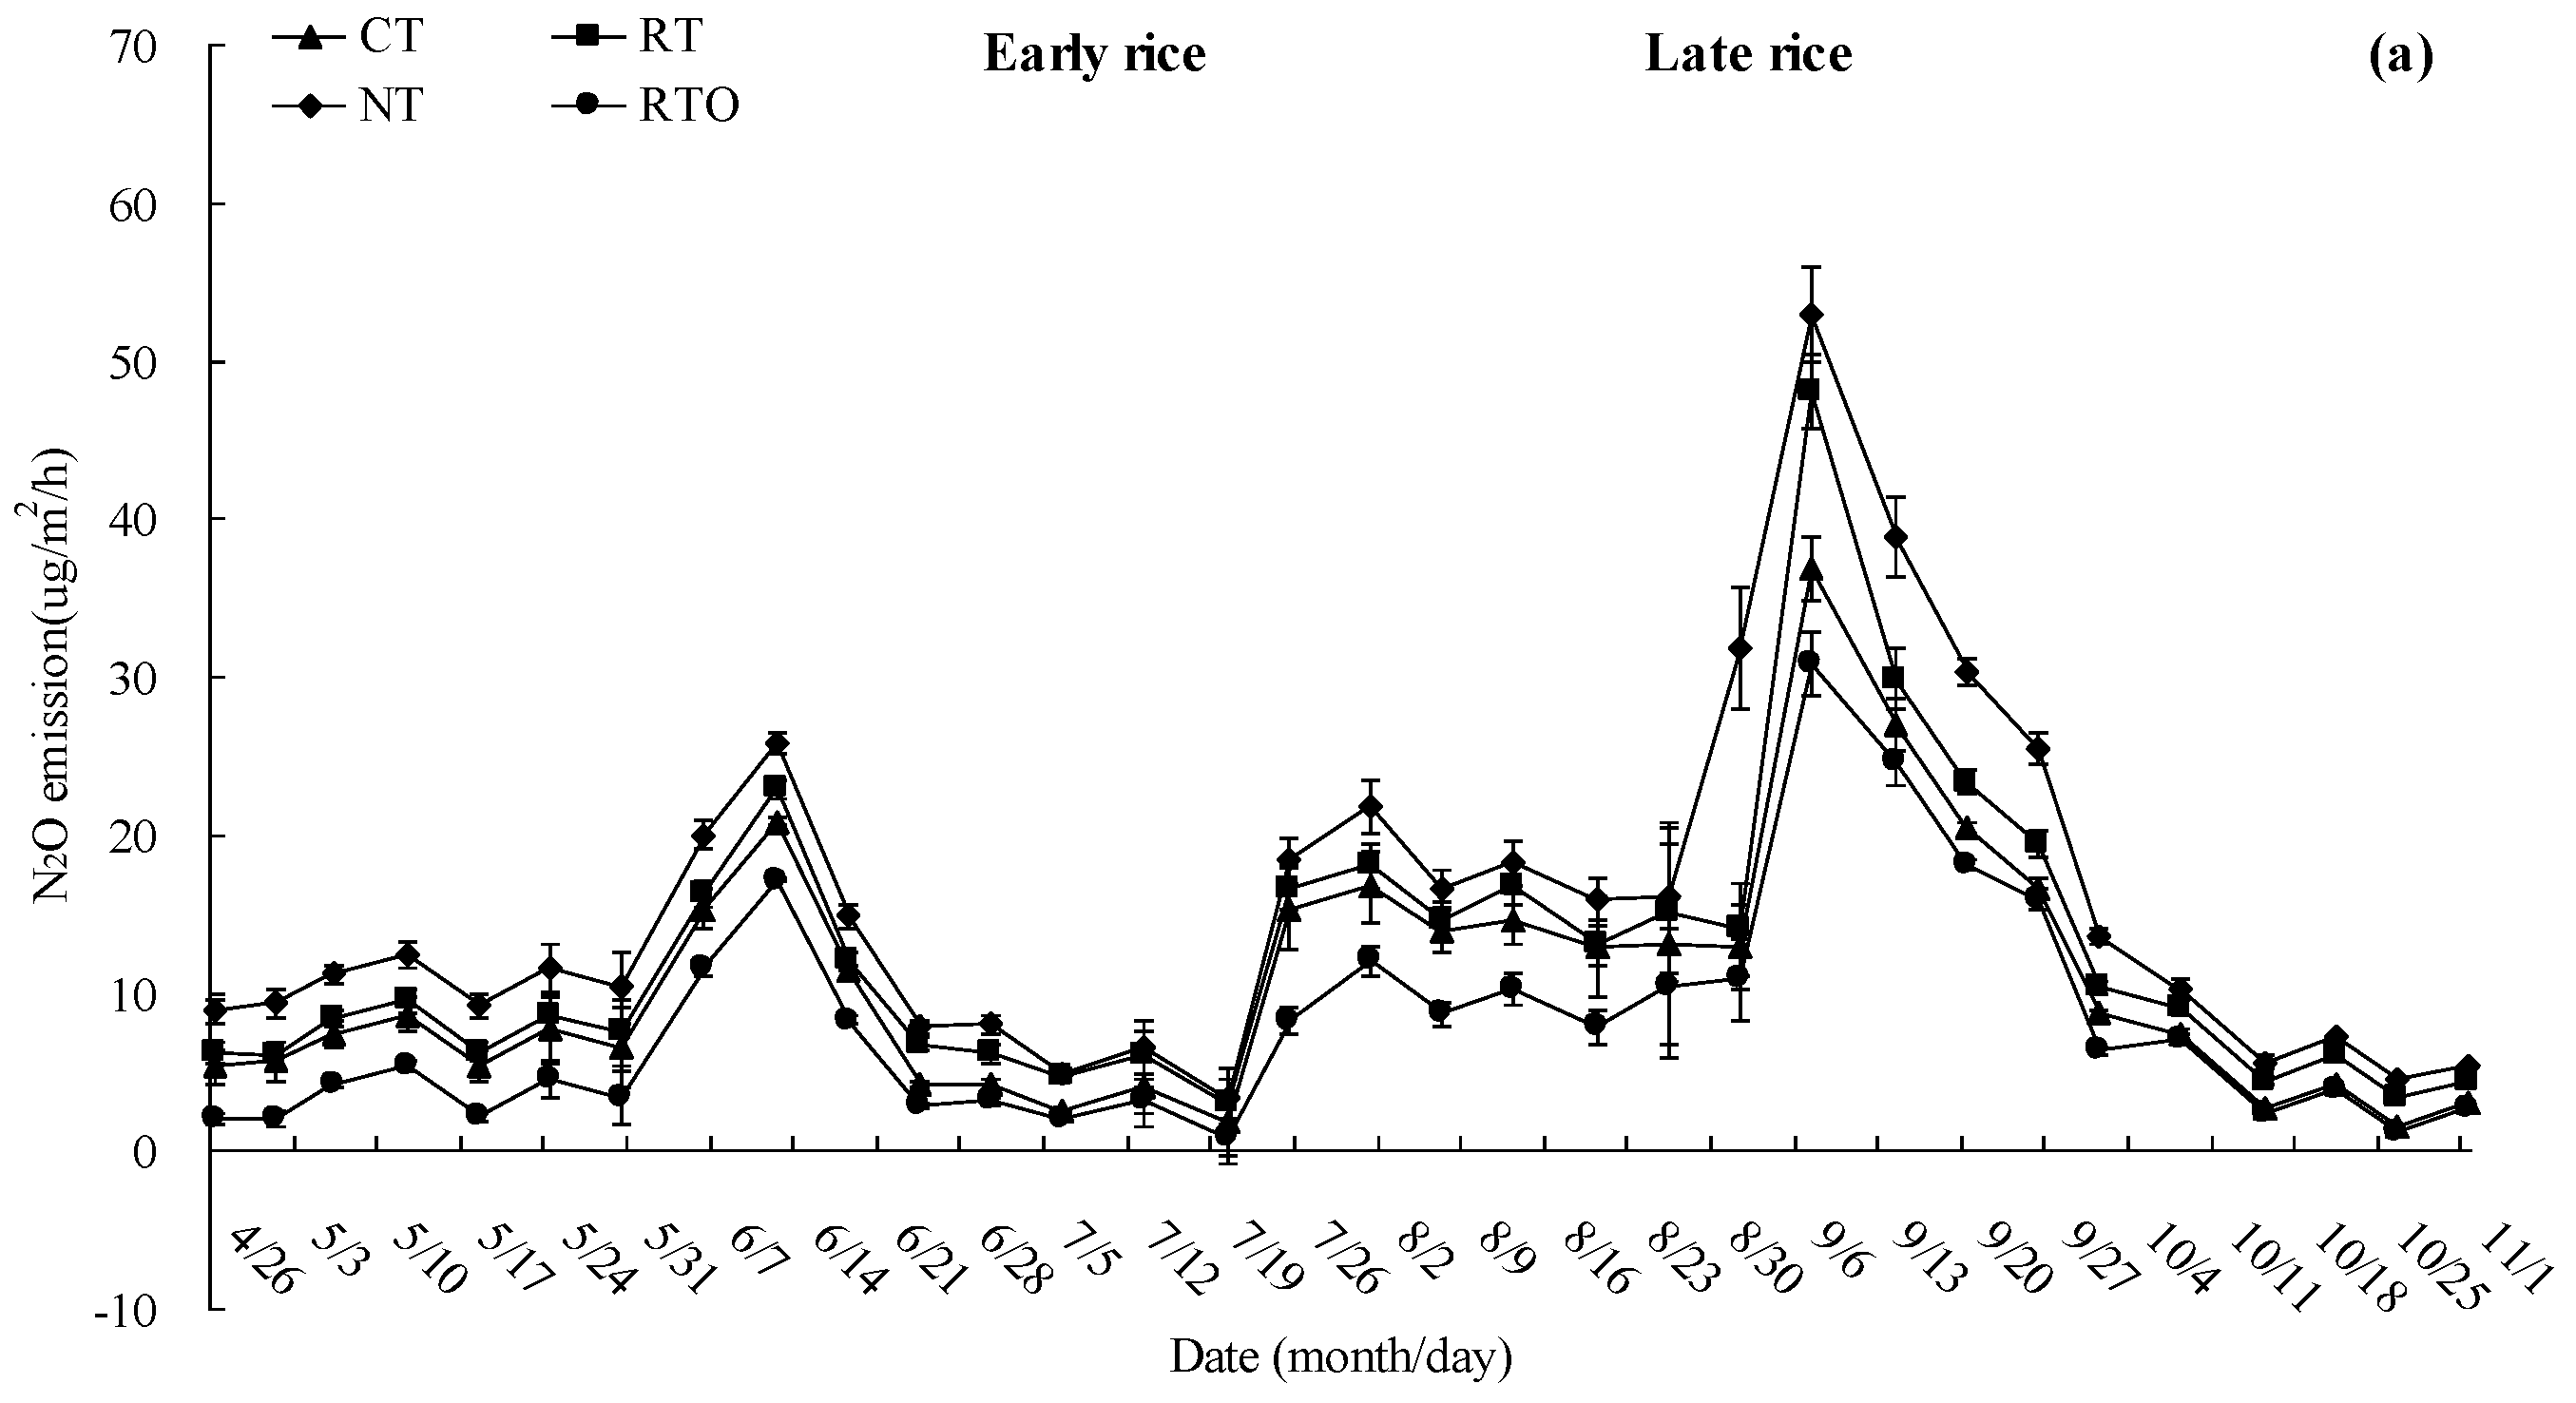
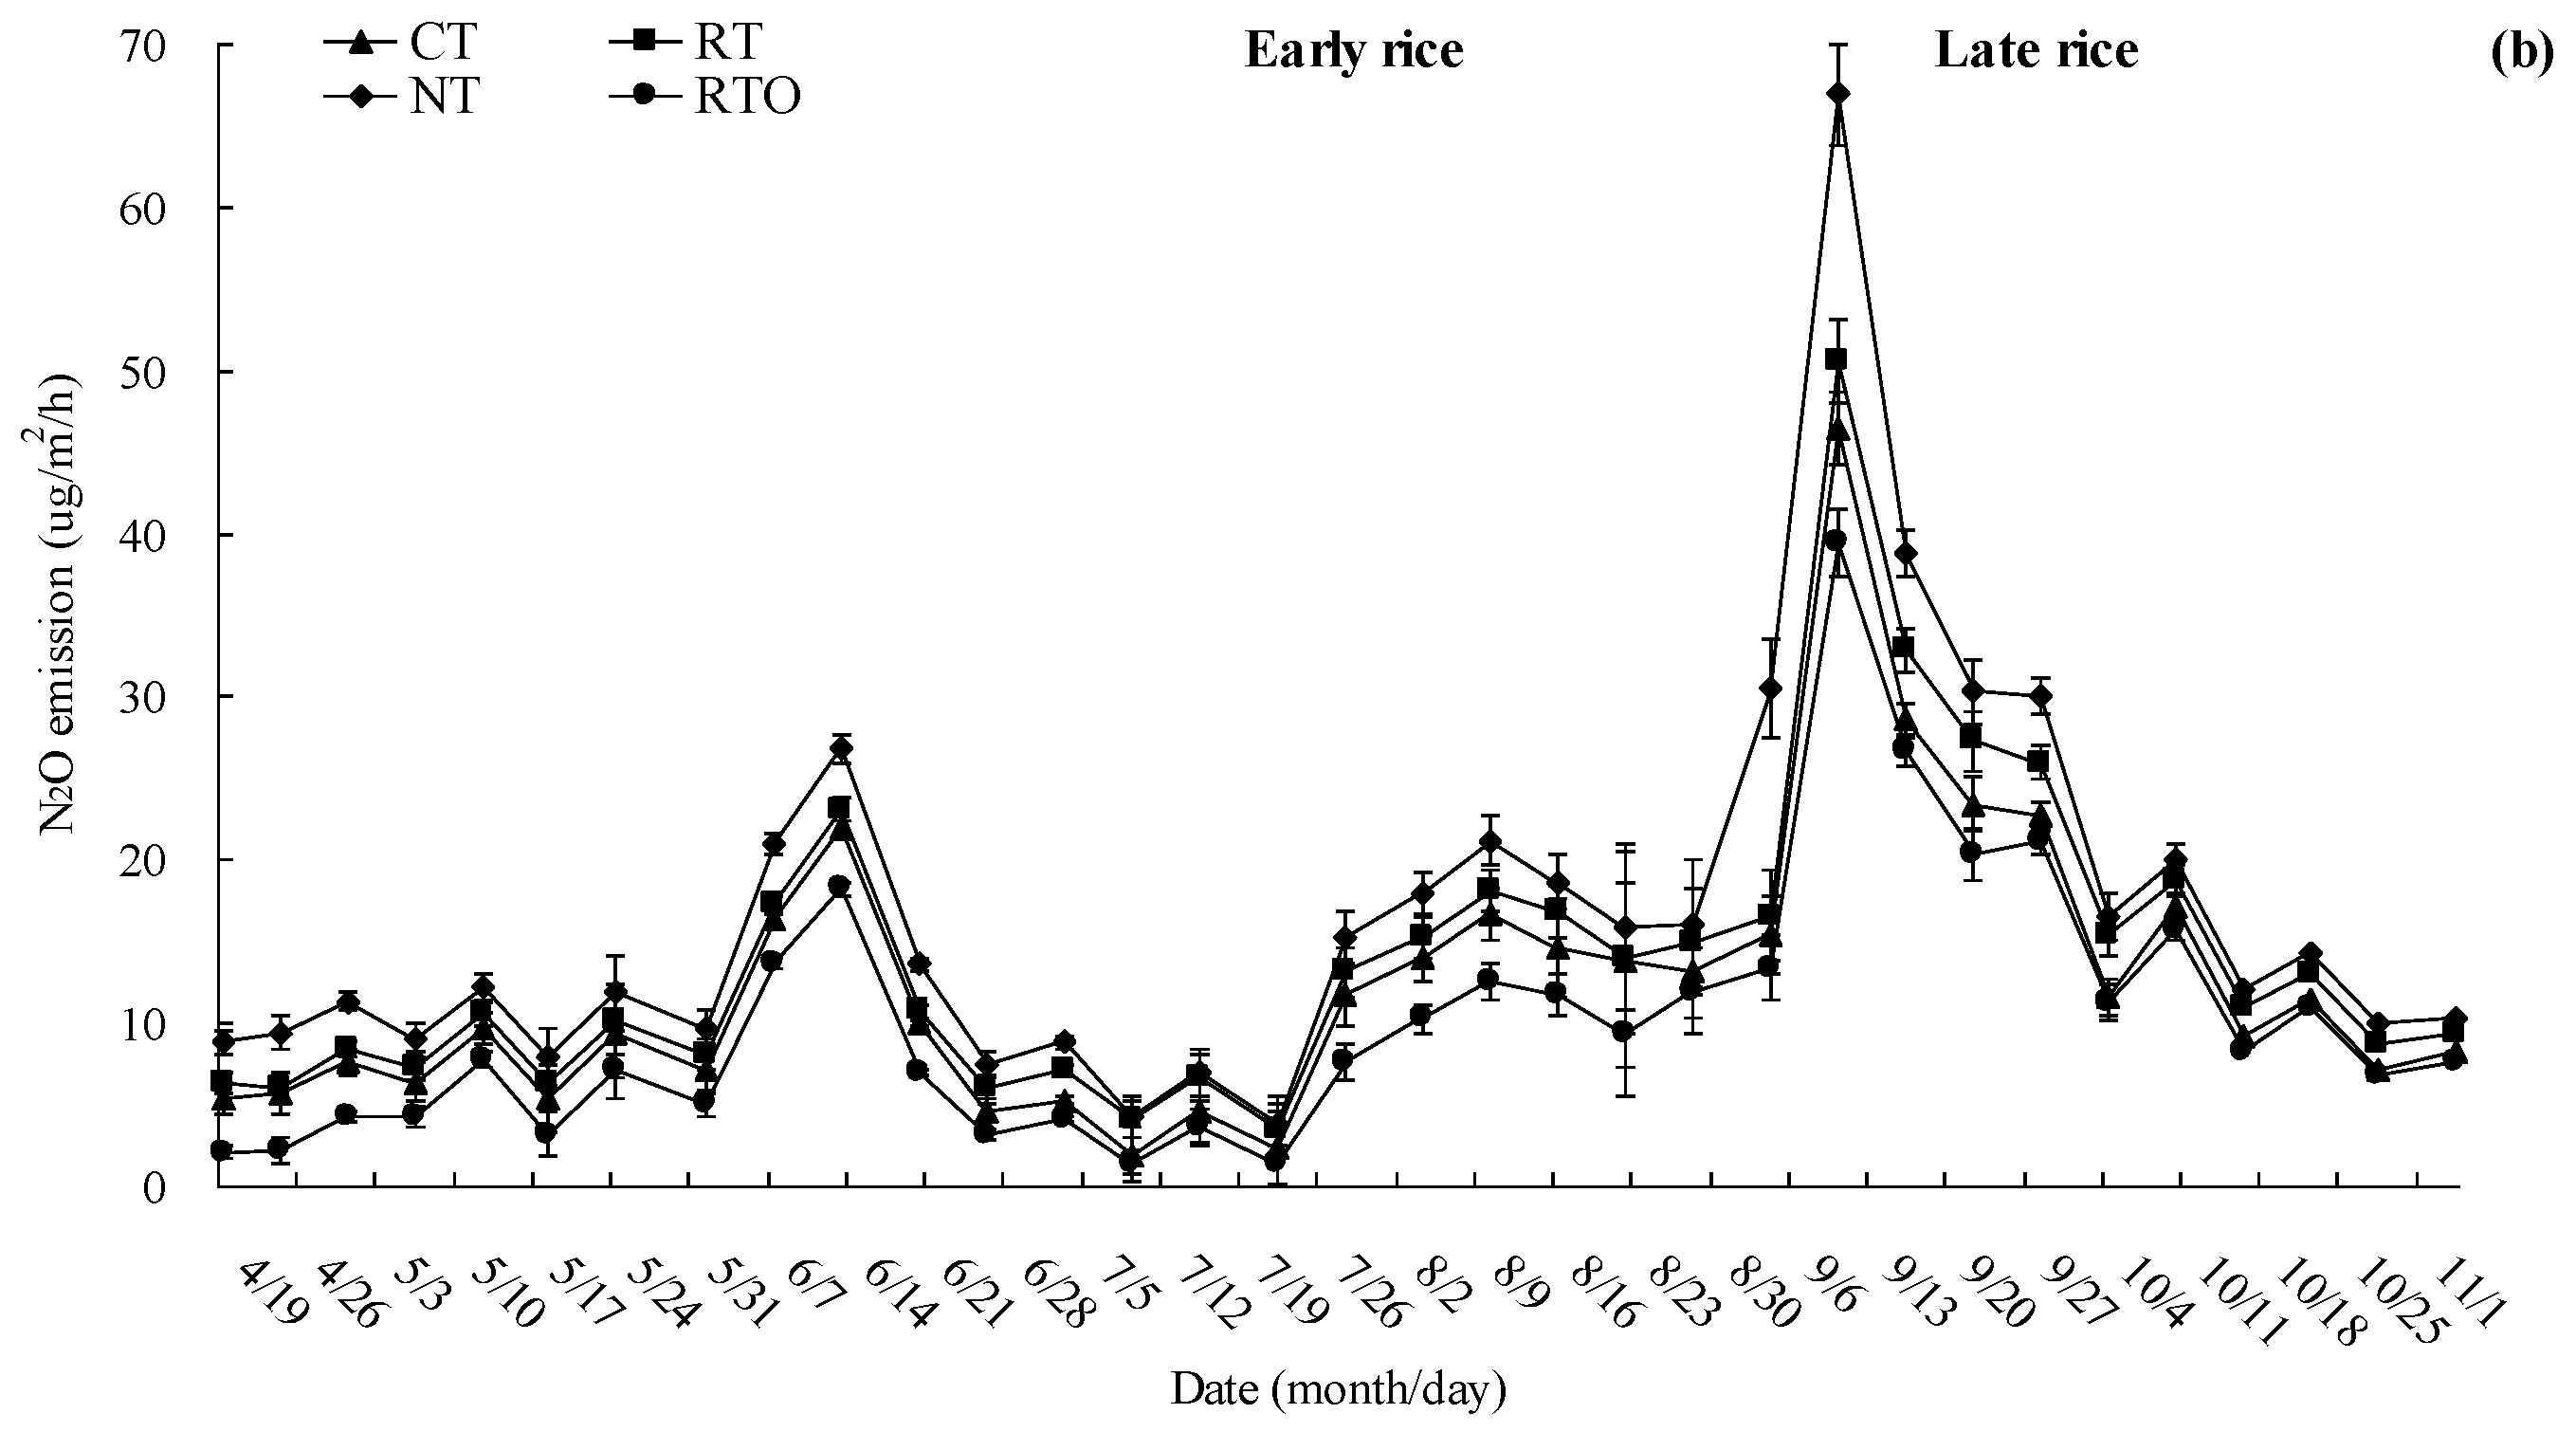
3.4. N2O Emission Flux

These results showed that N2O emission flux from the paddy field increased after rice seedling transplant to the paddy field; the highest peak of N2O emission flux from the paddy field was observed at the aeration stage (Figure 4). These results indicated that the order of N2O emission flux from the paddy field with all tillage treatments was as follows: NT > RT > CT > RTO (Figure 4a). In 2019, the average N2O emission flux from the paddy field with CT, RT, NT, and RTO treatments was 7.42, 8.71, 10.96, and 4.85 μg m−2 h−1, respectively. In 2020, the average N2O emission flux from paddy fields with all tillage treatments was 8.11, 9.26, 11.32, and 5.85 μg m−2 h−1, respectively.
These results indicated that the highest peak of N2O emission flux from the paddy field was observed at 42 d and 45 d after rice seedling transplanting to the paddy field in both years, respectively (Figure 4b). In 2019, the average N2O emission flux from paddy field with CT, RT, NT, and RTO treatments was 13.44, 15.69, 19.59, and 10.69 μg m−2 h−1, respectively. In 2020, the average N2O emission flux from the paddy field with all tillage treatments was 16.01, 18.10, 21.60, and 13.71 μg m−2 h−1, respectively.

3.5. Cumulative Emissions of N2O and CH4 from Paddy Field

This result indicated that cumulative CH4 emission from paddy fields with RT, NT, and RTO treatments was significantly lower (p < 0.05) than that of the CT treatment. The order of cumulative CH4 emission from the paddy field with all tillage treatments (average of two years) were as follows: CT (12.03 g m−2) > RT (9.52 g m−2) > NT (6.52 g m−2) > RTO (5.14 g m−2). Cumulative CH4 emission from paddy field with CT, RT, and NT treatments (average of two years) increased by 137.28%, 86.67%, and 27.14%, respectively, compared with RTO treatment (Table 2).
These results demonstrated that cumulative N2O emission from paddy fields with CT, RT, and RTO treatments were significantly lower (p < 0.05) than that of NT treatment, during early rice and late rice whole growth stages. The results indicated that the order of cumulative N2O emission from the paddy field with all tillage treatments (average of two years) were NT (0.073 g m−2) > RT (0.060 g m−2) > CT (0.052 g m−2) > RTO (0.041 g m−2). Cumulative N2O emission from paddy field with CT, RT, and NT treatments (average of two years) increased by 27.78%, 47.72%, and 80.12%, compared to RTO treatment, respectively (Table 2).

3.6. Comprehensive GWP of CH4 and N2O from Paddy Field

According to GWP, the contribution of CH4 emission to global warming was higher than that of N2O emission from paddy fields (Table 3). These results indicated that the GWP of CH4 emission from the paddy field with CT treatment was significantly higher (p < 0.05) than that of RT, NT, and RTO treatments, and with the trend CT > RT > NT > RTO in both years. Meanwhile, the results showed that GWP of N2O emission from paddy field with CT, RT, and RTO treatments were significantly lower (p < 0.05) than that of NT treatment, and with the trend NT > RT > CT > RTO in both years.
The order of the GWP of N2O and CH4 emissions from paddy fields with all tillage treatments (average of two years) were as follows: CT (3166.89 kg CO2-equivalent ha−1) > RT (2562.38 kg CO2-equivalent ha−1) > NT (1848.88 kg CO2-equivalent ha−1) > RTO (1407.90 kg CO2-equivalent ha−1). Compared with RTO treatment, GWP of N2O and CH4 emissions from the paddy field with CT, RT, and NT treatments (average of two years) increased by 127.87%, 83.31%, and 31.69%, respectively (Table 3). Meanwhile, the results showed that per yield GWP CO2 with RT, NT, and RTO treatments were significantly lower (p < 0.05) than that of CT treatment and had the trend CT > RT > NT > RTO in both years.

4. Discussion

4.1. Effects of Tillage Management on SOC Content and SOC Stock

These results indicated that soil BD was obviously changed under different short-term tillage conditions, especially when combined with crop residue incorporation. Soil BD of double-cropping rice fields decreased with crop residue incorporation management. This may be attributed to the fact that the formation of macro-aggregates and macro-pores was promoted with the cementation of secreted polysaccharides and organic acids by soil microorganisms during the process of decomposition of the applied crop residue [4,22]. This decrease in soil BD in the paddy field could reflect a higher level of rice root and rhizodeposition crop residue input under tillage practice conditions compared to those without crop residue input (Table 1). Meanwhile, these results showed that the lowest soil BD was correlated with the highest SOC content in the CT and RT treatments; NT treatment had a moderate level of SOC and the highest soil BD, and moderate soil BD and the lowest SOC content was found in the RTO treatment. Lack of crop residue input was the main reason for the increase of soil BD at the surface layer because crop residue stabilizes the soil aggregate against breaking, dispersion, and collapse [23], which agrees with these results, indicating that an increase in soil SOC content was related to a decrease in soil BD under combined tillage and crop residue incorporation conditions (Table 1).
Some results proved that SOC content and SOC stock of paddy fields were obviously influenced by different tillage practices [16,17]. In the present study, the results demonstrated that SOC content and SOC stock with NT treatment were obviously higher than that of RTO treatment. Our results were similar to the previous finding that SOC content and SOC stock with crop residue input management were increased [4,6], which were closely related to soil C content, cropping system, and crop residue management [22]. Our results proved that SOC content and SOC stock of paddy field with CT and RT treatments were higher than that of NT and RTO treatments, suggesting a higher C level, root residue, and exudates returning to the paddy field under applied crop residue conditions (Table 1). On the other hand, a lower C decomposition rate and higher organic matter incorporation were also another reason for the increased SOC stock of paddy fields [24]. Our results were in agreement with previous findings based on long-term field experiment conditions [9,17]. These results suggested that SOC content and SOC stock of paddy fields were closely correlated with an increase in soil quality, resulting in an increase in rice yield. In this study, there was a close relationship between higher rice yield and higher soil quality (SOC content and SOC stock), as expressed in paddy fields with RT and CT treatments (Figure 2). RT and CT treatments had the highest rice yield, as well as higher soil quality (higher value in SOC content and SOC stock, lower value in soil BD). Therefore, it was a beneficial strategy for sustaining or enhancing soil quality and rice yield in the double-cropping rice system with RT and CT treatments. RT and CT treatments were beneficial management for reducing soil mechanical resistance of the paddy field. However, there was the lowest rice yield and lower soil quality (e.g., lower SOC content and SOC stock, and higher soil BD) with RTO treatment. Therefore, it was an effective strategy for sustaining or enhancing soil quality and rice yield under the double-cropping rice system in southern China by combining rotary tillage and conventional tillage with crop residue input management.

4.2. Effects of Tillage Management on CH4 and N2O Emissions

CH4 and N2O emissions from paddy fields were mainly influenced by different field practices, including tillage, fertilizer regime, crop residue, irrigation, and so on. Some results proved that CH4 and N2O emissions from agricultural soil were closely related with tillage practice, CH4 and N2O emissions from paddy fields were obviously enhanced under combined tillage and crop residue conditions [10]. In this study, the results showed that CH4 and N2O emissions flux, cumulative CH4 and N2O emissions from paddy field with NT, RT, and CT treatments were much larger than that of RTO treatment, which was in agreement with the previous results [9]. The reason for this phenomenon may be that: (i) soil microorganism activities were promoted with crop residue returning to paddy field for that provide more carbon and energy source for soil microorganism activities; (ii) methanogens and nitrifying bacteria were also increased, which provide more substrate for CH4 and N2O emissions from paddy fields. Meanwhile, these results indicated that CH4 and N2O emissions from paddy fields with all tillage treatments during the early rice whole growth stage were larger than that of the late rice growth stage, suggesting that CH4 and N2O production was higher than that of the CH4 and N2O consumption rate under the higher temperature conditions (Figure 1), and could explain why CH4 and N2O emissions from paddy fields were increased during the late rice whole growth stage than during the early rice whole growth stage. On the other hand, soil microbial activities were improved under higher temperature conditions. Furthermore, relatively high temperatures were beneficial for promoting the decomposition process of crop residue, producing a larger number of organic compounds and resulting in the promotion of CH4 and N2O emissions from paddy fields.
In a previous study, the results proved that NT treatment was a beneficial soil practice for reducing CH4 emission from paddy fields [25]. Our results indicated that CH4 emission flux from paddy fields with NT treatment was lower than that of CT and RT treatments, which was similar to the previous findings [10]. The reason was mainly attributed to increased crop residue (e.g., rice root) incorporation into paddy field, adding tillage practice in the CT and RT plots, which would promote carbon decomposition and mineralization and provide more carbon substrates for soil microorganism activities. On the other hand, root biomass among different tillage treatments might mainly affect carbon decomposition [25]. Furthermore, NT treatment with no-tillage practice inhibited SOM decomposition and provided a lower carbon substrate for soil methanogen activities compared to conventional tillage and rotary tillage treatments [25]. In the present study, NT treatment decreased SOC content in the paddy field compared to RT and CT treatments, suggesting that CH4 emission from the paddy field with no-tillage practice decreased. Some results indicated that aerobic methanotrophs and anaerobic methanogens were obviously influenced by the rice root soil environment [14]. RT and CT treatments destroyed soil structure and reduced gas diffusivity at the plough layer; therefore, soil CH4 uptake and CH4 oxidation were decreased [26]. However, the soil compaction increased with NT treatment, prolonging the CH4 transfer access, reducing CH4 emission into the atmosphere from the paddy field, and decreasing the amount of CH4 transferred to the rice rhizosphere that was absorbed and emitted by rice plants [5,27]. Therefore, CH4 emission from paddy fields was increased under RT and CT conditions.
The N2O emission in our study was negligible (0.035–0.078 g m−2) during early rice and late rice growth stages in 2019 and 2020. This agrees with previous findings indicating that N2O emission from paddy fields was also lower [7,18]. N2O emission from paddy fields was the result of soil anaerobic denitrification and aerobic nitrification activities [26]. Zhang et al. [10] showed that N2O emission from paddy fields with NT management were increased, which was mainly affected by anaerobic conditions related to wet and compact soil. However, our results proved that N2O emission from paddy fields with NT treatment were slightly higher than those of RT and CT treatments. The results were similar to those of previous studies in which the adoption of reduced tillage or no-tillage management increased N2O emission [5]. Higher N2O emission from paddy fields with NT treatment might be mainly attributed to an increase in soil compaction [5], a higher denitrification rate [28], and a higher soil nutrient content (e.g., N, SOC) [10]. However, some results showed no significant difference in N2O emission between NT and CT treatments [29] or more N2O emission from paddy field with conventional tillage treatment [30]. The difference in previous results might closely relate to the climate conditions and soil physicochemical characteristics of the field experiment. However, the impacts of different tillage management on related soil anaerobic denitrifying and aerobic nitrifying bacteria in the double-cropping rice field still need further study based on long-term conditions.
Global warming potential (GWP) is usually regarded as an important factor in estimating the potential impacts of CH4, N2O, and CO2 on global climate change. Chen et al. [9] proved that the GWP of CH4 and N2O with NT treatment was lower than that of RT and CT treatments in a double-cropping rice field. In this study, the results showed that NT treatment was an effective practice to reduce GWP (27.97% and 41.58% compared to RT and CT treatments, respectively) from the paddy field. Ussiri et al. [26] also indicated that GWP with NT treatment was as low as 50% of that of moldboard and chisel tillage treatments. Clearly, compared with N2O emission, CH4 emission was the main component of GWP in all tillage treatments, which accounted for 95.10%, 93.02%, 88.20%, and 91.35% with CT, RT, NT, and RTO treatments (average of two years), respectively (Table 3), which were similar to the report of Cheng et al. [31], confirming that CH4 emission accounted for mainly the percentage of GWP from paddy fields. Therefore, it was necessary to use suitable tillage with crop residue practice to decrease CH4 emission instead of N2O emission from paddy fields to reduce GWP under the double-cropping rice system. Meanwhile, our results proved that the range of per yield GWP CO2 of the double-cropping rice system with all tillage treatments was from 0.11 to 0.25 kg kg−1, which were within the range of the previous study results [32]. However, the range of per yield GWP CO2 in our study was lower than that of previous results [33], in which GHG emissions from paddy fields were increased by continuous waterlogging practices, while alternating wetting and drying irrigation practices were used in our study. Therefore, applying alternating wetting and drying irrigation practices might reduce GHG emissions from paddy fields [34]. At present, there is still a need to further study the impacts of different tillage treatments on per yield GWP CO2 of double-cropping rice systems. In this study, our results indicated that the order of per yield GWP CO2 with all tillage treatments was similar to the sequence of GWP (Table 3) and rice yield, suggesting that NT treatment was a suitable practice for reducing per yield GWP CO2 of the double-cropping rice system in southern China.

5. Conclusions

In summary, our study indicated that SOC stock and greenhouse gas (GHG) emissions from double-cropping rice fields were strongly affected by short-term tillage management. CT treatment significantly increased SOC content and SOC stock at the 0–20 cm soil layer of double-cropping rice fields. NT treatment obviously decreased CH4 emission, although it increased N2O emission from the paddy field significantly. These results showed that the GWP of CH4 and N2O emissions were significantly decreased with short-term NT treatment, due to a reduction in CH4 emission. Among the CT, RT, and NT treatments, per yield GWP CO2 was lowest with NT treatment (0.14 and 0.17 kg kg−1 in 2019 and 2020, respectively). Therefore, these results suggest that NT could serve as an effective management strategy for reducing GWP of CH4 and N2O emissions from the double-cropping rice field in southern China. However, there was still a need to further explore the impacts of different tillage managements on related soil microorganism mechanisms in the double-cropping rice field based on long-term conditions.

Author Contributions

H.T. and X.X. designed the experiments; C.L., K.C. and L.W. performed the experiments; L.S. and W.L. analyzed the data; H.T. wrote the manuscript. All authors have read and agreed to the published version of the manuscript.

Funding

This work was supported by the National Natural Science Foundation of China (31872851) and Innovative Research Groups of the Natural Science Foundation of Hunan Province (2021CX36, 2021CX37).

Institutional Review Board Statement

Not applicable.

Informed Consent Statement

Not applicable.

Data Availability Statement

The data reported in this study is contained within the article.

Acknowledgments

We would like to thank the staff of Ningxiang Agricultural Technology Extension Center for field management.

Conflicts of Interest

The authors declare no conflict of interest.

References

  1. Balesdent, J.; Basile-Doelsch, I.; Chadoeuf, J.; Cornu, S.; Derrien, D.; Fekiacova, Z.; Hatté, C. Atmosphere–soil carbon transfer as a function of soil depth. Nature 2018, 559, 599–602. [Google Scholar] [CrossRef] [PubMed]
  2. Plaza-Bonilla, D.; Álvaro-Fuentes, J.; Cantero-Martínez, C. Identifying soil organic carbon fractions sensitive to agricultural management practices. Soil Till. Res. 2014, 139, 19–22. [Google Scholar] [CrossRef] [Green Version]
  3. Sheng, H.; Zhou, P.; Zhang, Y.Z.; Kuzyakov, Y.; Zhou, Q.; Ge, T.D.; Wang, G.H. Loss of labile organic carbon from subsoil due to land-use changes in subtropical China. Soil Biol. Biochem. 2015, 88, 148–157. [Google Scholar] [CrossRef]
  4. Qi, J.Y.; Zhao, X.; He, C.; Virk, A.L.; Jing, Z.H.; Liu, Q.Y.; Wang, X.; Kan, Z.R.; Xiao, X.P.; Zhang, H.L. Effects of long-term tillage regimes on the vertical distribution of soil iron/aluminum oxides and carbon decomposition in rice paddies. Sci. Total Environ. 2021, 776, 145797. [Google Scholar] [CrossRef]
  5. Smith, P.; Goulding, K.; Smith, K.; Powlson, D.; Smith, J.; Falloon, P. Including trace gas fluxes in estimates of the carbon mitigation potential of UK agricultural land. Soil Use Manage. 2000, 16, 251–259. [Google Scholar] [CrossRef]
  6. Guo, L.J.; Zhang, Z.S.; Wang, D.D.; Li, C.F.; Cao, C.G. Effects of short-term conservation management practices on soil organic carbon fractions and microbial community composition under a rice-wheat rotation system. Biol. Fertil. Soils 2015, 51, 65–75. [Google Scholar] [CrossRef]
  7. Chen, Z.D.; Zhang, H.L.; Dikgwatlhe, S.B.; Xue, J.F.; Qiu, K.C.; Tang, H.M.; Chen, F. Soil carbon storage and strafification under different tillage/residue-management practices in double rice cropping system. J. Integr. Agr. 2015, 14, 1551–1560. [Google Scholar] [CrossRef]
  8. Wang, X.; Qi, J.Y.; Zhang, X.Z.; Li, S.S.; Virk, A.L.; Zhao, X.; Xiao, X.P.; Zhang, H.L. Effects of tillage and residue management on soil aggregates and associated carbon storage in a double paddy cropping system. Soil Till. Res. 2019, 194, 104339. [Google Scholar] [CrossRef]
  9. Chen, Z.D.; Zhang, H.L.; Xue, J.F.; Liu, S.L.; Chen, F. A nine-year study on the effects of tillage on net annual global warming potential in double rice-cropping systems in Southern China. Soil Till. Res. 2021, 206, 104797. [Google Scholar] [CrossRef]
  10. Zhang, H.L.; Bai, X.L.; Xue, J.F.; Chen, Z.D.; Tang, H.M.; Chen, F. Emissions of CH4 and N2O under different tillage systems from double-cropped paddy fields in southern China. PLoS ONE 2013, 8, e65277. [Google Scholar] [CrossRef] [Green Version]
  11. Huang, J.X.; Chen, Y.Q.; Sui, P.; Gao, W.S. Estimation of net greenhouse gas balance using crop- and soil-based approaches, two case studies. Sci. Total Environ. 2013, 456–457, 299–306. [Google Scholar] [CrossRef]
  12. Dendooven, L.; Patino-Zúniga, L.; Verhulst, N.; Luna-Guido, M.; Marsch, R.; Govaerts, B. Global warming potential of agricultural systems with contrasting tillage and residue management in the central highlands of Mexico. Agric. Ecosyst. Environ. 2012, 152, 50–58. [Google Scholar] [CrossRef]
  13. Van Kessel, C.; Venterea, R.; Six, J.; Adviento-Borbe, M.A.; Linquist, B.; van Groenigen, K.J. Climate, duration, and N placement determine N2O emissions in reduced tillage systems: A meta-analysis. Glob. Chang. Biol. 2013, 19, 33–44. [Google Scholar] [CrossRef]
  14. Tang, H.M.; Xiao, X.P.; Li, C.; Shi, L.H.; Cheng, K.K.; Li, W.Y.; Wen, L.; Xu, Y.L.; Wank, K. Microbial carbon source utilization in rice rhizosphere soil with different tillage practice in a double cropping rice field. Sci. Rep. 2021, 11, 5048. [Google Scholar] [CrossRef]
  15. Zhao, X.; Pu, C.; Ma, S.T.; Liu, S.L.; Xue, J.F.; Wang, X.; Wang, Y.Q.; Li, S.S.; Lal, R.; Chen, F.; et al. Management-induced greenhouse gases emission mitigation in global rice production. Sci. Total Environ. 2018, 649, 1299–1306. [Google Scholar] [CrossRef] [PubMed]
  16. Yang, X.Y.; Ren, W.D.; Sun, B.H.; Zhang, S.L. Effects of contrasting soil management regimes on total and labile soil organic carbon fractions in a loess soil in China. Geoderma 2012, 177–178, 49–56. [Google Scholar] [CrossRef]
  17. Tang, H.M.; Xiao, X.P.; Li, C.; Tang, W.G.; Cheng, K.K.; Pan, X.C.; Wang, K.; Li, W.Y. Effects of different soil tillage systems on soil carbon management index under double-cropping rice field in southern China. Agron. J. 2019, 111, 440–446. [Google Scholar] [CrossRef]
  18. Shang, Q.; Yang, X.; Gao, C.; Wu, P.; Liu, J.; Xu, Y.; Shen, Q.; Zou, J.; Guo, S. Net annual global warming potential and greenhouse gas intensity in Chinese double rice cropping systems: A 3-year field measurement in long-term fertilizer experiments. Glob. Change Biol. 2011, 17, 2196–2210. [Google Scholar] [CrossRef]
  19. Blake, G.R.; Hartge, K.H. Bulk density. In Methods of Soil Analysis. Part I: Physical and Mineralogical Methods Agronomy Monograph No. 9; Klute, A., Ed.; American Society of Agronomy: Madison, WI, USA, 1986; pp. 363–375. [Google Scholar]
  20. Ellert, B.H.; Bettany, J.R. Calculation of organic matter and nutrients stored in soils under contrasting management regimes. Can. J. Soil Sci. 1995, 75, 529–538. [Google Scholar] [CrossRef] [Green Version]
  21. Thelen, K.; Fronning, B.; Kravchenko, A.; Min, D.; Robertson, G. Integrating livestock manure with a corn–soybean bioenergy cropping system improves short-term carbon sequestration rates and net global warming potential. Biomass Bioenerg. 2010, 34, 960–966. [Google Scholar] [CrossRef]
  22. Li, S.; Zhang, S.R.; Pu, Y.L.; Li, T.; Xu, X.X.; Jia, Y.X.; Deing, O.P.; Gong, G.S. Dynamics of soil labile organic carbon fractions and C-cycle enzyme activities under straw mulch in Chengdu Plain. Soil Till. Res. 2016, 155, 289–297. [Google Scholar] [CrossRef]
  23. Ghosh, B.N.; Meena, V.S.; Alam, N.M.; Dogra, P.; Bhattacharyya, R.; Sharma, N.K.; Mishra, P.K. Impact of conservation practices on soil aggregation and the carbon management index after seven years of maize-wheat cropping system in the Indian Himalayas. Agric. Ecosyst. Environ. 2016, 216, 247–257. [Google Scholar] [CrossRef]
  24. Kalbitz, K.; Kaiser, K.; Fiedler, S.; Kölbl, A.; Amelung, W.; Bräuer, T.; Cao, Z.; Don, A.; Grootes, P.; Jahn, R.; et al. The carbon count of 2000 years of rice cultivation. Glob. Change Biol. 2013, 19, 1107–1113. [Google Scholar] [CrossRef]
  25. Ali, M.A.; Lee, C.H.; Lee, Y.B.; Kim, P.J. Silicate fertilization in no-tillage rice farming for mitigation of methane emission and increasing rice productivity. Agric. Ecosyst. Environ. 2009, 132, 16–22. [Google Scholar] [CrossRef]
  26. Ussiri, D.A.; Lal, R.; Jarecki, M.K. Nitrous oxide and methane emissions from long-term tillage under a continuous corn cropping system in Ohio. Soil Till. Res. 2009, 104, 247–255. [Google Scholar] [CrossRef]
  27. Zhang, Z.S.; Cao, C.G.; Guo, L.J.; Li, C.F. Emissions of CH4 and CO2 from paddy fields as affected by tillage practices and crop residues in central China. Paddy Water Environ. 2016, 14, 85–92. [Google Scholar] [CrossRef]
  28. Jiang, C.; Wang, Y.; Zheng, X.; Zhu, B.; Huang, Y.; Hao, Q. Methane and nitrous oxide emissions from three paddy rice based cultivation systems in southwest China. Adv. Atmos. Sci. 2006, 23, 415–424. [Google Scholar] [CrossRef]
  29. Choudhary, M.; Akramkhanov, A.; Saggar, S. Nitrous oxide emissions from a New Zealand cropped soil: Tillage effects, spatial and seasonal variability. Agric. Ecosyst. Environ. 2002, 93, 33–43. [Google Scholar] [CrossRef]
  30. Elder, J.W.; Lal, R. Tillage effects on gaseous emissions from an intensively farmed organic soil in North Central Ohio. Soil Till. Res. 2008, 8, 45–55. [Google Scholar] [CrossRef]
  31. Cheng, K.; Pan, G.; Smith, P.; Luo, T.; Li, L.; Zheng, J. Carbon footprint of China’s crop production—an estimation using agro-statistics data over 1993–2007. Agric. Ecosyst. Environ. 2011, 142, 231–237. [Google Scholar] [CrossRef]
  32. Win, K.T.; Nonaka, R.; Win, A.T.; Sasada, Y.; Toyota, K.; Motobayashi, T. Effects of water saving irrigation and rice variety on greenhouse gas emissions and water use efficiency in a paddy field fertilized with anaerobically digested pig slurry. Paddy Water Environ. 2015, 13, 51–60. [Google Scholar] [CrossRef]
  33. Li, C.; Frolking, S.; Xiao, X.; Moore, B.I.; Boles, S.; Qiu, J.; Huang, Y.; Salas, W.; Sass, R. Modeling impacts of farming management alternatives on CO2, CH4, and N2O emissions, a case study for water management of rice agriculture of China. Global Biogeochem. Cycles 2005, 19, GB3010. [Google Scholar] [CrossRef] [Green Version]
  34. Peng, S.; Buresh, R.J.; Huang, J.; Zhong, X.; Zou, Y.; Yang, J. Improving nitrogen fertilization in rice by site-specific N management. A review. Agron. Sustain. Dev. 2010, 30, 649–656. [Google Scholar] [CrossRef]
Figure 1. Daily precipitation and daily mean temperature of paddy field during experimental period. (a) was the 2019, (b) was the 2020.
Agronomy 12 00517 g001
Figure 2. Impacts of different short-term tillage managements on early rice and late rice yield under the double-cropping rice system. CT: conventional tillage with crop residue incorporation; RT: rotary tillage with crop residue incorporation; NT: no-tillage with crop residue retention; RTO: rotary tillage with all crop residues removed as a control. Error bars represent standard error of the mean. Different lowercase letters indicated a significant difference at the 0.05 level. The same as below. (a) was the 2019, (b) was the 2020.
Agronomy 12 00517 g002
Figure 3. Impacts of different short-term tillage managements on CH4 emission flux from double-cropping rice field in 2019 (a) and 2020 (b).
Agronomy 12 00517 g003aAgronomy 12 00517 g003b
Figure 4. Impacts of different short-term tillage managements on N2O emission flux from double-cropping rice field in 2019 (a) and 2020 (b).
Agronomy 12 00517 g004aAgronomy 12 00517 g004b
Table 1. Impacts of different short-term tillage managements on soil BD, SOC, and its stock of paddy field under the double-cropping rice system (0–20 cm).
YearsTreatmentsBD (g cm−3)SOC (g kg−1)SOC Stock (Mg ha−1)
2019CT1.10 ± 0.03 b23.54 ± 0.68 a51.79 ± 1.50 a
RT1.14 ± 0.04 b22.26 ± 0.64 ab50.75 ± 1.47 ab
NT1.21 ± 0.04 a20.93 ± 0.61 b50.65 ± 1.46 ab
RTO1.17 ± 0.03 ab20.15 ± 0.58 b47.15 ± 1.36 b
2020CT1.10 ± 0.03 b23.59 ± 0.67 a51.90 ± 1.48 a
RT1.15 ± 0.03 b22.36 ± 0.63 ab51.43 ± 1.46 ab
NT1.22 ± 0.04 a21.01 ± 0.60 b51.26 ± 1.45 ab
RTO1.17 ± 0.03 ab20.18 ± 0.56 c47.22 ± 1.35 b
CT: conventional tillage with crop residue incorporation; RT: rotary tillage with crop residue incorporation; NT: no-tillage with crop residue retention; RTO: rotary tillage with all crop residues removed as a control. BD: soil bulk density; SOC: soil organic carbon. Different lowercase letters in the same column indicated a significant difference at the 0.05 level.
Table 2. Impacts of different short-term tillage managements on CH4 and N2O emissions from double-cropping rice field (g m−2).
YearsTreatmentsCH4N2O
Early RiceLate RiceTotalEarly RiceLate RiceTotal
2019CT4.50 ± 0.12 a7.69 ± 0.22 a12.19 ± 0.35 a0.015 ± 0.001 c0.032 ± 0.001 c0.047 ± 0.002 c
RT3.81 ± 0.11 b5.31 ± 0.15 b9.12 ± 0.26 b0.018 ± 0.001 b0.037 ± 0.001 b0.055 ± 0.002 b
NT2.66 ± 0.08 c3.28 ± 0.10 c5.95 ± 0.17 c0.022 ± 0.001 a0.046 ± 0.001 a0.068 ± 0.002 a
RTO2.03 ± 0.06 d2.56 ± 0.07 d4.59 ± 0.13 d0.010 ± 0.001 d0.025 ± 0.001 d0.035 ± 0.001 d
2020CT5.35 ± 0.15 a6.53 ± 0.18 a11.87 ± 0.34 a0.017 ± 0.001 c0.040 ± 0.001 c0.057 ± 0.002 c
RT4.66 ± 0.11 b5.26 ± 0.15 b9.92 ± 0.28 b0.019 ± 0.001 b0.046 ± 0.001 b0.065 ± 0.002 b
NT3.53 ± 0.10 c3.55 ± 0.10 c7.08 ± 0.21 c0.024 ± 0.001 a0.054 ± 0.001 a0.078 ± 0.002 a
RTO2.87 ± 0.08 d2.81 ± 0.08 d5.68 ± 0.16 d0.012 ± 0.001 d0.035 ± 0.001 d0.047 ± 0.001 d
RTO: rotary tillage with all crop residues removed as a control; CT: conventional tillage with crop residue incorporation; RT: rotary tillage with crop residue incorporation; NT: no-tillage with crop residue retention. Different lowercase letters in the same column indicated a significant difference at the 0.05 level.
Table 3. GWP of CH4 and N2O emissions from paddy field and per yield GWP with different short-term tillage managements.
YearsTreatmentsCH4 Emission (g m−2)N2O Emission (g m−2)GWP of CH4 (kg CO2 ha−1)GWP of N2O (kg CO2 ha−1)GWP of CH4 and N2O
(kg CO2 ha−1)
Early and Late Rice Grain Yield
(kg ha−1)
Per yield GWP CO2 (kg kg−1)
2019CT12.19 ± 0.35 a0.047 ± 0.002 c3051.77 ± 88.10 a140.26 ± 5.85 c3192.02 ± 92.14 a12,718.5 ± 367.2 a0.25 ± 0.01 a
RT9.12 ± 0.26 b0.055 ± 0.002 b2283.19 ± 65.91 b164.13 ± 4.73 b2447.32 ± 70.64 b12,454.5 ± 359.5 ab0.20 ± 0.01 b
NT5.95 ± 0.17 c0.068 ± 0.002 a1489.58 ± 43.01 c202.92 ± 4.04 a1692.51 ± 48.85 c12,150.0 ± 350.7 ab0.14 ± 0.01 c
RTO4.59 ± 0.13 d0.035 ± 0.001 d1149.11 ± 33.17 d104.45 ± 3.01 d1253.55 ± 36.18 d11,922.0 ± 344.2 b0.11 ± 0.01 d
2020CT11.87 ± 0.34 a0.057 ± 0.002 c2971.65 ± 85.78 a170.10 ± 5.74 c3141.75 ± 90.01 a12,343.9 ± 356.3 a0.25 ± 0.01 a
RT9.92 ± 0.28 b0.065 ± 0.002 b2483.47 ± 71.69 b193.97 ± 4.93 b2677.44 ± 76.68 b12,112.6 ± 349.7 ab0.22 ± 0.01 b
NT7.08 ± 0.21 c0.078 ± 0.002 a1772.48 ± 51.16 c232.77 ± 4.22 a2005.24 ± 57.36 c11,515.9 ± 332.4 ab0.17 ± 0.01 c
RTO5.68 ± 0.16 d0.047 ± 0.001 d1421.99 ± 41.04 d140.26 ± 3.19 d1562.24 ± 44.23 d11,055.8 ± 319.2 b0.14 ± 0.01 d
RTO: rotary tillage with all crop residues removed as a control; CT: conventional tillage with crop residue incorporation; RT: rotary tillage with crop residue incorporation; NT: no-tillage with crop residue retention. Different lowercase letters in the same column indicated a significant difference at the 0.05 level.
Publisher’s Note: MDPI stays neutral with regard to jurisdictional claims in published maps and institutional affiliations.

