Article

Application of Potassium along with Nitrogen under Varied Moisture Regimes Improves Performance and Nitrogen-Use Efficiency of High- and Low-Potassium Efficiency Cotton Cultivars

1
Department of Soil & Environmental Sciences, MNS-University of Agriculture, Multan 60000, Pakistan
2
Pesticide Quality Control Laboratory, Multan 60000, Pakistan
3
Plant Physiology/Chemistry Section, Central Cotton Research Institute, Multan 60000, Pakistan
4
Department of Agronomy, MNS-University of Agriculture, Multan 60000, Pakistan
5
Statistical Section, Cotton Research Institute, Multan 60000, Pakistan
6
College of Plant Science and Technology, Huazhong Agricultural University, Wuhan 430070, China
7
Cell and Molecular Biology Program, University of Arkansas, Fayetteville, NC 72701, USA
8
Botany and Microbiology Department, College of Science, King Saud University, Riyadh 11451, Saudi Arabia
9
Department of Environmental Sciences, Government College University, Faisalabad 38000, Pakistan
10
Department of Biological Sciences and Technology, China Medical University, Taichung 40402, Taiwan
*
Authors to whom correspondence should be addressed.
Agronomy 2022, 12(2), 502; https://doi.org/10.3390/agronomy12020502
Submission received: 24 November 2021 / Revised: 8 February 2022 / Accepted: 11 February 2022 / Published: 17 February 2022

Abstract

:
Low nitrogen-use efficiency (NUE) is a serious issue for cotton production and environmental sustainability in arid climates. A pot study was conducted to evaluate the effect of K nutrition on NUE and performance of low- and high-K-efficiency cotton cultivars under two moisture regimes. Treatments included two soil moisture levels—i.e., normal irrigation, 100% available water content (AWC); reduced irrigation, 50% AWC—three levels of nitrogen (N)—i.e., 0, 375, and 750 mg N pot−1—and two K levels, i.e., 0 and 208 mg K pot−1. Results reveal that 208 mg K pot−1 application with nitrogen significantly enhanced the N-use efficiency, growth, and yield attributes of both cotton cultivars compared with sole N fertilization. Similarly, the combined application of NK @ 375 N + 208 K mg pot−1 caused up to 83% increase in NUE under AWC50% and AWC100%, as compared with NK control (0 N + 0 K). Compared with the control, imposed low-moisture stress caused a decrease of 13.9% in stomatal conductance (gs), 2.5% in transpiration rate (E), and 6.5% in net photosynthetic rate (PN), respectively. The physiological water use efficiency (PN/E) decreased by 13.2% under AWC50%. Applied NK @ 375 N:208 K, mg pot−1 caused 27.39 and 27.56% improvement in the PN/E in HKE and LKE cultivars under AWC50%, respectively. The HKE cultivar, i.e., CIM-554, maintained the highest gs and PN than FH-901, that was low-K-efficiency cultivar. The study suggests that varietal selection and adequate K fertilization have the prospects to improve NUE and save considerable quantities of fertilizer and irrigation water in cotton production under arid environments.

1. Introduction

Mineral nutrition plays a critical role in crop production. Nitrogen is the first most important yield-limiting nutrient, while K is the third most important macronutrient after phosphorus (P) [1]. Potassium is termed a quality element as it governs the health and quality attributes of a crop. Potassium is the most abundant cation in plants and contributes up to 10% in dry biomass [2]. Improved root growth, stalk strength, activation of enzymes, regulation of plant cell turgidity, translocation of sugar and starch, protein biosynthesis, and control of diseases and insect pest attacks have been attributed to adequate K supply in crops [3]. The growth, yield, and quality of crops decline in K-deficient soils [4,5]. About 60% of agricultural soils in Pakistan are K-deficient (have less than 80 ppm K). Cotton is generally a sensitive crop to low K and often shows deficiency symptoms in soils with marginal K availability [6]. The major reasons for K deficiency in soils are high cropping intensity, shortage of canal irrigation water, inadequate application of organic matter, coarse soil texture, and low or no use of K fertilizers [7]. Similarly, phosphorus application improved the leaf area, plant height, number of bolls per plant, and yield of seed cotton. Therefore, NPK has a significant effect on cotton yield [8].
In soils with deficient K, the imbalanced or excessive use of N without K fertilization is a serious issue in crop production and environmental sustainability in developing countries. Owing to the imbalanced use and misuse of fertilizers, N losses can be up to 70% of the total available nitrogen, as reported from agriculture [9]. These excessive N losses do not only result in very low nitrogen-use efficiency (NUE) and poor crop production but also a threat to the environment and climate through greenhouse gas emissions. The NUE is closely associated with the status of indigenous K in agricultural soils [10]. As the indigenous soil K falls below the critical target level, in the range of 150–200 kg K2O ha−1 [11], the crop’s efficiency of utilizing N fertilizer also significantly reduces. Although K depletion in the soil solution enhances ammonium–nitrogen (NH4+N) uptake in plants, it also decreases the absorption, translocation, and assimilation of nitrate–nitrogen (NO3-N), which, in turn, lowers leaf nitrate reductase activity (NRA) [12]. In all soil types, except those of rice fields, NRA plays a significant role in improving NUE because most of the applied NH4-N is oxidized to NO3-N due to the high rate of the nitrification process. Moreover, K triggers the activity of the enzymes responsible for NH4+ assimilation and amino acids translocation in plants [12]. Optimal N:K ratios favor healthy plant growth and development, while an imbalanced supply of N and K is unfavorable to good crop production [13]. Nitrogen-use efficiency, with respect to potassium fertilization, was calculated using the difference in nitrogen use between a plot treated with K fertilizer and without K, divided by amount of nitrogen applied. Applied K improves nitrogen-use efficiency on potassium-based fertilizers (NUEk) through enhanced N uptake and utilization by plants, thus ultimately resulting in higher crop yields [14]. Therefore, without sufficient K supply to plant roots, the objective of efficient utilization of NH4-N and NO3-N for obtaining a potential yield of crops cannot be achieved on calcareous/alkaline soils [14]. The application of potassic fertilizers has been proven to activate more than sixty enzymes in plants [15]. The combined application of N and K fertilizers has been reported to produce higher crop yields and higher quality of produce [11,12,13,14,15]. However, improvements in NUE due to K fertilization also depend on the level of N nutrition, soil moisture regimes, crop responsiveness to K, plant genotype, and crop growth stage [16,17,18].
Among limiting factors, drought stress is the key factor that adversely affects many physiological and morphological traits of the cotton crop, including yield and fiber quality [19]. However, the impact of drought stress depends on the degree and duration of stress, genotypic background, and growth stage of the plant [20]. The root growth, rate of K+ movement, and absorption are decreased in soils under droughted conditions. The absorption of water reduces due to low K concentration in the root cells, which ultimately reduces plant tolerance to drought stress. Low K content reduces leaf area expansion, CO2 assimilation rate, net photosynthetic rate, transpiration, water use efficiency [21], and biomass production in cotton [22]. Integrated nutrient management including K may help overcome the negative effects of drought stress and improve nitrogen-use efficiency (NUE) and fiber quality of cotton [23].
This study aims to evaluate the nitrogen-use efficiency (NUE) and morphophysiological performance of two cotton cultivars through integrated N and K management under two moisture levels.

2. Materials and Methods

Background research: A series of preliminary hydroponic studies were conducted under controlled conditions at deficient (0.26 mM K in nutrient solution) and adequate K (3.33 mM) levels at the Central Cotton Research Institute (CCRI), Multan, Pakistan, for the screening and selection of high-K-efficiency (HKE) and low-K-efficiency (LKE) cotton cultivars. From 46 screened cultivars, CIM-554 as HKE cultivar and FH-901 as LKE cultivar were selected, based on dry matter and K-utilization indices, to further evaluate the effect of integrated NK nutrition on NUE, and the morphological and physiological parameters of cotton under normal and reduced (AWC50%) irrigation conditions.

2.1. Experimental Growth Condition, Treatments, Design, and Management

A pot study was conducted to evaluate the effect of N with and without K on different morphological and physiological parameters of two selected cotton cultivars at normal [100% of available water content (AWC100%) was applied] and reduced irrigation levels [50% of available water content (AWC50%) was applied]. The study was performed in a wire house, having control over insects and rainfall. Treatments comprised of 3 factors; N:K levels, i.e., N levels (0, 375 and 750 mg N pot−1); K levels (0 and 208 mg K pot−1); 2 irrigation levels (reduced irrigation, i.e., AWC50%, and normal irrigation, AWC100%) with two pre-selected cotton cultivars (CIM-554 and FH-901). The study was planned under a completely randomized design (CRD) with a factorial arrangement and each treatment had three replications. There were total of 72 pots used in this study. The environmental condition of the wire house was maintained as the outside environmental condition. The average monthly temperatures were 38.6 °C (30–43 °C) in May, 38.9 °C (31–44 °C) in June, 36.6 °C (31–39 °C) in July, 35.8 °C (34–38 °C) in August, 34.9 °C (29–39 °C) in September, and 29.3 °C (23–35 °C) in October, respectively, during the cotton growing season. The top layer of the soil (0–30 cm) was sampled from the field of CCRI, ground, sieved through a 2 mm sieve, analyzed (Table S1), and used to fill the pots of 10 kg capacity. Each pot had 25 and 22 cm height and diameter, respectively. Four healthy cotton seeds were sown in each pot. After one week of germination, only one cotton plant of the same vigor was maintained in each pot, while the remaining plants were removed and incorporated in the respective pots. In each pot, all the calculated P and K were applied as a basal dose, while N was applied in 3 splits: 1st at 35 days after sowing (DAS), 2nd at 65 DAS, and the 3rd application at 85 DAS. The nitrogen was applied as top dressing in each pot. Two irrigation levels, i.e., AWC50% and AWC100%, were employed after the seedling establishment. AWC was calculated from water retention curve that was developed using pressure membrane apparatus. The θAWC was 0.244 cm3 and the soil water content was maintained at proposed levels by monitoring soil moisture every alternate day with the help of a soil moisture equipment—Theta Probe (Delta-T Devices Ltd., Cambridge, UK)—that works on the principle of time domain reflectometry [24].

2.2. Data Collection

2.2.1. Growth, Development, and Seed Cotton Yield

Data related to growth and development, such as leaves, stalks, roots dry matter weight (DMW), gas exchange characteristics, and seed cotton yield and yield components were recorded at maturity.

2.2.2. Gas Exchange Characteristics and Water Use Efficiency

A portable photosynthesis system (CI-340 CID, Camas, WA, USA) was used to record data concerning gas exchange characteristics, such as net photosynthetic rate (PN), stomatal conductance (gS), and transpiration rate (E). All observations were recorded from the fourth fully expanded leaf on the main stem from the top of the plant between 10:00 a.m. and 12.00 p.m. at the peak flowering stage. The climatic data included 1500 mol m−2s−1 quantum flux, 38.5 ± 2 °C leaf temperature, 380 ± 5 μmol mol−1 CO2 concentration, and 65 ± 5% relative humidity. Instantaneous water use efficiency (IWUE) was calculated by using the following formula [20]:
  IWUE   [ μ mol   CO 2   / mmolH 2 O ] = P N   ( µ   mol   CO 2 m 2 S 1 ) E   ( mmol   H 2 O   m 2 S 1 )

2.2.3. Leaf Relative Water Content and Leaf Area

The leaf area was measured from three randomly selected leaves (top, middle, and bottom leaf) from one plant per replication per treatment, using an area measurement system (Delta-T Devices, Burwell Cambridge, England). Leaf relative water contents (LRWC) were determined by collecting topmost fully expanded leaves from every replication after 60 days of sowing. The sampled fresh leaves were weighed, soaked in water overnight, and dried at 70 °C for 24 h, or until constant weight. Finally, LRWC was calculated using the following formula [25]:
LRWC   ( % ) = FW DW ( TW DW ) × 100
where: FW—fresh weight; TW—turgid weight; DW—dry weight.

2.3. Plant Analysis for N and K

The sampled leaves and roots were washed with distilled water, dried at 65 °C for 48 h in a forced-air-driven oven, and stored under desiccation until weighing for dry biomass and then ground to obtain the fine powder. From ground samples, N was analyzed according to Jackson [26], while K concentration was estimated by taking a 0.5 g dry sample and digesting it in a 10 mL diacid mixture of nitric acid and perchloric acid with a ratio of 3:1. K concentration (Kc) (mg g−1) in the digested samples was determined on the flame photometer (PFP-7, Jenway England, Staffordshire, UK), as described by Zia-ul-Hassan [27].

2.4. Estimation of Nutrients Uptake and Use Efficiency Indices

Nutrient uptake and nutrient-use efficiency indices were calculated using the following formulae [28,29,30,31].
NUE IndicesFormulae
Nutrient uptake (mg plant−1)
(NUP)
=   Nutrient   concentration × Dry   matter
Agronomic efficiency (AE; mg mg−1) = SCYf SCYc NAf NAc
Physiological efficiency (PE; mg mg−1) = BMf BMc NUf NUc
Apparent recovery efficiency (ARE; %) = NUf NUc NAf NAc × 100
Utilization efficiency (UE; mg mg−1) = PE × ARE
Internal utilization efficiency (IE; mg mg−1) = SCYf SCYc NUf NUc
Nitrogen-use efficiency with respect to K (%) (NUEK) = [ NU Kf NU Kc N   applied ] × 100
Note: SCYf—seed cotton yield of fertilized treatment; SCYc—seed cotton yield of control treatment; NAf—quantity of nitrogen in fertilized treatment; NAc—control treatment; NUKf—nitrogen uptake in K fertilized pot; NUKc—nitrogen uptake in K control pot, BMf—biomass of fertilized treatment; BMc —biomass of control treatment.

2.5. Statistical Analysis

The data were statistically analyzed using the three-factor factorial analysis of variance (ANOVA). The data were subjected to the homogeneity test before analysis of variance. The main effects and interaction means were compared using the least significant difference test (Fisher’s LSD) at the 95% confidence interval (p ≤ 0.05), by using STATISTIX 8.1 (Analytical Software, Inc., Tallahassee, FL, USA). Pearson correlation was used to determine correlations among various traits by using the window-based SPSS 10th edition software (SPSS Inc., Chicago, IL, USA).

3. Results

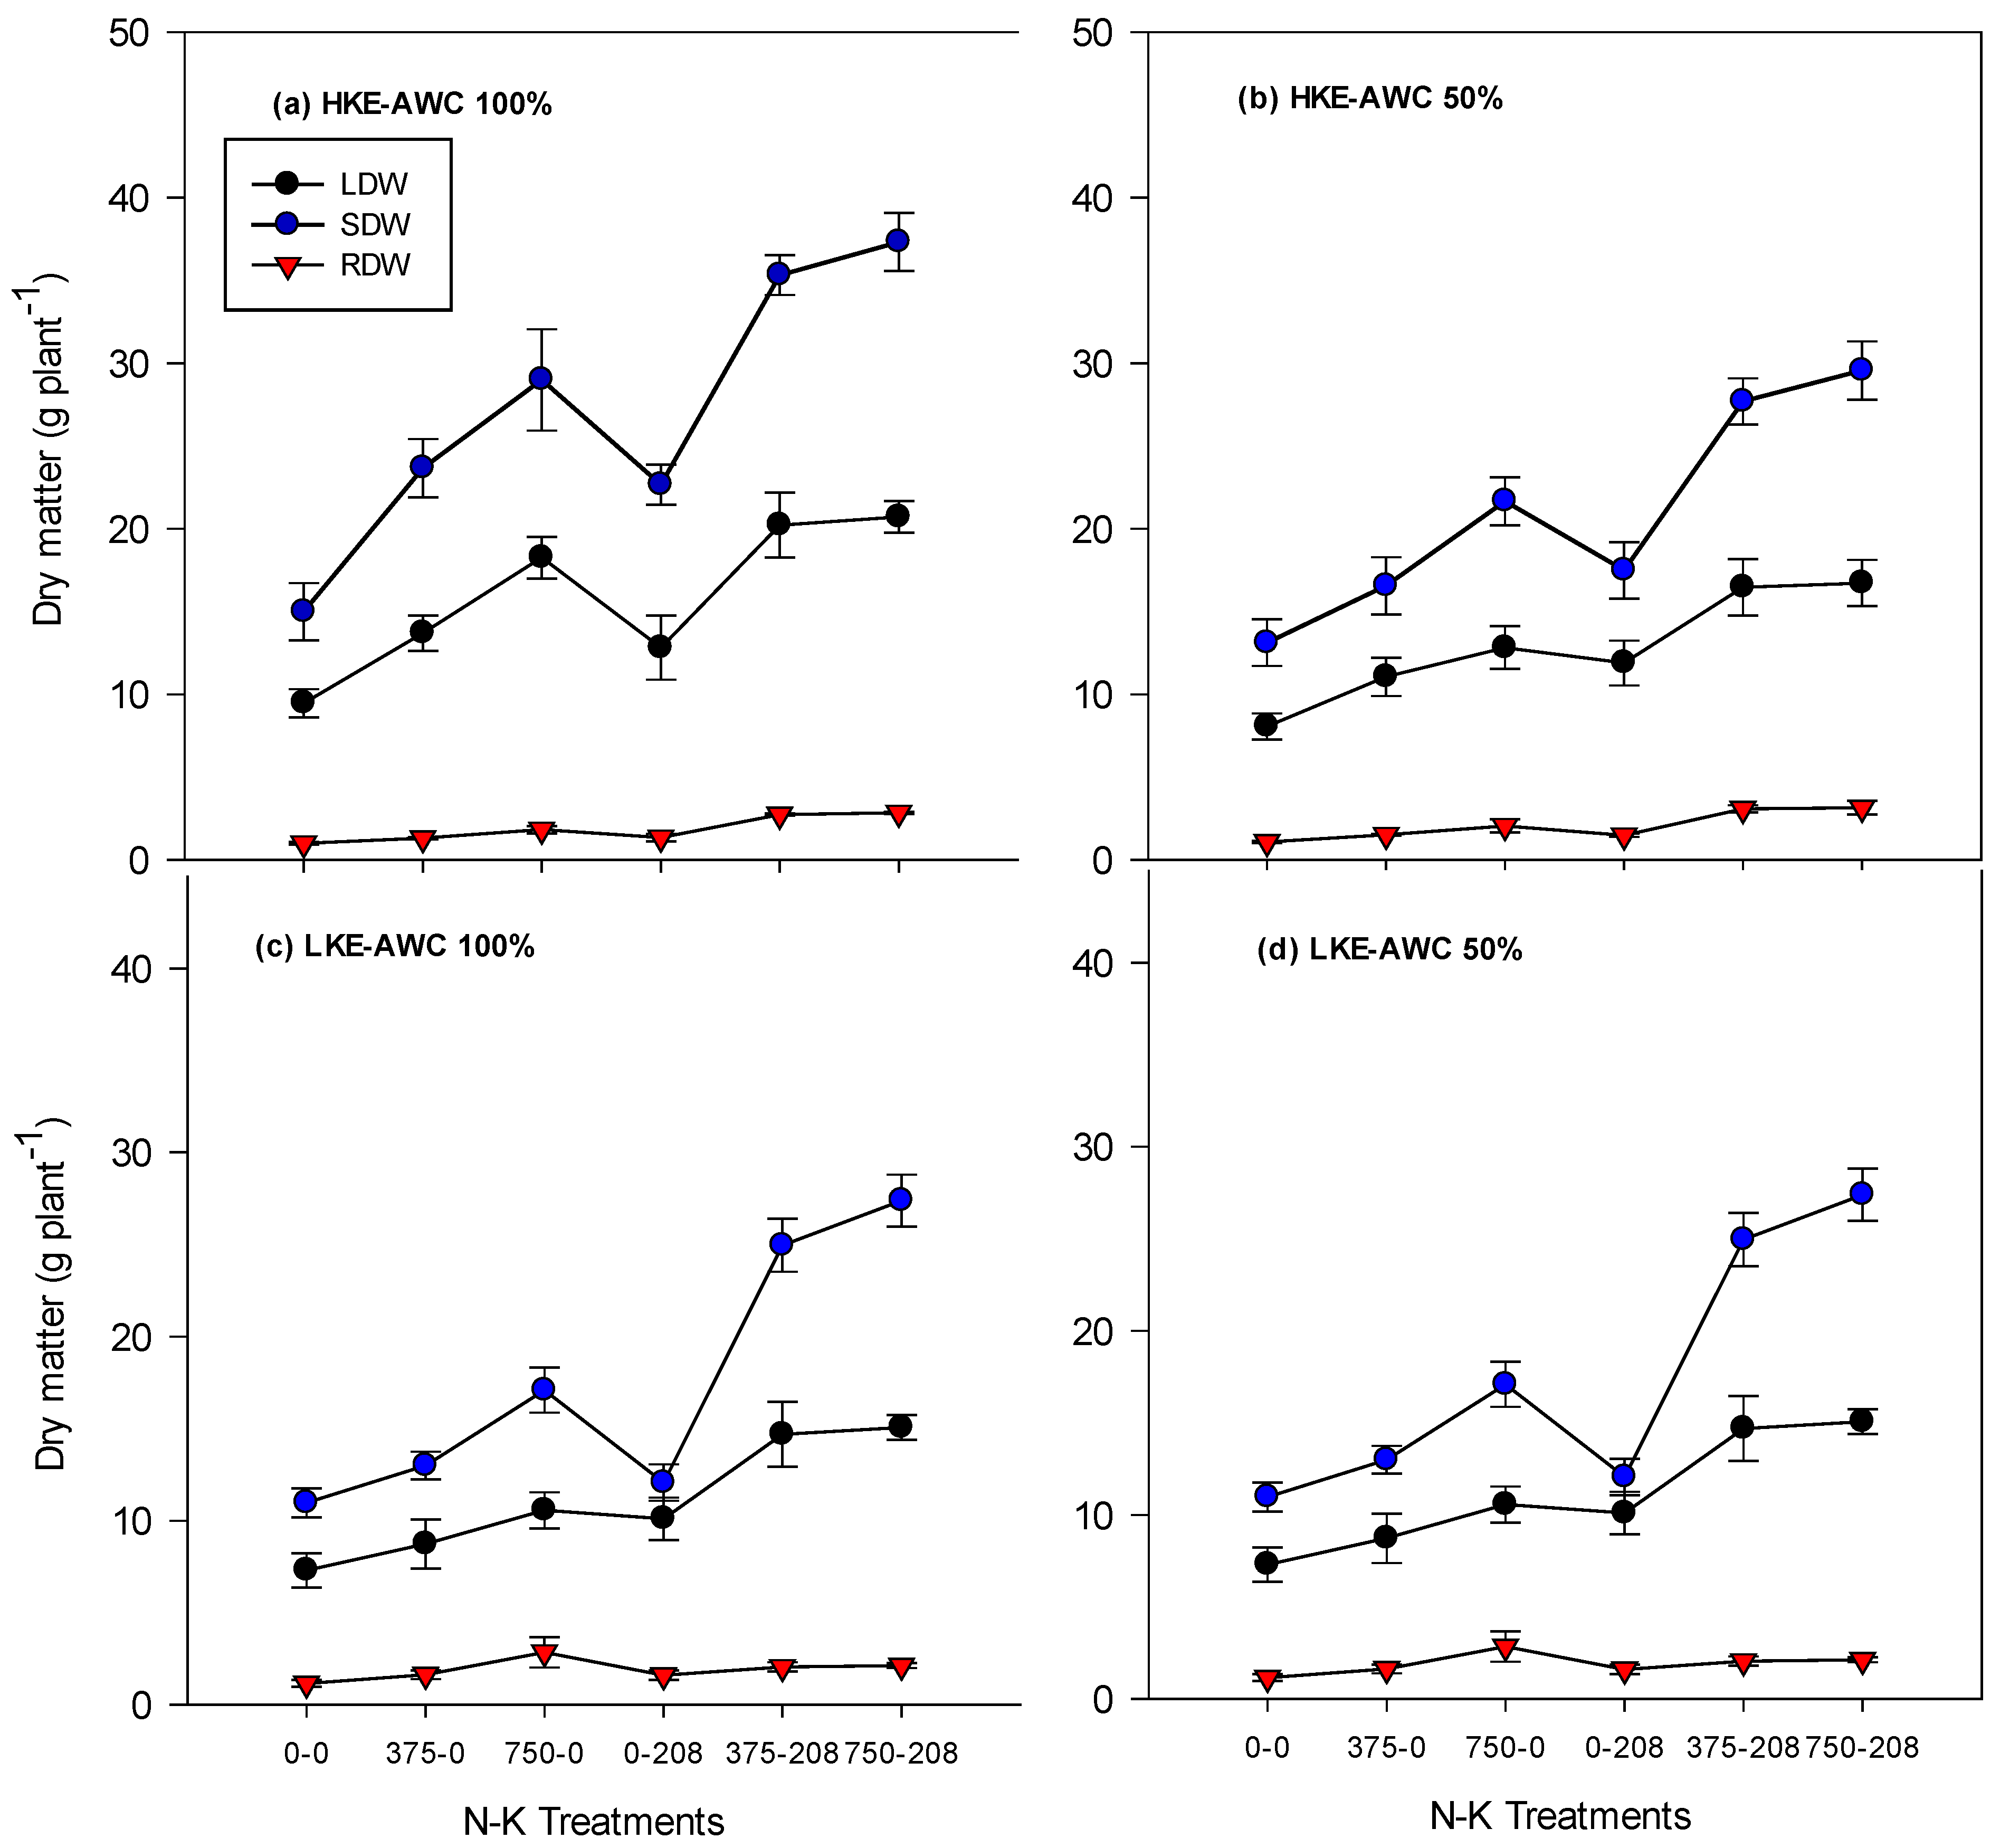
3.1. Effect of Applied Nitrogen and Potassium on Plant Dry Biomass of Two Cotton Cultivars under Varied Irrigation Levels

Application of K, along with N, significantly improved all the components of plant dry weight (PDW) in both cotton cultivars, i.e., CIM-554 and FH-901, at normal and reduced irrigation levels compared with the sole application of N or K (Figure 1a–d). However, the HKE cultivar, CIM-554, showed significantly higher PDW as compared with the LKE cultivar, FH-901, at both irrigation levels. Figure 1 also explains that HKE and LKE cultivars produced leaves dry weight (LDW) of 9.5 and 8.5 g plant−1 in a sole N application, which increased to 20.7 and 17.8 g plant−1, respectively, at combined levels of NK@750:208 under the normal irrigation level of AWC100%. A similar trend was also observed in LDW under AWC50% in LKE cultivar due to the application of K compared with a sole N application. The combined application of N and K caused 2–3-fold increase in shoot dry weight (SDW) plant−1 in both HKE and LKE cultivars at AWC100%, respectively. The SDW in both cultivars was also improved at AWC50%, due to the combined application of N and K. Like LDW and SDW, root dry weight (RDW) also showed significant increases in both cultivars at normal and reduced irrigation levels, due to the addition of K along with N rate. A synergetic effect was observed between N and K, as K efficiency for enhancing dry matter increased with an increase in N rate (Figure 1). Overall, the addition of N to K rates significantly increased the total plant dry weight (TPDW) by 139% and 117% in HKE and LKE cultivars at AWC100%, respectively, whereas, HKE and LKE cultivars showed 112% and 131% higher TPDW, respectively, at AWC50%. It was observed that HKE cultivar produced higher LDW (15.8%), SDW (17.4%), RDW (20.9%), and TPDW (17.8%) at AWC100% due to K fertilization, which was statistically at par when comparing these at reduced irrigation level (AWC50%). The effect of N:K rates of 375:208 and 750:208 mg pot−1 were statistically non-significant but were the highest among the treatments.

3.2. Gas Exchange Characteristics and Physiological Water Use Efficiency

The effect of K addition was significant on leaf gas exchange characteristics, such as net photosynthetic rate (PN), transpiration rate (E), stomatal conductance (gs), and physiological water use efficiency (PWUE). There was a significant difference among K-treated and untreated plants for gaseous exchange characteristics and water use efficiency (WUE) (Table 1). At AWC100%, treatment N:K (750:208) showed 46% and 32% increase in PN in HKE and LKE cotton cultivars compared with control treatment, respectively. Similar improvements in PN at AWC50% were also noted due to the combined application of K and N. The similar changes were also recorded in the transpiration rate of both cultivars at normal and reduced irrigation levels (Table 1). The gs increased from 60.1 to 86.6 mmol CO2 m−2S−1 in HKE cultivar and from 54.3 to 72.4 in LKE cultivar, under AWC100%, with the increase in N:K levels from 0:0 to 750:208, respectively. Under AWC50%, gs increased from 53.1 to 71.1 in HKE cultivar and from 47.7 to 66.7 in LKE cultivar as the N:K levels were increased from 0:0 to 750:208, respectively. The PWUE increased from 7.34 to 9.62 in HKE and from 7.27 to 8.42 LKE cultivar under AWC100%, while in AWC50%, PWUE increased from 6.38 to 8.30 in HKE and from 5.97 to 8.13 in LKE in N:K levels of 750:208 over control (0N:0K). A comparison of data for gas exchange characteristics and PWUE showed that the applied N:K levels 375:208 and 750:208 were statistically similar to but superior to all other N:K levels and significantly (p < 0.05) better in both cultivars and irrigation levels. The moisture regime AWC50% showed an average decrease of 16.9% in PN, 2.61% in E, 12.9% in gs, and 14.9% in PWUE in HKE cultivar, while there was a 19.6%, 9.66%, 17.2%, and 11.1% decrease in PN, E, gs, and PWUE, respectively, in the LKE cultivar. A comparison of both the cultivars shows that HKE cultivar exhibited higher PN by 12.9%, E by 1.69%, gs by 24.4%, and PWUE by 11.1% at AWC100%, while increases of 16.8%, 9.63%, 30.9%, and 6.29% were found in PN, E, gs, and PWUE, respectively, at AWC50% than LKE, on an average basis.

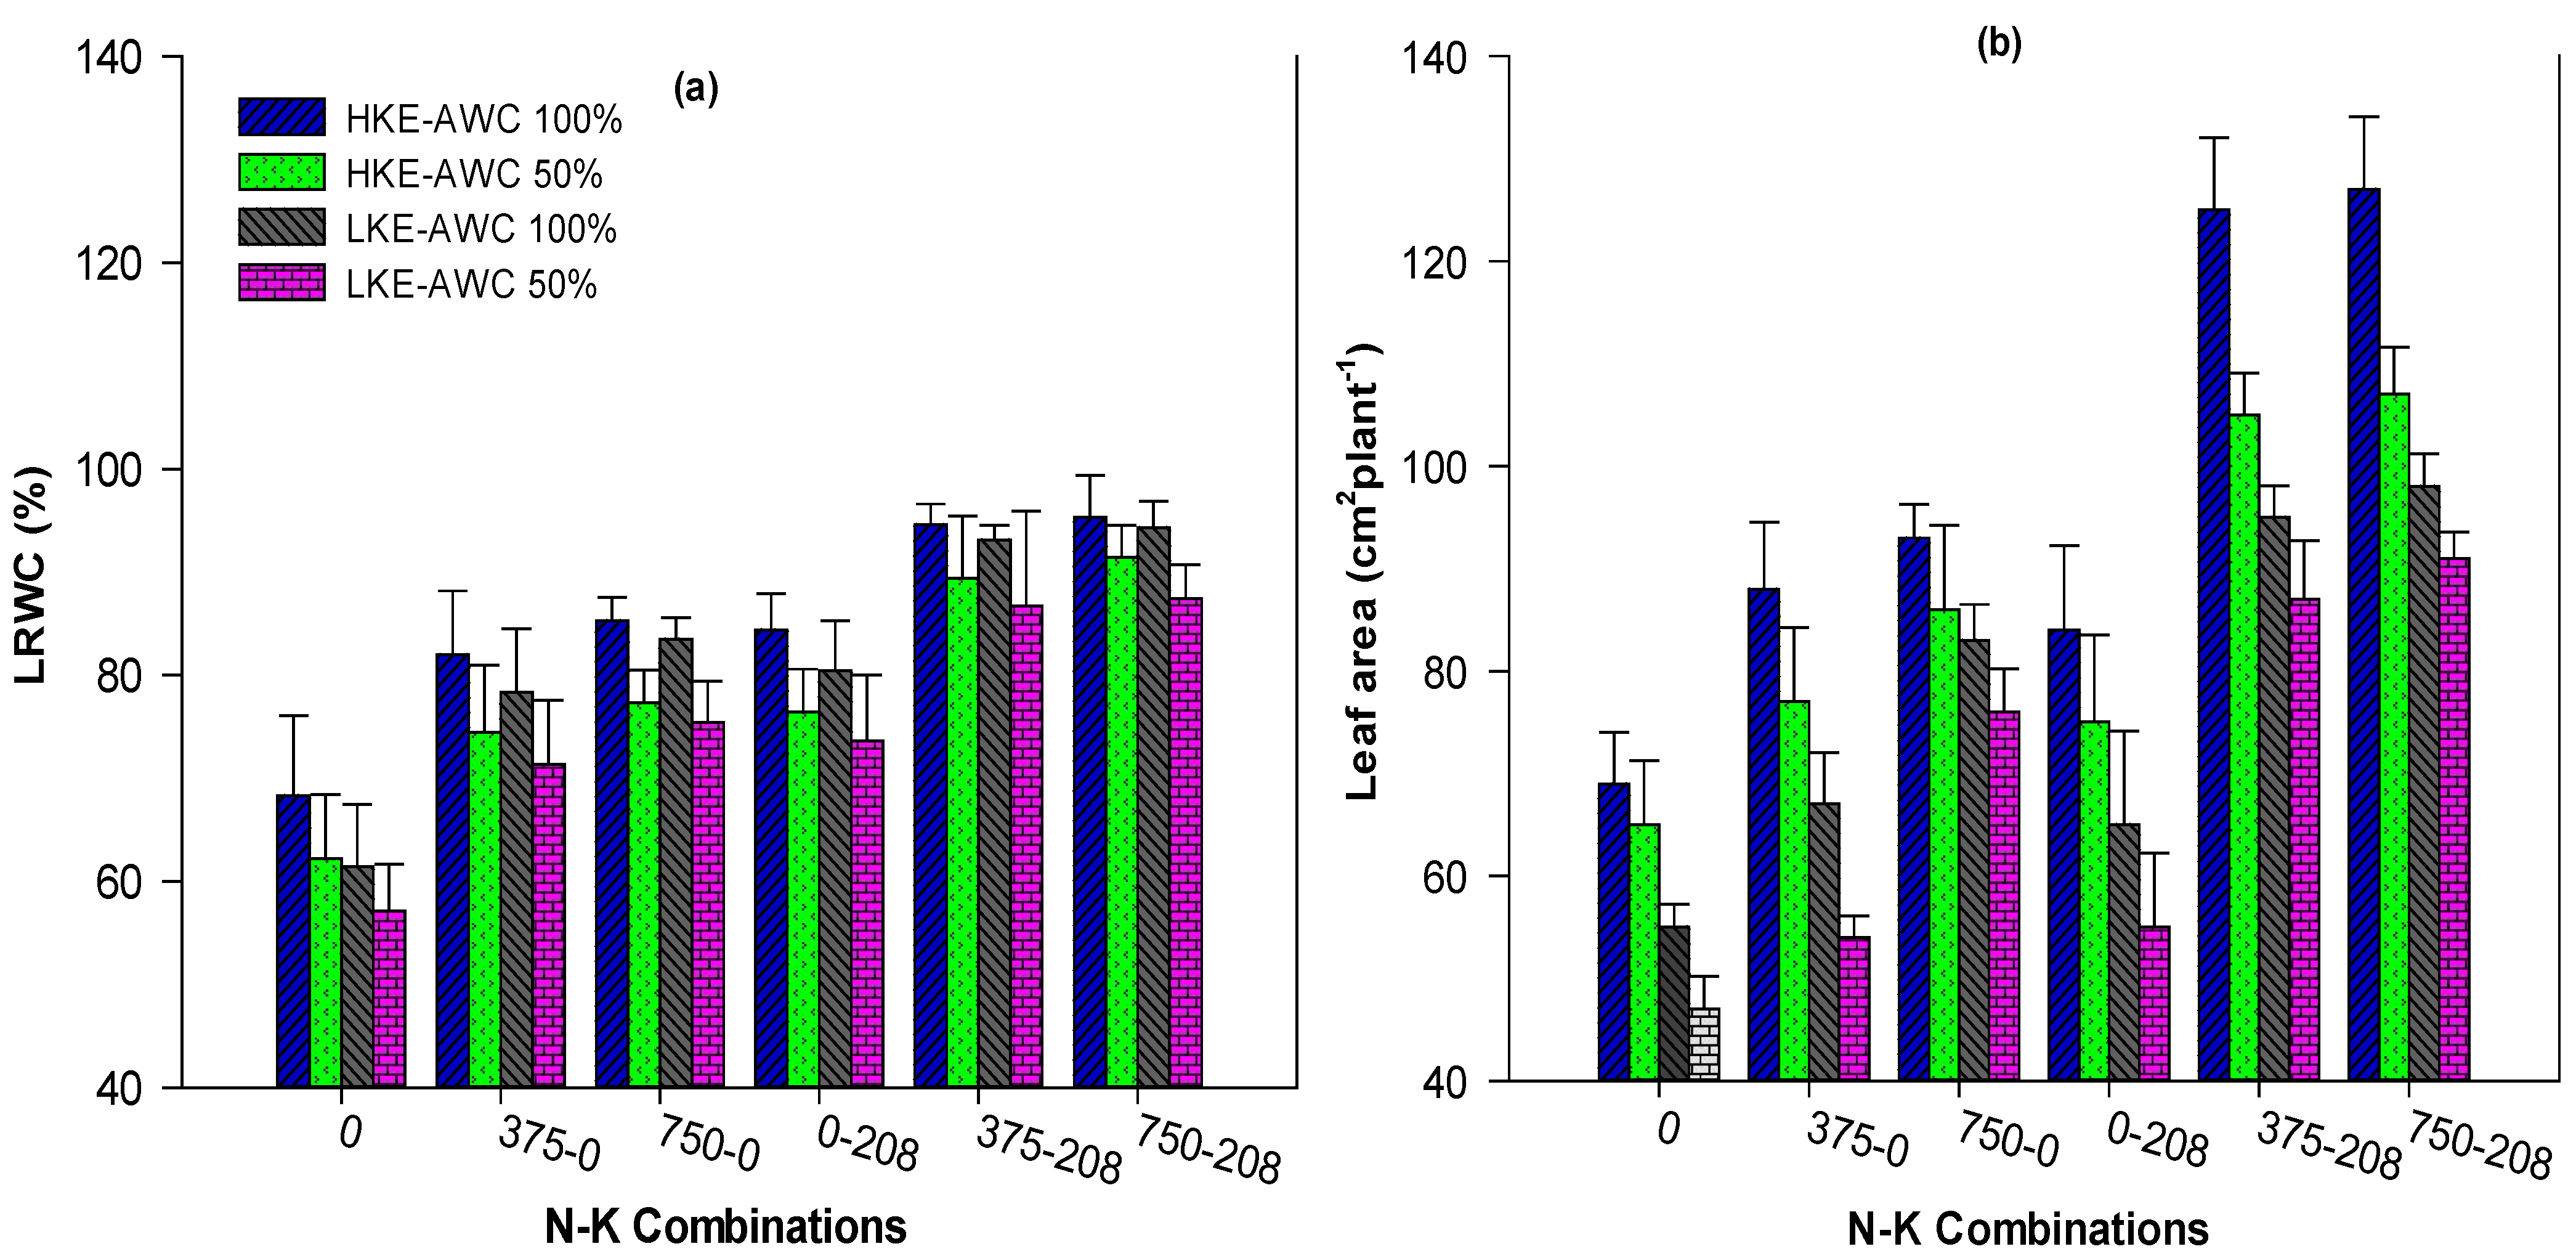
3.3. Leaf Relative Water Content (LRWC) and Leaf Area (LA)

Significant variations in LRWC and LA were recorded due to the combined application of N and K rates in both cotton cultivars at 100% and 50% AWC (Figure 2a,b). At AWC100%, N:K (750:208) combination increased LRWC in HKE cultivar by 39%, while in the LKE cultivar, it was 52% when compared with the control treatment. Contrary to control (0-0 N-K), LRWC under AWC50% were enhanced by 49% in HKE, while this was 52% in LKE cultivar in response to combined application of 750-208 mg/pot N-K (Figure 2a). Similar changes in LA were also recorded due to the combined application of N-K compared with control in both cultivars of cotton at 100% and 50% moisture levels (Figure 2b). In a nutshell, N-K applied as 375-208 and 750-208 were statistically at par, but were the best among the treatments, significantly (p < 0.05) improving LRWC and LA in both cultivars and at two water regimes. The moisture regime AWC50% reduced the studied parameters, thereby causing an average decrease of 7.7% in LRWC, and 12.2% in LA in the HKE cultivar, whereas in the LKE cultivar, the decreases in LRWC and LA were 8.2% and 11.7%, respectively. Results also indicated that HKE cultivar had 3.7% and 27.3% higher LRWC and LA than LKE, respectively, under normal irrigation levels, while they had 4.3% and 26.5% more LRWC and LA, respectively, at reduced irrigation levels, when compared with the LKE cultivar (Figure 2).

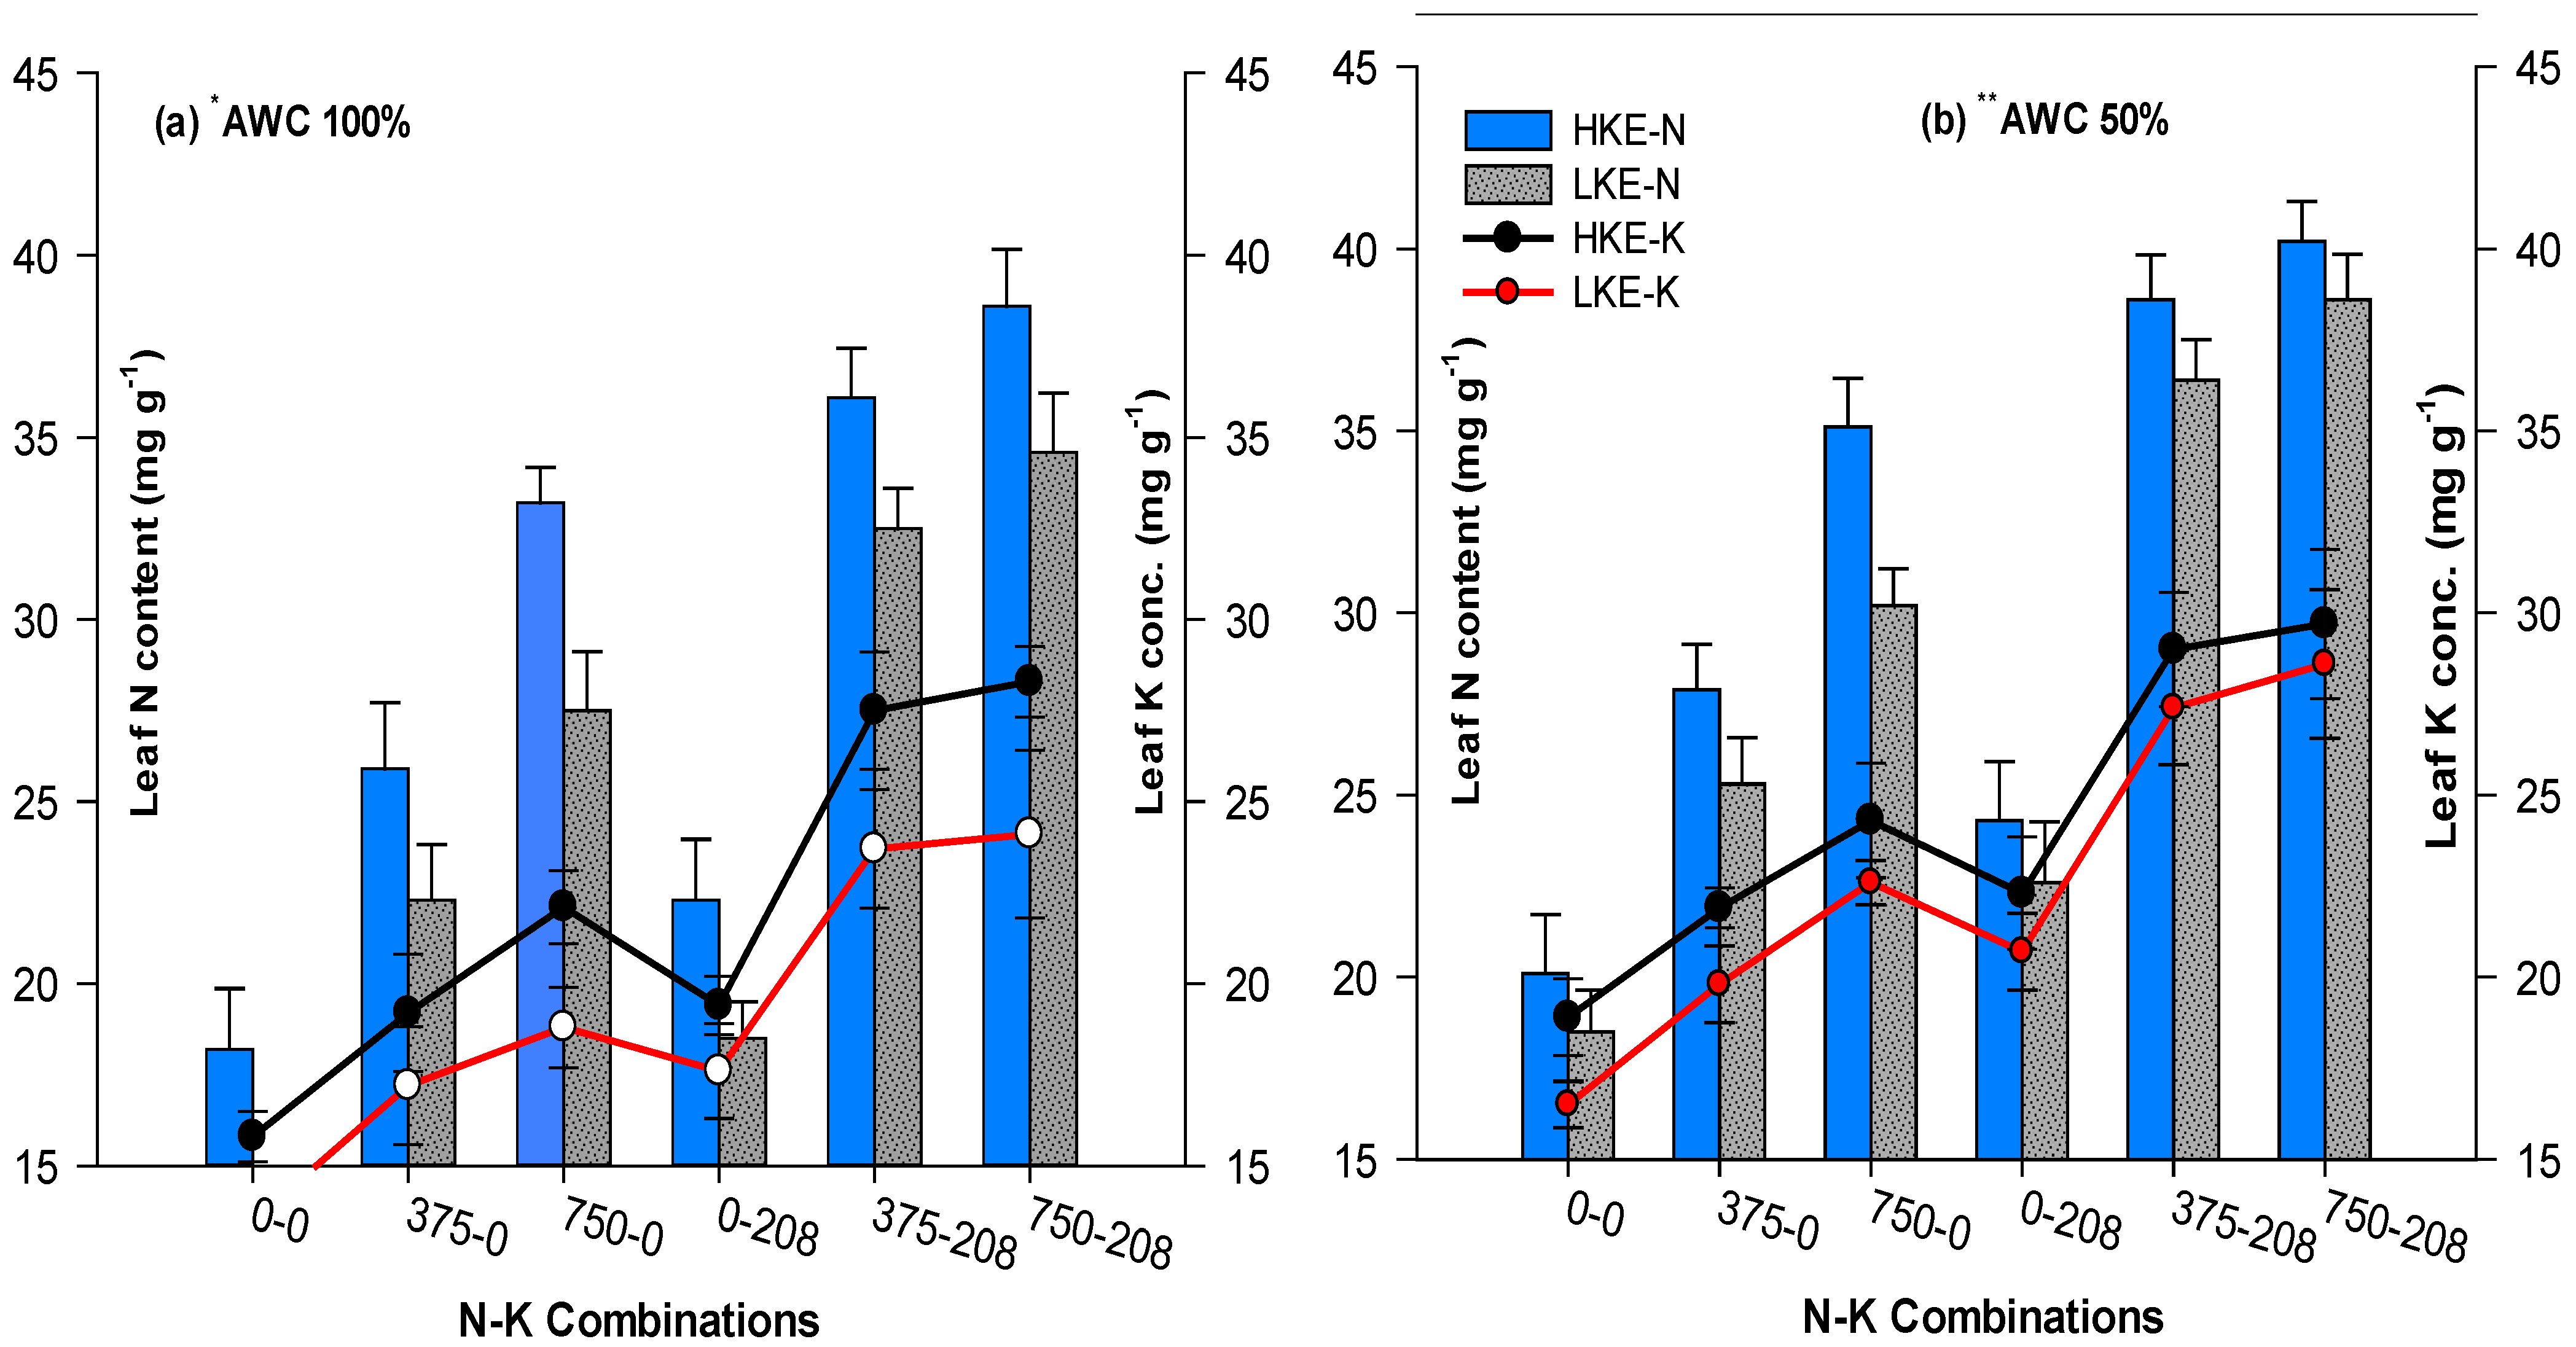
3.4. Plant Nutrient Contents and Uptakes

Fertilization of K also significantly promoted N contents and N uptake compared with treatments without K application (Figure 3a,b). Significant variations in N and K contents and uptake were recorded in two cotton cultivars. Figure 3 showed the higher nutrient contents and uptake in HKE cultivars compared with LKE cultivars. Although moisture levels affect N and K contents/uptake yet the differences at AWC100% and AWC50%, moisture levels were not significant, indicating that genetic variation in cultivars can be exploited to select and develop cultivars efficient in use of N and K fertilizers (Figure 3a,b). On average, across cultivars, HKE cultivar maintained 6.7% and 18.6% in N:K contents under AWC100%, while maintaining 12.1% and 13.3% in N:K contents, under AWC50 %, respectively, compared with LKE (Figure 3a,b). Similar trends were also observed in N:K uptakes between HKE and LKE cultivars at both irrigation levels (Table 2).

3.5. Yield Components and Seed Cotton Yield

The data shown in Table 3 elucidates that applied N-K levels significantly (p ≤ 0.05) affected the seed cotton yield (SCY) and mean boll weight (MBW) in both cotton cultivars at AWC100% and AWC50%. Compared with the control treatment (0:0), applied N:K (750:208) significantly enhanced SCY from 10.5 to 31.5 g plant−1 in HKE and from 8.3 to 25.8 g plant−1 in LKE cultivar. Similar variations in SCY were also observed under AWC50% in both cultivars of cotton. The total number of bolls and an average weight per boll were also increased due to the combined application of N and K rates compared with the sole application of N in both cultivars (Table 3).
The comparison of both the cultivars shows that HKE cultivar produced greater SCY by 25.3%, number of bolls by 28.6%, and mean boll weight by 6.48% in AWC100%, while there was 29.8%, 40.0%, and 5.16% more SCY, number of bolls, and mean boll weight, in AWC50%, respectively, compared with the LKE cultivar. The statistical analysis ranked N:K @375:208 and N:K@750:208 mg pot−1 as the most effective treatments, based on the main and interactive effects of N:K levels, cotton cultivars, and irrigation levels.

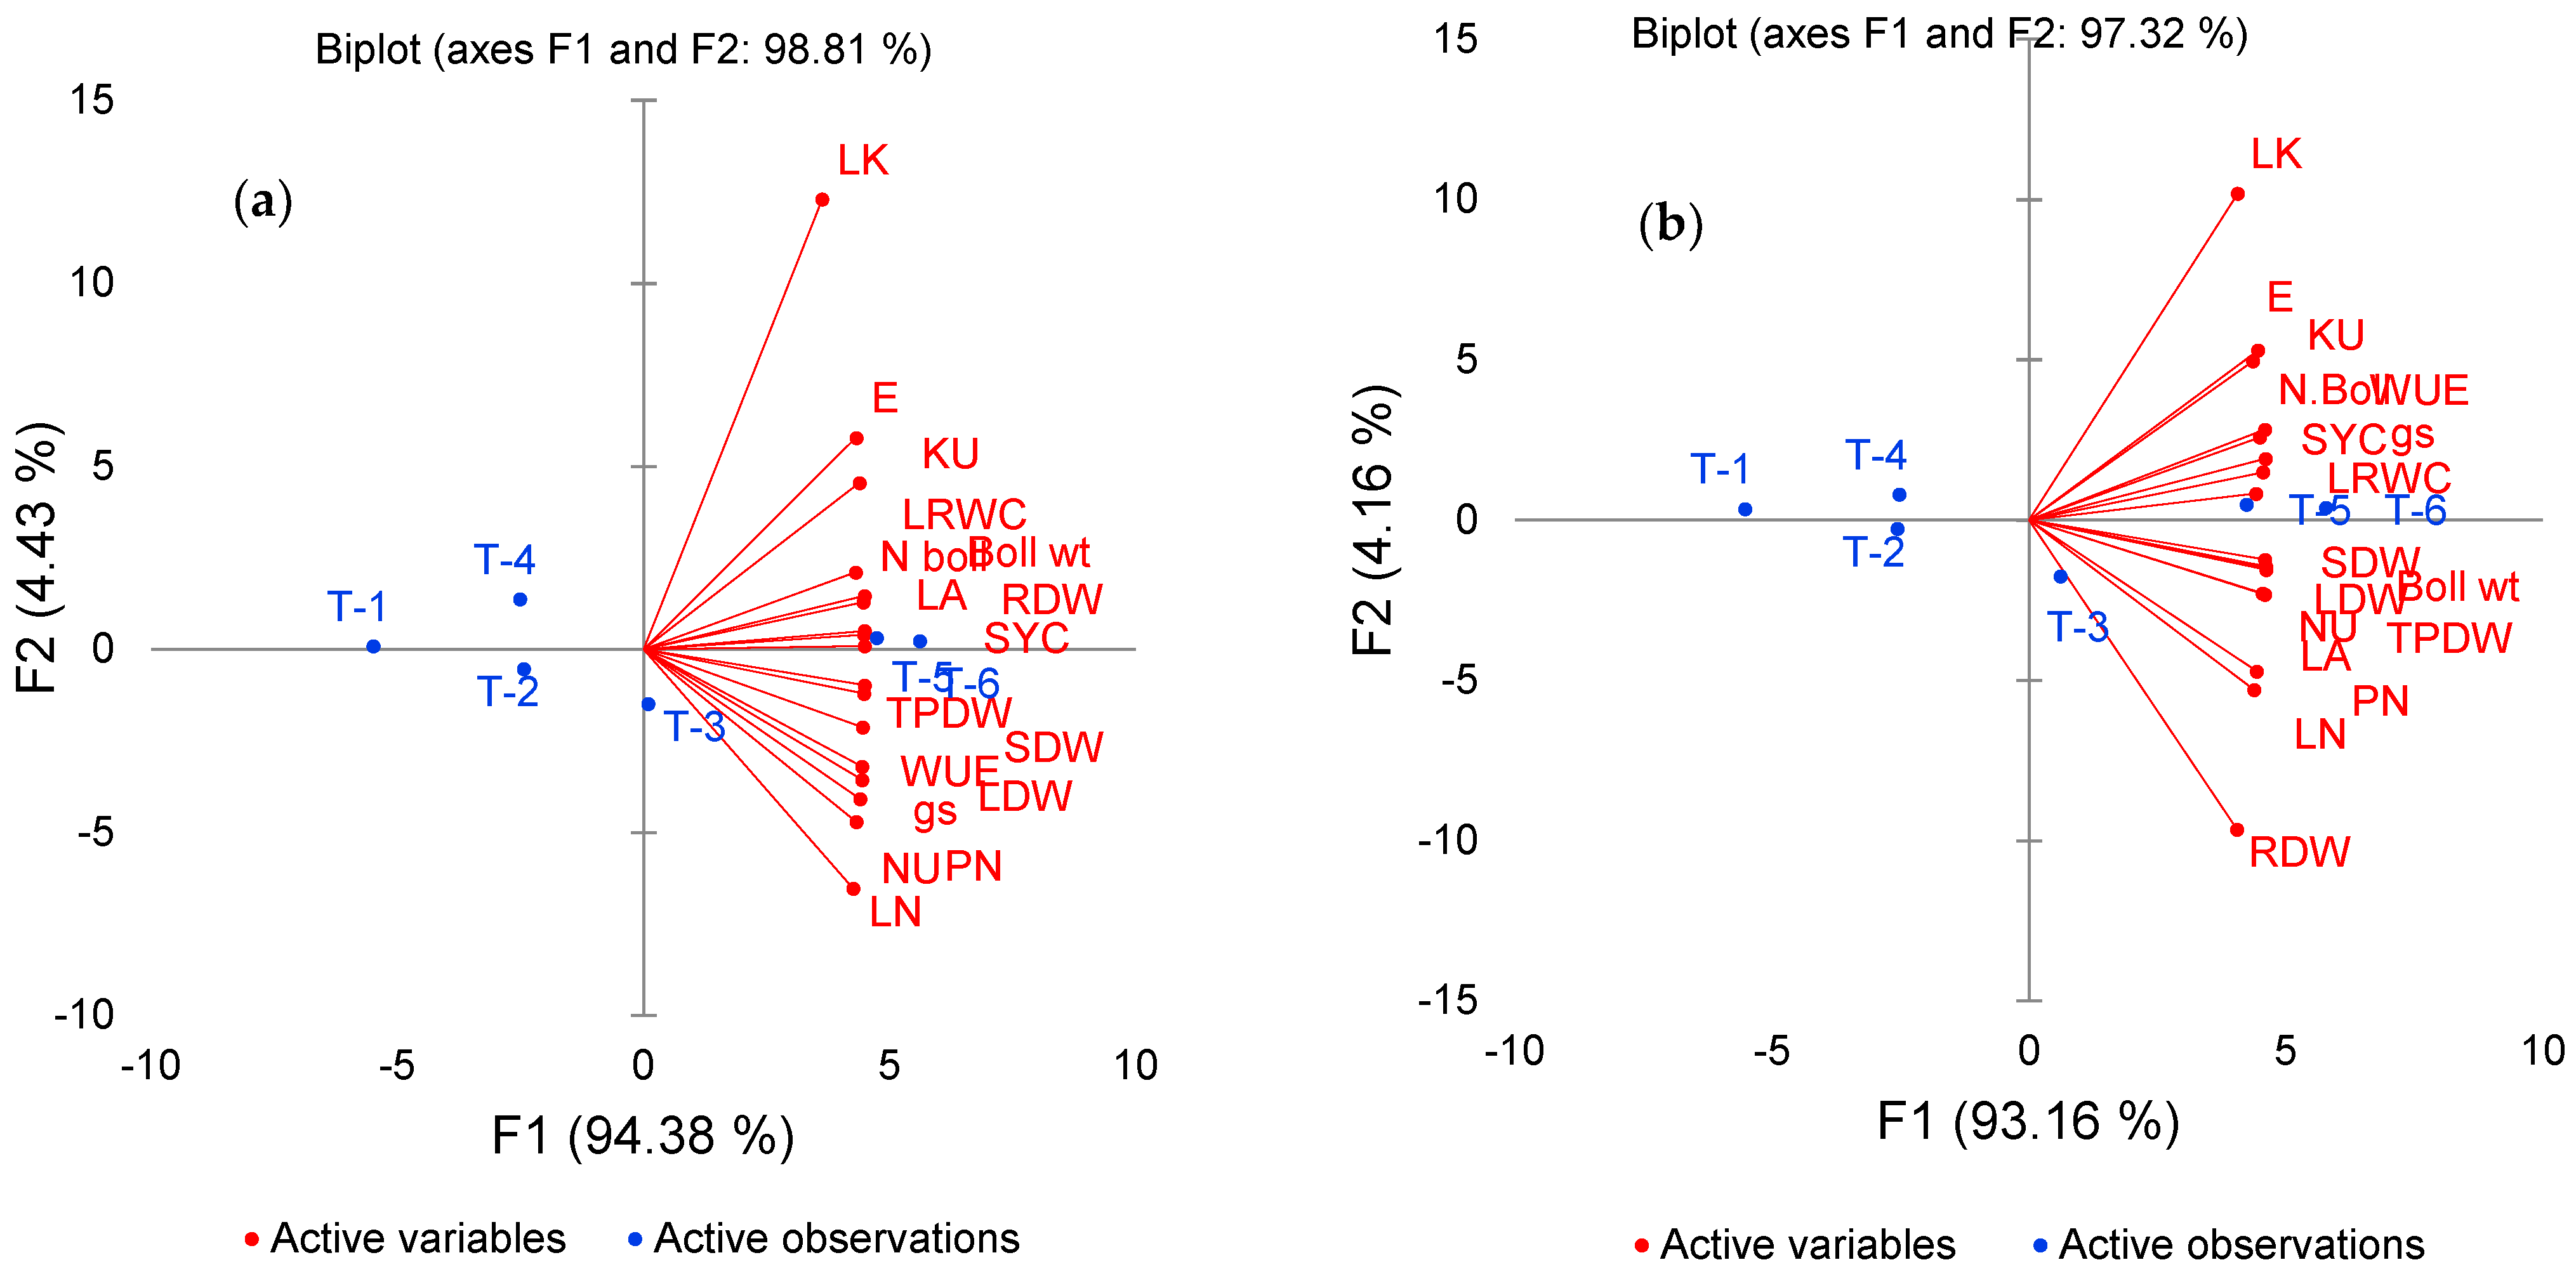
3.6. Nutrient-Use Efficiency Indices and Their Correlation Traits and in PCA Biplot

Recovery efficiency is an indicator of nutrient recovery from soils by plant roots. Mean N apparent recovery efficiency (NARE) ranged from 36 to 41% in sole N application, which was increased from 64 to 89% under combined application of N and K (Table 4). Similarly, the mean K apparent recovery efficiency (KARE) was 46% under sole K application but increased to 137% when K was applied with N (Table 4). This indicates how N and K synergistically affect each other’s apparent recovery efficiency. At a 100% available moisture level, the values of NARE and KARE were higher than these values at reduced moisture level (Table 4). Similarly, mean N-utilization efficiency in sole N treatments ranged from 7.5 to 8.0 mg mg−1 but it ranged from 9.4 to 16.2 mg mg−1 in combined NK treatments (Table S3). Similarly, 10.2 mg mg−1 mean K-utilization efficiency in sole K treatment was increased to 15.6 and 29.2 mg mg−1 due to application of K along with N, respectively. Table S3 also reveal that the K-utilization efficiency at reduced moisture level (9.40 mg mg−1) was higher than at the 100% available moisture level (8.75 mg mg−1), and a reverse trend was observed in N-utilization efficiency (Table S3). This explains the physiological role of K in NUE under drought stress conditions. Higher physiological nutrient-use efficiency indicates the poor conversion of absorbed nutrients into plant biomass. Physiological nitrogen-use efficiency showed a significant reduction due to K application (Table S4). The values of NPUE in sole N treatments were higher, i.e., 17.9–18.2 mg mg−1, which reduced to 14.0 and 16.7 mg mg−1 due to combined application of N and K fertilizers. Similarly, higher KPUE (17.1 mg mg−1) was found in sole K treatment, while lower KPUE (9.9 to 15.4 mg mg−1) was found in combined NK treatments (Table S4). The effect of moisture level on NPUE and PKUE was statistically significant. Table S4 showed lower values at 100% available moisture level, while higher values were found at reduced moisture level (Table S4). Similar trends were found in NIE and KIE variations (shown in Table S4) and are discussed in the sections on NAUE and KAUE in Table 4.
It was observed that the N and K uptake was strongly correlated with water use efficiency under both irrigation levels (Supplementary Figure S1). Among cotton cultivars, the HKE cultivar showed a strong positive correlation (r = 0.97**) (p ≤ 0.01) between water use efficiency (WUE) and nitrogen and potassium uptake, while a low value of correlation coefficient was recorded in the LKE cultivar when WUE has correlated with N and K uptake (Supplementary Figure S2). Similarly, a strong positive correlation (Table S2) was observed (r = 0.966** and 0.970**) (p ≤ 0.05) between seed cotton yield (SCY) and N and K uptake at AWC100%, whereas it was r = 0.987** and 0.985** at AWC50% (Table S5). Most of the nutrient-use efficiency indices showed a positive correlation between each other at AWC50%, as presented in Table S5. The seed cotton yield was also showed positive correlation with NAE (nitrogen agronomic efficiency), KAE (potassium agronomic efficiency), NARE (nitrogen apparent recovery efficiency) and KARE (potassium apparent recovery efficiency) at AWC50% Table 5. The principal component analysis (PCA) biplot of different morphophysiological traits of HKE and LKE cultivars (Figure 4a,b) showed that two PCs were explaining 98.81% and 97.32% of the variation, respectively. The first PC explained 94.38% and 93.16% variation in HKE and LKE cultivar, respectively. The loading of variables in different components are presented in Figure 4a,b, which show the interrelationship of active variables and active observations.

4. Discussion

4.1. Interaction between Growth and Yield of Cotton with NK Nutrition under Varied Soil Mositure Levels

Significant improvements were recorded in cotton production due to the combined application of NK nutrients as compared with a sole application of N or K. For better understanding, Pearson’s correlations among different growth traits and yield parameters, nutrient uptake, and nutrient-use efficiency are given in Supplementary Materials, Tables S2 and S5. It is well known that dry biomass is positively correlated with seed cotton yield [32] due to its strong association with N and K uptake. Significant differences in growth and yield occurred due to the combined application of NK as compared with a sole N or K application. These effects might be due to the physiological roles of K in plants in enzyme activation and nutrient balances, and the synergistic effects of K on N uptake [33]. Poor growth and yield of plants treated with sole N might be due to the inactivation of certain enzymes, which might have been activated when the plants received adequate K supply. Pearson’s correlation also suggests a strong relationship between K-use efficiency, growth, and yield parameters in both cultivars [34].
It is well documented that the K uptake in plants is under genetic control and considerable variation has been reported even within species [32]. This revealed that K had an important role in a plant to mitigate the adverse effect of reduced irrigation (AWC50%). Similar findings were also reported in earlier studies, where K stimulated translocation of photosynthates towards reproductive organs in cotton [35] and rice [32].

4.2. Interaction between Morphophysiological Traits and NK Nutrition under Varied Soil Moisture Regimes

The maintenance of comparatively higher RWC (%) by HKE cultivars with supplied NK levels permitted greater stomatal conductance (gs) and elevated CO2 intake compared with LKE cultivars under no K application (Figure 2). The role of K in regulation of stomatal opening by altering the osmotic potential of the guard cells is a well-recognized mechanism [36]. In our study, HKE cotton cultivars, on an average basis, showed 6.3% greater water use efficiency (WUE) under AWC50% as compared with LKE cultivars. Similarly, the HKE cultivars recorded a 31% average increase in WUE over the control when provided with N:K@ 750:208; meanwhile, on average, with the HKE and LKE cultivars, there was an increase of 22% in WUE when supplemented with N750:K208, as compared with N750:K0, and a positive correlation was noted (r = 0.98) among WUE and K uptake under low moisture level of AWC50% (Supplementary Figure S1). The increase in WUE under reduced irrigation might be due to enhanced K uptake, which controlled the regulation of the opening and closing of the stomata—in turn, reducing the loss of water by transpiration [22]. K is also involved in enzyme activation and other physiological processes, which improve the water use efficiency in plants [37]. Similar findings have been documented in earlier studies, where K nutrition improved the morphophysiological traits of cotton cultivars [22,35,38,39,40,41].

4.3. Relations between NUEI and Nutrient Uptake with NK nutrition under Varied Soil Moisture Regimes

There are number of indices which are used to assess the efficiency of applied nutrients [28,29,42,43,44] and exhibit crop response to NK application. In this study, agronomic efficiencies (NAE and KAE), recovery efficiencies (NARE and KARE), and utilization efficiencies (NUE and KUE) are suitable indices for evaluation of NUE, when crop yield in NK treatments applied was different from the control under variable irrigation levels. Similarly, physiological efficiencies (NPE and KPE) and internal utilization efficiencies (NIE and KIE) could be used for comparisons among cultivars under specific growth conditions. The AE, PE, and IUE for both N and K decreased with the increase in the levels of NK under varied moisture regimes (Table 4, Tables S3 and S4).
This means that K-efficient cultivar produced maximum yields under both irrigation levels at all NK nutrient ratios applied, and can manage with a limited water environment without yield loss. Our results are in line with previous studies, as reported in the literature [8,28,29,30].

4.4. Interaction between Potassium and Nitrogen-Use Efficiency under Varied Soil Moisture Regimes

The integrated NK application proved to be a low-cost technology to achieve the highest yield, crop quality, and NUE in agriculture [8]. Nitrogen-use efficiency was reported to be increased from 10% to 90% with the K application on K deficient soils [44]. In our study, the APR efficiency of N was improved from 85 to 105% in the HKE cultivar with the application of N:K @375:208 mg pot−1 at AWC100% (Table 4). A positive interaction between N and K was recorded for N uptake and utilization by plants that ultimately affect the quality and yield of crops [45]. The high K-efficiency (HKE) cotton cultivars showed greater potential to maintained physiological processes under reduced irrigation. The positive correlation of integrated NK application in cotton crop can reduce the dose and cost of nitrogen fertilizer and ensure food security for the fast-growing global population. Therefore, the application of an optimal dose of N with K, at the right time, can improve NUE and reduce emissions of greenhouse gases in the environment—mitigating climate change. Furthermore, the combined application of NK can reduce irrigation water demand up to 35% in cotton without significant yield loss in arid climates. Our results revealed (Table S5) that the total nitrogen uptake (NU) was highly correlated with total potassium uptake (KU). Our results are in line with previous studies [8,45].

5. Conclusions

Our findings suggest that the selection of HKE cultivars with adequate K application has the potential to improve nitrogen-use efficiency and save considerable quantities of fertilizer and irrigation water, up to 35% in cotton, without yield loss under arid climatic conditions. A positive interaction exists between N and K for N uptake and utilization by cultivars for production of biomass and increased seed cotton yield under reduced irrigation, which is ultimately more profitable for farmers. Therefore, it can be concluded that the application of N:K@375:208 mg pot−1 to HKE cotton cultivars under reduced irrigation is helpful in maintaining the yield of cotton under arid and semi-arid environments. This also mitigates climatic change by reducing the greenhouse gas emissions, through increasing nitrogen-use efficiency in intensive agriculture production systems. Therefore, to achieve greater NUE and to save our environment, the application of K along with N nutrition, in balanced quantities, is important.

Supplementary Materials

The following supporting information can be downloaded at: https://www.mdpi.com/article/10.3390/agronomy12020502/s1, Table S1. Soil analysis characteristics used in pot. Table S2. Pearson’s correlation matrix for nutrient use efficiency indices determining nutrient efficiency of cultivars under AWC-100%. Table S3. Effect of applied N: K levels on nutrient utilization and agronomy efficiency in cotton cultivars under varied irrigation levels. Table S4. Effect of applied N: K levels on physiological and internal utilization efficiency in cotton cultivars under varied irrigation levels. Table S5. Pearson’s correlation matrix for nutrient use efficiency indices determining nutrient efficiency of cultivars under AWC-50%. Figure S1. Correlation between water use efficiency and nitrogen and potassium uptake of cultivars under varied irrigation levels. Figure S2. Correlation between water use efficiency and nitrogen and potassium uptake of cultivars.

Author Contributions

Conceptualization, M.N.A.; data curation, T.U.-H., M.I. and W.A.; formal analysis, M.I., W.A., A.G. and M.S.; funding acquisition, T.U.-H., F.A., M.I., A.G., M.S., H.A. and M.K.O.; investigation, M.N.A., T.U.-H., F.A., M.I., W.A. and M.K.O.; methodology, M.S., H.A. and M.K.O.; project administration, M.N.A., F.A., A.G., H.A. and M.K.O.; software, M.H.S.; supervision, S.A.; writing—original draft preparation, T.U.-H., F.A., M.H.S. and S.A.; writing—review and editing, M.H.S. and S.A. All authors have read and agreed to the published version of the manuscript.

Funding

This research received no external funding.

Institutional Review Board Statement

Not applicable.

Informed Consent Statement

Not applicable.

Data Availability Statement

Not applicable.

Acknowledgments

This research was partially supported by the MNS-University of Agriculture, Multan, Pakistan, under the Postgraduate Program. The authors would like to extend their sincere appreciation to the MNS University of Agriculture, Multan, and the Central Cotton Research Institute (CCRI), Multan. The authors extend their appreciation to the Researchers Supporting Project number (RSP-2021/374) King Saud University, Riyadh, Saudi Arabia.

Conflicts of Interest

The authors declare that there are no conflicts of interest.

References

  1. Wells, M.L.; Wood, B.W. Relationships between leaflet nitrogen: Potassium ratio and yield of pecan. HortTechnology 2007, 17, 473–479. [Google Scholar] [CrossRef]
  2. Brar, M.S.; Singh, B.; Bansal, S.K.; Srinivasa, R. Role of Potassium Nutrition in Nitrogen Use Efficiency in Cereals; e-ifc No. 29; IPI: Bern, Switzerland, 2011. [Google Scholar]
  3. Shah, Z.; Ahmad, S.R.; Rahman, H.; Shah, M.Z. Sustaining rice-wheat system through management of legumes. II. Effect of green manure legumes and N fertilization on wheat yield. Pak. J. Bot. 2011, 43, 2093–2097. [Google Scholar]
  4. Leigh, R.A.; Wyn Jones, R.G. A hypothesis relating critical potassium concentrations for growth to the distribution and functions of this ion in the plant cell. New Phytol. 1984, 97, 1–13. [Google Scholar] [CrossRef]
  5. Wang, Y.; Wu, W.H. Potassium transport and signaling in higher plants. Annu. Rev. Plant Biol. 2013, 64, 451–476. [Google Scholar] [CrossRef] [Green Version]
  6. Epstein, E.; Bloom, A.J. Mineral Nutrition of Plants: Principles and Perspectives, 2nd ed.; Sinauer Associates Inc.: Sunderland, MA, USA, 2005. [Google Scholar]
  7. Zorb, C.; Senbayram, M.; Peiter, E. Potassium in agricultur status and perspectives. J. Plant Physiol. 2014, 171, 656–669. [Google Scholar] [CrossRef]
  8. Fageria, N.K.; Barbosa Filho, M.P.; Da Costa, J.G.C. Potassium use efficiency in common bean genotypes. J. Plant Nutr. 2001, 24, 1937–1945. [Google Scholar] [CrossRef]
  9. Anas, M.; Liao, F.; Verma, K.K.; Sarwar, M.A.; Mahmood, A.; Chen, Z.L.; Li, Q.; Zeng, X.P.; Liu, Y.; Li, Y.R. Fate of nitrogen in agriculture and environment: Agronomic, eco-physiological and molecular approaches to improve nitrogen use efficiency. Biol. Res. 2020, 53, 47. [Google Scholar] [CrossRef]
  10. Khalifa, K.; Al-Chammaa, M.; Al-Ain, F. Effect of Potassium Fertilizers on Cotton Yield and Nitrogen Uptake Efficiency in an Aridisol. Commun. Soil Sci. Plant Anal. 2012, 43, 2180–2189. [Google Scholar] [CrossRef]
  11. Chudhry, A.U.; Sumra, S.G. Determination of Optimum Level of Potash and its Effects on Yield and Quality of Maize. Pak. J. Biol. Sci. 2000, 3, 1994–1995. [Google Scholar] [CrossRef]
  12. Ali, A.A.; Ikeda, M.; Yamada, Y. Effects of the Supply of K, Ca, and Mg on the absorption and assimilation of ammonium nitrogen and nitrate-nitrogen in tomato plants. Soil Sci. Plant Nutr. 1991, 37, 283–289. [Google Scholar] [CrossRef] [Green Version]
  13. Bruns, H.A.; Ebellhar, M.W. Nutrient uptake of maize affected by nitrogen and potassium fertility in a humid subtropical environment. Commun. Soil Sci. Plant Anal. 2006, 37, 275–293. [Google Scholar] [CrossRef]
  14. Brennan, R.F.; Bolland, M.D.A. Influence of potassium and nitrogen fertilizer on yield, oil and protein concentration of canola (Brassica napus L.) grain harvested in south-western Australia. Aust. J. Exp. Agric. 2007, 47, 976–983. [Google Scholar] [CrossRef]
  15. Yang, X.E.; Liv, J.X.; Wang, W.M.; Li, H.; Lno, A.C.; Ye, Z.Q.; Yang, Y. Genotypic differences, and some associated plant traits in potassium internal use efficiency of lowland rice (Oryza sativa L.). Nutr. Cycl. Agroecosyst. 2003, 67, 272–283. [Google Scholar] [CrossRef]
  16. Armstrong, D.I. Potassium interactions with other nutrients. Better Crops 1998, 28, 12–14. [Google Scholar]
  17. Geetha, V.; Varughese, K. Response of vegetable cowpea to nitrogen and potassium under varying methods of irrigation. J. Trop. Agric. 2001, 39, 111–113. [Google Scholar]
  18. Grzebisz, W.; Cermák, P.; Rroco, E.; Szczepaniak, W.; Potarzycki, J.; Fuleky, G. Potassium impact on nitrogen use efficiency in potato-a case study from the Central-East Europe. Plant Soil Environ. 2017, 63, 422–427. [Google Scholar]
  19. Gulick, S.H.; Cassman, K.G.; Grattan, S.R. Exploitation of soil potassium in layered profiles by root systems of cotton and barley. Soil Sci. Soc. Am. J. 1989, 53, 146–153. [Google Scholar] [CrossRef] [Green Version]
  20. Zia-ul-hassan; Memon, K.S.; Memon, M.; Arshad, M. Quantifying the effect of temperature on ammonium bicarbonate diethylene triamine penta-acetic acid extractable potassium and developing a novel correction factor to express the data. Commun. Soil Sci. Plant Anal. 2008, 39, 3047–3056. [Google Scholar] [CrossRef]
  21. Ahmad, F.; Din, S.U.; Perveen, A.; Afzal, M.N. Investigating critical growth stage of cotton subject to water deficit stress. Iran. J. Plant Physiol. 2013, 4, 873–880. [Google Scholar]
  22. Wang, M.; Zheng, Q.; Shen, Q.; Guo, S. The Critical role of potassium in plant stress response. Int. J. Mol. Sci. 2013, 14, 7370–7390. [Google Scholar] [CrossRef] [Green Version]
  23. Farooq, M.; Wahid, A.; Kobayashi, N.; Fujita, S.M.A.; Basra, D. Plant drought stress: Effects, mechanisms and management. Agron. Sustain. Dev. 2009, 29, 185–212. [Google Scholar] [CrossRef] [Green Version]
  24. Pervez, H.; Ashraf, M.; Makhdum, M.I. Influence of potassium nutrition on gas exchange characteristics and water relations in cotton (Gossypium hirsutum L.). Photosynthetica 2004, 42, 251–255. [Google Scholar] [CrossRef]
  25. Makhdum, M.I.; Pervez, H.; Ashraf, M. Dry matter accumulation and partitioning in cotton (Gossypium hirsutum L.) as influenced by potassium fertilization. Biol. Fertil. Soils 2007, 43, 295–301. [Google Scholar] [CrossRef]
  26. Wang, X.; Mohamed, I.; Xia, Y.; Chen, F. Effects of water and potassium stresses on potassium utilization efficiency of two cotton genotypes. Int. J. Mol. Sci. 2014, 14, 833–844. [Google Scholar] [CrossRef] [Green Version]
  27. Barrs, H.D.; Weatherley, P.E. A re-examination of the relative turgidity technique for estimating water deficit in leaves. Aust. J. Biol. Sci. 1962, 15, 413–428. [Google Scholar] [CrossRef] [Green Version]
  28. Jackson, M.L. Chemical Composition of Soil; Bean, F.E., Ed.; Van-Nostrand Co.: New York, NY, USA, 1962; pp. 71–144. [Google Scholar]
  29. Zia-ul-hassan; Arshad, M. Cotton growth under potassium deficiency stress is influenced by photosynthetic apparatus and root system. Pak. J. Bot. 2010, 42, 917–925. [Google Scholar]
  30. Arif, M.; Ahmed, W.; Ul-Haq, T.; Jamshaid, U.; Muhammad, I.; Ahmah, S. Effect of rock phosphate based compost and biofertilizer on uptake of nutrients, nutrient use efficiency and yield of cotton. Soil Environ. 2018, 37, 129–135. [Google Scholar]
  31. Meena, H.N.; Rana, K.S.; Ashok, K.; Livleen, S.; Meena, S.; Arvind, K.; Adarsh, K.; Antosh, K.M. Influence of crop residue and potassium management on yield, quality, nutrient uptake and nutrient use efficiency by Mung bean in Maize (Zea mays L.)-Wheat (Triticum aestivum L.)-Mungbean cropping system. Int. J. Curr. Microbiol. Appl. Sci. 2008, 7, 3284–3329. [Google Scholar] [CrossRef]
  32. Bassil, E.; Tajima, H.; Liang, Y.C.; Ohto, M.A.; Ushijima, K. The Arabidopsis Na+/H+ antiporters NHX1 and NHX2 control vacuolar pH and K+ homeostasis to regulate growth, flower development, and reproduction. Plant Cell 2011, 23, 3482–3497. [Google Scholar] [CrossRef] [Green Version]
  33. Barragan, V.; Leidi, E.O.; Andrés, Z.; Rubio, L.; De Luca, A.; Fernandez, A.; Cubero, B.; Pardo, J.M. Ion exchangers NHX1 and NHX2 mediate active potassium uptake into vacuoles to regulate cell turgor and stomatal function in Arabidopsis. Plant Cell 2012, 24, 1127–1142. [Google Scholar] [CrossRef] [Green Version]
  34. Fageria, N.K.; Baligar, V.C. Lowland rice response to nitrogen fertilization. Commun. Soil Sci. Plant Anal. 2001, 32, 1405–1429. [Google Scholar] [CrossRef]
  35. Zhao, D.; Oosterhuis, D.M.; Bednarz, C.W. Influence of potassium deficiency on photosynthesis, chlorophyll content, and chloroplast ultrastructure of cotton plants. Photosynthetica 2001, 39, 103–109. [Google Scholar] [CrossRef]
  36. Macleod, L.B. Effects of N, P, and K and their interactions on the yield and kernel weight of barley in hydroponic culture. Agron. J. 1969, 61, 26–29. [Google Scholar] [CrossRef]
  37. Fischer, R.A. Stomatal opening: Role of potassium uptake by guard cells. Science 1968, 160, 784–785. [Google Scholar] [CrossRef] [PubMed]
  38. Berkowitz, G.A.; Peters, J.S. Chloroplast inner envelope ATPase acts as a primary H1 pump. Plant Physiol. 1993, 102, 261–267. [Google Scholar] [CrossRef] [Green Version]
  39. Pettigrew, W. Potassium influences on yield and quality production for maize, wheat, soybean and cotton. Plant Physiol. 2008, 133, 670–681. [Google Scholar] [CrossRef]
  40. Hatfield, J.L.; Sauer, T.J.; Prueger, J.H. Managing soils to achieve greater water use efficiency: A review. Agron. J. 2001, 93, 271–280. [Google Scholar] [CrossRef]
  41. Naeem, M.; Ansari, A.A.; Gill, S.S. Essential Plant Nutrients: Uptake, Use Efficiency, and Management; Springer: Cham, Switzerland, 2017. [Google Scholar]
  42. Xia, X.; Fan, X.; Wei, J.; Feng, H.; Qu, H.; Xie, D.; Miller, A.J.; Xu, G. Rice nitrate transporter OsNPF2.4 functions in low-affinity acquisition and long-distance transport. J. Exp. Bot. 2015, 66, 317–331. [Google Scholar] [CrossRef]
  43. Rizwan, Z.; Wenqing, Z.; Haoran, D.; Snider, J.L.; Muhammad, A.; Babar, I.; Zhiguo, Z. Potassium improves photosynthetic tolerance to and recovery from episodic drought stress in functional leaves of cotton (Gossypium hirsutum L.). Plant Physiol. Biochem. 2017, 119, 21–32. [Google Scholar]
  44. Dobermann, A. Nutrient use efficiency-measurement and management. In Fertilizer Best Management Practices, 1st ed.; IFA: Paris, France, 2007. [Google Scholar]
  45. Vasuki, N.; Yogananda, S.B.; Preethu, D.C.; Sudhr, K.; Jayaprakash, S.M. Impact of Long-Term Fertilizer Application on Soil Quality, Crop Productivity and Sustainability: Two Decades Experience; Department of Soil Science and Agricultural Chemistry, University of Agricultural Sciences: Bangalore, India, 2009; p. 22. [Google Scholar]
Figure 1. Variations in dry matter of different growth components i.e., HKE−AWC 100% (a), HKE−AWC 50% (b), LKE−AWC 100% (c), LKE−AWC 50% (d), as affected by N:K levels mg pot−1 under varied irrigation levels. Note: LDW—leaves dry weight; SDW—stalk dry weight; RDW—root dry weight.
Agronomy 12 00502 g001
Figure 2. Interactive effects of N:K levels on leaf relative water content (a) and leaf area (b) of HKE and LKE cultivars of cotton at AWC100% and AWC50% irrigation levels (only the effect of NKx MRx Cv is given). Error bars are showing the standard error of mean.
Agronomy 12 00502 g002
Figure 3. Interactive effects of N:K levels on leaf N and K contents in HKE and LKE cultivars of cotton at AWC100% (a) and AWC50% (b) irrigation levels. * ANOVA significant at p < 0.05; ** ANOVA significant at p < 0.01. Error bars are showing the standard error of mean.
Agronomy 12 00502 g003
Figure 4. Performance of (a) HKE (CIM-554; high-K-efficiency cultivar) and (b) LKE (FH-901; low-K-efficiency cultivar) cotton cultivars, as affected by N:K levels under varied irrigation levels.
Agronomy 12 00502 g004
Table 1. Effect of applied N:K levels on gas exchange characteristics and PWUE in cotton cultivars under varied irrigation levels.
N-K
Levels
(mg pot−1)
PN (µ mol CO2 m−2 S−1) E (mmole H2Om−2 S−1)
x 100% AWCy 50% AWCMeanx 100% AWCy 50% AWCMean
HKELKEHKELKEHKELKEHKELKE
0-029.3 ± 3.128.0 ± 3.624.3 ± 2.2 21.3 ± 1.2 27.8 d3.99 ± 0.33.85 ± 0.2 3.81 ± 0.3 3.55 ± 0.2 3.9 b
375-034.0 ± 5.630.0 ± 3.6 27.0 ± 3.123.0 ± 3.131.2 c4.06 ± 0.33.96 ± 0.1 3.94 ± 0.23.68 ± 0.7 2.9 ab
750-040.3 ± 4.5 35.0 ± 2.3 33.3 ± 3.5 28.7 ± 6.135.7 b4.12 ± 0.24.08 ± 0.5 4.05 ± 0.2 3.72 ± 0.4 4.2 a
0-20833.0 ± 1.1 31.3 ± 5.5 27.7 ± 4.123.6 ± 6.1 31.3 c4.17 ± 0.3 4.12 ± 0.4 4.10 ±0.2 3.78 ± 0.33.9 ab
375-20841.3 ± 3.136.0 ± 5.5 35.0 ± 2.0 29.0 ± 4.237.2 ab4.43 ± 0.1 4.37 ± 0.4 4.32 ± 0.2 3.82 ± 0.7 4.1 ab
750-20843.0 ± 3.037.0 ± 2.2 36.3 ± 4.231.3 ± 2.738.9 a4.47 ± 0.4 4.41 ± 0.34.36 ± 0.3 3.86 ± 0.44.1 ab
Cv × MR36.8 a32.5 bc34.1 b31.2 c 3.9 a4.0 a4.0 a4.1 a
Mean MR34.7 a32.6 b 4.1 a4.0 a
Mean CvHKE = 35.5a, LKE = 31.9 b HKE = 4.1 a, LKE= 3.9 a
gs (m mol CO2 m−2 S−1)PWUE [μmol CO2 mmol−1 H2O]
0-060.1 ± 2.4754.3 ± 1.5 53.1 ± 2.443.7 ± 0.852.8 d7.34 ± 0.8 7.27 ± 0.56.38 ± 1.15.97 ± 1.17.2 d
375-064.3 ± 1.858.6 ± 2.554.8 ± 1.849.5 ± 1.356.6 c8.37 ± 1.07.58 ± 0.9 6.88 ± 1.2 6.30 ± 1.2 8.0 cd
750-068.4 ± 2.660.2 ± 2.5 59.2 ± 3.3 51.4 ± 2.2 59.3 b9.78 ± 1.2 8.26 ± 1.1 8.22 ± 1.27.67 ± 1.3 8.4 bc
0-20858.0 ± 3.5 55.3 ± 2.3 52.0 ± 2.3 47.3 ± 2.4 53.1 cd7.91 ± 0.9 7.60 ± 0.8 6.62 ± 1.0 6.24 ± 0.8 7.9 cd
375-20882.8 ± 2.5 70.5 ± 3.5 69.3 ± 2.1 63.9 ± 3.6 71.7 a9.36 ± 1.4 8.26 ± 1.2 8.13 ± 1.0 7.62 ± 1.1 9.2 ab
750-20886.6 ± 3.672.4 ± 2.471.1 ± 4.9 66.7 ± 4.8 74.4 a9.62 ± 1.3 8.40 ± 1.2 8.30 ± 0.9 8.13 ± 1.29.4 a
Cv × MR70.0 a61.9 b60.0 b53.7 c 9.3 a85 b8.0 bc7.5 c
Mean MR66.0 a56.9 b 8.3 a7.2 a
Mean CvHKE = 65.2 a, LKE = 57.8 b HKE = 8.9 a, LKE = 7.8 b
Means not sharing the same letter within a column differ significantly at p < 0.05 by LSD test. x—Full available moisture contents (100% irrigation); y—50% reduced available moisture content.
Table 2. Effects of N:K levels on N and K uptake in cotton cultivars under varied irrigation levels.
N:K Levels
(mg pot−1)
N Uptake (mg Plant−1) K Uptake (mg Plant−1)
x 100% AWCy 50% AWCMeanx 100% AWCy 50% AWCMean
HKELKEHKELKEHKELKEHKELKE
0-0194 ± 30149 ± 15152 ± 16106 ± 18150 d180 ± 16 134 ± 18 134 ± 13101 ± 17 137 d
375-0387 ± 31261 ± 21308 ± 26201 ± 32289 c267 ± 34 171 ± 11181 ± 9122 ± 23186 c
750-0648 ± 30393 ± 50527 ± 27297 ± 29466 b355 ± 13 215 ± 18251 ± 21149 ± 10243 b
0-208272 ± 62185 ± 16207 ± 16124 ± 15197 d293 ± 38 211 ± 18223 ± 7.7154 ± 24220 bc
375-208799 ± 72612 ± 81641 ± 55488 ± 69635 a614 ± 69 468 ± 33499 ± 74366 ± 63487 a
750-208855 ± 40664 ± 67699 ± 50531 ± 32687 a641 ± 46505 ± 49522 ± 49381 ± 405123 a
Cv × MR526 a422 b377 b292 c 392 a302 b284 b212 c
Mean MR474a335 b 347 a248 b
Mean CvHKE = 452 a, LKE = 357 bHKE = 338 a, LKE = 257 b
Means not sharing the same letter within a column differ significantly at p < 0.05 by LSD test. x—Full available moisture contents (100% irrigation); y—50% reduced available moisture content.
Table 3. Effect of applied N:K levels on seed cotton yield and mean boll weight of HKE and LKE cultivars of cotton under varied irrigation levels.
N:K Levels
(mg pot−1)
Seed Cotton Yield (g Plant−1) Mean Boll Weight (g Plant−1)
x 100% AWCy 50% AWCMeanx 100% AWCy 50% AWCMean
HKELKEHKELKEHKELKEHKELKE
0-010.5 ± 2.68.3 ± 3.58.8 ± 2.075.7 ± 1.38.36 d2.53 ± 0.012.41 ± 0.032.38 ± 0.032.35 ± 0.04 2.42 e
375-015.6 ± 3.412.5 ± 3.812.2 ± 2.89.9 ± 3.413.26 bc2.67 ± 0.052.55 ± 0.07 2.53 ± 0.04 2.45 ± 0.05 2.55 d
750-018.9 ± 4.514.8 ± 3.316.6 ± 1.611.6 ± 3.715.47 b2.75 ± 0.072.62 ± 0.04 2.61 ± 0.05 2.57 ± 0.06 2.64 c
0-20815.2 ± 2.112.1 ± 2.213.1 ± 0.410.3 ± 2.612.64 c2.51 ± 0.062.52 ± 0.05 2.42 ± 0.06 2.41 ± 0.04 2.47 e
375-20829.8 ± 3.023.4 ± 4.524.8 ± 6.319.3 ± 3.924.08 a3.12 ± 0.032.75 ± 0.06 2.95 ± 0.10 2.62 ± 0.07 2.86 b
750-20831.5 ± 4.025.8 ± 5.026.6 ± 5.321.5 ± 3.626.30 a3.16 ± 0.102.85 ± 0.13 3.02 ± 0.12 2.72 ± 0.072.94 a
Cv × MR20.23 a16.58 b16.86 b13.06 c 2.79 a2.62 b2.65 b2.52 c
Mean MR18.41 a14.96 b 2.70 a2.59 b
Mean CvHKE = 18.5 a, LKE = 14.82 bHKE = 2.72 a, LKE =2.57 b
Means not sharing the same letter within a column differ significantly at p < 0.05 by LSD test. x—Full available moisture contents (100% irrigation); y—50% reduced available moisture content (drought stress).
Table 4. Effect of applied N:K levels on apparent recovery efficiency in HKE and LKE cotton cultivars under varied irrigation levels.
N:K Levels (mg pot−1)N Apparent Recovery Efficiency (%) K Apparent Recovery Efficiency (%)
x 100% AWCy 50% AWCMeanx 100% AWCy 50% AWCMean
HKELKEHKELKEHKELKEHKELKE
0-0----------
375-05241282436 d-----
750-06048322541 c-----
0-208-----9038332246 c
375-20810585927589 a159143136110137 a
750-2087665625364 b129115128105119 b
Cv × MR49 a40 b36 c30 d 63 a49 b50 b39 c
Mean MR44.5 a33.0 b 56.0 a44.5 b
Mean CvHKE = 42.5 a; LKE = 35.0 bHKE = 56.5 a; LKE= 44.0 b
Means not sharing the same letter within a column differ significantly at p < 0.05 by LSD test. x—Full available moisture contents (100% irrigation); y—50% reduced available moisture content (drought stress).
Table 5. Pearson’s correlation matrix for nutrient-use efficiency indices determining nutrient efficiency of cultivars under AWC-50%.
ParametersSCYNAEKAENAREKARE
SCY1
NAE0.882 **1
KAE0.947 **0.867 **1
NARE0.882 **0.994 **0.838 **1
KARE0.946 **0.860 **0.995 **0.830 **1
SCY—seed cotton yield; NAE—nitrogen agronomic efficiency; KAE—potassium agronomic efficiency; NARE—nitrogen apparent recovery efficiency; KARE—potassium apparent recovery efficiency. ** indicates highly significant correlation at p ≤ 0.01.
Publisher’s Note: MDPI stays neutral with regard to jurisdictional claims in published maps and institutional affiliations.

