Abstract
Wizened buds are frequently observed in pear (Pyrus spp.) trees, which greatly reduces the yield. However, little is known about the mechanism of wizened bud formation. Here, we analyzed physiological and transcriptomic differences between normal buds and wizened buds of ‘710’ pear trees. The results indicated that the sorbitol and boron (B) contents, during bud differentiation, were significantly reduced in wizened buds. The microscopic observation and transcriptome analysis revealed that the collapse of the organ structure and cell wall loosening process may have a close relation with wizened bud formation. Moreover, reduced transcript levels of PpyMYB39.1 and its downstream genes (PpyHT1, PpyHT2, PpyPMEI1 and PpyPMEI2) were found in wizened buds. However, the transcript levels of pentose and glucuronate interconversion pathway genes (PpyPME3, PpyPL18.1, PpyPL18.2, PpyPG1 and PpyPG2) and the concentration of pectin-degradation-related enzymes were increased in wizened buds. Correspondingly, the pectin concentration was significantly reduced in wizened buds. Taken together, PpyMYB39.1 may promote pectin degradation and decrease carbohydrate transport by regulating its downstream genes and is supposed to play a vital role in the wizened bud formation resulting from the cell wall loosening process. Our study provides fundamental insights into wizened bud formation and strategies to reduce the wizened bud occurrence in pear trees.
1. Introduction
Pear (Pyrus spp.) is one of the major temperate fruit crops [1], which has grown widely with the global production of over 23.1 million tons in the year 2020 [2]. In China, pear is an economical fruit crop, and its yield is affected by developmental processes, especially bud germination [3,4]. However, the bud differentiation is frequently hindered in many traditional pear species, such as ‘Yuluxiang’ (P. bretschneideri.), showing the occurrence of wizened bud, and results in a great loss of pear production [5,6]. Moreover, previous studies demonstrated that wizened bud formation is closely related to management practices and the nutritional status of buds [6,7].
The occurrence of wizened buds has been reported in many Rosaceae fruit trees, including pear [5], apple [8] and peach [9]. Typically, wizened buds have external scales loosening, internal bud organs browning and bud bursting and the presence of wizened buds at the later stage of bud differentiation [5]. Hence, the wizened bud formation is due to the impediment of bud differentiation. Mineral nutrients and carbohydrate utilization in buds are essential for the differentiation process [10,11]. For example, boron (B) is involved in the cell wall development of bud meristem, and sugar alcohols act as the carbon source for the cell division of bud organs during bud differentiation [12,13,14]. Sugar alcohols serve as major photo-assimilates and can be distributed to various tissues [15,16]. In pear, sorbitol is the dominant photosynthetic product that is synthesized in leaves [17]. Once the sorbitol is transported from the leaves to sink tissues, it is primarily converted into fructose by sorbitol dehydrogenase (SDH) for plant utilization [18,19]. Therefore, sorbitol, in addition to the energy source, plays an important role in reproductive development by regulating the expression of SDH genes [20,21].
Several genes are involved in the bud differentiation process, among which transcription factors play regulatory roles in the interaction with downstream target genes [22,23]. The MYB subfamily, which consists of MYB genes with conserved DNA-binding domains, play a vital role in bud development. For example, CmMYB2 determines the bud differentiation time in chrysanthemum by regulating the gibberellin metabolism [24]. From Japanese morning glory (Ipomoea nil), InMYB1 is active in the floral bud developmental stage and functions from young flower buds to bloomed flowers [25]. The triple knockdown mutant of Arabidopsis (AtMYB37, AtMYB38 and AtMYB84) displayed a defect in axillary bud formation, showing the importance of MYBs in meristem bud formation [26]. DhMYB1 is involved in the morphogenesis of epidermal cells in Dendrobium hybrida and is therefore supposed to be required for floral bud development [27]. In addition to MYB transcription factors, the pectin methylesterase (PME) and pectin methylesterase inhibitor (PMEI) encoded genes have also been reported to play key roles in the bud growth of different species [28,29,30]. However, little is known about the molecular mechanisms of wizened bud formation in pears.
Here, we chose ‘710’ sand pear plants, with typical wizened occurrence in the bud, as research material. Microscopic observations and metabolite quantification analyses were conducted to determine the physiological changes during the wizened bud formation. Moreover, RNA-seq analyses were used to conduct the transcriptomic profiling of normal buds and wizened buds. The aim of this study was to investigate the possible mechanisms of wizened bud formation and provide new insights to overcome wizened bud occurrence in pear.
2. Materials and Methods
2.1. Plant Materials and Sampling
The experiment was conducted from May 2021 to November 2021 in the Wuchang Sand Pear Germplasm Collection, Wuhan, China. For this experiment, 7-year-old ‘710’ sand pear (Pyrus Pyrifolia, ‘An Nong No. 1 × Cui Guan’) grafted on Callery pear (P. calleryana) plants were selected. There were a total of 30 representative trees with 10 individual trees as a replication. The samples of wizened buds, normal buds and leaves were collected from the 1-year-old stem of selected trees in September 2020. Each bud sample consisted of more than 20 buds and the leaf sample consisted of more than 10 leaves, which were randomly collected from stems. Rhizosphere soil samples were collected from a depth of 30 cm around the selected trees.
2.2. Phloem Sap Extraction
Phloem sap was collected as described by Du et al. [31]. Briefly, wizened bud stems were washed with ultra-pure water twice. The bark was peeled off, and the xylem residues were removed by scalpel. Subsequently, the clean epidermis was cut into small pieces of 1 cm2 and transferred into a 0.5 mL centrifuge tube punctured at the bottom. Then, a 0.5 mL centrifuged tube was inserted into a 2 mL centrifuge tube for centrifugation (12,000 rpm, 15 min, 20 °C), and about 200 μL phloem sap of each tube was collected for further analysis.
2.3. Determination of Nutrient Concentration
A fresh bud sample weighing around 0.1 g was used to measure the N concentration, by using the Vario MACRO Cube Analyzer (Elementar, Germany), following the protocol of Tian et al. [32]. Moreover, the concentrations of P, K, Ca, Mg, S, Fe, Mn, B, Cu and Zn were determined by taking a 0.3 g dried bud sample. The dried sample was ashed in a muffle furnace at 500 °C for 6 h; afterwards, the sample was dissolved in 30 mL of HNO3 (1%) solution. The solution was used to determine the above-mentioned nutrient concentration by an inductively coupled plasma-optical emission spectrometer (ICP-OES, Finnigan MAT, Element I, Germany).
2.4. X-ray Micro-Computed (µCT) Tomography
X-ray micro-computed (µCT) tomography was performed as described by Buss et al. [33] with some modifications. Virtual image stacks of all bud specimens were detected by μCT (Versa 510, Carl Zeiss, Germany). Briefly, the samples were stored in dry tubes during the μCT-scanning process. Then, the samples were scanned with a Versa 510 X-ray microscope with the following parameters: 30–40 kV, 5–8 W, 2001 projections, 10–22 s acquisition time, objective: ×0.4, and voxel size: 5.0 μm.
2.5. RNA-seq, Data Processing and Gene Annotation
Transcriptome libraries were constructed from samples of normal buds and wizened buds in the early stage of wizened bud occurrence (September 2020) with 3 biological replications. Total RNA was isolated by using a TaKaRa Plant RNA Extraction Kit (TaKaRa, Dalian, China), and the transcriptome profiles were obtained by using NR604-VAHTS® Fast RNA-seq Library Prep Kit for Illumina (Vazyme, Nanjing, China), following the manufacturer’s protocol. The original data have been submitted to NCBI (BioProject ID: PRJNA804671). Clean reads (high-quality reads) of 6 transcriptome libraries were filtered from raw reads by removing low-quality reads with ambiguous nucleotides (read length: 300 bp, total reads: 72,777,662 to 84,315,630) and adaptor sequences, and Tophat2 was used to map clean reads to the reference genome Pyrus pyrifolia in GDR (https://www.rosaceae.org/Analysis/9597119, 1 May 2021). Gene expression levels were calculated by the FPKM (Fragments Per Kilobase of transcript per Million mapped reads) method using the RSEM tool. A differential expression analysis was performed using the DESeq R package (1.10.1). The resulting p values were adjusted using Benjamini and Hochberg’s approach for controlling the false discovery rate. Genes with a p-value < 0.05 found by DESeq were assigned as differentially expressed genes. The overview of RNA-seq statistics and the FPKM of differentially expressed genes (DEGs) are mentioned in Tables S3 and S4.
Gene annotation was conducted using the Blastp search against the nr database in NCBI, Swiss-Prot database and Pfam database. BlastKOALA was used to annotate the KOs of the KEGG ORTHOLOGY database. The protein sequences of genes were aligned against the GO database and KEGG pathway database using KOBAS 3.0 (http://kobas.cbi.pku.edu.cn/, 1 May 2021) to perform the enrichment analysis. A corrected p-value < 0.01 was set as a cut-off for GO enrichment 2.6. Quantitative Real-Time PCR (qRT-PCR) Analysis
The qRT-PCR experiment was conducted following the previous protocol [34]. Briefly, the total RNA of each sample was extracted by an OminiPlant RNA Kit (CWBIO, Beijing, China). One microgram of high-quality total RNA was used for the first-strand cDNA synthesis by TransScript One-step gDNA Removal and cDNA Synthesis SuperMix (TransGen Biotech, Beijing, China). The qRT-PCR was conducted by 3 biological replicates, and each biological replicate had 3 technical replicates. qRT-PCR was performed in a 10 μL reaction volume using Luna® Universal qPCR Master Mix (NEB) on a qRT-PCR system (CFX real-time PCR system, BioRad, Hercules, CA, USA) following the manufacturer’s protocol. The reaction was started by an initial incubation at 94 °C for 2 min and then subjected to 34 cycles of 94 °C for 30 s, 57 °C for 30 s and 72 °C for 80 s, and then ended with 72 °C for 3 min. The primers used in this study are listed in Table S2. PpyPP2A (sequence ID: Pbr020268.1) was used as an internal control to normalize the expression level of the target genes between samples. The Livak method was employed to calculate relative expression values [35].
2.6. Determination of Pectin, Lignin, Cellulose, Pectin Methylesterase, Pectate Lyase, Polygalacturonase and Sorbitol Concentration
Two decigrams of fine powder of each bud sample were used to determine the pectin (by a plant pectin ELISA Kit), lignin (by a plant lignin ELISA Kit), cellulose (by a plant cellulose ELISA Kit), pectin methylesterase (by a plant PME ELISA Kit), pectate lyase (by a plant PL ELISA Kit) and polygalacturonase (by a plant PG ELISA Kit) concentration following the instructions of the kits (Comin Biotechnology Co., Ltd., Suzhou, China). Moreover, 1 g of fine powder of leaves, 1 g of buds and 0.5 mL of phloem sap were used to determine the sorbitol concentration using a gas chromatography-mass spectrometer. The detailed method for sorbitol detection was mentioned in the Supplementary Methods.
2.7. Statistical Analysis
Unless specially stated, each value was expressed as the means ± standard deviation (SD) of three replications. Data analysis was performed by using an independent-samples t-test (p < 0.05) in SPSS Statistics 19.0 (SPSS Inc., Chicago, IL, USA).
3. Results
3.1. Phenotype and Structure Comparison between Normal Buds and Wizened Buds
At the time of flower bud differentiation, wizened buds were observed on ‘710’ sand pear plants. Phenotypically, the bud scales were wrapped tightly around normal buds with a hub shape; however, the bud scales were loosely surrounded by wizened buds with irregular shape and appeared like the bud burst from the inside to the outside (Figure 1A). Compared with normal buds, more than half of the total buds were wizened buds with significantly lower fresh weight (Figure 1B). Moreover, the ratio of leaf to bud in normal bud stems was 139:114, which was 2.5 times that of the wizened bud stems (54:112).
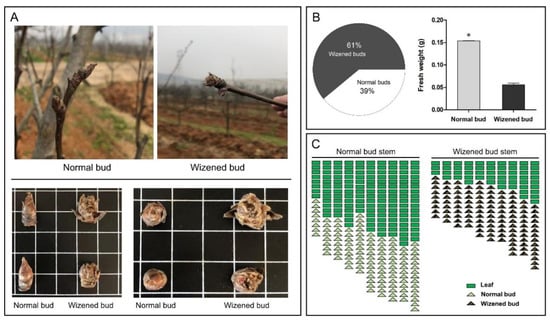
Figure 1.
Phenotypic differences between normal buds and wizened buds, and their characteristics. The phenotypic illustration of normal buds and wizened buds (A). The proportion of wizened buds and normal buds and the comparison of fresh weight between normal buds and wizened buds (B). The comparison of leaf to bud ratio between normal bud stems and wizened bud stems (C). Values are the mean ± SD. The asterisk indicates a significant difference between normal bud and wizened bud (t-test, p < 0.05). In Figure 1A, the side length of each square indicates 1 cm.
According to the microscopic observations, the shape of inflorescence in the normal buds was trigonal pyramidal with a tight arrangement above the bud axis (Figure 2A); however, the inflorescence of wizened buds presented an irregular shape with a loose arrangement on the bud axis (Figure 2D). Internally, all inflorescences in normal buds were healthy with an integral structure (Figure 2B); by contrast, all inflorescences in the wizened bud were abnormal or even dead, with a collapsed structure and a shriveled and cracked appearance (Figure 2E). Furthermore, the structure of the flower parts in the normal bud was distinct and can be completely differentiated (Figure 2C); on the contrary, the structure of the wizened bud was indistinct, with an incomplete differentiation of stamen and pistil, and a lack of petal differentiation (Figure 2F).
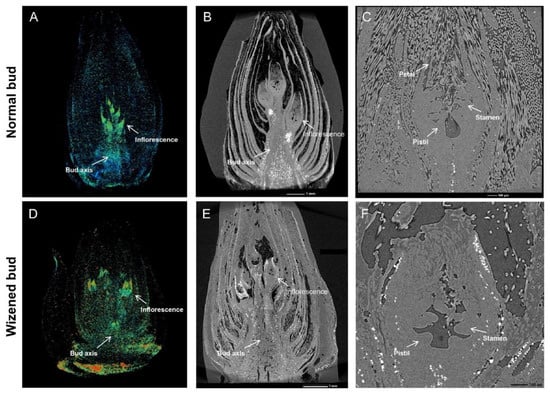
Figure 2.
Microscopic illustration of normal buds and wizened buds. Appearance and inflorescence (A,D); longitudinal section (B,E); floral components (C,F) of normal buds and wizened buds, respectively.
3.2. Comparison of B Concentration between Normal Buds and Wizened Buds
Leaf nutrient analysis indicated that the concentration of K, Mg and B was significantly lower in wizened buds than in normal buds (Table S1). Moreover, the Mg concentration in orchard soil was higher than the normal threshold, while the B concentration in orchard soil was lower than the normal threshold (Table S1). According to Figure 3, wizened bud occurrence was started after 22 July and, before that, the B concentration in both types of bud tissues was the same. After 22 July, the B concentration started to reduce quickly in the wizened bud, but normal bud presented an increasing profile of B concentration; moreover, the B concentration of wizened buds was significantly lower than that of normal buds (Figure 3).
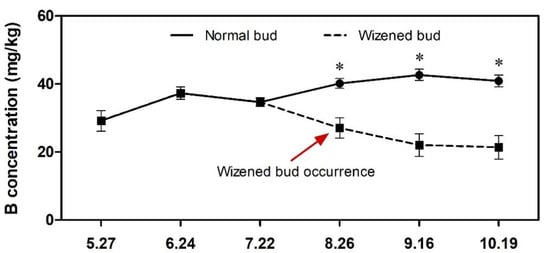
Figure 3.
Changes of B concentration profile during flower bud differentiation starting from 27 May to 19 October. Values are the mean ± SD. The asterisk indicates a significant difference between normal buds and wizened buds at a given time point (t-test, p < 0.05).
3.3. Functional Enrichment and Coexpression Network of Differentially Expressed Genes
To further explore the differences in the molecular regulation of wizened bud formation, a comparative transcriptome analysis was performed between normal buds and wizened buds. In total, 546 differentially expressed genes (DEGs) were identified; of them, 462 genes were down-regulated in wizened bud samples (Figure S1). The DEGs were enriched in ‘response to wounding’, ‘suberin biosynthetic process’, ‘regulation of defense response’, ‘syncytium formation’, ‘nitrate transport’ and ‘plant-type cell wall loosening’ processes (Figure 4A). Subsequently, a KEGG enrichment analysis revealed 10 typical pathways, and the ‘pentose and glucuronate interconversions’ pathway was related to the ‘plant-type cell wall loosening’ process (Figure 4B). To identify the key regulatory genes, we constructed gene networks via WGCNA and Cytoscape. Among all DEGs, 54 DEGs encoded transcription factors (TFs) and the highest edges of PpyMYB39 were observed in the network analysis (Figure 4C).
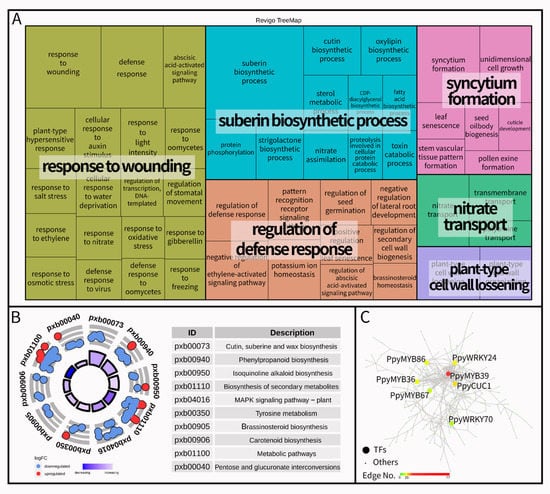
Figure 4.
Go term enrichment analysis (A), KEGG pathway enrichment analysis (B) and correlation network of differentially transcription factors (C) between normal buds and wizened buds. Each rectangle of graph A is a single cluster, joined into ‘superclusters’ of loosely related terms, and the size of the rectangles is adjusted to reflect the P-value. The term logFC means log2 (FPKM_Wizened bud/FPKM_Normal bud) and the color of a bar from dark blue to light blue represents a hint regarding the pathway that is more likely to be decreased or increased in graph B. The transcription factors are shown by large circles in graph C, and the color from green to red represented the number of edge genes related to the transcription factor.
3.4. Expression Levels of Differentially Expressed Genes and Candidate Target Genes of PpyMYB39
To verify the authenticity of RNA-seq data, the DEGs belonging to the ‘pentose and glucuronate interconversions’ pathway and key TFs of the coexpression network were selected. The qRT-PCR results showed strong coherence with the finding of the RNA-seq results. Briefly, the expression level of PpyPME3, PpyPL18.1, PpyPL18.2, PpyPG1 and PpyPG2 were significantly higher in wizened buds than those of normal buds (Figure 5A). However, the expression level of PpySDH and all selected TFs were significantly lower in wizened buds than in normal buds (Figure 5A,B).
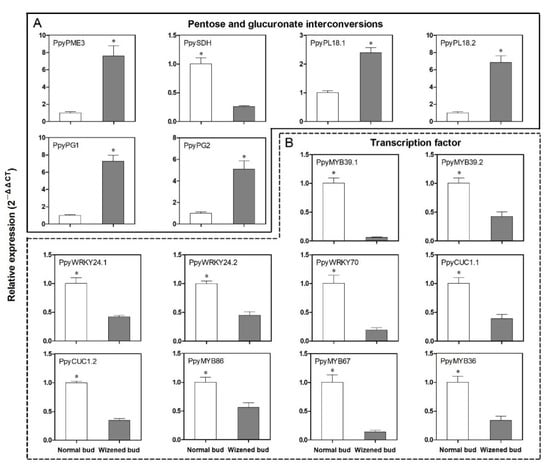
Figure 5.
Transcript analysis of differential genes between normal buds and wizened buds. (A) refers to the transcript analysis of the pentose and glucuronate interconversions pathway-related genes, and (B) refers to the expression analysis of transcription factors. Values are the mean ± SD. PME: Pectin methylesterase. SDH: Sorbitol dehydrogenase, PL: Pectate lyase. PG: Polygalacturonase. The asterisk indicates a significant difference between normal bud and wizened bud (t-test, p < 0.05).
MdMYB39L plays a key role in sorbitol-modulated stamen development by regulating its downstream target genes, which are involved in hexose uptake, cell wall formation and modification, and microsporogenesis [21]. Based on the findings of this research, 8 candidate target genes of PpyMYB39 were screened for qRT-PCR analysis between normal buds and wizened buds. These genes were related to bud development and derived from 2 functional categories, including hexose transporters (PpyHT1 to PpyHT4) and pectin methylesterase inhibitors (PpyPMEI1 to PpyPMEI4) (Figure 6A,B). The expression levels of PpyHT1, PpyHT2, PpyPMEI1 and PpyPMEI2 in wizened buds were significantly lower than those in normal buds; however, no significant difference was observed in the expression levels of PpyHT3, PpyHT4, PpyPMEI3 and PpyPMEI4 between normal buds and wizened buds (Figure 6A,B).
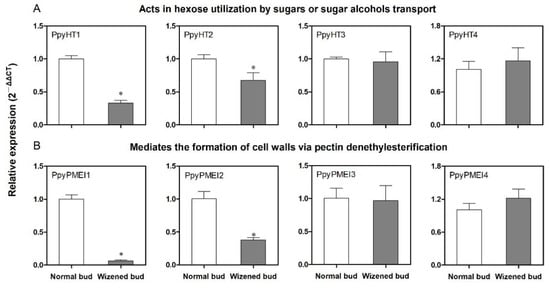
Figure 6.
Transcript analysis of the comparison of PpyMYB39 mRNA responsive genes between normal buds and wizened buds. (A) refers to the expression analysis of PpyHT-encoded genes, and (B) refers to the expression analysis of PpyPMEI-encoded genes. HT: hexose transporters. PMEI: pectin methylesterase inhibitors. Values are the mean ± SD. The asterisk indicates a significant difference between normal buds and wizened buds (t-test, p < 0.05).
3.5. Comparison of Pectin, Lignin, Cellulose and Pectin Methylesterase, Pectate Lyase Polygalacturonase Content Related to Pectin Degradation
According to the KEGG enrichment analysis, the pectin degradation process was mainly induced after wizened bud occurrence. The quantitative analysis further confirmed that the pectin concentration in wizened buds was significantly lower than in normal buds (Figure 7A). However, no significant change was observed for the lignin and cellulose concentration between the normal buds and wizened buds (Figure 7B,C). Moreover, the content of pectin methylesterase, pectate lyase and polygalacturonase were all significantly higher in wizened buds than in normal buds (Figure 7D–F).
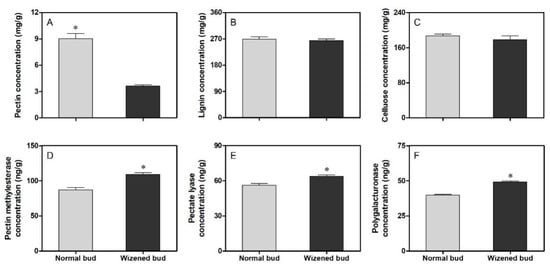
Figure 7.
Comparison of pectin (A), lignin (B), cellulose (C), pectin methylesterase (D), pectate lyase (E) and polygalacturonase (F) concentration between normal buds and wizened buds. The values are the mean ± SD. The asterisk indicates a significant difference between normal buds and wizened buds (t-test, p < 0.05).
3.6. Changes in Sorbitol Content in the Buds, Leaves and Phloem Sap
The determination of sorbitol content in different parts of the plant was conducted to compare the translocation and utilization of sorbitol content between normal bud stems and wizened bus stems. The results indicated that the sorbitol concentration in wizened buds and stem phloem sap was significantly lower than that in normal buds and stem phloem sap (Figure 8A,C); however, no difference was observed in leaf samples taken from normal bud stems and wizened bud stems (Figure 8B).
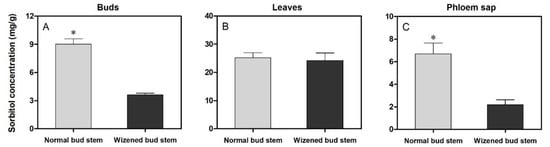
Figure 8.
Comparison of sorbitol concentration in the buds (A), leaves (B), phloem sap (C) between normal bud stems and wizened bud stems. Values are the mean ± SD. The asterisk indicates a significant difference between normal bud stems and wizened bud stems (t-test, p < 0.05).
4. Discussion
In pear orchards, wizened bud occurrence is frequently observed, which impedes flower bud growth, resulting in a great loss of yield [6]. According to the present study, more than 60% of buds presented a wizened performance in ‘710’ sand pear trees at the time of flower bud differentiation (Figure 1A,B), indicating that ‘710’ sand pear trees have a typical character of wizened bud formation and could be used as interesting material to investigate the underlying mechanism. Mineral nutrients and carbohydrates play key roles in floral bud differentiation [36,37], and these are dominantly supplied from leaves by the source-sink transport mechanism [38,39]. In pear, sorbitol is the main transportable photo-assimilate, which was confirmed to contribute to flower bud differentiation [40,41]. The present study found that the number of source organs or the sorbitol concentration of buds and phloem sap was significantly lower in wizened bud stems than in normal bud stems (Figure 1C and Figure 8A,C), thereby suggesting that wizened bud occurrence is related to the insufficient supply of sorbitol from source (leaves) to sink (bud) organs, and sorbitol may play a key role in the process of wizened bud formation.
According to the previous reports, B is crucial for floral bud differentiation by participating in cell wall development and membrane maintenance [42,43]; furthermore, its translocation via phloem is assisted with the presence of sorbitol in Rosaceae family plants, including pear [12,44]. Our results also found that B was typically decreased in wizened buds than in normal buds (Table S1). Temporal analysis indicated that the B concentration was the same in all buds during the early stages of floral bud differentiation; however, when buds showed wizened performance, the B concentration was rapidly decreased and was significantly lower than that of normal buds (Figure 3). These results supposed that the decrease of sorbitol transport from the leaves reduced the B concentration in buds, leading to abnormal bud differentiation.
A microscopic study showed that wizened buds might occur at or before the sepal differentiation phase in pear [5]. However, little is known about the inner structure of wizened buds and the microstructure of inflorescence in wizened buds. In the present study, the wizened buds showed loose and collapsed structures when compared with normal buds (Figure 2A,B,D,E). Moreover, the differentiation of stamen and pistil was initiated, but the formation of stamen and pistil was incomplete with indistinct structures in wizened buds (Figure 2C,F), indicating that the occurrence of wizened buds is likely due to the collapse of the organ structure, resulting in burst bud appearance.
To understand the molecular mechanism of wizened bud occurrence in pear, the samples with typical wizened bud occurrence (during the wizening process) were collected, and an RNA-seq experiment was conducted between normal buds and wizened buds. From 546 DEGs, many function-specific genes were identified between normal buds and wizened buds, which may contribute to the wizened bud formation process. It has been reported that cell wall modification can affect the bud formation process in woody plants [45,46]. In our study, the DEGs were enriched in different biological processes (Figure 4A); among them, the ‘plant-type cell wall loosening’ process was considered to be directly related to the collapse of the organ structure in buds (Figure 2). Then, the top 10 most enriched pathways and the DEGs enriched in these pathways were visualized using the GO plot package [47] (Figure 4B). Among these pathways, the ‘pentose and glucuronate interconversions’ pathway, which contained 5 DEGs associated with the pectin degradation process, was particularly focused on (Figure 4A,B). The expression levels of these genes, PpyPME3 related to pectin methyl esterification, PpyPL18.1 and PpyPL18.2 related to pectin lysis, and PpyPG1 and PpyPG2 related to polygalacturonate were significantly higher in wizened buds than in normal buds (Figure 4A). Moreover, the concentration of pectin (except for lignin and cellulose) and the enzymes corresponding to these genes were significantly lower in wizened buds than in normal buds (Figure 7). These results suggested that the pectin degradation process was initiated after wizened bud occurrence. Previous studies demonstrated that pectin is one of the major components of the cell wall [48,49], and the degradation of pectin can trigger the cell wall loosening process either in reproductive or vegetative organs [50,51,52]. Taken together, we supposed that the occurrence of wizened buds has resulted from the cell wall loosening process induced by pectin degradation.
Gene network analyses identified some TFs, which were supposed to play vital roles in the regulation of wizened bud formation (Figure 4C). The qRT-PCR analysis indicated that 10 TFs genes related to the wizened bud formation process had a down-regulated expression in the wizened bud when compared with those of normal buds (Figure 5B). Most importantly, one MYB39-like transcription factor, PpyMYB39.1, showed a significantly lower expression in wizened buds (Figure 5B). As MYB39 genes can negatively regulate the flower bud growth either during the differentiation or the blooming stage [21,53,54], the lower expression of PpyMYB39.1 in wizened buds suggested that the function of PpyMYB39.1 is closely related to wizened bud occurrence. Moreover, its putative target genes based on the previous study [21], PpyHT1, PpyHT2 and PpyPMEI1, and PpyPMEI2 genes presented the same expression trend as PpyMYB39.1 in wizened buds relative to normal buds (Figure 5B and Figure 6). Taken together, PpyMYB39.1 could be a key regulator of the wizened bud formation process.
Previous studies revealed that pectin methylesterases (PMEs) were involved in bud development by modifying cell wall stability [55,56,57], and PMEIs were able to inhibit PME activities [58,59]. In this study, lower expression levels of PpyPMEI1 and PpyPMEI2 genes and the higher expression level of PpyPME3 suggested that both PpyPMEI genes were involved in bud development in pear by mediating PMEs that induced wizened bud occurrence (Figure 6B). On the other hand, PpyHT1 and PpyHT2 showed lower expression levels in wizened buds (Figure 6A). It has been reported that the hexose transporters contribute to bud formation and development by taking up hexoses for adequate carbohydrate utilization in the bud [60,61]. Our findings suggested that the lower expression levels of PpyHT1 and PpyHT2 in wizened buds suppressed the transport of hexose sugars into buds, thereby hindering bud formation and leading to wizened bud occurrence in pear plants (Figure 5A, Figure 6A and Figure 8A).
5. Conclusions
At the time of wizened bud occurrence, wizened buds were found to be deficient in sorbitol and B as compared to normal buds. The RNA-seq and metabolic analysis revealed that the cell wall loosening process induced by pectin degradation might be the main factor of wizened bud occurrence. The co-expression network of TFs further suggested that PpyMYB39.1 might play a vital role in bud differentiation by regulating the pectin degradation and carbohydrate transport-related genes (PpyPMEI1, PpyPMEI2, PpyHT1 and PpyHT2).
Supplementary Materials
The following supporting information can be downloaded at: https://www.mdpi.com/article/10.3390/agronomy12020484/s1, Figure S1: The number of differential expression genes by comparison of normal buds and wizened buds, Table S1: Comparison of nutrient concentration between normal bud and wizened bud or orchard soil and normal range, Table S2: The list of gene names, their IDs and primers used in this study. Table S3: The overview of RNA-seq statistics. Table S4: The FPKM of differentially expressed genes (DEGs) of RNA-seq data.
Author Contributions
Conceptualization, W.D. and H.H.; methodology, W.D., X.Y., C.S. and M.L.; formal analysis, W.D., C.S. and S.B.H.; investigation, W.D., J.Z., H.H., Q.C., J.F. and X.Y.; writing-original draft preparation, W.D.; writing-review and editing, W.D., S.B.H., Y.L., X.Y. and H.H.; supervision, J.F. and X.Y.; project administration, W.D.; funding acquisition, Y.L. and H.H. All authors have read and agreed to the published version of the manuscript.
Funding
This research was funded by the Major Program of Hubei Agricultural Science and Technology Innovation Center (2020-620-000-002-05), the National Key Research and Development Program (2020YFD1000202) and the China Agriculture Research System of MOF and MARA (CARS-28).
Institutional Review Board Statement
Not applicable.
Informed Consent Statement
Not applicable.
Data Availability Statement
Not applicable.
Acknowledgments
The authors sincerely thank Gui-Zhi Feng (Nanjing Agricultural University, Nanjing, China) and Wang Jia (Shanghai Bioprofile Technologe Company Ltd., Shanghai, China) for their help in data analysis.
Conflicts of Interest
The authors declare no conflict of interest.
References
- Zhang, M.-Y.; Xue, C.; Hu, H.; Li, J.; Xue, Y.; Wang, R.; Fan, J.; Zou, C.; Tao, S.; Qin, M.; et al. Genome-wide association studies provide insights into the genetic determination of fruit traits of pear. Nat. Commun. 2021, 12, 1144. [Google Scholar] [CrossRef] [PubMed]
- FAOSTAT. World Food and Agriculture Statistical Yearbook; FAO-Food & Agriculture Organization of the United Nation: Rome, Italy, 2020. [Google Scholar]
- Lee, S.-H.; Kim, W.-S.; Han, T.-H. Effects of post-harvest foliar boron and calcium applications on subsequent season’s pollen germination and pollen tube growth of pear (Pyrus pyrifolia). Sci. Hortic. 2009, 122, 77–82. [Google Scholar] [CrossRef]
- Yang, Q.; Niu, Q.; Tang, Y.; Ma, Y.; Yan, X.; Li, J.; Tian, J.; Bai, S.; Teng, Y. PpyGAST1 is potentially involved in bud dormancy release by integrating the GA biosynthesis and ABA signaling in ‘Suli’ pear (Pyrus pyrifolia White Pear Group). Environ. Exp. Bot. 2019, 162, 302–312. [Google Scholar] [CrossRef]
- Yang, S.; Bai, M.-D.; Gao, P.; Hao, G.-W.; Zhang, X.-W.; Guo, H.-P.; Li, L.-L. Relationship between change in endogenous hormone content and occurrence of wizened bud in Chinese pear. In Proceedings of the II Asian Horticultural Congress, Chengdu, China, 30 August 2018; pp. 235–244. [Google Scholar] [CrossRef]
- Liu, Y.; Zhang, H.P.; Gu, C.; Tao, S.T.; Wang, D.S.; Guo, X.P.; Qi, K.J.; Zhang, S.L. Transcriptome profiling reveals differentially expressed genes associated with wizened flower bud formation in Chinese pear (Pyrus bretschneideri Rehd.). J. Hortic. Sci. Biotechnol. 2016, 91, 227–235. [Google Scholar] [CrossRef]
- Zuo, X.; Zhang, D.; Wang, S.; Xing, L.; Li, Y.; Fan, S.; Zhang, L.; Ma, J.; Zhao, C.; Shah, K.; et al. Expression of genes in the potential regulatory pathways controlling alternate bearing in ‘Fuji’ (Malus domestica Borkh.) apple trees during flower induction. Plant Physiol. Biochem. 2018, 132, 579–589. [Google Scholar] [CrossRef] [PubMed]
- Landsberg, J.J. Apple Fruit Bud Development and Growth; Analysis and an Empirical Model. Ann. Bot. 1974, 38, 1013–1023. [Google Scholar] [CrossRef]
- Okie, W.R.; Werner, D.J. Genetic Influence on Flower Bud Density in Peach and Nectarine Exceeds That of Environment. HortScience 1996, 31, 1010–1012. [Google Scholar] [CrossRef] [Green Version]
- Ruan, Y.-L. Sucrose Metabolism: Gateway to Diverse Carbon Use and Sugar Signaling. Annu. Rev. Plant Biol. 2014, 65, 33–67. [Google Scholar] [CrossRef]
- Ramírez, F.; Davenport, T.L. Mango (Mangifera indica L.) flowering physiology. Sci. Hortic. 2010, 126, 65–72. [Google Scholar] [CrossRef]
- Brown, P.H.; Bellaloui, N.; Hu, H.; Dandekar, A. Transgenically enhanced sorbitol synthesis facilitates phloem boron transport and increases tolerance of tobacco to boron deficiency. Plant Physiol. 1999, 119, 17–20. [Google Scholar] [CrossRef] [Green Version]
- Chatterjee, M.; Tabi, Z.; Galli, M.; Malcomber, S.; Buck, A.; Muszynski, M.; Gallavotti, A. The boron efflux transporter ROTTEN EAR is required for maize inflorescence development and fertility. Plant Cell 2014, 26, 2962–2977. [Google Scholar] [CrossRef] [PubMed] [Green Version]
- Patrick, J.W.; Botha, F.C.; Birch, R.G. Metabolic engineering of sugars and simple sugar derivatives in plants. Plant Biotechnol. J. 2013, 11, 142–156. [Google Scholar] [CrossRef] [PubMed]
- Bieleski, R. Sugar alcohols. In Plant Carbohydrates I; Springer: Berlin/Heidelberg, Germany, 1982; pp. 158–192. [Google Scholar]
- Reidel, E.J.; Rennie, E.A.; Amiard, V.; Cheng, L.; Turgeon, R. Phloem loading strategies in three plant species that transport sugar alcohols. Plant Physiol. 2009, 149, 1601–1608. [Google Scholar] [CrossRef] [PubMed] [Green Version]
- Shen, C.; Wang, J.; Jin, X.; Liu, N.; Fan, X.; Dong, C.; Shen, Q.; Xu, Y. Potassium enhances the sugar assimilation in leaves and fruit by regulating the expression of key genes involved in sugar metabolism of Asian pears. Plant Growth Regul. 2017, 83, 287–300. [Google Scholar] [CrossRef]
- Nosarzewski, M.; Downie, A.B.; Wu, B.; Archbold, D.D. The role of sorbitol dehydrogenase in Arabidopsis thaliana. Funct. Plant Biol. 2012, 39, 462–470. [Google Scholar] [CrossRef]
- Park, S.W.; Song, K.J.; Kim, M.Y.; Hwang, J.-H.; Shin, Y.U.; Kim, W.-C.; Chung, W.-I. Molecular cloning and characterization of four cDNAs encoding the isoforms of NAD-dependent sorbitol dehydrogenase from the Fuji apple. Plant Sci. 2002, 162, 513–519. [Google Scholar] [CrossRef]
- Zhou, R.; Cheng, L.; Dandekar, A.M. Down-regulation of sorbitol dehydrogenase and up-regulation of sucrose synthase in shoot tips of the transgenic apple trees with decreased sorbitol synthesis. J. Exp. Bot. 2006, 57, 3647–3657. [Google Scholar] [CrossRef]
- Meng, D.; He, M.; Bai, Y.; Xu, H.; Dandekar, A.M.; Fei, Z.; Cheng, L. Decreased sorbitol synthesis leads to abnormal stamen development and reduced pollen tube growth via an MYB transcription factor, MdMYB39L, in apple (Malus domestica). New Phytol. 2018, 217, 641–656. [Google Scholar] [CrossRef] [Green Version]
- He, W.; Chen, Y.; Gao, M.; Zhao, Y.; Xu, Z.; Cao, P.; Zhang, Q.; Jiao, Y.; Li, H.; Wu, L. Transcriptome analysis of Litsea cubeba floral buds reveals the role of hormones and transcription factors in the differentiation process. G3 Genes Genomes Genet. 2018, 8, 1103–1114. [Google Scholar] [CrossRef] [Green Version]
- Fan, L.; Chen, M.; Dong, B.; Wang, N.; Yu, Q.; Wang, X.; Xuan, L.; Wang, Y.; Zhang, S.; Shen, Y. Transcriptomic analysis of flower bud differentiation in Magnolia sinostellata. Genes 2018, 9, 212. [Google Scholar] [CrossRef] [Green Version]
- Zhu, L.; Guan, Y.; Liu, Y.; Zhang, Z.; Jaffar, M.A.; Song, A.; Chen, S.; Jiang, J.; Chen, F. Regulation of flowering time in chrysanthemum by the R2R3 MYB transcription factor CmMYB2 is associated with changes in gibberellin metabolism. Hortic. Res. 2020, 7, 96. [Google Scholar] [CrossRef] [PubMed]
- Azuma, M.; Morimoto, R.; Hirose, M.; Morita, Y.; Hoshino, A.; Iida, S.; Oshima, Y.; Mitsuda, N.; Ohme-Takagi, M.; Shiratake, K. A petal-specific InMYB1 promoter from Japanese morning glory: A useful tool for molecular breeding of floricultural crops. Plant Biotechnol. J. 2016, 14, 354–363. [Google Scholar] [CrossRef]
- Müller, D.R.; Schmitz, G.; Theres, K. Blind homologous R2R3 Myb genes control the pattern of lateral meristem initiation in Arabidopsis. Plant Cell 2006, 18, 586–597. [Google Scholar]
- Lau, S.-E.; Schwarzacher, T.; Othman, R.Y.; Harikrishna, J.A. dsRNA silencing of an R2R3-MYB transcription factor affects flower cell shape in a Dendrobium hybrid. BMC Plant Biol. 2015, 15, 194. [Google Scholar] [CrossRef] [PubMed] [Green Version]
- Tan, C.; Liu, Z.; Huang, S.; Li, C.; Ren, J.; Tang, X.; Liu, W.; Peng, S.; Feng, H. Pectin methylesterase inhibitor (PMEI) family can be related to male sterility in Chinese cabbage (Brassica rapa ssp. Pekinensis). Mol. Genet. Genom. 2018, 293, 343–357. [Google Scholar] [CrossRef] [PubMed]
- Chen, C.; Liu, S.; Hao, X.; Chen, G.; Cao, B.; Chen, Q.; Lei, J. Characterization of a Pectin Methylesterase Gene Homolog, CaPME1, Expressed in Anther Tissues of Capsicum annuum L. Plant Mol. Biol. Rep. 2012, 30, 403–412. [Google Scholar] [CrossRef]
- David, P.-L.; Deyholos, M.K. Pectinmethylesterases (PME) and Pectinmethylesterase Inhibitors (PMEI) Enriched during Phloem Fiber Development in Flax (Linum usitatissimum). PLoS ONE 2014, 9, e105386. [Google Scholar] [CrossRef]
- Du, W.; Pan, Z.-Y.; Hussain, S.B.; Han, Z.-X.; Peng, S.-A.; Liu, Y.-Z. Foliar Supplied Boron Can Be Transported to Roots as a Boron-Sucrose Complex via Phloem in Citrus Trees. Front. Plant Sci. 2020, 11, 250. [Google Scholar] [CrossRef]
- Tian, J.; Lu, X.; Chen, Q.; Kuang, X.; Liang, C.; Deng, L.-S.; Lin, D.; Cai, K.; Tian, J. Phosphorus fertilization affects soybean rhizosphere phosphorus dynamics and the bacterial community in karst soils. Plant Soil 2020, 1–16. [Google Scholar] [CrossRef]
- Buss, D.J.; Reznikov, N.; McKee, M.D. Crossfibrillar mineral tessellation in normal and Hyp mouse bone as revealed by 3D FIB-SEM microscopy. J. Struct. Biol. 2020, 212, 107603. [Google Scholar] [CrossRef]
- Shi, C.-Y.; Hussain, S.B.; Yang, H.; Bai, Y.-X.; Khan, M.A.; Liu, Y.-Z. CsPH8, a P-type proton pump gene, plays a key role in the diversity of citric acid accumulation in citrus fruits. Plant Sci. 2019, 289, 110288. [Google Scholar] [CrossRef] [PubMed]
- Livak, K.J.; Schmittgen, T.D. Analysis of Relative Gene Expression Data Using Real-Time Quantitative PCR and the 2−ΔΔCT Method. Methods 2001, 25, 402–408. [Google Scholar] [CrossRef] [PubMed]
- Hwang, H.S.; Jeong, H.W.; Lee, H.R.; Jo, H.G.; Kim, H.M.; Hwang, S.J. Acceleration of Flower Bud Differentiation of Runner Plants in “Maehyang” Strawberries Using Nutrient Solution Resupply during the Nursery Period. Agronomy 2020, 10, 1127. [Google Scholar] [CrossRef]
- Luo, T.; Zhang, J.; Khan, M.N.; Liu, J.; Xu, Z.; Hu, L. Temperature variation caused by sowing dates significantly affects floral initiation and floral bud differentiation processes in rapeseed (Brassica napus L.). Plant Sci. 2018, 271, 40–51. [Google Scholar] [CrossRef]
- Kebrom, T.H.; Mullet, J.E. Photosynthetic leaf area modulates tiller bud outgrowth in sorghum. Plant Cell Environ. 2015, 38, 1471–1478. [Google Scholar] [CrossRef] [Green Version]
- Corot, A.; Roman, H.; Douillet, O.; Autret, H.; Perez-Garcia, M.-D.; Citerne, S.; Bertheloot, J.; Sakr, S.; Leduc, N.; Demotes-Mainard, S. Cytokinins and abscisic acid act antagonistically in the regulation of the bud outgrowth pattern by light intensity. Front. Plant Sci. 2017, 8, 1724. [Google Scholar] [CrossRef]
- Zhang, Q.-J.; Tao, S.-T.; Li, M.; Qi, X.-X.; Wu, J.; Yin, H.; Deng, J.-L.; Zhang, S.-L. Identification of differentially expressed genes using digital gene expression profiles in Pyrus pyrifolia Nakai cv. Hosui bud release following early defoliation. Tree Genet. Genomes 2015, 11, 34. [Google Scholar] [CrossRef]
- Dong, X.; Wang, Z.; Tian, L.; Zhang, Y.; Qi, D.; Huo, H.; Xu, J.; Li, Z.; Liao, R.; Shi, M. De novo assembly of a wild pear (Pyrus betuleafolia) genome. Plant Biotechnol. J. 2020, 18, 581–595. [Google Scholar] [CrossRef] [Green Version]
- Wang, N.; Yang, C.; Pan, Z.; Liu, Y.; Peng, S.A. Boron deficiency in woody plants: Various responses and tolerance mechanisms. Front. Plant Sci. 2015, 6, 916. [Google Scholar] [CrossRef] [Green Version]
- Musacchi, S.; Iglesias, I.; Neri, D. Training systems and sustainable orchard management for European pear (Pyrus communis L.) in the Mediterranean area: A review. Agronomy 2021, 11, 1765. [Google Scholar] [CrossRef]
- Hu, H.; Penn, S.G.; Lebrilla, C.B.; Brown, P.H. Isolation and characterization of soluble boron complexes in higher plants (the mechanism of phloem mobility of boron). Plant Physiol. 1997, 113, 649–655. [Google Scholar] [CrossRef] [PubMed] [Green Version]
- Gholizadeh, J.; Sadeghipour, H.R.; Abdolzadeh, A.; Hemmati, K.; Vahdati, K. Bud break accompanies with the enhanced activities of hemicellulase and pectinase and the mobilization of cell wall thickenings in Persian walnut bud scales. Trees 2021, 35, 1399–1410. [Google Scholar] [CrossRef]
- Zhao, X.; Han, X.; Wang, Q.; Wang, X.; Chen, X.; Li, L.; Fu, X.; Gao, D. EARLY BUD BREAK 1 triggers bud break in peach trees by regulating hormone metabolism, the cell cycle, and cell wall modifications. J. Exp. Bot. 2020, 71, 3512–3523. [Google Scholar] [CrossRef] [PubMed]
- Walter, W.; Sánchez-Cabo, F.; Ricote, M. GOplot: An R package for visually combining expression data with functional analysis. Bioinformatics 2015, 31, 2912–2914. [Google Scholar] [CrossRef]
- Jung, N.U.; Giarola, V.; Chen, P.; Knox, J.P.; Bartels, D. Craterostigma plantagineum cell wall composition is remodelled during desiccation and the glycine-rich protein CpGRP1 interacts with pectins through clustered arginines. Plant J. 2019, 100, 661–676. [Google Scholar] [CrossRef] [Green Version]
- Zhang, H.; Guo, Z.; Zhuang, Y.; Suo, Y.; Du, J.; Gao, Z.; Pan, J.; Li, L.; Wang, T.; Xiao, L. MicroRNA775 regulates intrinsic leaf size and reduces cell wall pectin levels by targeting a galactosyltransferase gene in Arabidopsis. Plant Cell 2021, 33, 581–602. [Google Scholar] [CrossRef]
- Wang, D.; Yeats, T.H.; Uluisik, S.; Rose, J.K.; Seymour, G.B. Fruit softening: Revisiting the role of pectin. Trends Plant Sci. 2018, 23, 302–310. [Google Scholar] [CrossRef]
- Kim, J.-H.; Lee, Y.; Kim, E.-J.; Gu, S.; Sohn, E.J.; Seo, Y.S.; An, H.J.; Chang, Y.-S. Exposure of iron nanoparticles to Arabidopsis thaliana enhances root elongation by triggering cell wall loosening. Environ. Sci. Technol. 2014, 48, 3477–3485. [Google Scholar] [CrossRef]
- Rose, J.K.; Saladié, M.; Catalá, C. The plot thickens: New perspectives of primary cell wall modification. Curr. Opin. Plant Biol. 2004, 7, 296–301. [Google Scholar] [CrossRef]
- Chen, G.; Ye, X.; Zhang, S.; Zhu, S.; Yuan, L.; Hou, J.; Wang, C. Comparative transcriptome analysis between fertile and CMS flower buds in Wucai (Brassica campestris L.). BMC Genom. 2018, 19, 908. [Google Scholar] [CrossRef]
- Feng, G.; Xu, X.; Xu, L.; Yang, Z.; Nie, G.; Ma, X.; Huang, L.; Zhang, X. Comparative Transcript Profiling Suggests Distinct Flowering Response of Early-and Late-Flowering Phenotypes in Forage Grass Dactylis glomerata L. J. Plant Growth Regul. 2021, 40, 2124–2138. [Google Scholar] [CrossRef]
- Yap, Y.-M.; Loh, C.-S.; Ong, B.-L. Regulation of flower development in Dendrobium crumenatum by changes in carbohydrate contents, water status and cell wall metabolism. Sci. Hortic. 2008, 119, 59–66. [Google Scholar] [CrossRef]
- Louvet, R.; Cavel, E.; Gutierrez, L.; Guénin, S.; Roger, D.; Gillet, F.; Guerineau, F.; Pelloux, J. Comprehensive expression profiling of the pectin methylesterase gene family during silique development in Arabidopsis thaliana. Planta 2006, 224, 782–791. [Google Scholar] [CrossRef]
- Peaucelle, A.; Louvet, R.; Johansen, J.N.; Salsac, F.; Morin, H.; Fournet, F.; Belcram, K.; Gillet, F.; Höfte, H.; Laufs, P. The transcription factor BELLRINGER modulates phyllotaxis by regulating the expression of a pectin methylesterase in Arabidopsis. Development 2011, 138, 4733–4741. [Google Scholar] [CrossRef] [PubMed] [Green Version]
- Di Matteo, A.; Giovane, A.; Raiola, A.; Camardella, L.; Bonivento, D.; De Lorenzo, G.; Cervone, F.; Bellincampi, D.; Tsernoglou, D. Structural basis for the interaction between pectin methylesterase and a specific inhibitor protein. Plant Cell 2005, 17, 849–858. [Google Scholar] [CrossRef] [Green Version]
- Hocq, L.; Sénéchal, F.; Lefebvre, V.; Lehner, A.; Domon, J.-M.; Mollet, J.-C.; Dehors, J.; Pageau, K.; Marcelo, P.; Guérineau, F. Combined experimental and computational approaches reveal distinct pH dependence of pectin methylesterase inhibitors. Plant Physiol. 2017, 173, 1075–1093. [Google Scholar] [CrossRef] [Green Version]
- Liao, S.; Wang, L.; Li, J.; Ruan, Y.-L. Cell wall invertase is essential for ovule development through sugar signaling rather than provision of carbon nutrients. Plant Physiol. 2020, 183, 1126–1144. [Google Scholar] [CrossRef] [PubMed] [Green Version]
- Ko, H.-Y.; Ho, L.-H.; Neuhaus, H.E.; Guo, W.-J. Transporter SlSWEET15 unloads sucrose from phloem and seed coat for fruit and seed development in tomato. Plant Physiol. 2021, 187, 2230–2245. [Google Scholar] [CrossRef] [PubMed]
Publisher’s Note: MDPI stays neutral with regard to jurisdictional claims in published maps and institutional affiliations. |
© 2022 by the authors. Licensee MDPI, Basel, Switzerland. This article is an open access article distributed under the terms and conditions of the Creative Commons Attribution (CC BY) license (https://creativecommons.org/licenses/by/4.0/).