Article

Assessment of Fermentative Quality of Ensiled High-Moisture Maize Grains by a Multivariate Modelling Approach

Department of Animal Medicine, Production and Health, University of Padova, 35020 Legnaro, Italy
*
Author to whom correspondence should be addressed.
Agronomy 2022, 12(2), 429; https://doi.org/10.3390/agronomy12020429
Submission received: 18 January 2022 / Revised: 2 February 2022 / Accepted: 7 February 2022 / Published: 9 February 2022
(This article belongs to the Special Issue Research Progress and Future Perspectives of Silage)

Abstract

:
The study aimed to define a grain-adapted quality score (GQS) to assess the fermentative pattern of ensiled high-moisture maize grain (EMG) based on organic acids, ammonia, and ethanol data of a lab-scale dataset. The GQS was validated by comparison with both the Flieg-Zimmer’s quality score (FQS) and a standardized quality score (SQS) by a received operating analysis. Compared with FQS and SQS, the cut-offs of poor/good samples for the proposed GQS were 47 (accuracy of 0.94) and 71 points (accuracy of 0.88) over 100, respectively. The relationship among indices was also tested in a farm-derived dataset by arranging a confusion matrix, which showed the higher predictive performance considering the lower cut-off. On the lab-scale dataset, a factorial discriminant analysis (FDA) assessed the most predictive chemical post-ensiled traits able to segregate EMG samples according to three fermentative quality classes of GQS. High-quality samples were accurately determined as having a positive correlation with lactate, while low- and middle-quality ones were partially overlapped and correlated with NH3-N, butyrate, and propionate. The validation of the FDA model in the blind farm-derived dataset confirms the effectiveness of the proposed GMS to rank between poorly- or well-preserved EMG.

1. Introduction

As a high nutritional value farm-made concentrate, maize (Zea mays L.) silage of the whole-plant or its starch-rich fractions (i.e., ear or grain) has been proposed to integrate the total mixed ration (TMR) to support the productive performance of ruminants under intensive rearing systems [1,2]. Regarding dairy cow feeding, ensiling high-moisture maize grain (EMG) seemed to increase starch digestibility and the net energy for lactation in dairy cows due to the increased surface area for bacterial enzymatic degradation and the breakdown of the hydrophobic starch-protein matrix [3]. Ensiling is a microbiologically driven process based on anaerobic fermentation mainly via lactic acid bacteria with a well-established fermentative pattern, especially for the whole-plant maize silage [4,5]. Despite the increasing inclusion of EMG in cattle feeding, evaluating the overall fermentative quality of high-moisture ensiled maize grain is still a challenge [6,7]. The chemical composition of EMG is related to maize variety, crop management practices, and plant maturity at harvest that affects grains’ dry matter and starch contents [8]. In addition, a prolonged natural drying of maize grains in the field may reduce the proportion of lactic acid bacteria due to a stress of the epiphytic microbiota with impairment of fermentation capacity during the ensiling process [9]. A correct ensiling procedure might be carried out with the primary purposes of preventing dry matter and energy losses and limiting the production of inedible and toxic compounds due to aerobic ad anaerobic microbial activity [10]. For this purpose, low pH should be achieved through anaerobic fermentation of the water-soluble carbohydrates via homofermentative bacteria to lactic acid and low amounts of other volatile acids (i.e., propionate and butyrate). Moreover, the degradation of proteins and other N-compounds to ammonia nitrogen and alcohol production (i.e., ethanol) must be minimized [11].
Despite being a well-known ensiling process, there is a need for a comprehensive and rapid assessment of the fermentative quality of ensiled and preserved maize grain silages, especially in farm-ensiling conditions where the variability of the process largely affects the rate and extent of the main fermentation compounds production. There are no fermentation quality indices specific to high-moisture maize grain silage so far, unlike for whole-plant maize silage [4,12,13]. Therefore, the research suggested and validated a grain-adapted quality score (GQS) for ensiled high-moisture maize grains (EMG). This purpose was achieved by using the data of an experimental trial to build the GQS and model the interactions among the main fermentative chemical traits in a multivariate framework. Furthermore, the GQS was performed on a wide collection of farm-derived silage samples used as an independent test set to evaluate the reliability of the supervised pattern recognition procedure.

2. Materials and Methods

2.1. Experimental Design, Sampling Datasets, and Ensiling Procedure

A first specimen (n = 80) collection of EMG refers to an experimental trial (lab-scale or dataset A) that was carried out during the summer seasons of 2019 in the lowland of the middle Veneto region (N 45°22′45″, E 11°35′50″; Northeast Italy). To have EMG samples representative of the variability in maize (Zea mays L.) plants cultivation, plants belonging to five early (FAO class 200) and five late (FAO class 600–700) hybrids were sown in field conditions characterized by medium-to-poor yield potential (around a maize silage crop production of 55 tonnes ha−1) and medium water availability for irrigation. High-moisture (around 65% dry matter) maize grain (EMG) samples were harvested with a plot harvesting machine at a medium-early ripening phase (2/3 of milk stage). The maize grain samples were immediately milled in a laboratory knife miller and blender (Grindomix GM 200, Retsch GmbH, Verder Scientific, Haan, Germany) at 4000 rpm for 60 s. Two replicates per sample were ensiled (on average 500 ± 50 g) in vacuum-packed bags (Orved 2633040, Orved SpA, Musile di Piave, Italy) as reported by Andrighetto et al. [14], and then stored in a dark room at 23 ± 2 °C for 60 days. The use of laboratory-scale silos was chosen to ensure a standardized and controlled ensiling procedure. A second dataset (n = 201) refers to samples collected in field conditions in farms where maize grain concentrates are produced in-situ to feed lactating dairy cows (farm-derived or dataset B). These samples belong to a two-year collection (2018–2019) of EMG, including a broad group of FAO class hybrids grown in areas of the Veneto region (Northern Italy) with a wide agronomic potential and irrigation water availability; moreover, they were obtained through different ensiling management practices. The EMG samples collected from dairy farms were all ensiled in concrete bunker silos. Overall, the own-farm high-moisture maize grain was ensiled as ground (mesh diameter screen of 3–7 mm) grain (60–65% of dry matter) packed in silos to achieve a bulk density of around 1000 kg of fresh matter m−3. The bunker silos were characterized by a wide range of storage capacity (200–1000 m3), different length extension (6–10 m × 12–35 m × 2.5–3.5 m of width, length, and mass height, respectively), as well as the plastic cover used to minimize oxygen penetration. Therefore, the farm-derived dataset provided a basket of samples representative of the harvesting and ensiling variability in EMG fermentative quality and were collected on average after 162 ± 56 (median, 167; min, 56; max, 248; interquartile range, 43) days of ensiling. As described below, experimental dataset (A) was used to determine the fermentative quality indices, and the farm-ensiling dataset (B) was used as an external dataset to validate them.

2.2. Chemical Analysis and Description of Fermentative Quality Indices

Dry matter (DM) and ash were determined using the #934.01 and #942.05 AOAC procedures [15]. The AOAC methods #2001.11 [16], #2003.05 [17], and #996.11 [18] were used for crude protein (CP), ether extract (EE), and starch, respectively. The neutral detergent (NDF) and acid detergent (ADF) fiber fractions were determined using an Ankom Fiber Analyzer (Ankom Technology Corporation, Fairport, NY, USA). The aNDF was performed with sodium sulfite, heat-stable alpha-amylase, F57 bags with 25 μm pore size and included residual ash [19,20]; non-sequential ADF was evaluated according to Vogel et al. 1999 [21].
Lactate, acetate, propionate, butyrate, and ethanol were extracted in acid solution (sulphuric acid 0.6 N) and analyzed using high-performance liquid chromatography (HPLC) [22]. Briefly, the EMG samples were homogenized for 4 min in a blender (Stomacher BR400, Astori Tecnica, Poncarale, BS, Italy), then the mixture was roughly filtered in a 50 mL tube, centrifuged at 4000 g for 10 min, and filtered again through a 0.45 µm filter. A 20 µL aliquot of the solution was analyzed using an HPLC apparatus (Shimadzu 10AVP HPLC System, Shimadzu, Tokyo, Japan) equipped with a SIL 10 auto-sampler and a RID 10A detector, and a 300 × 7.8 mm column (Aminex HPX-87H HPLC, Bio-Rad, Hercules, CA, USA) set at 40 °C with H2SO4 0.0025 N as the mobile phase (0.6 mL min−1). Ammonia nitrogen (NH3-N) was measured by the Megazyme’s ammonia assay kit (Megazyme International, Bray, Wicklow, Ireland); pH by using a pH meter (827 pH lab; Metrohm, Herisau, Switzerland).
Three fermentative quality indices were determined for all EMG samples using lactate, acetate, butyrate, ethanol, ammonia concentration, and pH from the experimental dataset A (Table 1). The relation between each variable score and its measured value was considered positive for lactate and negative for the other variables (acetate, butyrate, ethanol, ammonia, and pH). The first index was the well-known Flieg-Zimmer’s score (FQS) that was calculated by adding up the single scores attributed to lactate, butyrate, and acetate based on a 100 score range; the cut-off for the poor/good quality classes was set at 80 points [14]. As reported in Table 2, the second fermentative quality index was built using a mathematical procedure that defined a standardized quality score (SQS) using a five-point set (0.2, 0.4, 0.6, 0.8, and 1.0) related to ranks which were calculated as average plus or minus 1 and 2 standard deviations (s.d.).
Lactate scores were assigned a positive relationship. The scores for the other variables were attributed a negative correlation. The sum of the six scores of the SQS index was normalized (mean and s.d. equal to 0 and 1, respectively) and the cut-off for the poor/good quality classes was the value 1 (mean + s.d.). The third is the proposed fermentative quality index, defined as a grain-adapted quality score (GQS). It was determined by assigning a maximum of 100 points based on the sum of the results of a set of six linear regression equations for the same set of chemical variables used to determine the SQS. A score interval was given to each variable, and a linear regression equation was run to assign the score for each variable based on its measured value (Table 3).

2.3. Statistical Analysis

Since the fermentative quality indices were normally distributed as assessed by the Shapiro-Wilk test (PROC UNIVARIATE), a correlation analysis (Pearson coefficient, r, PROC CORR) was carried out comparing the values of FQS, SQS, and GQS indices by using the SAS software (9.4 release, SAS Institute Inc., Cary, NC, USA).
Based on the data of the experimental (lab-scale) dataset A, an analysis of the association between the grain-adapted (GQS) and the FQS or SQS was performed by a receiver operating characteristic (ROC) approach throughout the MedCalc (R) software (Version 17.6, MedCalc Software, Ostend, Belgium). Both FQS and SQS were used as gold standards and dichotomized in two levels (poor/good quality) by using the cut-offs of 80 [14] and 1 (one standard deviation), respectively. Applying the Youden criterion, which maximizes the sensitivity and specificity of the test, two significant cut-off values between poor and good quality ensiled maize grain (EMG) samples were found for GQS. The area under the curve (AUC) was used to test the accuracy of the ROC analysis, and it represents the performance measurements in predicting the two classes (good or poor quality) since it is plotted with the true positive rate (sensitivity) against false positive rate (specificity) [23]. The farm-related dataset B was used as an external validation set to assess the reliability of the two GQS cut-offs obtained by the ROC analysis arranging two confusion matrices.
The GQS values of the experimental dataset A were split into three classes by the use of mean (55.1) ± standard deviation (15.3) as threshold: low-quality (L-class) < 39.8; medium-quality (M-class) between 39.8 and 70.4; high-quality (H-class) > 70.4. Using these qualitative classes within the prediction factor GQS, the chemical traits of EMG samples of dataset A formed the matrix that was subjected to supervised multivariate factorial discriminant analysis (FDA), which split the total variance into two main canonical discriminant factors named F1 and F2 (XLSTAT software, release 2016, Addinsoft, New York, USA). A scattergram of the outcomes of the FDA was plotted to classify the three quality classes of GQS along with F1 and F2; the correlation coefficients (with absolute value greater than 0.50) between the original chemical traits and F1 and F2 were also plotted. The reliability of the FDA classification model was validated by using the farm-derived dataset (dataset B). For each sample of the blind validation dataset B, the predicted probability of being assigned to one of the three fermentative quality classes was calculated based on the regression coefficients estimated by the FDA model developed in the training dataset A, and a confusion matrix was built. The classification performance of the confusion matrices was assessed by a set of descriptive statistics, including sensitivity, specificity, accuracy, precision, and Matthews correlation coefficient (MCC) [24].

3. Results

3.1. Fermentative Quality Pattern and Indices

The EMG samples of the experimental and farm-derived datasets (A and B, respectively) showed similar proximate composition and fermentative quality traits (Table 1). However, the EMG samples obtained under field operative conditions (farm-derived dataset) showed a higher percentage of acetate and NH3-N, while ethanol content was lower. Both FQS and GQS had similar mean and standard deviation in the two datasets.

3.2. Validation of Grain-Adapted Quality Score (GQS)

The Pearson correlation (r) test highlighted a strong and positive relationship (r = 0.79; p < 0.001) between GQS and FQS, and a weaker relationship between GQS and SQS (r = 0.40; p < 0.001). Table 4 reported the outcomes of the two receiver operating characteristic (ROC) analyses performed to assess the cut-off between poor and good-quality silages of the proposed GQS compared to the FQS and SQS gold standard.
Referring to the well-known FQS for which the threshold value between poor or good fermentative quality was set at 80 points, the cut-off for GQS was 46.6 with an accuracy (area under the curve, AUC) of 0.94. As regards SQS, which had a threshold value of 1 (as a result of mean plus standard deviation), the cut-off was higher (70.5) and characterized by a lower accuracy (0.88). The reliability of the ROC algorithms in assessing the cut-offs of the GQS was performed by arranging two confusion matrices in the external farm-derived dataset. Considering the relationship between GQS and FQS, the coherence of poor/good assignment was satisfactory because of the high values of the descriptive statistics such as accuracy and MCC. A lower correlation between GQS and SQS was observed due to a substantial misclassification, especially in the assignment of the good quality class showing a level of sensitivity of 0.13 that reduced both accuracy and MCC values (Table 5).

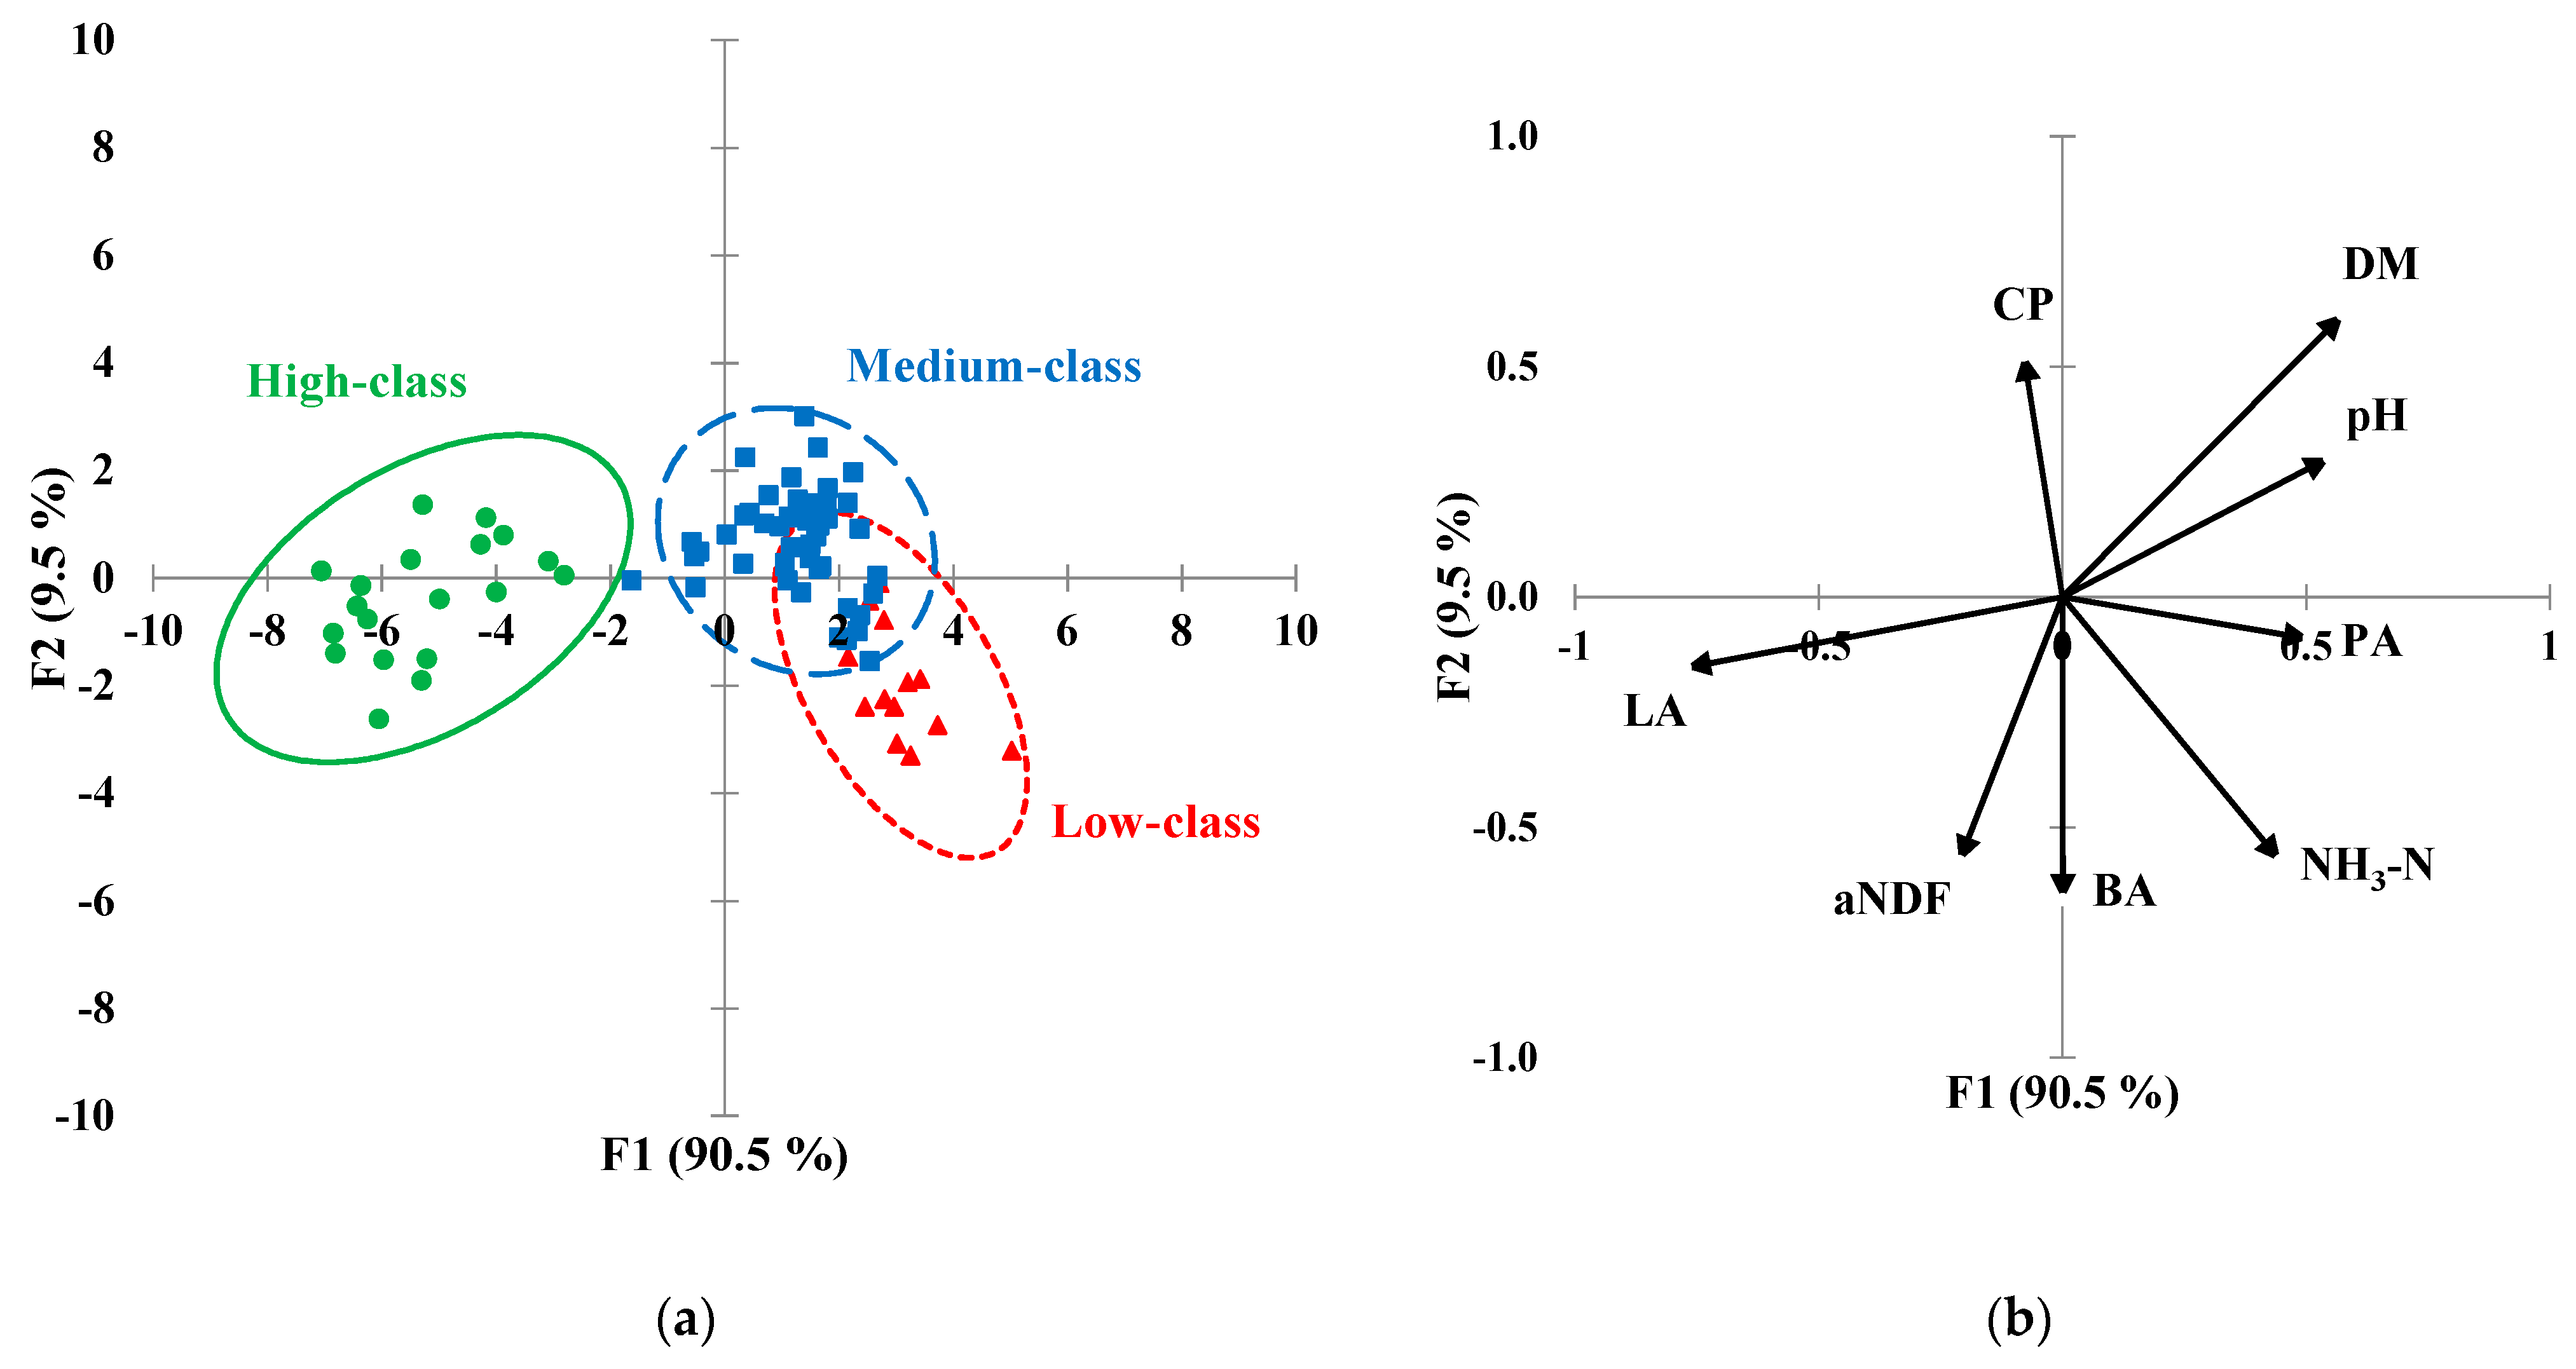
3.3. Classification Algorithm

The FDA showed a high discriminating capacity (Wilks’s λ = 0.048, approximately F value = 16.3, df1 = 28, df2 = 128, p < 0.001) among the three GQS quality classes based on two main discriminant factors, F1 and F2, which accounted for the 90.5 and 9.5% of the total variability, respectively (Figure 1). Based on univariate ANOVA-features selection (p < 0.05), DM, CP, aNDF, ADF, starch, lactate, propionate, butyrate, ammonia, and pH were included in the chemical set giving the highest classification performance. Among these variables, those with absolute correlation coefficient values higher than 0.50 with F1 and/or F2 were also plotted to separate the fermentative quality classes of GQS (Figure 1).
The reliability of the FDA model was assessed by an external validation on the farm-derived dataset B. The main findings indicated an accurate classification of samples of the H-class (accuracy = 0.86 and MCC = 0.57), while the partial overlapping of L- and M-class observed in the FDA scatterplot was confirmed by a relative high misclassification rate between their samples, although a moderate uncorrected prediction was also observed between M- and H-samples (Table 6).

4. Discussion

The experimental trial was designed to develop and validate the grain-adapted quality score (GQS), a synthetic indicator for evaluating the quality of ensiled high-moisture maize grain (EMG), throughout a multivariate modeling approach. To validate the proposed GQS, a comparison was carried out using the Flieg-Zimmer’s score (FQS), a gold standard in assessing the quality of whole-plant maize silages [14,25]. Moreover, to test the reliability of the GQS, it was compared with the normalized SQS, where no pre-set different weights were given to each chemical trait, in an attempt to summarize the whole chemical dataset in a comprehensive standardized score [25]. A multivariate FDA modeling approach was also performed, categorizing the GQS into three classes to identify the most informative original chemical traits influencing the quality of the EMG samples and summarizing them in two latent discriminant factors that allow for spatial dimension reduction [26].
As for the whole plant maize silage, the botanical and agronomic management and the ensiling practices strongly affect the chemical and fermentative characteristics of the EMG [27]. However, the chemical composition of EMG samples of both datasets investigated in our trial is consistent with the literature [8,12], reporting average values (g kg−1) of 695 for starch, 92 for CP, and 79 for aNDF. The proximate composition was in agreement with data referring to high-moisture maize grain harvested as non-mature plants and thus ensiled without any rehydration practice to promote a positive fermentation process [3]. Concerning the fermentative quality pattern, the number of organic acids (i.e., lactate and acetate), ethanol, and ammonia-nitrogen were also in accordance with the literature [7,8], even though lactate seemed to be lower in the present study [28].
The high content in lactate combined with the low pH and the low value in butyrate suggests an adequate ensiling process for the samples of both datasets [28]. However, a higher amount of ethanol and a lower production of acetate and NH3-N were observed for the maize grain samples ensiled in experimental conditions compared with farm-derived conditions. The high ethanol concentration might be due to a more intense heterolactic fermentation or higher yeast counts, probably attributable to a decreased accumulation of fermentation products with antifungal properties, such as acetic acid [28,29]. As a result of amino acids deamination, the higher concentration of NH3-N recorded in samples collected directly in the dairy farms might be only partially explained by the more extended ensiling period (162 vs. 60 days). Indeed, the rate and extent of proteolysis are associated with the physical-chemical traits of the grain (i.e., vitreousness degree, maturity stage) and its protein fraction (i.e., zein content, protein-starch matrix) [30,31]. The higher ammonia-N percentage observed in farm-derived EMG samples might be related to the breakdown of the hydrophobic starch-protein matrix and a higher potential degradation of proteins; the latter are soluble in lactic and acetic acids and then more easily degraded by proteolytic activity of active plant enzymes or bacterial proteases [8].
The indices proposed in the current study assessing the quality of EMG were calculated using lactate, acetate, and butyrate for FQS, with the addition of ammonia, ethanol, and pH for SQS and GQS, similar to the reference scores proposed for the evaluation of the fermentative quality of whole-plant maize silage [10,14]. The organic acids are homolactic, heterolactic, and clostridia fermentation indicators, while ammonia weighs the level of N-compounds degradation [32]. The pH and ethanol are helpful to deepen information regarding the intensity and the causal agents of fermentation, especially in relation to the detrimental role of yeasts and other heterofermentative microorganisms, and the acetic acid is considered to have antimycotic activity [33]. Among the four chemical traits used to calculate the scores, the higher weight was assigned to the high concentration of lactic acid because it is a good index of an extent homolactic fermentation, and its concentration and the consequent accumulation of hydrogen ions discourage the activity of undesirable microorganisms like clostridia and enterobacteria [9,34]. Subsequently, equal importance was given to ammonia and ethanol, which should both be low in concentration in well-preserved silages. As stated above, ammonia tends to accumulate due to the degradation of amino acids and peptides, both during homolactic fermentation and through proteolytic enterobacteria and clostridia. The degradation of CP to NPN compounds (i.e., peptides and free AA) occurs during the ensiling process by the proteolysis activity of plant enzymes. However, due to the microbial activity during desmolysis, a further chemical reduction to NH3 and amines can deleteriously influence the quality of N-compounds in ensiled maize grain, leading to adverse effects such as reducing dry matter intake and the worsening of health conditions in animals [35].
Based on the results of the Pearson correlation test and of the effectiveness of the ROC-classifier model, the cut-off of 46.6 points for the GQS seems to be more appropriate to distinguish among poorly or well-preserved EMG samples. Indeed, based on the outcomes of the blind validation on the farm-scale dataset (validation dataset B), referring to the proposed GQS, a cut-off of around 50 points is suitable to assess between poor and good ensiled high-moisture maize grain samples silages. As for the new comprehensive scores proposed to revise the Flieg-Zimmer’s score in ranking the quality of whole-maize plant silages [14,25], the outcomes of the ROC analysis and the subsequent validation confirmed the capability of the GQS in the assessment of the silage fermentation traits of EMG. This is due to the positive weight of high lactate concentration and the scores assigned for a low amount of NH3-N, ethanol, and low pH values. Accounting for these additional post-ensiled chemical traits in the computation of GQS allows for deepening the role of heterofermentative bacteria and yeast in limiting the nutritional value and safety of EMG, and amplifying the score difference between poorly- or well-preserved silages. Compared with the FZS, which has a cut-off of 80 points, the greater range of points above this binary poor/good threshold (46.6) makes GQS most suitable to assess the fermentative quality of EMG by using more ranking classes.
To identify the more sensitive chemical traits in determining the fermentative quality of EMG samples, a factorial discriminant analysis (FDA) model was performed on the experimental lab-scale dataset by using three fermentative quality classes. This multivariate data analysis technique can highlight the differences among fermentative quality classes and identify the chemical variables indicative of their separation. The combined analysis of (a) and (b) in Figure 1 identified those chemical traits valuable to distinguishing the fermentative quality groups. The EMG samples from low quality-class (L-class) migrated toward the right and the bottom side of the plot (Figure 1a), characterized by a higher amount of NH3-N, butyrate, and also for a positive correlation with the aNDF content (Figure 1b). Whereas the EMG samples from high quality-class (H-class) showed a wider spatial 0.95-confidence interval (CI0.95) and migrated toward the left side of the plot mainly according to a higher content of lactate, underling that this organic acid is the primary specific chemical marker of an optimal ensiling process for maize grains [7,11]. The EMG samples belonging to the medium-quality class (M-class) tended to be spatially gathered in the center-right side of the plot and partially overlapped the L-class. The M-class seemed less distinguishable across the selected chemical variables, even if these samples tended to aggregate where F1 and F2 were positively correlated with DM, pH, and propionate. The post-ensiled DM content was correlated with the DM at harvest, an indicator of the plant maturity; early harvest was reported to be associated with higher lactic and partially with acetic acid content in maize silage, and the DM was also a risk factor for aerobic instability of the silage [36]. Indeed, the poorest and the highest quality EMG samples were accurately discriminated since the former was associated with higher N-NH3 and butyrate contents, and the latter strongly correlated with a higher lactate content. Although the external validation showed moderate reliability of the FDA in discriminating the EMG samples of the three fermentative quality classes, it could be stated that the FDA model built on a controlled experimental dataset might also be used to discriminate among poorly (L- and M-samples) vs. well (H-samples) ensiled and preserved farm-scale high-moisture maize grain using the proposed GMS as effective screening on the basis of a threshold most likely equal to 70 points. However, because 54% (26 out 48) of the H-samples were misclassified mainly as M-samples, but none of the L-samples were wrongly attributed to the H-class (Table 6), the cut-off of the lowest quality class was confirmed below 50 points as stated by the results of the ROC analysis. A further score between medium and very well preserved EMG samples remains a challenge that could be achieved with further experimental trials that diversify the ensiling procedures and the storage time.

5. Conclusions

The study provides a key insight into the definition of the grain-adapted quality score (GQS) as a comprehensive method to assess the fermentative pattern of high-moisture ensiled maize grain (EMG). The outcomes highlighted reliable accordance with the referenced Flieg-Zimmer’s score but with the advantage of improving the effectiveness in ranking maize grains based on their ensiling quality by including other organic acids, NH3-N, ethanol, and pH in the computation of the optimal fermentative pattern. A supervised multivariate model based on a factorial discriminating analysis (FDA) showed an accurate and reliable predicting capacity in discriminating between poorly and well ensiled and preserved maize grain samples, according to at least a binary criterion, mainly referring to the amount of lactate, butyrate, and NH3-N. Despite the validation of the proposed GQS index on a blind farm-derived dataset evidenced a moderate misclassification rate, it could be used as a benchmark for rapid screening to support an effective decision-making strategy by recognizing the fermentative quality of ensiled maize grain samples. The proposed grain-adapted quality score index should be further validated within a set of controlled silage-making procedures and tested in a feeding trial, especially for lactating dairy cows.

Author Contributions

Conceptualization, I.A., G.M. and L.S.; methodology, L.S. and I.A.; formal analysis, I.A. and S.S.; investigation, G.M., L.S. and L.M.; data curation and statistical analysis, B.C., L.S. and S.S.; writing—original draft preparation, S.S., G.M., L.S., B.C. and L.M.; writing—review and editing, S.S., G.M. and L.S.; visualization, B.C. and S.S.; supervision, L.S., S.S. and I.A.; project administration, L.S. and I.A.; funding acquisition, I.A. All authors have read and agreed to the published version of the manuscript.

Funding

This work was supported by the University of Padova (project number 60A08-7341 and project BIRD 213148 call 2021) and by KWS Italia S.p.A.

Data Availability Statement

The data that support the findings of this study are available from the corresponding author upon request.

Acknowledgments

The authors are grateful to Sandro Tenti and Massimo Mirisola of the NIRS-XRF-Wet Chemistry laboratory of the University of Padova for their analytical chemistry support and managing the field trials.

Conflicts of Interest

The authors declare no conflict of interest.

References

  1. Ferraretto, L.F.; Crump, P.M.; Shaver, R.D. Effect of cereal grain type and corn grain harvesting and processing methods on intake, digestion, and milk production by dairy cows through a meta-analysis. J. Dairy Sci. 2013, 96, 533–550. [Google Scholar] [CrossRef] [PubMed] [Green Version]
  2. Marchesini, G.; Cortese, M.; Ughelini, N.; Ricci, R.; Chinello, M.; Contiero, B.; Andrighetto, I. Effect of total mixed ration processing time on ration consistency and beef cattle performance during the early fattening period. Anim. Feed Sci. Technol. 2020, 262, 114421. [Google Scholar] [CrossRef]
  3. Castro, L.P.; Pereira, M.N.; Dias, J.D.L.; Lage, D.V.D.; Barbosa, E.F.; Melo, R.P.; Ferreira, K.; Carvalho, J.T.R.; Cardoso, F.F.; Pereira, R.A.N. Lactation performance of dairy cows fed rehydrated and ensiled corn grain differing in particle size and proportion in the diet. J. Dairy Sci. 2019, 102, 9857–9869. [Google Scholar] [CrossRef] [PubMed]
  4. Gallo, A.; Bertuzzi, T.; Giuberti, G.; Moschini, M.; Bruschi, S.; Cerioli, C.; Masoero, F. New assessment based on the use of principal factor analysis to investigate corn silage quality from nutritional traits, fermentation end products and mycotoxins. J. Sci. Food Agric. 2016, 96, 437–448. [Google Scholar] [CrossRef]
  5. Fabiszewska, A.U.; Zielińska, K.J.; Wróbel, B. Trends in designing microbial silage quality by biotechnological methods using lactic acid bacteria inoculants: A minireview. World J. Microbiol. Biotechnol. 2019, 35, 1–8. [Google Scholar] [CrossRef] [Green Version]
  6. Carvalho-Estrada, P.D.A.; De Andrade, P.A.M.; Paziani, S.D.F.; Nussio, L.G.; Quecine, M.C. Rehydration of dry corn preserves the desirable bacterial community during ensiling. FEMS Microbiol. Lett. 2020, 367, 76. [Google Scholar] [CrossRef]
  7. Gomes, A.L.M.; Bueno, A.V.I.; Jacovaci, F.A.; Donadel, G.; Ferraretto, L.F.; Nussio, L.G.; Jobim, C.C.; Daniel, J.L.P. Effects of processing, moisture, and storage length on the fermentation profile, particle size, and ruminal disappearance of reconstituted corn grain. J. Anim. Sci. 2020, 98, 1–9. [Google Scholar] [CrossRef]
  8. Fernandes, J.; da Silva, É.B.; Carvalho-Estrada, P.D.A.; Daniel, J.L.P.; Nussio, L.G. Influence of hybrid, moisture, and length of storage on the fermentation profile and starch digestibility of corn grain silages. Anim. Feed Sci. Technol. 2021, 271, 114707. [Google Scholar] [CrossRef]
  9. Carvalho-Estrada, P.D.A.; Fernandes, J.; da Silva, É.B.; Tizioto, P.; Paziani, S.D.F.; Duarte, A.P.; Coutinho, L.L.; Verdi, M.C.Q.; Nussio, L.G. Effects of hybrid, kernel maturity, and storage period on the bacterial community in high-moisture and rehydrated corn grain silages. Syst. Appl. Microbiol. 2020, 43, 126131. [Google Scholar] [CrossRef]
  10. Marchesini, G.; Serva, L.; Chinello, M.; Gazziero, M.; Tenti, S.; Mirisola, M.; Garbin, E.; Contiero, B.; Grandis, D.; Andrighetto, I. Effect of maturity stage at harvest on the ensilability of maize hybrids in the early and late FAO classes, grown in areas differing in yield potential. Grass Forage Sci. 2019, 74, 415–426. [Google Scholar] [CrossRef]
  11. Hoffman, P.C.; Esser, N.M.; Shaver, R.D.; Coblentz, W.K.; Scott, M.P.; Bodnar, A.L.; Schmidt, R.J.; Charley, R.C. Influence of ensiling time and inoculation on alteration of the starch-protein matrix in high-moisture corn. J. Dairy Sci. 2011, 94, 2465–2474. [Google Scholar] [CrossRef] [PubMed] [Green Version]
  12. Carvalho, B.F.; Ávila, C.L.S.; Bernardes, T.F.; Pereira, M.N.; Santos, C.; Schwan, R.F. Fermentation profile and identification of lactic acid bacteria and yeasts of rehydrated corn kernel silage. J. Appl. Microbiol. 2017, 122, 589–600. [Google Scholar] [CrossRef] [PubMed]
  13. Serva, L.; Marchesini, G.; Chinello, M.; Contiero, B.; Tenti, S.; Mirisola, M.; Grandis, D.; Andrighetto, I. Use of near-infrared spectroscopy and multivariate approach for estimating silage fermentation quality from freshly harvested maize. Ital. J. Anim. Sci. 2021, 20, 859–871. [Google Scholar] [CrossRef]
  14. Andrighetto, I.; Serva, L.; Gazziero, M.; Tenti, S.; Mirisola, M.; Garbin, E.; Contiero, B.; Grandis, D.; Marchesini, G. Proposal and validation of new indexes to evaluate maize silage fermentative quality in lab-scale ensiling conditions through the use of a receiver operating characteristic analysis. Anim. Feed Sci. Technol. 2018, 242, 31–40. [Google Scholar] [CrossRef]
  15. AOAC. Official Methods of Analysis, 17th ed.; AOAC: Gaithersburg, MD, USA, 2003. [Google Scholar]
  16. AOAC. Official Methods of Analysis, 18th ed.; AOAC: Gaithersburg, MD, USA, 2005. [Google Scholar]
  17. AOAC. Official Methods of Analysis, 18th ed.; AOAC: Gaithersburg, MD, USA, 2006. [Google Scholar]
  18. AOAC. Official Methods of Analysis, 17th ed.; AOAC: Gaithersburg, MD, USA, 2000. [Google Scholar]
  19. Ferreira, G.; Mertens, D.R. Measuring detergent fibre and insoluble protein in corn silage using crucibles or filter bags. Anim. Feed Sci. Technol. 2007, 133, 335–340. [Google Scholar] [CrossRef]
  20. Schlau, N.; Mertens, D.; Taysom, K.; Taysom, D. Technical note: Effects of filter bags on neutral detergent fiber recovery and fiber digestion in vitro. J. Dairy Sci. 2021, 104, 1846–1854. [Google Scholar] [CrossRef]
  21. Vogel, K.P.; Pedersen, J.F.; Masterson, S.D.; Toy, J.J. Evaluation of a Filter Bag System for NDF, ADF, and IVDMD Forage Analysis. Crop Sci. 1999, 39, 276–279. [Google Scholar] [CrossRef]
  22. Martillotti, F.; Puppo, S. Liquid chromatographic determination of organic acids in silages and rumen fluids. Ann. Dell’istituto Sper. Zootec. 1985, 18, 1–10. [Google Scholar]
  23. De Jesus Inacio, L.; Merlanti, R.; Lucatello, L.; Bisutti, V.; Contiero, B.; Serva, L.; Segato, S.; Capolongo, F. Pyrrolizidine alkaloids in bee pollen identified by LC-MS/MS analysis and colour parameters using multivariate class modeling. Heliyon 2020, 6, e03593. [Google Scholar] [CrossRef]
  24. Segato, S.; Merlanti, R.; Bisutti, V.; Montanucci, L.; Serva, L.; Lucatello, L.; Mirisola, M.; Contiero, B.; Conficoni, D.; Balzan, S.; et al. Multivariate and machine learning models to assess the heat effects on honey physicochemical, colour and NIR data. Eur. Food Res. Technol. 2019, 245, 2269–2278. [Google Scholar] [CrossRef]
  25. Gallo, A.; Giuberti, G.; Bruschi, S.; Fortunati, P.; Masoero, F. Use of principal factor analysis to generate a corn silage fermentative quality index to rank well- or poorly preserved forages. J. Sci. Food Agric. 2016, 96, 1686–1696. [Google Scholar] [CrossRef] [PubMed]
  26. Riuzzi, G.; Davis, H.; Lanza, I.; Butler, G.; Contiero, B.; Gottardo, F.; Segato, S. Multivariate modelling of milk fatty acid profile to discriminate the forages in dairy cows’ ration. Sci. Rep. 2021, 11, 1–11. [Google Scholar] [CrossRef] [PubMed]
  27. Ferraretto, L.F.; Shaver, R.D.; Luck, B.D. Silage review: Recent advances and future technologies for whole-plant and fractionated corn silage harvesting. J. Dairy Sci. 2018, 101, 3937–3951. [Google Scholar] [CrossRef] [PubMed]
  28. Da Silva, N.C.; Nascimento, C.F.; Campos, V.M.A.; Alves, M.A.P.; Resende, F.D.; Daniel, J.L.P.; Siqueira, G.R. Influence of storage length and inoculation with Lactobacillus buchneri on the fermentation, aerobic stability, and ruminal degradability of high-moisture corn and rehydrated corn grain silage. Anim. Feed Sci. Technol. 2019, 251, 124–133. [Google Scholar] [CrossRef]
  29. Tabacco, E.; Righi, F.; Quarantelli, A.; Borreani, G. Dry matter and nutritional losses during aerobic deterioration of corn and sorghum silages as influenced by different lactic acid bacteria inocula. J. Dairy Sci. 2011, 94, 1409–1419. [Google Scholar] [CrossRef]
  30. Windle, M.C.; Walker, N.; Kung, L., Jr. Effects of an exogenous protease on the fermentation and nutritive value of corn silage harvested at different dry matter contents and ensiled for various lengths of time. J. Dairy Sci. 2014, 97, 3053–3060. [Google Scholar] [CrossRef] [Green Version]
  31. Junges, D.; Morais, G.; Spoto, M.H.F.; Santos, P.S.; Adesogan, A.T.; Nussio, L.G.; Daniel, J.L.P. Short communication: Influence of various proteolytic sources during fermentation of reconstituted corn grain silages. J. Dairy Sci. 2017, 100, 9048–9051. [Google Scholar] [CrossRef] [Green Version]
  32. Borreani, G.; Tabacco, E.; Schmidt, R.J.; Holmes, B.J.; Muck, R.E. Silage review: Factors affecting dry matter and quality losses in silages. J. Dairy Sci. 2018, 101, 3952–3979. [Google Scholar] [CrossRef] [Green Version]
  33. Filya, I. Nutritive value and aerobic stability of whole crop maize silage harvested at four stages of maturity. Anim. Feed Sci. Technol. 2004, 116, 141–150. [Google Scholar] [CrossRef]
  34. Hoedtke, S.; Zeyner, A. Comparative evaluation of laboratory-scale silages using standard glass jar silages or vacuum-packed model silages. J. Sci. Food Agric. 2011, 91, 841–849. [Google Scholar] [CrossRef]
  35. Brüning, D.; Gerlach, K.; Weiß, K.; Südekum, K.-H. Effect of compaction, delayed sealing and aerobic exposure on maize silage quality and on formation of volatile organic compounds. Grass Forage Sci. 2017, 73, 53–66. [Google Scholar] [CrossRef]
  36. Serva, L.; Andrighetto, I.; Marchesini, G.; Contiero, B.; Grandis, D.; Magrin, L. Prognostic capacity assessment of a multiparameter risk score for aerobic stability of maize silage undergoing heterofermentative inoculation (Lactobacillus buchneri) in variable ensiling conditions. Anim. Feed Sci. Technol. 2021, 281, 115116. [Google Scholar] [CrossRef]
Figure 1. Factorial discriminant analysis (FDA) of the ensiled high-moisture maize grain (EMG) samples from the lab-scale dataset. (a) Scattergram of the three fermentative quality classes: ninety-five percent confidence ellipses (CI0.95) are drawn around each centroid of groupings; fermentative quality classes based on the grain-adapted quality score (GQS): low-quality (GQS < 39.8), red triangles () and pointed line; medium-quality (39.8 ≤ GMS ≤ 70.4), blue squares () and dotted line; high-quality (GMS > 70.4), green circles () and continuous line. (b) Correlation coefficients of the most discriminating chemical traits; the black vectors represent the chemical traits (DM, dry matter; PA, propionate; BA, butyrate; LA, lactate; CP, crude protein) which had correlation coefficient values where the total factorial structure was higher than 0.50 with F1 and/or F2.
Agronomy 12 00429 g001
Table 1. Chemical traits and fermentative quality indices of ensiled high-moisture maize grain (EMG) samples.
Constituents (g kg−1 DM)Experimental (n = 80)
Mean ± s.d. (Min–Max)
Farm-Derived (n = 201)
Mean ± s.d. (Min–Max)
DM (g kg−1)656 ± 58 (556–784)688 ± 43 (579–814)
Crude protein94.7 ± 7.9 (82.2–112.8)91.2 ± 9.8 (67.9–119.8)
Ether extract32.7 ± 4.7 (20.9–44.8)39.6 ± 4.3 (26.3–49.3)
Ash14.2 ± 1.2 (11.7–17.6)15.4 ± 1.9 (10.2–23.4)
Neutral detergent fibre (aNDF)78.2 ± 3.3 (69.5–84.3)80.3 ± 12.9 (51.5–100.6)
Acid detergent fibre (ADF)26.0 ± 4.5 (11.5–34.2)17.3 ± 6.1 (8.7–35.6)
Starch720 ± 19.9 (659–757)668 ± 31.4 (589–753)
Lactic acid18.0 ± 9.2 (4.2–35.3)18.2 ± 8.0 (3.6–39.6)
Acetic acid3.0 ± 2.2 (0.5–9.1)5.1 ± 3.3 (0.5–14.2)
Propionic acid1.1 ± 0.3 (0.3–2.7)1.0 ± 0.8 (0.2–4.8)
Butyric acid0.44 ± 0.12 (0.16–0.89)0.49 ± 0.32 (0.11–1.28)
Ethanol7.3 ± 3.2 (0.7–13.1)2.4 ± 1.5 (0.5–7.7)
NH3-N (g 100 g−1 total N)1.8 ± 1.3 (0.3–5.3)3.5 ± 1.6 (0.4–9.3)
pH4.09 ± 0.27 (3.54–4.69)4.05 ± 0.17 (3.64–4.68)
Fermentative quality score
Flieg-Zimmer’s (FQS)83.1 ± 14.3 (30.5–100)86.5 ± 15.7 (27.0–100)
Grain-adapted (GQS)55.1 ± 15.3 (27.7–82.6)52.9 ± 12.3 (20.1–80.0)
Standardized (SQS)0.0 ± 1.0 (–2.46–1.51)0.0 ± 1.0 (–2.81–3.72)
Table 2. Criteria for the determination of the standardized quality score (SQS) index based on the chemical traits of high-moisture maize grain (EMG) samples of the experimental dataset A (n = 80).
Constituents *Normalized Scores
m − 2 × s.d.m − s.d.mean (m)m + s.d.m + 2 × s.d.
Lactic acid0.08.818.027.236.4
Scores0.20.40.60.81.0
Acetic acid0.00.83.03.27.4
Butyric acid0.200.320.440.560.68
Ethanol0.94.17.310.513.7
Ammonia (NH3-N)0.00.51.83.14.4
pH3.553.824.094.364.63
Scores1.00.80.60.40.2
* Acids and ethanol as g kg−1 of DM, ammonia as g 100 g−1 of total N.
Table 3. Criteria for the determination (score interval) of the grain-adapted quality score (GQS) index based on a set of linear regression equations.
Constituents *Range of ValuesLinear Regression EquationsScore Intervals
Lactic acid (LA)10.3–26.1Score = –26.1 + 2.53 × LA0–40
Acetic acid (AA)1.8–8.4Score = 12.7 − 1.52 × AA10–0
Butyric acid (BA)0.2–0.8Score = 26.7 − 33.3 × BA20–0
Ethanol (ET)0.9–4.0Score = 12.9 − 3.23 × ET10–0
Ammonia (NH3-N)1.97–5.09Score = 24.4 − 4.80 × NH3-N15–0
pH3.88–4.23Score = 60.4 − 14.3 × pH5–0
* Acids and ethanol as g kg−1 of DM, ammonia as g 100 g−1 of total N.
Table 4. Statistical scores of the receiver operating characteristic (ROC) analysis in discriminating (cut-off) between poor and good-quality ensiled maize grains (EMG) were carried out on the experimental dataset A (lab-scale).
AUC ± s.e. 1CI0.95 2Cut-OffSensitivitySpecificityp-Value
GQS vs. FQS 30.94 ± 0.020.89–0.9746.60.870.88<0.001
GQS vs. SQS0.88 ± 0.040.82–0.9370.50.860.85<0.001
1 Area under the curve ± standard error (accuracy). 2 Confidence interval at 0.95. 3 GQS: grain-adapted quality score; FQS: Flieg-Zimmer’s quality score; SQS: standardized quality score.
Table 5. Confusion matrix of the comparison between poor and good-quality ensiled maize grain (EMG) samples carried out in the external blind farm-derived dataset B.
Original Farm-Derived Dataset (n = 201)
Predicted asFQS ≤ 80 (Poor Quality)FQS > 80 (Good Quality)
GQS ≤ 46.6 (poor quality)4223
GQS > 46.6 (good quality)20116
Predictive statistics
Sensitivity0.680.83
Specificity0.830.68
Accuracy0.790.79
Precision0.650.85
MCC0.510.51
Predicted asSQS ≤ 1 (Poor Quality)SQS > 1 (Good Quality)
GQS ≤ 70.5 (poor quality)62121
GQS > 70.5 (good quality)018
Predictive statistics
Sensitivity1.000.13
Specificity0.131.00
Accuracy0.400.40
Precision0.341.00
MCC 10.210.21
GQS: grain-adapted quality score; FQS: Flieg-Zimmer’s quality score; SQS: standardized quality score. 1 Matthews correlation coefficient.
Table 6. Confusion matrix for the factorial discriminant analysis (FDA) in the external blind farm-derived dataset for grain-adapted quality score (GQS) index classified in three quality classes (low, L vs. medium, M vs. high, H).
Prediction Original Farm-Derived Dataset (n = 201)
Actual ClassGQS <39.839.8 ≤ GQS ≤ 70.4GQS > 70.4
Predicted asGQS < 39.8 (L)22320
Predicted as39.8 ≤ GQS ≤ 70.4 (M)4923
Predicted asGQS > 70.4 (H)1 2522
Predictive statistics
Sensitivity 0.810.620.88
Specificity 0.820.870.85
Accuracy 0.820.680.86
Precision 0.410.930.46
Matthews correlation coefficient 0.490.420.57
Publisher’s Note: MDPI stays neutral with regard to jurisdictional claims in published maps and institutional affiliations.

