Article

Relatively Low Light Intensity Promotes Phosphorus Absorption and Enhances the Ethylene Signaling Component EIN3 in Maize, Wheat, and Oilseed Rape

1
College of Resources, Sichuan Agricultural University, Chengdu 611130, China
2
Sichuan Water Conservancy College, Chengdu 611230, China
*
Author to whom correspondence should be addressed.
These authors contributed equally to this work.
Agronomy 2022, 12(2), 427; https://doi.org/10.3390/agronomy12020427
Submission received: 27 December 2021 / Revised: 4 February 2022 / Accepted: 8 February 2022 / Published: 9 February 2022
(This article belongs to the Special Issue Researches on Crop Nutritional Molecular Biology)

Abstract

:
Previous studies have found that once seedlings break the soil, light can induce the degradation of the key ethylene signaling element ethylene insensitive 3 (EIN3), so as to indirectly inhibit the synthesis of ethylene. Ethylene is the most important hormone in phosphorus absorption by plants, which induces the expression of acid phosphatase (APase) and phosphorus starvation response genes. Therefore, it might be speculated that changes in light intensity could regulate phosphorus absorption to some degree. However, there are few reports on the mechanism by which light intensity regulates phosphorus metabolism. In this study, the effects of different light intensities on phosphorus assimilation and metabolism in plants were studied. The results showed that relatively low light intensity could promote the secretion of APase, so as to increase the concentration of plant total phosphorus and cellular Pi. However, the low light intensity may also inhibit plant growth. Among the three species, oilseed rape was the most sensitive to the low light intensity. The steady-state level of the EIN3 protein decreased significantly under a relatively high light intensity; while the ethylene level also decreased under the high light intensity. Therefore, appropriate reductions in light intensity may simultaneously promote phosphorus assimilation and maintain plant growth.

1. Introduction

Phosphorus is an essential nutrient for plant metabolism and a crucial regulator of plant growth [1,2]. However, phosphorus in the soil diffuses slowly, and cannot be easily absorbed and utilized by plants [3,4]. Previous studies have shown that plants exhibit a series of adaptive morphological changes to enhance phosphorus acquisition and utilization [5,6,7].
Oilseed rape is an important oil crop as well as a phosphorus-deficiency-sensitive crop [8,9]. Phosphorus deficiency seriously affects the yield, quality, and resistance of oilseed rape to environmental stresses. Maize and wheat are primary food crops, and are also sensitive to phosphorus deficiency. Under low-phosphorus stress, the external morphology, absorption of nutrient elements, photosynthetic efficiency, and tillering of maize and wheat are all inhibited, resulting in significant reductions in both yield and quality [10,11,12,13].
Light determines the performance of individual plants in natural communities, and plays a key role in the growth and productivity of crops in agricultural ecosystems. Light intensity regulates plant biomass production through the utilization of light energy for photosynthesis [14]. The accumulation levels of sucrose and starch are affected by light intensity [15,16]. However, few studies have evaluated how light intensity regulates phosphorus absorption in crops.
Among all phytohormones, ethylene is the most important hormone that is involved in the adaptation to phosphorus deficiency [17,18]. Both exogenous and endogenous ethylene can alleviate phosphate (Pi) starvation significantly. Ethylene levels have positive effects on the expression of PSI (phosphate-starvation-induced) genes, the maintenance of Pi homeostasis, the accumulation of anthocyanins, and the production of acid phosphatase (APase)—the key enzyme for phosphate absorption [17,18]. The secreted APase is thought to scavenge Pi from organophosphate compounds in the rhizosphere and, thus, increase Pi availability to plant seedlings when Pi is limited. The tight association of secreted APase with the root surface may render plants more efficient in the utilization of soil Pi around the root tissues [19]. All of these findings provide compelling evidence for the role of ethylene in regulating Pi signal sensing and Pi starvation responses (PSRs). However, the molecular mechanisms behind ethylene-regulated phosphate absorption are yet to be fully understood.
Both light and ethylene regulate plant growth and development. However, the crosstalk between light signaling and ethylene signaling regulation has not been well documented [20,21,22]. Ethylene insensitive 3 (EIN3) has been identified as an ethylene signaling transcription factor, and its protein level was found to rapidly increase upon ethylene treatment. In etiolated Arabidopsis seedlings, light signals have been proven to repress ethylene biosynthesis and signal transduction by degrading the EIN3 protein [23,24]. In the presence of light signals, the EIN3 protein is degraded by the 26S proteasome [23,24,25,26]. Downstream of ethylene signaling, by binding to specific promoter elements (EBS and EIN3 binding sites), EIN3 regulates the expression of multiple target genes, leading to changes in morphological characteristics [27]. However, the above studies mainly focused on etiolated seedlings that had just broken the soil. It is not clear whether light signals cause EIN3 degradation in green seedlings, and few studies have assessed the effects of crosstalk between light and ethylene on plant phosphorus absorption.
Light is a necessary environmental factor for plant growth; however, it may also affect phosphorus absorption by regulating ethylene signaling. In this study, the absorption of phosphorus and related physiological mechanisms under different light intensities were investigated in maize, wheat, and oilseed rape. We interestingly found that appropriate reductions in light intensity enhanced phosphorus absorption in all three crop species.

2. Materials and Methods

2.1. Plant Materials and Experimental Design

Maize (Zea mays L., cv. ‘CD418′) was provided by the College of Agriculture, Sichuan Agricultural University; wheat (Triticum aestivum L., cv. ‘Mianyang No. 11′) was provided by the Wheat Institute of Sichuan Agricultural University, and oilseed rape (Brassica napus L., cv. ‘Rongyou No. 16′) was provided by the Chengdu Academy of Agriculture and Forestry Sciences.
The seeds were washed thoroughly with double-distilled water and then placed in an incubator at 20 °C for germination. After germination, the seedlings were planted in 5 L pots (5 seedlings per pot). The soil clay content (<0.002 mm) was 16.4%, pH (H2O) was 8.4, bulk density was 1.15 g cm−3, soil organic carbon concentration was 14.9 g C kg−1, total nitrogen was 1.43 g kg−1, available phosphorus was 53.5 mg kg−1, and available potassium was 77.3 mg kg−1. All seedlings were grown for 20 d in a growth chamber with 320 μmol photons m−2 s−1, with 16/8 h light/dark cycles, at 20 ± 1 °C and humidity of 70%, and irrigated every 3 days.
After 20 d of growth, calcium perphosphate (1 g/plant) was applied to the soils. The plants were subjected to three light intensities—700 μmol m−2 s−1, 320 μmol m−2 s−1, and 200 μmol m−2 s−1—and the relevant data were measured after one week and two weeks of light processing. Each of the treatments was repeated in triplicate (one pot containing five plants per replicate). Three seedlings with consistent growth among the 5 plants per pot were selected for the subsequent measurements.

2.2. Plant Growth and Biomass

For all three plant species, three pots (nine seedlings with consistent growth) were selected from each treatment, and the shoots and roots were separated and individually weighed to determine the fresh weight (F.W.).

2.3. Determination of Photosystem Parameters

The photosynthetic indicators were determined using a portable photosynthetic apparatus (LI-6400; LICOR, Lincoln, NE, USA) at approximately 10:00 a.m. The photosynthetically active radiation (PAR) of either 700 μmol m−2 s−1, 320 μmol m−2 s−1, or 200 μmol m−2 s−1, with 360 μmol mol−1 CO2 concentration and 70% relative humidity at room temperature, were used for measurement of the CO2 assimilation rate. The measurement parameters included net photosynthetic rate (Pn), intercellular carbon dioxide concentration (Ci), stomatal conductance (Gs), and transpiration rate (Tr).

2.4. Determination of Starch and Sucrose Contents

The shoots and roots were incubated at 105 °C for 15 min to inactivate the enzymes, followed by drying at 60 °C. The samples were then ground and sifted through a 60-mesh sieve. A continuous flow analysis system was used to determine the total sugar and starch in the samples (Seal AA3, Norderstedt, Germany).

2.5. Determination of Phosphorus Content

The determination of cellular Pi contents was as described in a previous study [28]. Briefly, ~1 g of fresh shoot and root tissue was submerged in 1 mL of 1% glacial acetate and then frozen/thawed eight times. Then, 100 μL of the extract was combined with 200 mL of water and 700 mL of Pi reaction buffer containing a mixture of 2.85% (v/v) H2SO4, 0.48% NH4MoO4, and 10% (w/v) ascorbic acid at a ratio of 6:1. The reaction was allowed to proceed at 37 °C for 1 h. The Pi content was measured at A820 with a spectrophotometer (Shimadzu UV-1700, Kyoto, Japan) according to a premade standard curve.
To determine the content of total P, ~50 mg of fresh sample was oven-dried at 500 °C for 3 h and flamed to ash. The ash was then dissolved in 10% (v/v) HNO3 and 100 mL of 30% (v/v) HCl. Next, 10 μL of dissolved sample was mixed with deionized water, 290 mL of 0.5 M HCl, and 700 mL of Pi reaction buffer, and Pi was subsequently quantified [28]. Finally, the content of total P in the plant tissues was determined.

2.6. Acid Phosphatase Staining and Determination of Activity

The living material was stained with 50 mg/L 5-bromo-4-chloro-3-indolyl-phosphate (BCIP) for 2.5–3 h to observe the staining results [29].
Fresh samples (0.2 g) were weighed and combined with a small amount of quartz sand and 8 mL of acetic acid–sodium acetate buffer (pH = 5.8). The mixture was thoroughly ground in an ice bath to form a homogenate, and then centrifuged at 12,000 r/min and a temperature of 4 °C. Diluted enzyme solution (0.2 mL) was combined with 5 mL of 5 mmol/L disodium p-nitrophenyl phosphate and 1 mL of 1 mol/L sodium hydroxide solution for 30 min at 37 °C. Following the reaction, the absorbance value was determined at 405 nm on a spectrophotometer (Shimadzu UV-1700, Kyoto, Japan).

2.7. Western Blotting of the EIN3 Protein

Nuclear–cytoplasmic fractionation was conducted as described by Yuan et al. [30]. For Western blots, 20 μg nuclear proteins were loaded. The proteins were separated by 15% SDS–PAGE, and subsequently shifted to a polyvinyl difluoride (PVDF) membrane (Immobilon, Millipore, Darmstadt, Germany). The blot was first probed with a rabbit anti-Arabidopsis EIN3 polyclonal antibody and a rabbit anti-Arabidopsis ACTIN polyclonal antibody (Agrisera, Vännäs, Sweden), and the goat anti-rabbit alkaline phosphatase-conjugated antibody was used as the secondary antibody. The blots were visualized with the substrates BCIP and p-nitro-blue tetrazolium chloride (NBT) for a 20-minute reaction. The intensity of the signals of the Western blotting was analyzed densitometrically by scanning the blots with a thin-layer scanner.

2.8. Determination of Ethylene Levels

Ethylene estimation was performed as described by Vogel et al. [31] and Datta et al. [32]. Briefly, the wound-detached seedlings were incubated in 10 mL gas chromatography vials at 20 °C for 24 h. The collected ethylene was measured by using a gas chromatograph (GC-2010, Shimadzu Corp., Kyoto, Japan). The ethylene levels were quantified based on the standard sample.

2.9. Data Analysis

The data were statistically analyzed using Excel 2007 (Microsoft Corp., Redmond, MA, USA) and SPSS 20.0 (IBM Corp., Armonk, NY, USA). Each of the treatments was repeated in triplicate (one pot per replicate). Three seedlings with consistent growth among the five plants per pot were selected, and mean values are shown with the standard deviations (n = 9). Student’s t-test was used for comparisons between different samples. A difference was considered to be statistically significant at p < 0.05.

3. Results

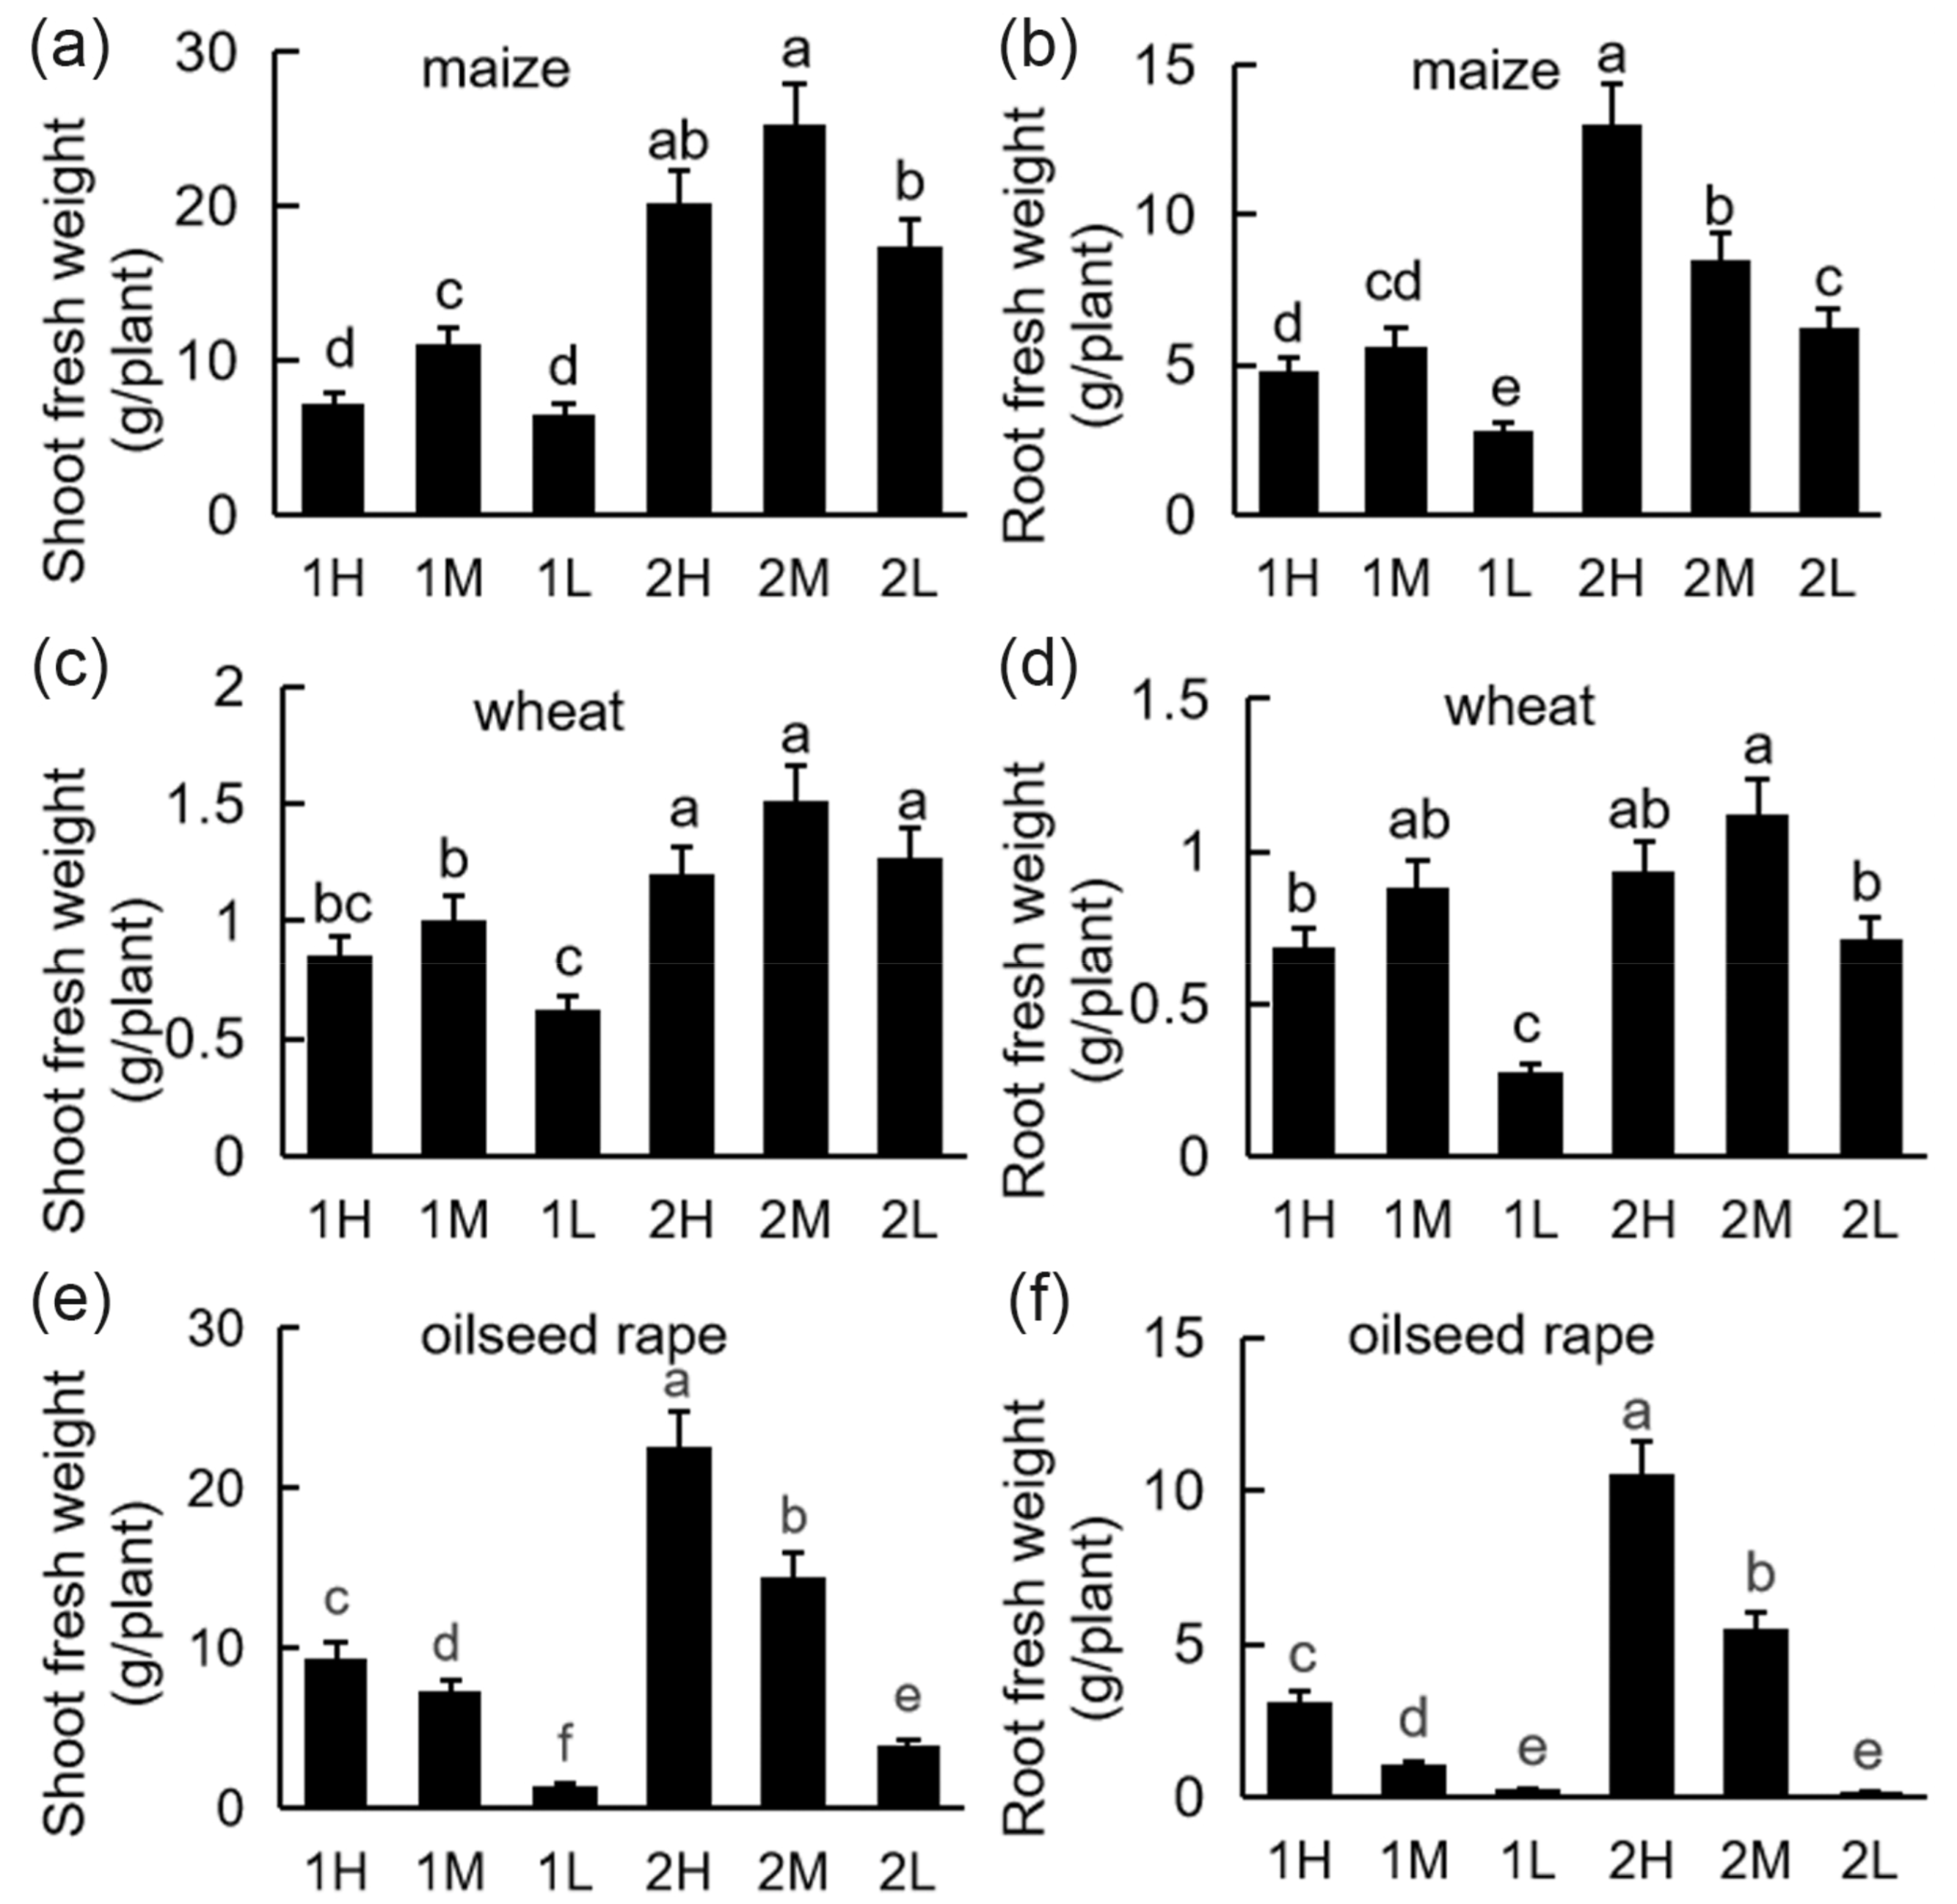
3.1. Accumulation of Plant Biomass under Different Light Intensities

All plants showed a decrease in shoot and root biomass under low light. The plant biomass under the medium-light and high-light treatments was significantly higher than under the low-light treatment (Figure 1). Under medium light intensity, the shoot biomass of maize and wheat was higher than that under the other two light intensities (Figure 1a–d). The shoot and root biomass of oilseed rape decreased with decreasing light intensity (Figure 1e,f), and the biomass of oilseed rape under the high light was significantly higher than that under the other two light treatments. Relatively low light intensity significantly inhibited the biomass of oilseed rape (Figure 1).

3.2. Differences in Photosynthetic Parameters under Different Light Intensities

As indicated in Table 1, the net photosynthetic rate of maize decreased once the light intensity decreased. Under the low light intensity, the net photosynthetic rate was significantly lower than under the other two light intensities, but with an increase in treatment time, the net photosynthetic rate under all three light intensities increased. Stomatal conductance, intercellular CO2, and transpiration rate decreased with treatment duration.
The net photosynthetic rate of wheat under the high-light-intensity treatment was significantly greater than under the medium- and the low-light-intensity treatments. Under the high light intensity, stomatal conductance, intercellular CO2 concentration, and transpiration rate were significantly lower than under the other two light intensity treatments (Table 2). With increased time, the net photosynthetic rate under medium light intensity and low light intensity increased significantly. The intercellular CO2 concentration increased with time, and the concentration under the high-light-intensity treatment was higher than under the other two treatments.
The net photosynthetic rate of oilseed rape under medium light intensity was significantly higher than that under the high and low light intensity (Table 3). Stomatal conductance was significantly lower under the low-light treatment than under the high- and medium-light treatments. Under medium light intensity, the intercellular CO2 concentration of oilseed rape was significantly lower than that under the high and low light intensity. The transpiration rate of rape increased with time, and the transpiration rate under the high-light-intensity treatment was significantly higher than under the medium- and low-light-intensity treatments.

3.3. Accumulation of Sucrose and Starch in Plants under Different Light Intensities

The total sucrose and starch concentrations in the shoots and roots decreased with the weakening of the light intensity (Figure 2). In both the shoots and the roots, the concentrations of total sugar and starch increased with the increase in light intensity. The total sugar in the shoots of maize was higher than that in the roots, the starch concentration of the shoots was higher than that of the roots under the high light intensity, and the starch concentration in the roots was higher than that in the shoots under the medium-light and low-light treatments (Figure 2a,b). The total sugar concentration in the wheat roots was lower than in the shoots, reaching the maximum level under medium light intensity in the second week (Figure 2c,d). The total sugar concentration in the shoots of oilseed rape was lower than that in the roots under all light intensities. After two weeks of light treatment, the starch concentration in the shoots was higher than that in roots under the medium-light and high-light treatments, but lower than that in the roots under the low-light treatment (Figure 2e,f).

3.4. Phosphorus Contents of the Plants under Different Light Intensities

Under different light intensities, the phosphorus absorption of the plants differed, and the low light intensity significantly promoted phosphorus absorption (Figure 3). The phosphorus concentration in the shoots and roots increased with decreased light intensity. Cellular Pi and total phosphorus exhibited nearly the same trend. The concentrations of total phosphorus and cellular Pi in the shoots of maize were lower than those in the roots, while the concentrations of total phosphorus and cellular Pi in the shoots of wheat and oilseed rape were higher than those in the roots. Under the low-light treatment, the phosphorus concentration of maize increased with time in both the shoots and the roots. Conversely, under the low-light treatment, the phosphorus concentration of wheat decreased with time.

3.5. Secretion of APase from Plant Seedlings

The APase activity was analyzed by 5-bromo-4-chloro-3-indolyl phosphate (BCIP) staining. It can be seen that with the decrease in light intensity, deeper APase staining was observed, indicating a higher activity of APase in the roots. As indicated in Figure 4a, the color of the roots under the high light intensity was lighter than that under the low light intensity, indicating that reducing the light intensity could promote the secretion of APase by the roots. The quantitative analysis of the APase in the roots (Figure 4b–d) indicated a pattern similar to those of the BCIP staining, in that the lower the light intensity was, the higher the activity of APase in the roots. The activity of APase under the low light intensity was significantly higher than that under the high light intensity.

3.6. EIN3 Protein Levels and Ethylene Levels in Plants under Different Light Intensities

We tested the EIN3 protein in the seedlings as well as the ethylene released by the plants. The EIN3 protein levels decreased following all three different light treatments. The content of the EIN3 protein decreased more significantly under the high light intensity than that under the low light intensity. The lower the light intensity was, the higher the content of the EIN3 protein (Figure 5).
The different light intensities had different impacts on plant ethylene levels, and the ethylene levels decreased with increased light intensity. With the increase in treatment time, the difference in ethylene levels in the plants under different light intensity treatments decreased (Figure 5). The amplitude of variation in ethylene levels was much smaller than that of EIN3 protein content, which may indicate that EIN3 is not the only factor regulating ethylene biosynthesis.

4. Discussion

In this study, we found that medium light intensity promoted the growth of maize and wheat plants. Under medium light intensity, the biomass of maize and wheat was significantly higher than under the low light intensity (Figure 1). The biomass of oilseed rape decreased more significantly under the low light intensity, and growth was much better under medium light intensity (Figure 1). Thus, wheat and maize exhibited stronger tolerance to the low light intensity.
In previous studies, Pi starvation induced both ethylene accumulation and sucrose accumulation in Arabidopsis seedlings [33,34]. Although, in general, sugar metabolites and ethylene act antagonistically with one another, they may work synergistically on PSI gene expression [35]. In this study, we found that the accumulation of total sugar and starch increased with increasing light intensity, but the ethylene levels slightly decreased with increasing light intensity (Figure 2), presenting a negative correlation. The correlation between sugar metabolites and ethylene may vary with different treatments or different growth conditions.
The fact that more starch accumulated under the high-light treatment than the low-light treatment suggests that C level may be negatively associated with seedling Pp level. Previous studies have confirmed that starch contents increase under mild phosphorus restriction [36,37,38,39]. When the plant experiences poor phosphorus absorption, it transfers the excess C from the shoots to the roots, which serves as a synthetic substrate for malic acid and other carboxylates [40]. This may explain the higher sucrose and starch concentrations in the roots than in the shoots found in this study (Figure 2).
Pi levels also regulate carbon assimilation at the transcriptional level. Early studies showed that in Pi-deficient roots, the expression of photosynthetic genes was repressed [41]; however, the signaling pathway behind this phenomenon remains unknown. Another previous study showed that the overexpression of GLK (GOLDEN-like) transcription factors in transgenic Arabidopsis activates photosynthetic genes in the roots. The GLK-overexpressing (GLK-OX) lines exhibited increased inhibition of root growth under Pi deficiency [41]; however, growth in the dark completely reversed the inhibitory effect of Pi deficiency on the root growth of GLK-OX plants. The inhibition of photosynthetic gene expression may be necessary for sustainable root growth under Pi deficiency. Therefore, the expression of photosynthetic genes may inhibit phosphorus absorption—an aspect that is worthy of further study.
EIN3 is a key component in ethylene signaling pathways whereby ethylene regulates the action of EBF1/EBF2 to stabilize EIN3 at multiple levels (e.g., protein stability and transcriptional regulation) [42,43,44,45,46,47]. Upon light activation, the photoreceptor phytochrome B (PHYB) directly enhances the binding of transcription factor EIN3 to its E3 ligases EBF1/EBF2 (EIN3-targeting F-box proteins) by acting as a molecular glue, resulting in EIN3 degradation mediated by SCFEBF1/EBF2 (S-phase kinase-associated protein (Skp)1-Cullin-F-Box). Then, EIN3 turns off the ethylene signaling and promotes greening of etiolated seedlings [23,24,48,49,50]. Our experiments show that, in green seedlings, the EIN3 protein in plants also decreased under high-light conditions (Figure 5), but whether PHYB and EBF1/EBF2 are involved is unclear, and calls for further research.
Moreover, EIN3 also directly binds to the PHR1 (phosphate starvation response 1) gene promoter and enhances its expression. EIN3 and EIL1 (ethylene insensitive 3-like 1) are essential for ethylene- and Pi-starvation-induced PHR1 and PSI gene expression, as well as Pi starvation responses (PSRs) [20]. Light signals activate phytochromes and the transcription factor HY5 (hypocotyl 5), while HY5 also binds to the PHR1 promoter but represses its expression. On the other hand, ethylene eliminates the inhibitory effect of HY5 on PHR1 expression by blocking HY5 protein accumulation [20]. Thus, light signals may negatively regulate ethylene-mediated Pi responses by inhibiting PHR1 expression, suggesting an antagonistic crosstalk between light signaling and ethylene signaling on phosphorus absorption at the transcriptional level.
Light quality, duration, and intensity have consistently been demonstrated to influence ethylene production in diverse plant tissues, organs, and species [51]. In general, light is required for biosynthesis of the ethylene precursor 1-aminocyclopropane-1-carboxylic acid (ACC) [52]. Leaf tissues in the light with a source of CO2 sufficient to maintain photosynthesis generate 3–4 times more ethylene than tissues in the dark [52]. However, decreased light intensity (shade treatments) coincided with increased ethylene production in Arabidopsis seedlings. Both ethylene and auxin signaling are required for the response to low light intensity [53]. Although high light may upregulate genes involved in ethylene biosynthesis [54], a direct effect of high light on plant ethylene production has not been reported previously. In this study, we found that, in the three crop species, ethylene levels decreased with increased light intensity (Figure 5). Nevertheless, the amplitude of variation in ethylene levels was very small compared with the EIN3 protein content (Figure 5). Although EIN3 may be degraded under light [23,24], light signals also induce genes encoding ACC synthase (ACS), ACC oxidase (ACO) [51], and ethylene response factors (ERFs) [55]. This may explain the smaller change in ethylene levels than in EIN3 protein content.
The regulation of plants’ phosphate absorption is a complex process involving many factors, including sugars, plant hormones, reactive oxygen species, and nutrients (such as nitrate and iron) [56,57]. Although plant growth and survival depend on the ability of plants to perceive changes in external phosphating rate levels, the ‘master’ sensor(s) has not yet been molecularly identified. The crosstalk between light signaling and ethylene signaling may be manipulated to improve phosphate absorption in plants, the specific details of which need to be further studied.

5. Conclusions

This study explored the effects of light on the absorption of phosphorus by plants. In general, reduced light intensity can promote the absorption of phosphorus by plants. Based on plant growth, wheat and maize demonstrated better tolerance to the low-light conditions than oilseed rape. Decreased light intensity may promote the synthesis of plant ethylene, but this will differ in different plant species and with different processing times. The EIN3 protein content decreased under the high-light treatment, while decreased light intensity stabilized the EIN3 protein. Decreased light intensity also contributed to APase secretion by the plants. In a nutshell, appropriate reductions in light intensity may simultaneously promote phosphorus assimilation and maintain plant growth. The findings reported in this work may ultimately facilitate crop cultivation and breeding design in the future by focusing on improving the acquisition and utilization of Pi.

Author Contributions

Conceptualization, S.Y. and Z.-W.Z.; methodology, M.-Y.Z., X.C. and Y.-T.W.; formal analysis, M.-Y.Z., X.C. and Y.-T.W.; investigation, Y.-F.F. and X.-Y.Y.; data curation, M.-Y.Z., X.C. and Y.-T.W.; writing—original draft preparation, M.-Y.Z. and S.Y.; writing—review and editing, all authors; supervision, S.Y.; funding acquisition, S.Y. and Z.-W.Z. All authors have read and agreed to the published version of the manuscript.

Funding

This work was supported by the National Natural Science Foundation of China (31770322) to S.Y., the Project of Sichuan Province Youth Science and Technology Innovation Team (20CXTD0062) to S.Y., and the Applied Basic Research Program of Sichuan Province (2020YJ0410) to Z.-W.Z.

Institutional Review Board Statement

Not applicable.

Informed Consent Statement

Not applicable.

Acknowledgments

We would like to thank LetPub (www.letpub.com accessed on 26 December 2021) for providing linguistic assistance during the preparation of this manuscript.

Conflicts of Interest

The authors declare no conflict of interest.

References

  1. Hinsinger, P. Bioavailability of soil inorganic P in the rhizosphere as affected by root-induced chemical changes: A review. Plant Soil. 2001, 237, 173–195. [Google Scholar] [CrossRef]
  2. Richardson, A.E.; Barea, J.M.; Mcneill, A.M.; Prigent, C.C. Acquisition of phosphorus and nitrogen in the rhizosphere and plant growth promotion by microorganisms. Plant Soil. 2009, 321, 305–339. [Google Scholar] [CrossRef]
  3. Ye, D.; Zhang, X.; Li, T.; Xu, J.; Chen, G. Phosphorus-acquisition characteristics and rhizosphere properties of wild barley in relation to genotypic differences as dependent on soil phosphorus availability. Plant Soil. 2018, 423, 503–516. [Google Scholar] [CrossRef]
  4. Holford, I.C.R.; Hird, C.; Lawrie, R. Effects of animal effluents on the phosphorus sorption characteristics of soils. Soil Res. 1997, 35, 365–373. [Google Scholar] [CrossRef]
  5. Fang, Z.Y.; Shao, C.; Meng, Y.J.; Ping, W.; Chen, M. Phosphate signaling in Arabidopsis and Oryza sativa. Plant Sci. 2009, 176, 170–180. [Google Scholar] [CrossRef]
  6. Hammond, J.P.; Broadley, M.R.; White, P.J. Genetic responses to phosphorus deficiency. Ann. Bot. 2004, 94, 323–332. [Google Scholar] [CrossRef]
  7. Vance, C.P.; Uhde, S.C.; Allan, D.L. Phosphorus acquisition and use: Critical adaptations by plants for securing a nonrenewable resource. New Phytol. 2010, 157, 423–447. [Google Scholar] [CrossRef] [Green Version]
  8. Yan, X.; Wu, P.; Ling, H.; Xu, G.; Xu, F.; Zhang, Q. Plant nutriomics in China: An overview. Ann. Bot. 2006, 98, 473–482. [Google Scholar] [CrossRef] [Green Version]
  9. Cordell, D.; Drangert, J.O.; White, S. The story of phosphorus: Global food security and food for thought. Global Environ. Change 2009, 19, 292–305. [Google Scholar] [CrossRef]
  10. Zhu, J.; Kaeppler, S.M.; Lynch, J.P. Mapping of QTL controlling roots hair length in maize (Zea mays L.) under phosphorus deficiency. Plant Soil. 2005, 270, 299–310. [Google Scholar] [CrossRef]
  11. Nadeem, M.; Mollier, A.; Morel, C.; Shahid, M. Maize seedling phosphorus nutrition: Allocation of remobilized seed phosphorus reserves and external phosphorus uptake to seedling roots and shoots during early growth stages. Plant Soil. 2013, 371, 327–338. [Google Scholar] [CrossRef]
  12. Szabó-Nagy, A.; Oláh, Z.; Erdei, L. Phosphatase induction in roots of winter wheat during adaptation to phosphorus deficiency. Physiol. Plant. 2010, 70, 544–552. [Google Scholar] [CrossRef]
  13. Su, J.; Xiao, Y.; Ming, L.; Liu, Q.; Li, B.; Tong, Y.; Jia, J.; Li, Z. Mapping QTLs for phosphorus- deficiency tolerance at wheat seedling stage. Plant Soil. 2012, 281, 25–36. [Google Scholar] [CrossRef]
  14. Eckstein, A.; Ziba, P.; Gabry, H. Sugar and light effects on the condition of the photosynthetic apparatus of Arabidopsis thaliana cultured in vitro. J. Plant Growth Regul. 2012, 31, 90–101. [Google Scholar] [CrossRef] [Green Version]
  15. Cheng, L.; Tang, X.; Vance, C.P.; White, P.J.; Zhang, F.; Shen, J. Interactions between light and phosphorus nutrition affect the phosphate-mining capacity of white lupin (Lupinus albus L.). J. Exp. Bot. 2014, 65, 2995–3003. [Google Scholar] [CrossRef] [Green Version]
  16. Wen, Z.; Li, H.; Shen, J.; Rengel, Z. Maize responds to low shoots P concentration by altering roots morphology rather than increasing roots exudation. Plant Soil. 2017, 416, 377–389. [Google Scholar] [CrossRef]
  17. Wang, L.; Dong, J.; Gao, Z.; Liu, D. The Arabidopsis gene hypersensitive to phosphate starvation 3 encodes Ethylene Overproduction 1. Plant Cell Physiol. 2012, 6, 1093–1105. [Google Scholar] [CrossRef] [Green Version]
  18. Nagarajan, V.; Smith, L.P. Ethylene’s role in phosphate starvation signaling: More than just a roots growth regulator. Plant Cell Physiol. 2012, 53, 277–286. [Google Scholar] [CrossRef] [Green Version]
  19. Wang, L.; Li, Z.; Qian, W.; Guo, W.; Gao, X.; Huang, L.; Wang, H.; Zhu, H.; Wu, J.W.; Wang, D. The Arabidopsis purple acid phosphatase AtPAP10 is predominantly associated with the root surface and plays an important role in plant tolerance to phosphate limitation. Plant Physiol. 2011, 157, 1283–1299. [Google Scholar] [CrossRef] [Green Version]
  20. Liu, Y.; Xie, Y.; Wang, H.; Ma, X.; Yao, W.; Wang, H. Light and ethylene coordinately regulate the phosphate starvation response through transcriptional regulation of phosphate starvation response1. Plant Cell 2017, 29, 2269–2284. [Google Scholar] [CrossRef] [Green Version]
  21. Yu, Y.; Wang, J.; Zhang, Z.; Quan, R.; Zhang, H.; Deng, X.W.; Ma, L.; Huang, R. Ethylene promotes hypocotyl growth and HY5 degradation by enhancing the movement of COP1 to the nucleus in the light. PLoS Genet. 2013, 9, e1004025. [Google Scholar] [CrossRef]
  22. Stepanova, A.N.; Alonso, J.M. Cutting out the middle man in light-hormone interactions. Dev. Cell 2016, 39, 524–526. [Google Scholar] [CrossRef] [PubMed]
  23. Zhong, S.W.; Shi, H.; Xue, C.; Ning, W.; Xing, W.D. Ethylene-orchestrated circuitry coordinates a seedling’s response to soil cover and etiolated growth. Proc. Natl. Acad. Sci. USA 2014, 111, 3913–3920. [Google Scholar] [CrossRef] [PubMed] [Green Version]
  24. Shi, H.; Shen, X.; Liu, R.; Xue, C.; Wei, N.; Deng, X.W.; Zhong, S.W. The red light receptor phytochrome B directly enhances substrate-e3 ligase interactions to attenuate ethylene responses. Dev. Cell 2016, 39, 597–610. [Google Scholar] [CrossRef] [PubMed] [Green Version]
  25. Guo, H.; Ecker, J.R. Plant responses to ethylene gas are mediated by SCF (EBF1/EBF2)—Dependent proteolysis of EIN3 transcription factor. Cell 2003, 115, 667–677. [Google Scholar] [CrossRef] [Green Version]
  26. Potuschak, T.; Lechner, E.; Parmentier, Y.; Yanagisawa, S.; Grava, S.; Koncz, C.; Genschik, P. EIN3-dependent regulation of plant ethylene hormone signaling by two arabidopsis F box proteins: EBF1 and EBF2. Cell 2003, 115, 679–689. [Google Scholar] [CrossRef] [Green Version]
  27. Solano, R.; Stepanova, A.; Chao, Q.M.; Ecker, J.R. Nuclear events in ethylene signaling: A transcriptional cascade mediated by ETHYLENE- INSENSITIVE3 and ETHYLENE- RESPONSEFACTOR1. Genes Dev. 1998, 12, 3703–3714. [Google Scholar] [CrossRef] [Green Version]
  28. Ames, B.N. Assay of inorganic phosphate, total phosphate and phosphatase. Method Enzymol. 1966, 8, 114–118. [Google Scholar]
  29. Gibson, D.M.; Christen, A.A.; Mullaney, E.J. Direct screening for acid phosphatase production on bcip-agar plates. Biotechnol. Tech. 1988, 2, 63–68. [Google Scholar] [CrossRef]
  30. Yuan, W.; Zhou, J.; Tong, J.; Zhuo, W.; Qian, W. ALBA protein complex reads genic R-loops to maintain genome stability in Arabidopsis. Sci. Adv. 2019, 55, eaav9040. [Google Scholar] [CrossRef] [Green Version]
  31. Vogel, J.P.; Woeste, K.E.; Theologis, A.; Kieber, J.J. Recessive and dominant mutations in the ethylene biosynthetic gene ACS5 of Arabidopsis confer cytokinin insensitivity and ethylene overproduction, respectively. Proc. Natl. Acad. Sci. USA 1998, 95, 4766–4771. [Google Scholar] [CrossRef] [PubMed] [Green Version]
  32. Datta, R.; Kumar, D.; Sultana, A.; Hazra, S.; Bhattacharyya, D.; Chattopadhyay, S. Glutathione regulates 1-aminocyclopropane-1-carboxylate synthase transcription via WRKY33 and 1-aminocyclopropane-1-carboxylate oxidase by modulating messenger RNA stability to induce ethylene synthesis during stress. Plant Physiol. 2015, 169, 2963–2981. [Google Scholar]
  33. Lei, M.; Zhu, C.; Liu, Y.; Karthikeyan, A.S.; Bressan, R.A.; Raghothama, K.G.; Liu, D. Ethylene signalling is involved in regulation of phosphate starvation-induced gene expression and production of acid phosphatases and anthocyanin in Arabidopsis. New Phytol. 2011, 189, 1084–1095. [Google Scholar] [CrossRef] [PubMed]
  34. Lei, M.G.; Liu, Y.D.; Zhang, B.C.; Zhao, Y.T.; Wang, X.J.; Zhou, Y.H.; Raghothama, K.G. Genetic and genomic evidence that sucrose is a global regulator of plant responses to phosphate starvation in Arabidopsis. Plant Physiol. 2011, 156, 1116–1130. [Google Scholar] [CrossRef] [PubMed] [Green Version]
  35. Zhang, Z.W.; Feng, L.Y.; Wang, J.H.; Fu, Y.F.; Yuan, S. Two-factor ANOVA of SSH and RNA-seq analysis reveal development-associated Pi-starvation genes in oilseed rape. Planta 2019, 4, 1073–1088. [Google Scholar] [CrossRef] [PubMed]
  36. Groots, C.; Marcelis, L.; Boogaard, R.; Lambers, H. Growth and dry-mass partitioning in tomato as affected by phosphorus nutrition and light. Plant Cell Environ. 2010, 24, 1309–1317. [Google Scholar] [CrossRef]
  37. Gent, M.P.N. Carbohydrate level and growth of tomato plants: The effect of irradiance and temperature. Plant Physiol. 1986, 81, 1075–1079. [Google Scholar] [CrossRef] [Green Version]
  38. Fredeen, A.L.; Rao, I.M.; Terry, N. Influence of phosphorus nutrition on growth and carbon partitioning in Glycine max. Plant Physiol. 1989, 89, 225–230. [Google Scholar] [CrossRef] [Green Version]
  39. Sims, D.A.; Seemann, J.R.; Luo, Y. The significance of differences in the mechanisms of photosynthetic acclimation to light, nitrogen and CO2 for return on investment in leaves. Funct. Ecol. 1998, 12, 185–194. [Google Scholar] [CrossRef] [Green Version]
  40. Zhou, T.; Wang, L.; Li, S.; Gao, Y.; Yong, L.; Zhao, D. Interactions between light and phosphorus nutrition affect the p uptake capacity of maize and soybean seedling in a low light area. Front. Plant Sci. 2019, 10, 183–198. [Google Scholar] [CrossRef]
  41. Kang, J.; Yu, H.; Tian, C.; Zhou, W.; Li, C.; Jiao, Y.; Liu, D. Suppression of photosynthetic gene expression in roots is required for sustained root growth under phosphate deficiency. Plant Physiol. 2014, 165, 1156–1170. [Google Scholar] [CrossRef] [PubMed] [Green Version]
  42. An, F.; Zhao, Q.; Ji, Y.; Li, W.; Jiang, Z.; Yu, X.; Zhang, C.; Han, Y.; He, W.; Liu, Y. Ethylene-induced stabilization of ETHYLENE INSENSITIVE3 and EIN3-LIKE1 is mediated by proteasomal degradation of EIN3 binding F-box 1 and 2 that requires EIN2 in Arabidopsis. Plant Cell 2010, 22, 2384–2401. [Google Scholar] [CrossRef] [PubMed] [Green Version]
  43. Ju, C.; Chang, C. Advances in ethylene signalling: Protein complexes at the endoplasmic reticulum membrane. AoB Plants 2012, 2012, pls031. [Google Scholar] [CrossRef] [Green Version]
  44. Li, W.; Ma, M.; Feng, Y.; Li, H.; Wang, Y.; Ma, Y.; Li, M.; An, F.; Guo, H. EIN2-directed translational regulation of ethylene signaling in Arabidopsis. Cell 2015, 163, 670–683. [Google Scholar] [CrossRef] [Green Version]
  45. Merchante, C.; Brumos, J.; Yun, J.; Hu, Q.; Spencer, K.R.; Enriquez, P.; Binder, B.M.; Heber, S.; Stepanova, A.N.; Alonso, J.M. Gene-specifific translation regulation mediated by the hormone- signaling molecule EIN2. Cell 2015, 163, 684–697. [Google Scholar] [CrossRef] [Green Version]
  46. Qiao, H.; Shen, Z.; Huang, S.S.; Schmitz, R.J.; Urich, M.A.; Briggs, S.P.; Ecker, J.R. Processing and subcellular traffificking of ER-tethered EIN2 control response to ethylene gas. Science 2012, 338, 390–393. [Google Scholar] [CrossRef] [PubMed] [Green Version]
  47. Wen, X.; Zhang, C.; Ji, Y.; Zhao, Q.; He, W.; An, F.; Jiang, L.; Guo, H. Activation of ethylene signaling is mediated by nuclear translocation of the cleaved EIN2 carboxyl terminus. Cell Res. 2012, 22, 1613–1616. [Google Scholar] [CrossRef] [PubMed] [Green Version]
  48. Zhong, S.; Zhao, M.; Shi, T.; Shi, H.; An, F.Y.; Zhao, Q.; Guo, H.W. EIN3/EIL1 cooperate with PIF1 to prevent photo-oxidation and to promote greening of Arabidopsis seedlings. Proc. Natl. Acad. Sci. USA 2009, 106, 21431–21436. [Google Scholar] [CrossRef] [Green Version]
  49. Lau, O.S.; Deng, X.W. The photomorphogenic repressors COP1 and DET1: 20 years later. Trends Plant Sci. 2012, 17, 584–593. [Google Scholar] [CrossRef]
  50. Von Arnim, A.; Deng, X.W. Light control of seedling development. Annu. Rev. Plant Physiol. Plant Mol. Biol. 1996, 47, 215–243. [Google Scholar] [CrossRef] [Green Version]
  51. Rodrigues, M.A.; Bianchetti, R.E.; Freschi, L. Shedding light on ethylene metabolism in higher plants. Front. Plant Sci. 2014, 5, 665. [Google Scholar] [CrossRef] [PubMed] [Green Version]
  52. Grodzinski, B.; Boesel, I.; Horton, R.F. Light stimulation of ethylene release from leaves of Gomphrena globosa L. Plant Physiol. 1983, 71, 588–593. [Google Scholar] [CrossRef] [Green Version]
  53. Vandenbussche, F.; Vriezen, W.H.; Smalle, J.; Laarhoven, L.J.; Harren, F.J.; Van Der Straeten, D. Ethylene and auxin control the Arabidopsis response to decreased light intensity. Plant Physiol. 2003, 133, 517–527. [Google Scholar] [CrossRef] [PubMed] [Green Version]
  54. Vandenabeele, S.; Van Der Kelen, K.; Dat, J.; Gadjev, I.; Boonefaes, T.; Morsa, S.; Rottiers, P.; Slooten, L.; Van Montagu, M.; Zabeau, M.; et al. A comprehensive analysis of hydrogen peroxide-induced gene expression in tobacco. Proc. Natl. Acad. Sci. USA 2003, 100, 16113–16118. [Google Scholar] [CrossRef] [PubMed] [Green Version]
  55. Koyama, T.; Sato, F. The function of ETHYLENE RESPONSE FACTOR genes in the light-induced anthocyanin production of Arabidopsis thaliana leaves. Plant Biotechnol. 2018, 35, 87–91. [Google Scholar] [CrossRef] [PubMed] [Green Version]
  56. Kumar, S.; Kumar, S.; Mohapatra, T. Interaction between macro- and micro-nutrients in plants. Front. Plant Sci. 2021, 12, 665583. [Google Scholar] [CrossRef]
  57. Ma, Y.; Chen, R. Nitrogen and phosphorus signaling and transport during Legume-Rhizobium symbiosis. Front. Plant Sci. 2021, 12, 683601. [Google Scholar] [CrossRef] [PubMed]
Figure 1. Fresh weight of plants under different light conditions: 20-day-old seedlings were subjected to one week of relatively high-light treatment (1H), one week of medium-light treatment (1M), one week of relatively low-light treatment (1L), two weeks of relatively high-light treatment (2H), two weeks of medium-light treatment (2M), or two weeks of relatively low-light treatment (2L). Shoot biomass of maize (a), wheat (c), and oilseed rape (e) seedlings. Root biomass of maize (b), wheat (d), and oilseed rape (f) seedlings. Bars represent standard deviations of 3 independent replicates (3 seedlings per replicate). Values followed by different letters are significantly different at p < 0.05 according to Duncan’s multiple range test.
Agronomy 12 00427 g001
Figure 2. Sucrose and starch concentrations of maize, wheat, and oilseed rape seedlings under different light conditions: 20-day-old seedlings were subjected to one week of relatively high-light treatment (1H), one week of medium-light treatment (1M), one week of relatively low-light treatment (1L), two weeks of relatively high-light treatment (2H), two weeks of medium-light treatment (2M), or two weeks of relatively low-light treatment (2L). D.W.: dry weight. Sucrose concentrations of maize (a), wheat (c), and oilseed rape (e) seedlings. Starch concentrations of maize (b), wheat (d), and oilseed rape (f) seedlings. Bars represent standard deviations of 3 independent replicates (3 seedlings per replicate). Values followed by different letters are significantly different at p < 0.05 according to Duncan’s multiple range test.
Agronomy 12 00427 g002
Figure 3. P levels of maize, wheat, and oilseed rape seedlings under different light conditions: 20-day-old seedlings were subjected to one week of relatively high-light treatment (1H), one week of medium-light treatment (1M), one week of relatively low-light treatment (1L), two weeks of relatively high-light treatment (2H), two weeks of medium-light treatment (2M), or two weeks of relatively low-light treatment (2L). D.W.: dry weight. Total phosphorus concentrations of maize (a), wheat (e), and oilseed rape (i) shoots and maize (b), wheat (f), and oilseed rape (j) roots. Cellular Pi levels of maize (c), wheat (g), and oilseed rape (k) shoots and maize (d), wheat (h), and oilseed rape (l) roots. Bars represent standard deviations of 3 independent replicates (3 seedlings per replicate). Values followed by different letters are significantly different at p < 0.05 according to Duncan’s multiple range test.
Agronomy 12 00427 g003
Figure 4. APase activities of plant roots under different light conditions: 20-day-old seedlings were subjected to one week of relatively high-light treatment (1H), one week of medium-light treatment (1M), one week of relatively low-light treatment (1L), two weeks of relatively high-light treatment (2H), two weeks of medium-light treatment (2M), or two weeks of relatively low-light treatment (2L). F.W.: fresh weight. APase staining of maize, wheat, and oilseed rape roots under high-light, medium-light, and low-light treatments (a). Quantitative analysis of APase activities of maize (b), wheat (c), and oilseed rape (d) roots. Bars represent standard deviations of 3 independent replicates (3 seedlings per replicate). Values followed by different letters are significantly different at p < 0.05 according to Duncan’s multiple range test.
Agronomy 12 00427 g004
Figure 5. EIN3 protein levels and ethylene levels of maize, wheat, and oilseed rape seedlings under different light conditions: 20-day-old seedlings were subjected to one week of relatively high-light treatment (1H), one week of medium-light treatment (1M), one week of relatively low-light treatment (1L), two weeks of relatively high-light treatment (2H), two weeks of medium-light treatment (2M), or two weeks of relatively low-light treatment (2L). F.W.: fresh weight; d: day. Western blot analysis of EIN3 protein (a). Western blots for ACTIN proteins were used as loading controls. Western blots were repeated three times, and typical results are presented. The intensity of the signals of Western blotting was analyzed densitometrically by scanning the blots with a thin-layer scanner. EIN3 protein levels of maize (b), wheat (c), and oilseed rape (d) seedlings are shown. Error bars show standard deviations (n = 3). Ethylene levels of maize (e), wheat (f), and oilseed rape (g) seedlings are shown. Bars represent standard deviations of 3 independent replicates (3 seedlings per replicate). Values followed by different letters are significantly different at p < 0.05 according to Duncan’s multiple range test.
Agronomy 12 00427 g005
Table 1. The photosynthetic parameters of maize seedlings under different light conditions.
Net Photosynthetic Rate (μmol m−2 s1)Stomatal Conductance
(mol m−2 s1)
Intercellular CO2 Concentration (μmol mol1)Transpiration Rate
(mmol m−2 s1)
Maize1H7.96 ± 0.04 bc0.15 ± 0.01 a316.06 ± 6.16 b2.12 ± 0.01 a
1M6.56 ± 0.10 d0.11 ± 0.01 ab312.69 ± 1.88 b1.46 ± 0.02 b
1L5.56 ± 0.19 e0.12 ± 0.05 a303.86 ± 2.93 b1.55 ± 0.60 b
2H9.59 ± 0.09 a0.06 ± 0.01 b154.41 ± 2.91 d0.82 ± 0.01 c
2M7.68 ± 0.05 c0.07 ± 0.01 b218.91 ± 1.73 c0.76 ± 0.01 c
2L8.05 ± 0.02 bc0.07 ± 0.01 b212.03 ± 0.12 c0.78 ± 0.01 c
Twenty-day-old seedlings were subjected to one week of relatively high-light treatment (1H), one week of medium-light treatment (1M), one week of relatively low-light treatment (1L), two weeks of relatively high-light treatment (2H), two weeks of medium-light treatment (2M), or two weeks of relatively low-light treatment (2L). Measurements were repeated in triplicate (3 seedlings per replicate). Values are the mean ± standard deviation. Values followed by different letters are significantly different at p < 0.05 according to Duncan’s multiple range test.
Table 2. The photosynthetic parameters of wheat seedlings under different light conditions.
Net Photosynthetic Rate (μmol m−2 s−1)Stomatal Conductance
(mol m−2 s−1)
Intercellular CO2 Concentration (μmol mol−1)Transpiration Rate
(mmol m−2 s−1)
wheat1H3.52 ± 0.06 e0.05 ± 0.01 d157.06 ± 1.95 f1.25 ± 0.01 d
1M6.85 ± 0.00 d0.14 ± 0.01 b188.95 ± 0.08 e3.17 ± 0.01 b
1L6.74 ± 0.07 d0.14 ± 0.01 b188.28 ± 0.23 e3.11 ± 0.02 c
2H3.37 ± 0.09 e0.05 ± 0.01 d281.69 ± 1.04 a0.48 ± 0.01 g
2M8.54 ± 0.02 a0.09 ± 0.01 c259.44 ± 0.32 b1.11 ± 0.01 e
2L7.79 ± 0.08 b0.09 ± 0.01 c250.16 ± 3.80 c0.87 ± 0.01 f
Twenty-day-old seedlings were subjected to one week of relatively high-light treatment (1H), one week of medium-light treatment (1M), one week of relatively low-light treatment (1L), two weeks of relatively high-light treatment (2H), two weeks of medium-light treatment (2M), or two weeks of relatively low-light treatment (2L). Measurements were repeated in triplicate (3 seedlings per replicate). Values are the mean ± standard deviation. Values followed by different letters are significantly different at p < 0.05 according to Duncan’s multiple range test.
Table 3. The photosynthetic parameters of oilseed rape seedlings under different light conditions.
Net Photosynthetic Rate (μmol m−2 s−1)Stomatal Conductance
(mol m−2 s−1)
Intercellular CO2 Concentration (μmol mol−1)Transpiration Rate
(mmol m−2 s−1)
oilseed rape1H6.38 ± 0.20 d0.11 ± 0.03 b313.53 ± 2.27 b1.47 ± 0.04 b
1M8.76 ± 0.05 b0.10 ± 0.02 c264.54 ± 0.36 e1.15 ± 0.03 c
1L4.42 ± 0.08 f0.07 ± 0.02 e303.28 ± 1.37 c0.93 ± 0.02 e
2H4.86 ± 0.63 ef0.11 ± 0.03 a324.53 ± 0.29 a1.54 ± 0.07 a
2M9.72 ± 0.01 a0.11 ± 0.01 b246.49 ± 0.56 f1.05 ± 0.05 d
2L5.49 ± 0.17 e0.09 ± 0.01 d304.93 ± 2.59 c1.48 ± 0.06 b
Twenty-day-old seedlings were subjected to one week of relatively high-light treatment (1H), one week of medium-light treatment (1M), one week of relatively low-light treatment (1L), two weeks of relatively high-light treatment (2H), two weeks of medium-light treatment (2M), or two weeks of relatively low-light treatment (2L). Measurements were repeated in triplicate (3 seedlings per replicate). Values are the mean ± standard deviation. Values followed by different letters are significantly different at p < 0.05 according to Duncan’s multiple range test.
Publisher’s Note: MDPI stays neutral with regard to jurisdictional claims in published maps and institutional affiliations.

