
Strawberry Water Content Estimation and Ripeness Classification Using Hyperspectral Sensing


Abstract
:1. Introduction
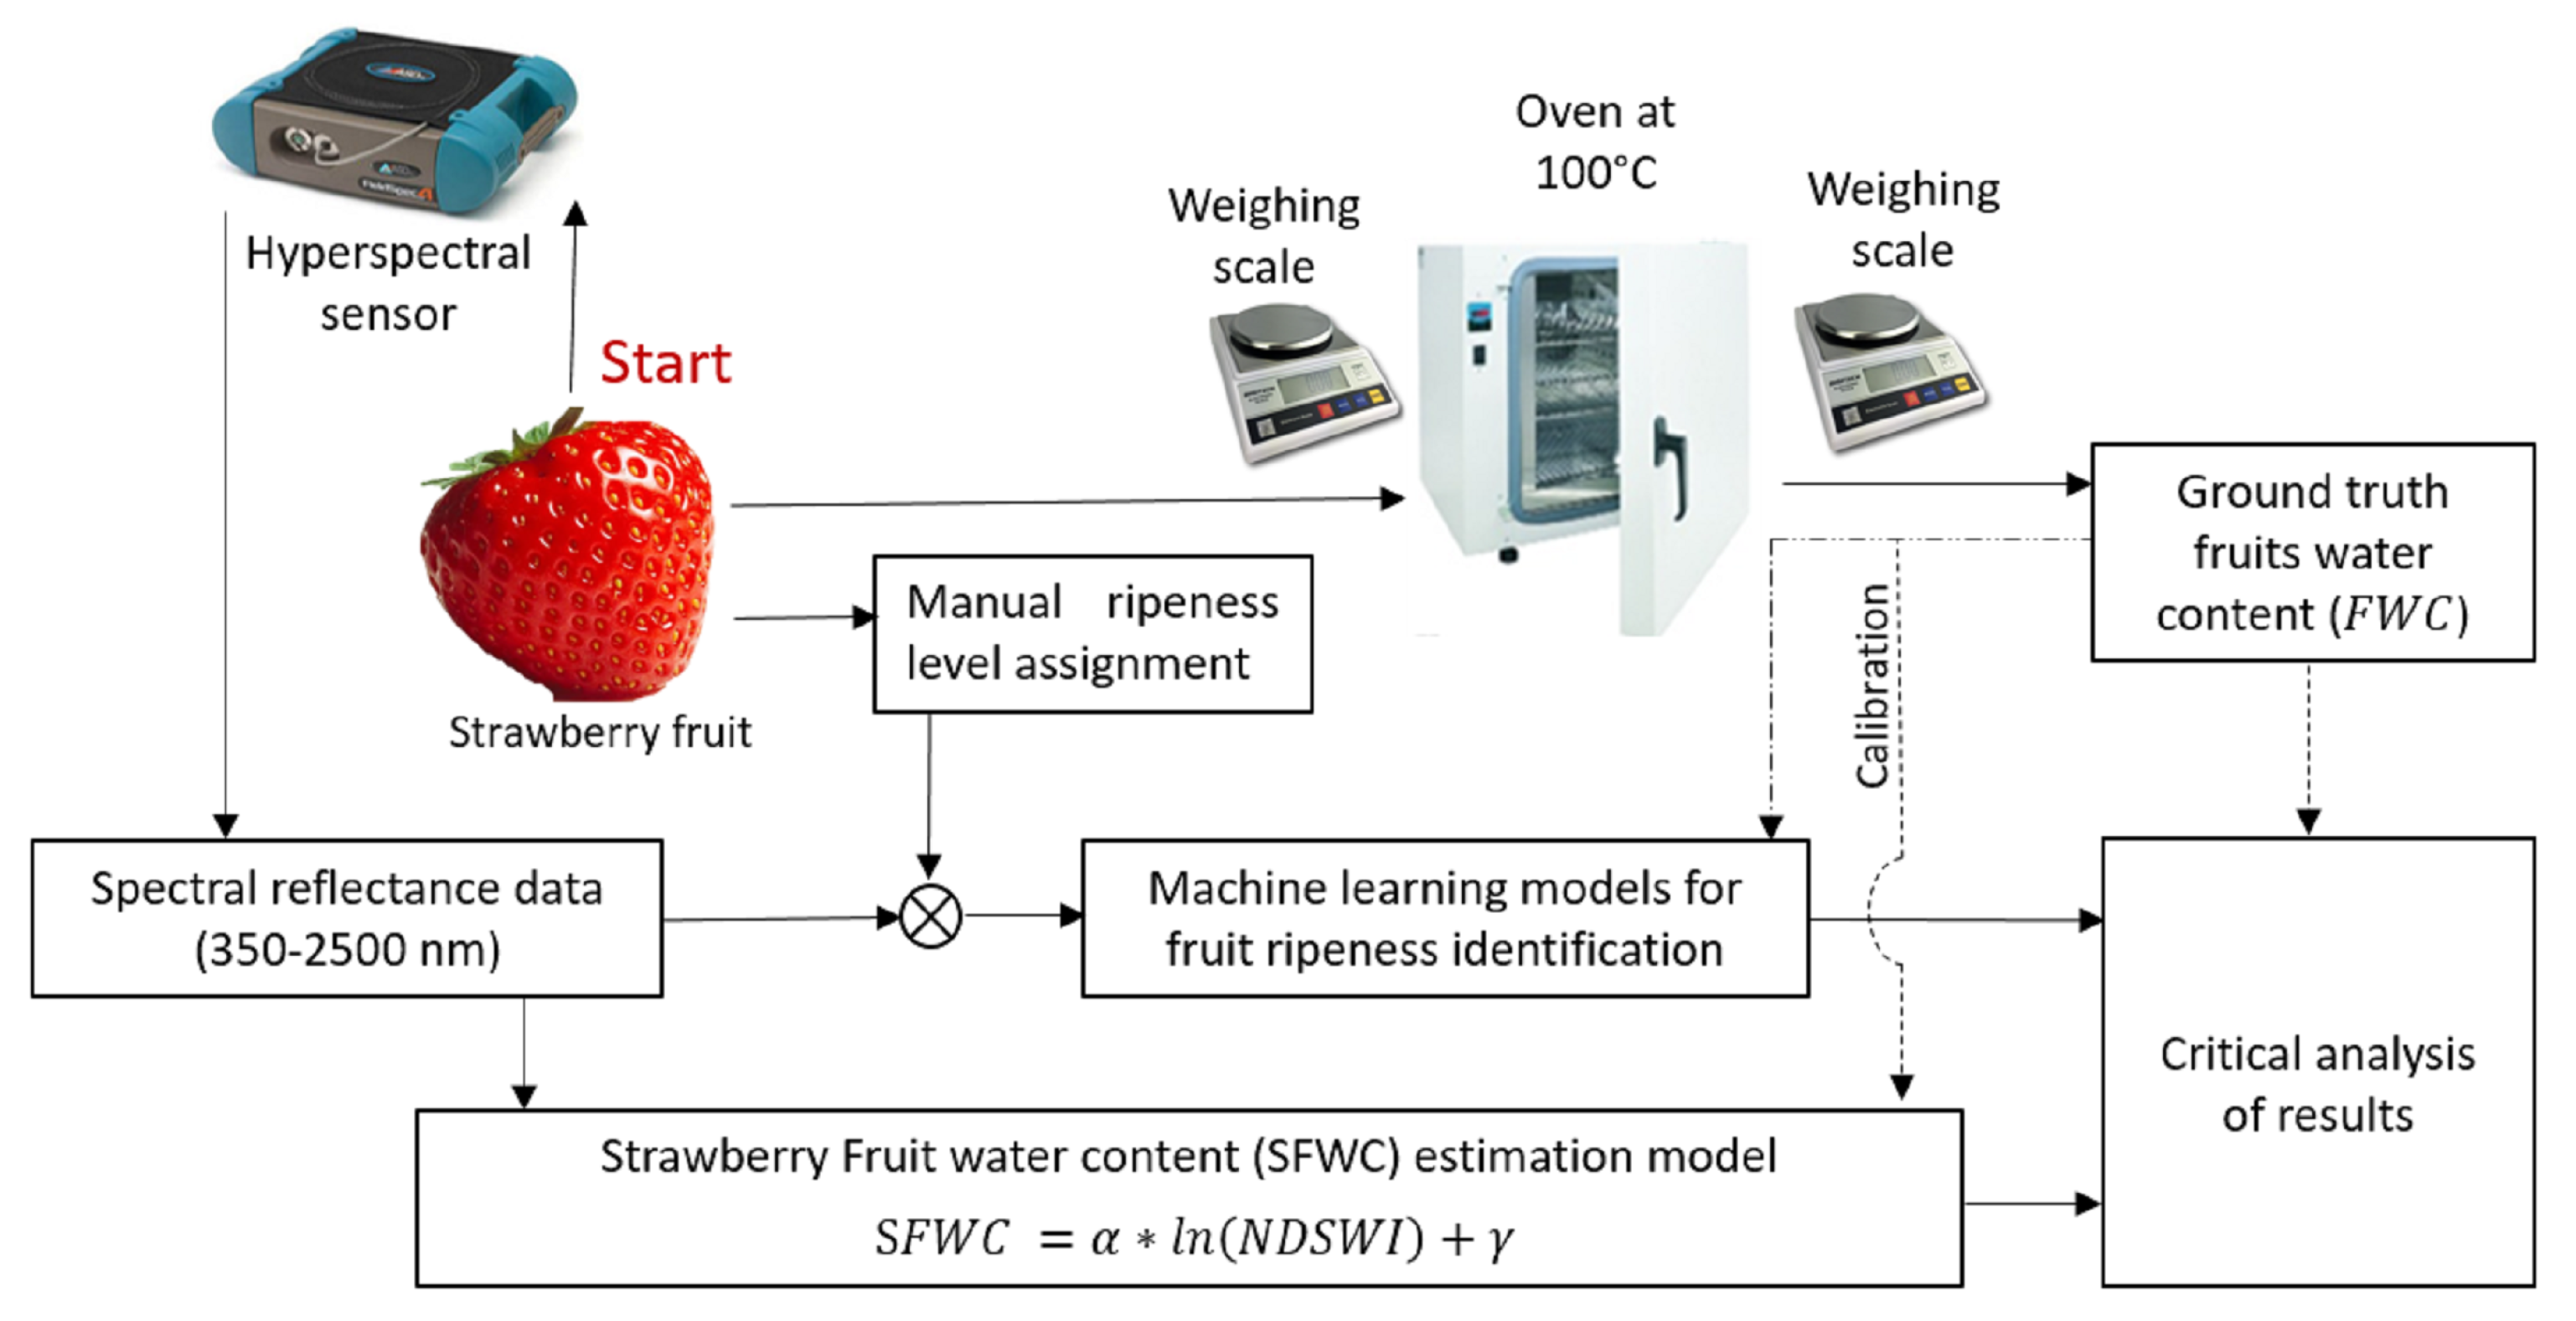
2. Method Overview
3. Data Collection
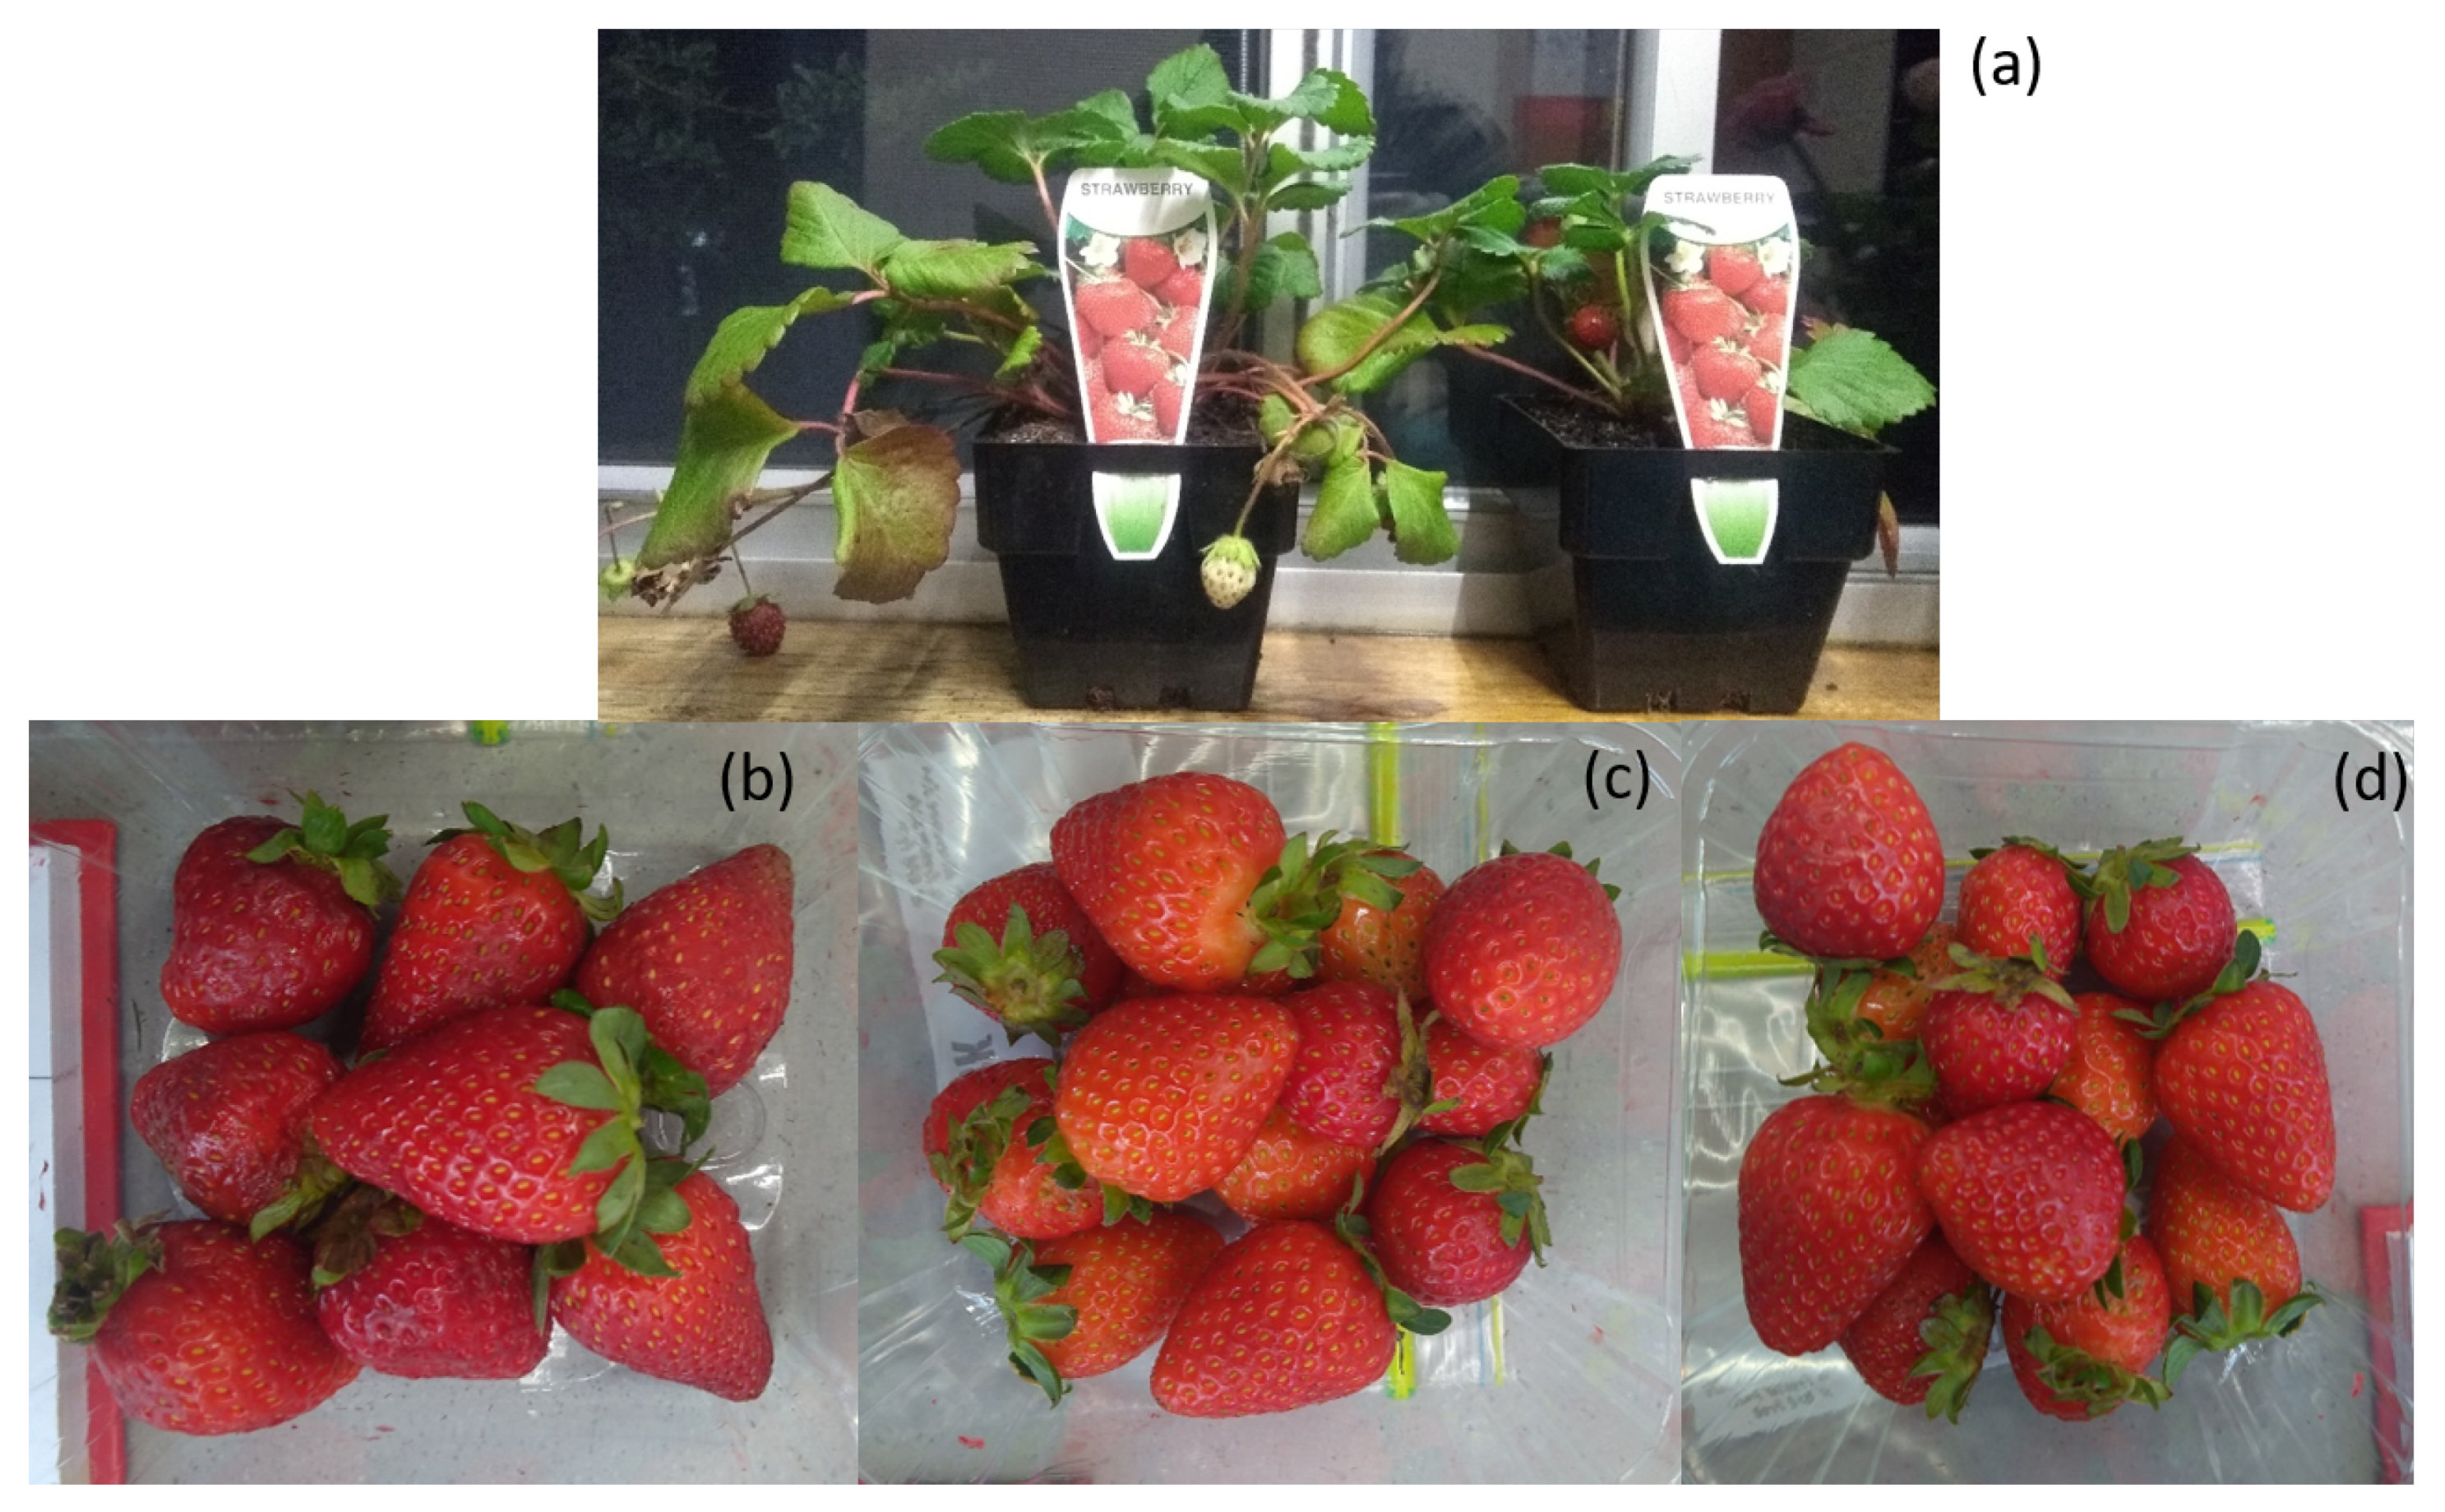
3.1. Strawberry Acquisition
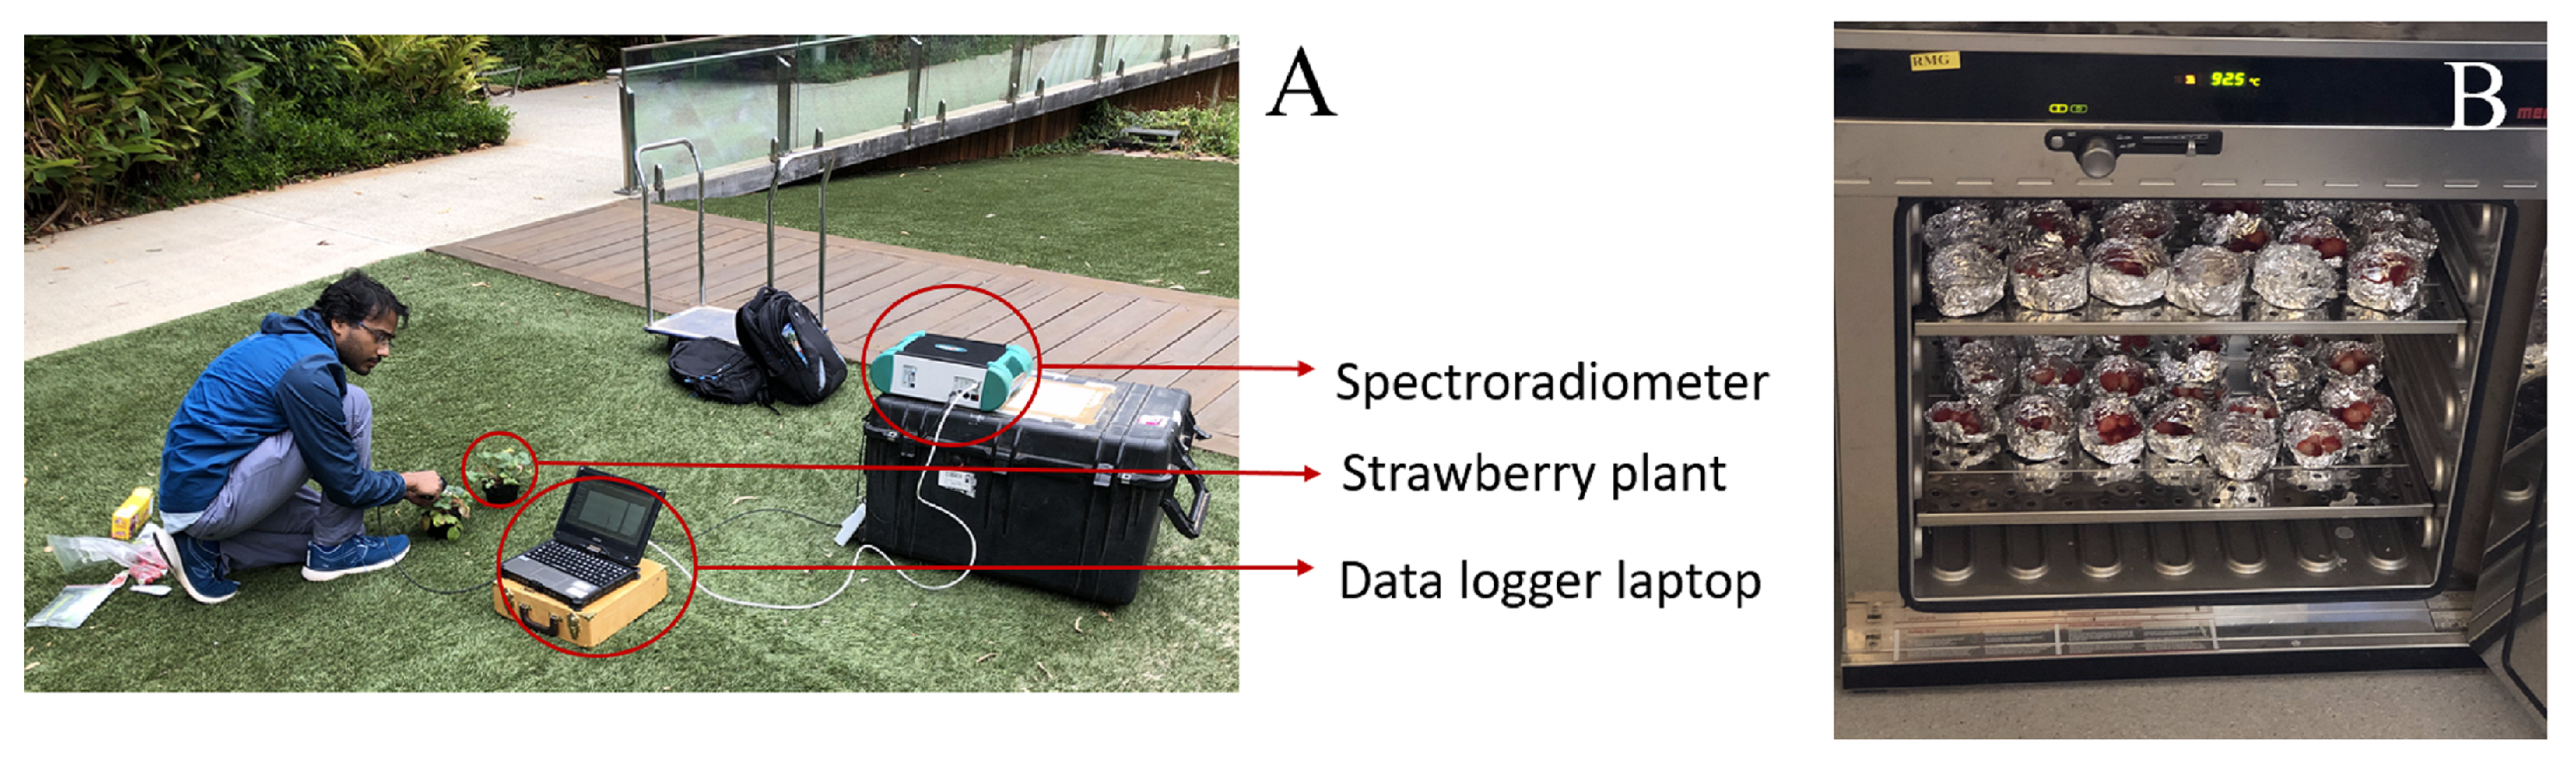
3.2. Hyperspectral Data Collection
3.3. Water Content Measurement
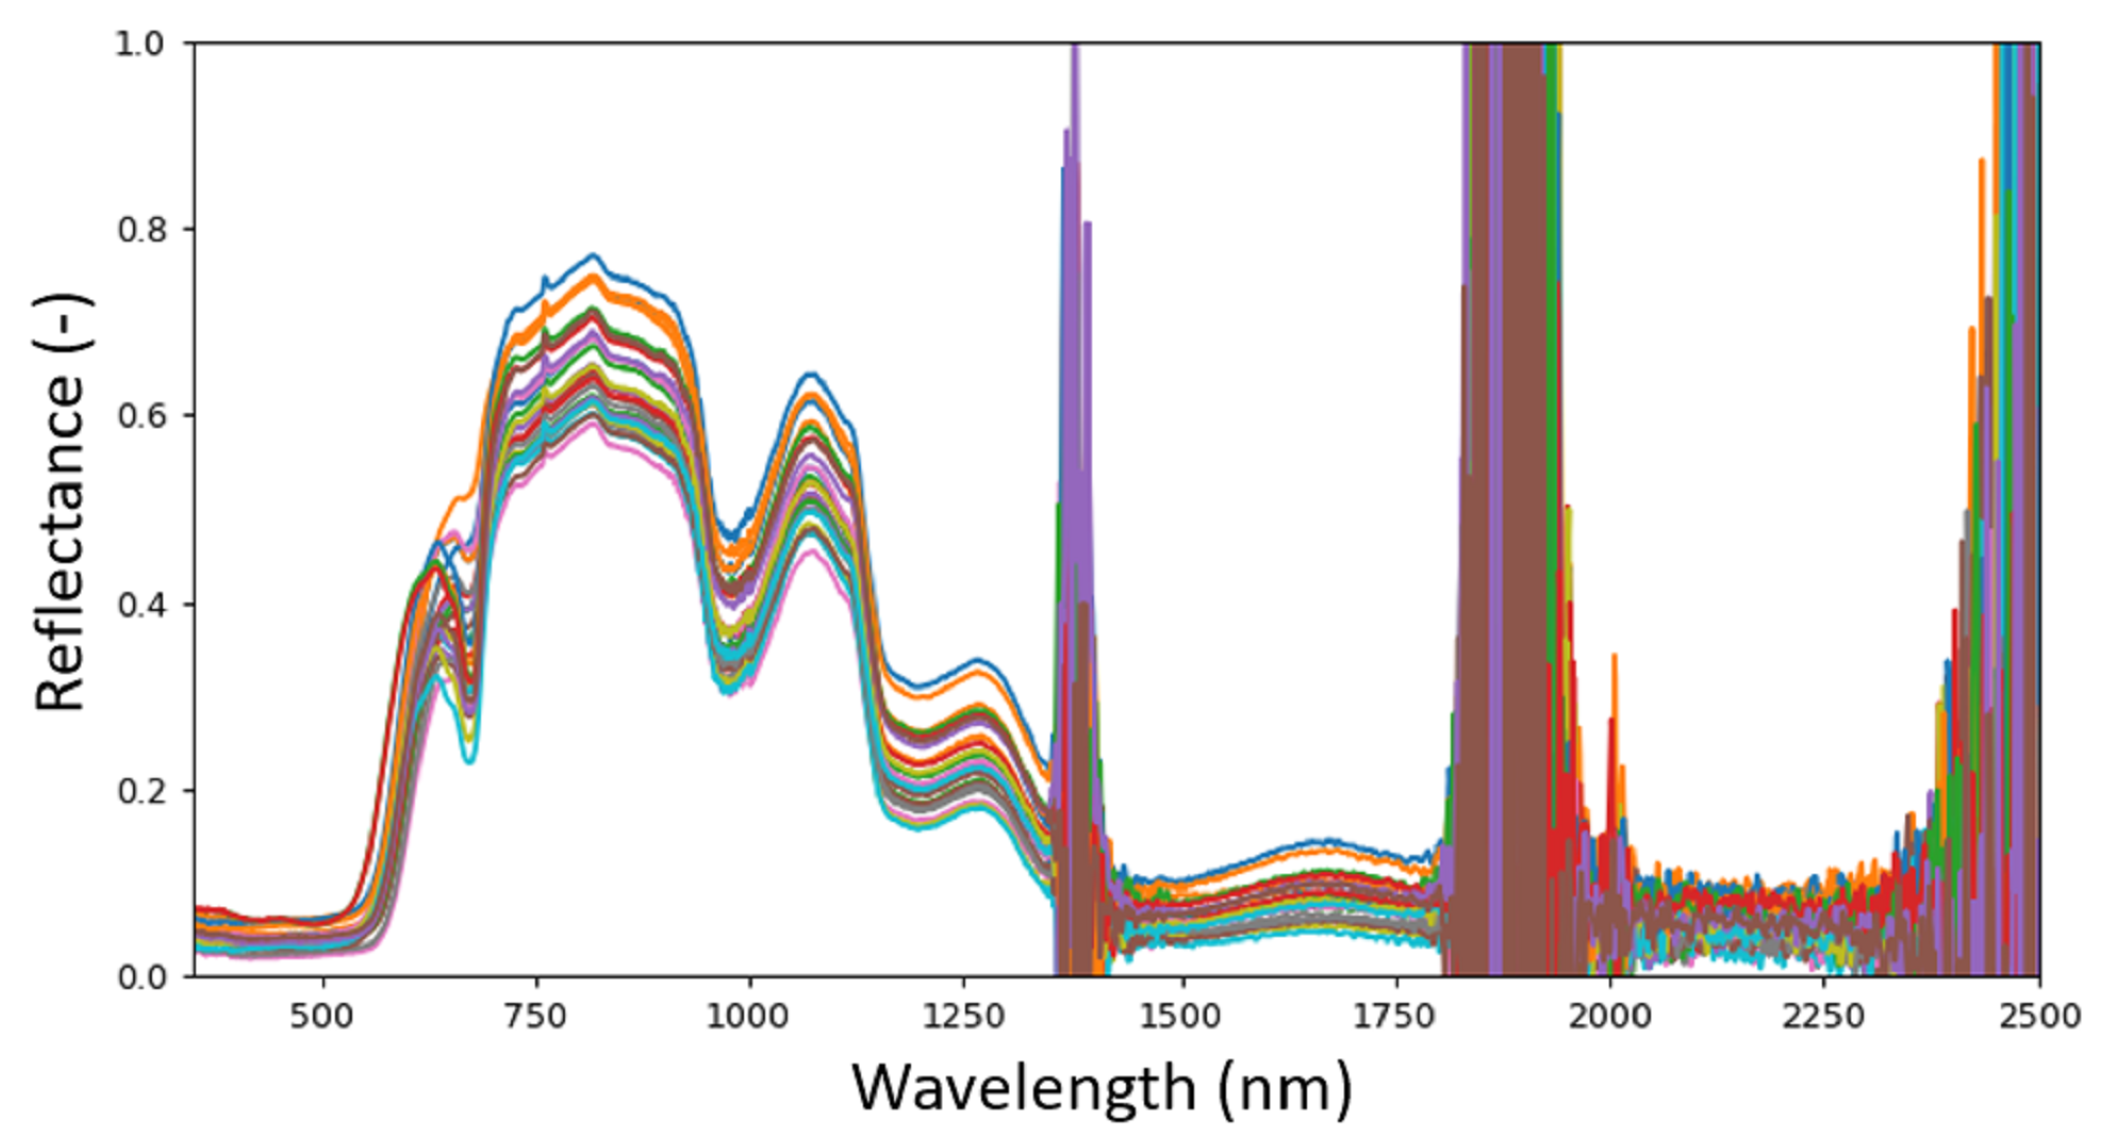
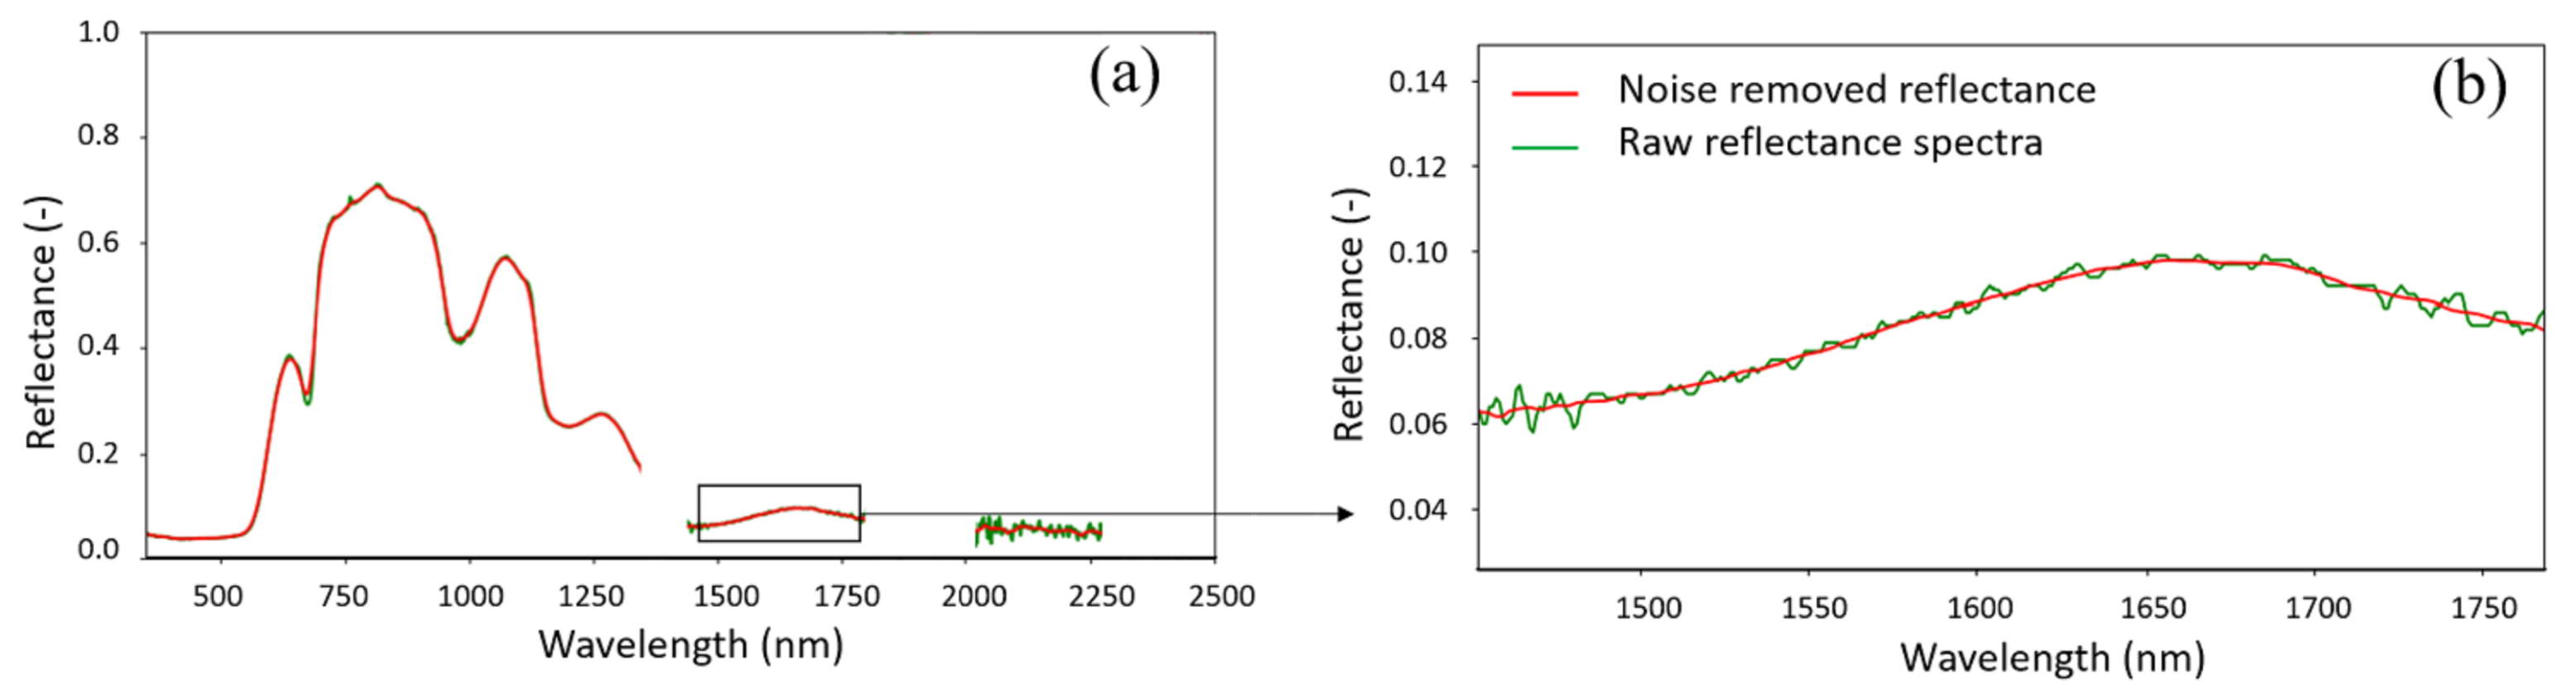
3.4. Data Preprocessing
4. Strawberry Water Content Estimation
4.1. Strawberry Fruit Water Content Metric
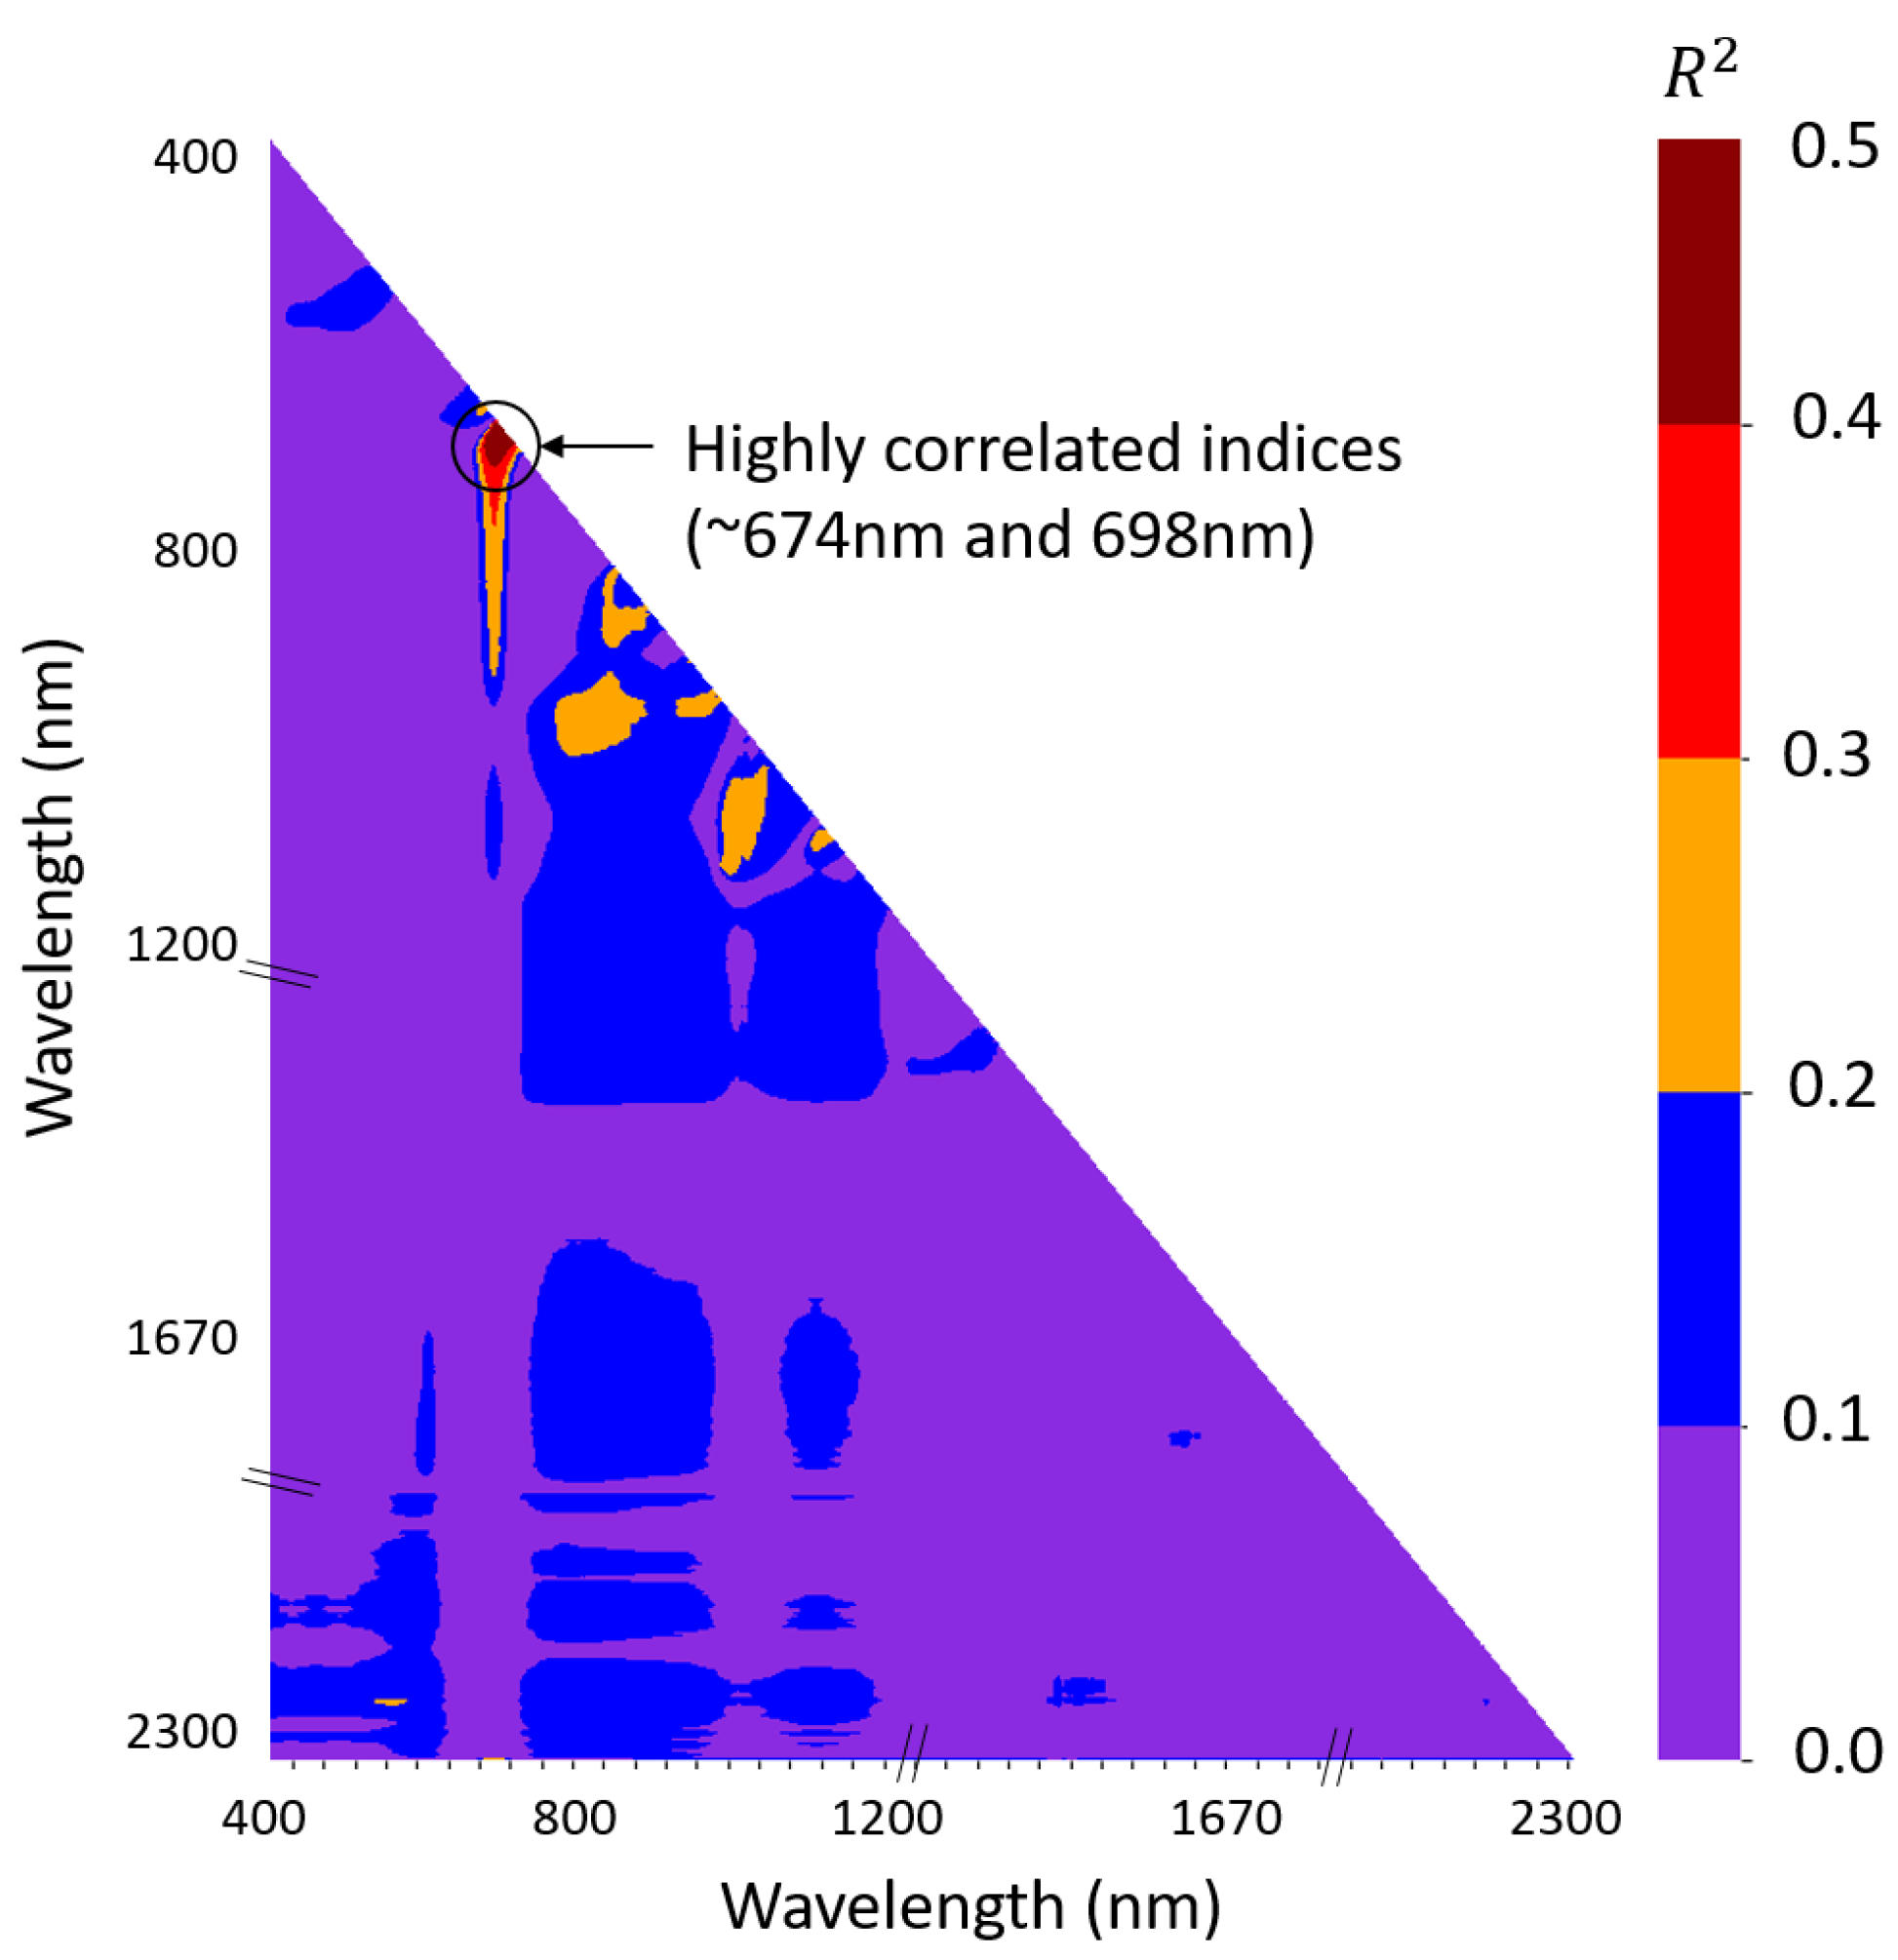
- 674 nm: A water absorption wavelength has previously been identified at 698 nm by Braun and Smirnov (1993) [40] and validated by Raj et al. (2021) [41] on spectroradiometer and drone-based hyperspectral data. Thus, to create a reliable strawberry water content index, the 698 nm wavelength should be connected with any other wavelength in the 670–750 nm range.
- 698 nm: We look for the band that has the maximum correlation with our chosen band of 674 nm. This frequency is far from the water absorption wavelength, sufficiently inside the boundary of the 670–750 nm region, and falls within the visible electromagnetic spectrum range, making it more accessible for many researchers.
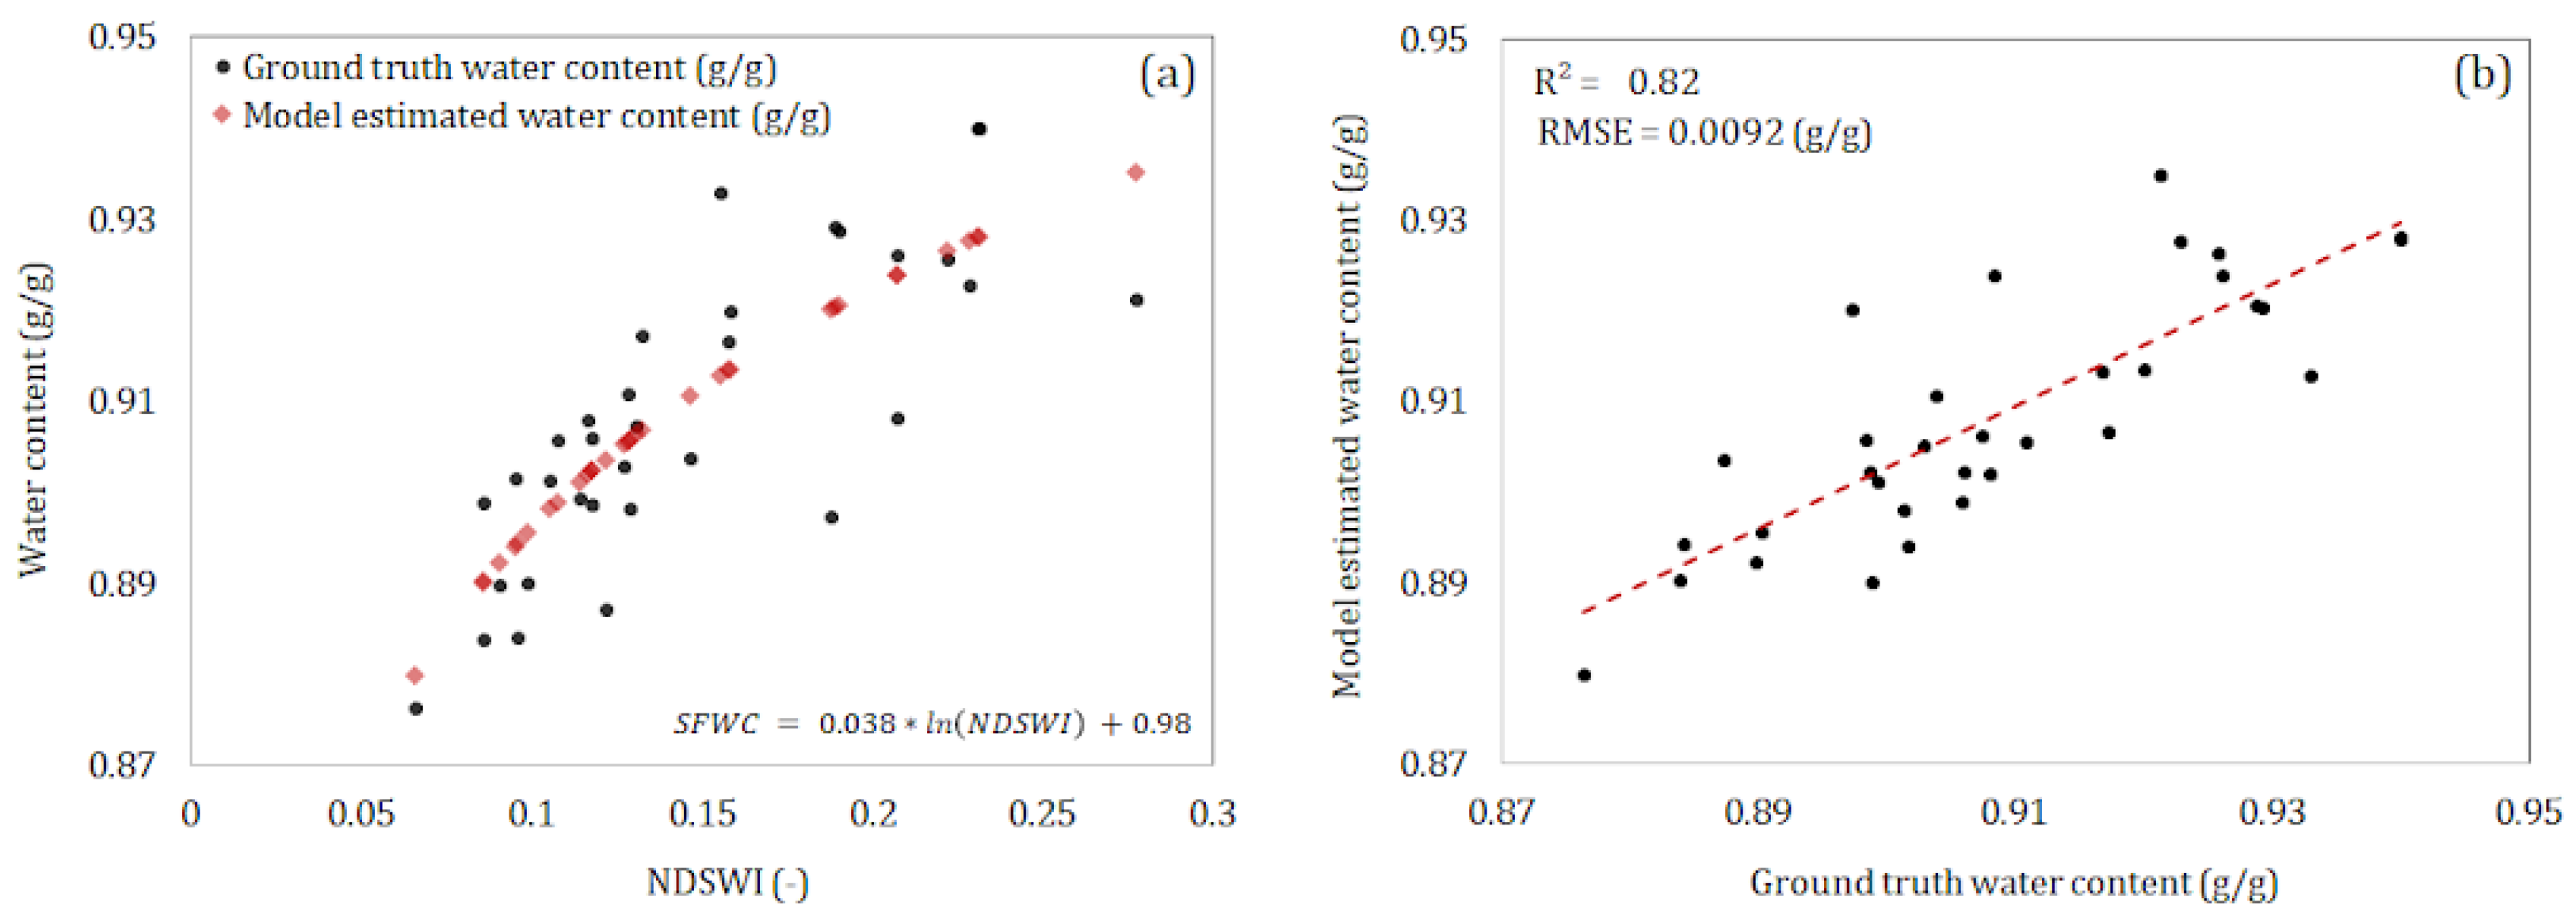
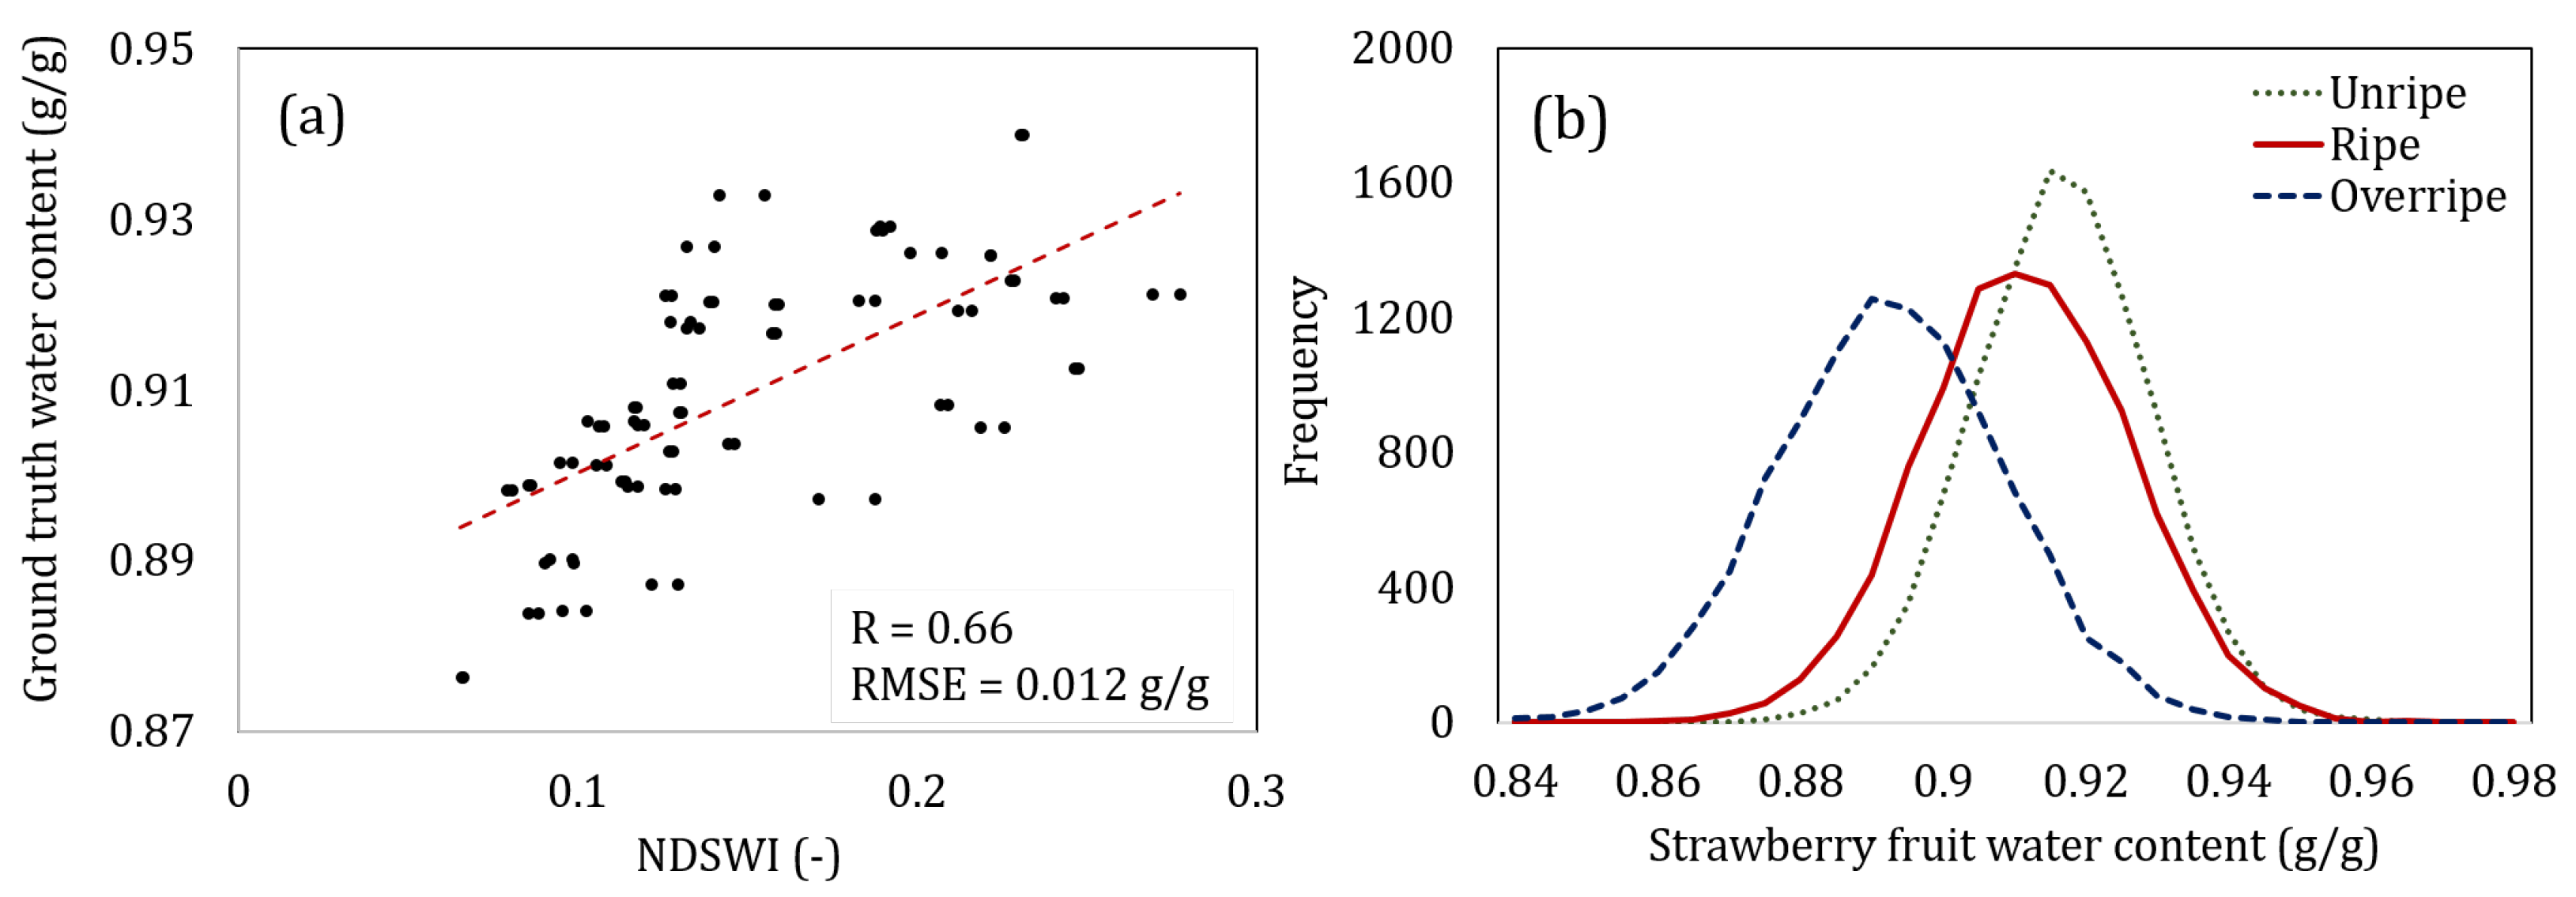
4.2. Water Content Estimation
5. Strawberry Ripeness Classification
- 1.
- Decision Tree: Gini impurity is used for measuring split quality metric and the best split is chosen at each node.
- 2.
- Support Vector Machine (SVM): Different kernels (linear, polynomial, rbf, sigmoid) were separately tried and the the model that yielded the highest test accuracy was chosen. The linear kernel was used for models that takes the spectrum as input, and the rbf kernel was used for models that takes NDSWI as input.
- 3.
- Multi Layer Perceptron (MLP): A fully connected neural network with 4 hidden layers of sizes 80, 40, 20, 10 using adam optimizer, a batch size of 50, and ReLu activation function was trained for 1000 epochs without early stopping.
- 1.
- Normalized Difference Strawberry Water Content Index (NDSWI): The metric we propose in Equation (3), that uses reflectance at 698 nm and 674 nm wavelengths.
- 2.
- Measured Water Content (WC): The ground-truth water content percentage obtained from the oven-dry method as explained in Section 3.3.
- 3.
- Spectrum: Hyperspectral data with preprocessing, as explained in Section 3.4.
6. Conclusions
Author Contributions
Funding
Data Availability Statement
Acknowledgments
Conflicts of Interest
References
- Simpson, D. The economic importance of strawberry crops. In The Genomes of Rosaceous Berries and Their Wild Relatives; Springer: Berlin/Heidelberg, Germany, 2018; pp. 1–7. [Google Scholar]
- Giampieri, F.; Forbes-Hernandez, T.Y.; Gasparrini, M.; Alvarez-Suarez, J.M.; Afrin, S.; Bompadre, S.; Quiles, J.L.; Mezzetti, B.; Battino, M. Strawberry as a health promoter: An evidence based review. Food Funct. 2015, 6, 1386–1398. [Google Scholar] [CrossRef] [PubMed] [Green Version]
- Frenkel, C.; Hartman, T.G. Decrease in fruit moisture content heralds and might launch the onset of ripening processes. J. Food Sci. 2012, 77, S365–S376. [Google Scholar] [CrossRef] [PubMed]
- Jediyi, H.; Naamani, K.; Elkoch, A.A.; Dihazi, A.; El Fels, A.E.A.; Arkize, W. First study on technological maturity and phenols composition during the ripeness of five Vitis vinifera L grape varieties in Morocco. Sci. Hortic. 2019, 246, 390–397. [Google Scholar] [CrossRef]
- Sharma, S.; Singh, K. Harvesting. In Strawberries; CRC Press: Boca Raton, FL, USA, 2019; pp. 399–402. [Google Scholar]
- Puttemans, S.; Vanbrabant, Y.; Tits, L.; Goedemé, T. Automated visual fruit detection for harvest estimation and robotic harvesting. In Proceedings of the 2016 Sixth International Conference on Image Processing Theory, Tools and Applications (IPTA), Oulu, Finland, 12–15 December 2016; IEEE: Piscataway, NJ, USA, 2016; pp. 1–6. [Google Scholar]
- Lamb, N.; Chuah, M.C. A strawberry detection system using convolutional neural networks. In Proceedings of the 2018 IEEE International Conference on Big Data (Big Data), Seattle, WA, USA, 10–13 December 2018; IEEE: Piscataway, NJ, USA, 2018; pp. 2515–2520. [Google Scholar]
- Yu, Y.; Zhang, K.; Yang, L.; Zhang, D. Fruit detection for strawberry harvesting robot in non-structural environment based on Mask-RCNN. Comput. Electron. Agric. 2019, 163, 104846. [Google Scholar] [CrossRef]
- Goondram, S.; Cosgun, A.; Kulic, D. Strawberry Detection using Mixed Training on Simulated and Real Data. In Proceedings of the International Conference on Digital Image Computing: Techniques and Applications (DICTA), Melbourne, Australia, 29 November–2 December 2020. [Google Scholar]
- Sa, I.; Ge, Z.; Dayoub, F.; Upcroft, B.; Perez, T.; McCool, C. Deepfruits: A fruit detection system using deep neural networks. Sensors 2016, 16, 1222. [Google Scholar] [CrossRef] [Green Version]
- Wei, X.; Liu, F.; Qiu, Z.; Shao, Y.; He, Y. Ripeness classification of astringent persimmon using hyperspectral imaging technique. Food Bioprocess Technol. 2014, 7, 1371–1380. [Google Scholar] [CrossRef]
- Sturm, K.; Koron, D.; Stampar, F. The composition of fruit of different strawberry varieties depending on maturity stage. Food Chem. 2003, 83, 417–422. [Google Scholar] [CrossRef]
- Díaz-Pérez, J.C.; Muy-Rangel, M.D.; Mascorro, A.G. Fruit size and stage of ripeness affect postharvest water loss in bell pepper fruit (Capsicum annuum L.). J. Sci. Food Agric. 2007, 87, 68–73. [Google Scholar] [CrossRef]
- Misron, N.; Aliteh, N.A.; Harun, N.H.; Tashiro, K.; Sato, T.; Wakiwaka, H. Relative estimation of water content for flat-type inductive-based oil palm fruit maturity sensor. Sensors 2017, 17, 52. [Google Scholar] [CrossRef] [Green Version]
- Akhtar, I.; Rab, A. Effect of fruit ripening stages on strawberry (Fragarta X Ananassa. Duch) fruit quality for fresh consumption. J. Agric. Res. 2015, 53, 213–224. [Google Scholar]
- Forney, C.; Kalt, W.; McDonald, J.E.; Jordan, M. Changes in strawberry fruit quality during ripening on and off the plant. In Proceedings of the International Postharvest Science Conference Postharvest 96 464, Taupo, New Zealand, 4–9 August 1996; p. 506. [Google Scholar]
- Fecka, I.; Nowicka, A.; Kucharska, A.Z.; Sokół-Łętowska, A. The effect of strawberry ripeness on the content of polyphenols, cinnamates, L-ascorbic and carboxylic acids. J. Food Compos. Anal. 2021, 95, 103669. [Google Scholar] [CrossRef]
- Pineli, L.d.L.d.O.; Moretti, C.L.; dos Santos, M.S.; Campos, A.B.; Brasileiro, A.V.; Córdova, A.C.; Chiarello, M.D. Antioxidants and other chemical and physical characteristics of two strawberry cultivars at different ripeness stages. J. Food Compos. Anal. 2011, 24, 11–16. [Google Scholar] [CrossRef]
- Woodward, J. Physical and chemical changes in developing strawberry fruits. J. Sci. Food Agric. 1972, 23, 465–473. [Google Scholar] [CrossRef]
- Yoshida, Y.; Koyama, N.; Tamura, H. Color and anthocyanin composition of strawberry fruit: Changes during fruit development and differences among cultivars, with special reference to the occurrence of pelargonidin 3-malonylglucoside. J. Jpn. Soc. Hortic. Sci. 2002, 71, 355–361. [Google Scholar] [CrossRef] [Green Version]
- Delgado-Pelayo, R.; Gallardo-Guerrero, L.; Hornero-Méndez, D. Carotenoid composition of strawberry tree (Arbutus unedo L.) fruits. Food Chem. 2016, 199, 165–175. [Google Scholar] [CrossRef] [Green Version]
- Zhu, H.; Chen, M.; Wen, Q.; Li, Y. Isolation and characterization of the carotenoid biosynthetic genes LCYB, LCYE and CHXB from strawberry and their relation to carotenoid accumulation. Sci. Hortic. 2015, 182, 134–144. [Google Scholar] [CrossRef]
- ElMasry, G.; Wang, N.; ElSayed, A.; Ngadi, M. Hyperspectral imaging for nondestructive determination of some quality attributes for strawberry. J. Food Eng. 2007, 81, 98–107. [Google Scholar] [CrossRef]
- Liu, C.; Liu, W.; Lu, X.; Ma, F.; Chen, W.; Yang, J.; Zheng, L. Application of multispectral imaging to determine quality attributes and ripeness stage in strawberry fruit. PLoS ONE 2014, 9, e87818. [Google Scholar] [CrossRef]
- Shao, Y.; Wang, Y.; Xuan, G.; Gao, Z.; Hu, Z.; Gao, C.; Wang, K. Assessment of strawberry ripeness using hyperspectral imaging. Anal. Lett. 2020, 54, 1547–1560. [Google Scholar] [CrossRef]
- Gao, Z.; Shao, Y.; Xuan, G.; Wang, Y.; Liu, Y.; Han, X. Real-time hyperspectral imaging for the in-field estimation of strawberry ripeness with deep learning. Artif. Intell. Agric. 2020, 4, 31–38. [Google Scholar] [CrossRef]
- Indrabayu, I.; Arifin, N.; Areni, I.S. Strawberry Ripeness Classification System Based On Skin Tone Color using Multi-Class Support Vector Machine. In Proceedings of the 2019 International Conference on Information and Communications Technology (ICOIACT), Yogyakarta, Indonesia, 24–25 July 2019; IEEE: Piscataway, NJ, USA, 2019; pp. 191–195. [Google Scholar]
- Zhou, X.; Lee, W.S.; Ampatzidis, Y.; Chen, Y.; Peres, N.; Fraisse, C. Strawberry Maturity Classification from UAV and Near-Ground Imaging Using Deep Learning. Smart Agric. Technol. 2021, 1, 100001. [Google Scholar] [CrossRef]
- Anraeni, S.; Indra, D.; Adirahmadi, D.; Pomalingo, S.; Sugiarti; Mansyur, S.H. Strawberry Ripeness Identification Using Feature Extraction of RGB and K-Nearest Neighbor. In Proceedings of the 2021 3rd East Indonesia Conference on Computer and Information Technology (EIConCIT), Surabaya, Indonesia, 9–11 April 2021; IEEE: Piscataway, NJ, USA, 2021; pp. 395–398. [Google Scholar]
- Devassy, B.M.; George, S. Estimation of strawberry firmness using hyperspectral imaging: A comparison of regression models. J. Spectr. Imaging 2021, 10. [Google Scholar] [CrossRef]
- Swinehart, D.F. The beer-lambert law. J. Chem. Educ. 1962, 39, 333. [Google Scholar] [CrossRef]
- Mohamed, I.; Williams, D.; Stevens, R.; Dudley, R. Strawberry ripeness calibrated 2D colour lookup table for field-deployable computer vision. In Proceedings of the IOP Conference Series: Earth and Environmental Science; IOP Publishing: Bristol, UK, 2019; Volume 275, p. 012003. [Google Scholar]
- Thenkabail, P.S.; Smith, R.B.; De Pauw, E. Hyperspectral vegetation indices and their relationships with agricultural crop characteristics. Remote Sens. Environ. 2000, 71, 158–182. [Google Scholar] [CrossRef]
- Fava, F.; Colombo, R.; Bocchi, S.; Meroni, M.; Sitzia, M.; Fois, N.; Zucca, C. Identification of hyperspectral vegetation indices for Mediterranean pasture characterization. Int. J. Appl. Earth Obs. Geoinf. 2009, 11, 233–243. [Google Scholar] [CrossRef]
- Delegido, J.; Verrelst, J.; Meza, C.; Rivera, J.; Alonso, L.; Moreno, J. A red-edge spectral index for remote sensing estimation of green LAI over agroecosystems. Eur. J. Agron. 2013, 46, 42–52. [Google Scholar] [CrossRef]
- Feild, T.S.; Lee, D.W.; Holbrook, N.M. Why leaves turn red in autumn. The role of anthocyanins in senescing leaves of red-osier dogwood. Plant Physiol. 2001, 127, 566–574. [Google Scholar] [CrossRef] [PubMed]
- Gitelson, A.A.; Merzlyak, M.N.; Chivkunova, O.B. Optical properties and nondestructive estimation of anthocyanin content in plant leaves. Photochem. Photobiol. 2001, 74, 38–45. [Google Scholar] [CrossRef]
- Hughes, N.M.; Smith, W.K. Attenuation of incident light in Galax urceolata (Diapensiaceae): Concerted influence of adaxial and abaxial anthocyanic layers on photoprotection. Am. J. Bot. 2007, 94, 784–790. [Google Scholar] [CrossRef] [Green Version]
- Merzlyak, M.N.; Chivkunova, O.B.; Solovchenko, A.E.; Naqvi, K.R. Light absorption by anthocyanins in juvenile, stressed, and senescing leaves. J. Exp. Bot. 2008, 59, 3903–3911. [Google Scholar] [CrossRef] [Green Version]
- Braun, C.L.; Smirnov, S.N. Why is water blue? J. Chem. Educ. 1993, 70, 612. [Google Scholar] [CrossRef]
- Raj, R.; Walker, J.P.; Vinod, V.; Pingale, R.; Naik, B.; Jagarlapudi, A. Leaf water content estimation using top-of-canopy airborne hyperspectral data. Int. J. Appl. Earth Obs. Geoinf. 2021, 102, 102393. [Google Scholar] [CrossRef]
- Nikzad-Langerodi, R.; Zellinger, W.; Saminger-Platz, S.; Moser, B.A. Domain adaptation for regression under Beer–Lambert’s law. Knowl.-Based Syst. 2020, 210, 106447. [Google Scholar] [CrossRef]
- Lasdon, L.S.; Waren, A.D.; Jain, A.; Ratner, M. Design and testing of a generalized reduced gradient code for nonlinear programming. ACM Trans. Math. Softw. (TOMS) 1978, 4, 34–50. [Google Scholar] [CrossRef]


| Input | Input Size | ML Method | Ripe % | Unripe % | Overripe % | Overall % |
|---|---|---|---|---|---|---|
| NDSWI | 1 | Decision Tree | 76.6 | 55 | 100 | 71.2 |
| NDSWI | 1 | SVM (rbf) | 94.1 | 22.4 | 0 | 68 |
| NDSWI | 1 | MLP | 98.2 | 9.2 | 0 | 66.6 |
| NDSWI+WC | 2 | Decision Tree | 92 | 75.6 | 100 | 87.4 |
| NDSWI+WC | 2 | SVM (rbf) | 100 | 0 | 0 | 65 |
| NDSWI+WC | 2 | MLP | 100 | 0 | 0 | 65 |
| 670–750 nm band | 81 | Decision Tree | 77.9 | 53.3 | 69 | 70.1 |
| 670–750 nm band | 81 | SVM (rbf) | 93.1 | 26 | 0 | 68.4 |
| 670–750 nm band | 81 | MLP | 90.7 | 29.2 | 0 | 67.8 |
| Spectrum | 1640 | Decision Tree | 97.7 | 90.4 | 88 | 93.8 |
| Spectrum | 1640 | SVM (linear) | 99.7 | 94.9 | 100 | 98.2 |
| Spectrum | 1640 | MLP | 97.9 | 92.7 | 99 | 96.4 |
| Spectrum+WC | 1641 | Decision Tree | 95.6 | 90.7 | 87 | 93.7 |
| Spectrum+WC | 1641 | SVM (linear) | 99.8 | 94.9 | 100 | 98.3 |
| Spectrum+WC | 1641 | MLP | 97.2 | 93.3 | 98 | 96.1 |
Publisher’s Note: MDPI stays neutral with regard to jurisdictional claims in published maps and institutional affiliations. |
© 2022 by the authors. Licensee MDPI, Basel, Switzerland. This article is an open access article distributed under the terms and conditions of the Creative Commons Attribution (CC BY) license (https://creativecommons.org/licenses/by/4.0/).
Share and Cite
Raj, R.; Cosgun, A.; Kulić, D. Strawberry Water Content Estimation and Ripeness Classification Using Hyperspectral Sensing. Agronomy 2022, 12, 425. https://doi.org/10.3390/agronomy12020425
Raj R, Cosgun A, Kulić D. Strawberry Water Content Estimation and Ripeness Classification Using Hyperspectral Sensing. Agronomy. 2022; 12(2):425. https://doi.org/10.3390/agronomy12020425
Chicago/Turabian StyleRaj, Rahul, Akansel Cosgun, and Dana Kulić. 2022. "Strawberry Water Content Estimation and Ripeness Classification Using Hyperspectral Sensing" Agronomy 12, no. 2: 425. https://doi.org/10.3390/agronomy12020425
APA StyleRaj, R., Cosgun, A., & Kulić, D. (2022). Strawberry Water Content Estimation and Ripeness Classification Using Hyperspectral Sensing. Agronomy, 12(2), 425. https://doi.org/10.3390/agronomy12020425