
Stability on Maize Hybrids Based on GGE Biplot Graphical Technique


 ,
,  ,
,  and
and 
Abstract
1. Introduction
2. Materials and Methods
3. Results and Discussion
4. Conclusions
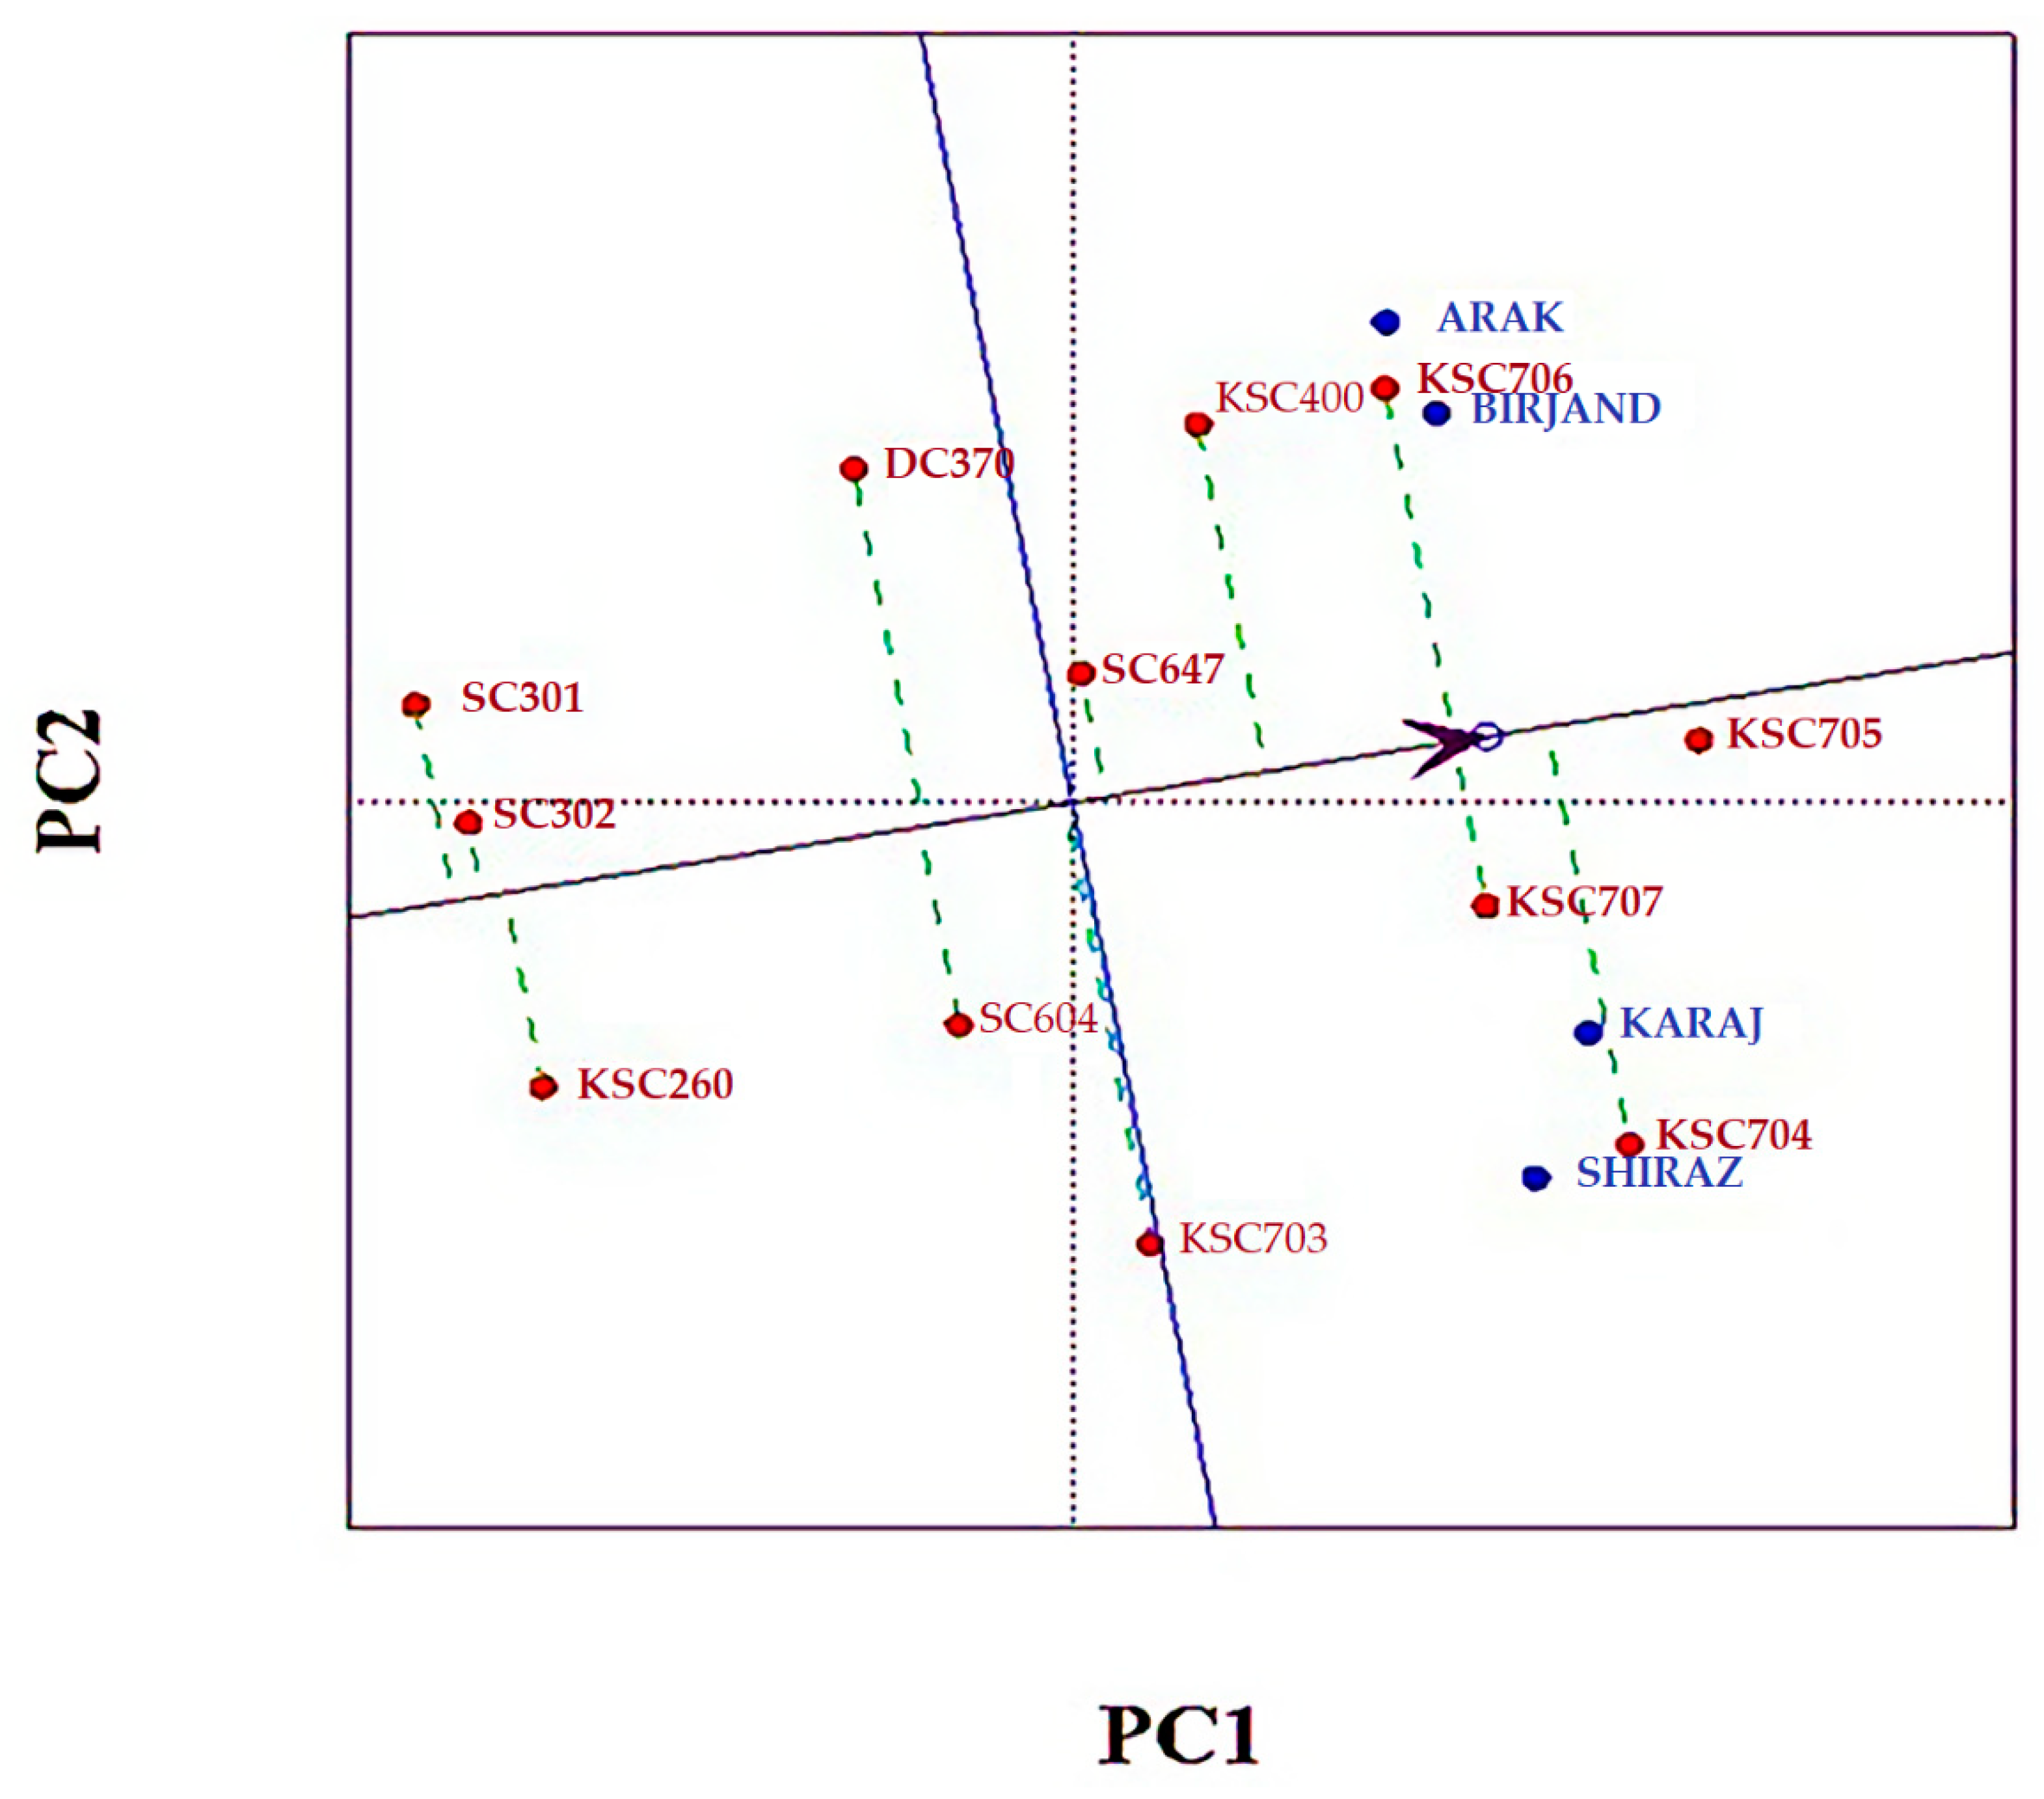
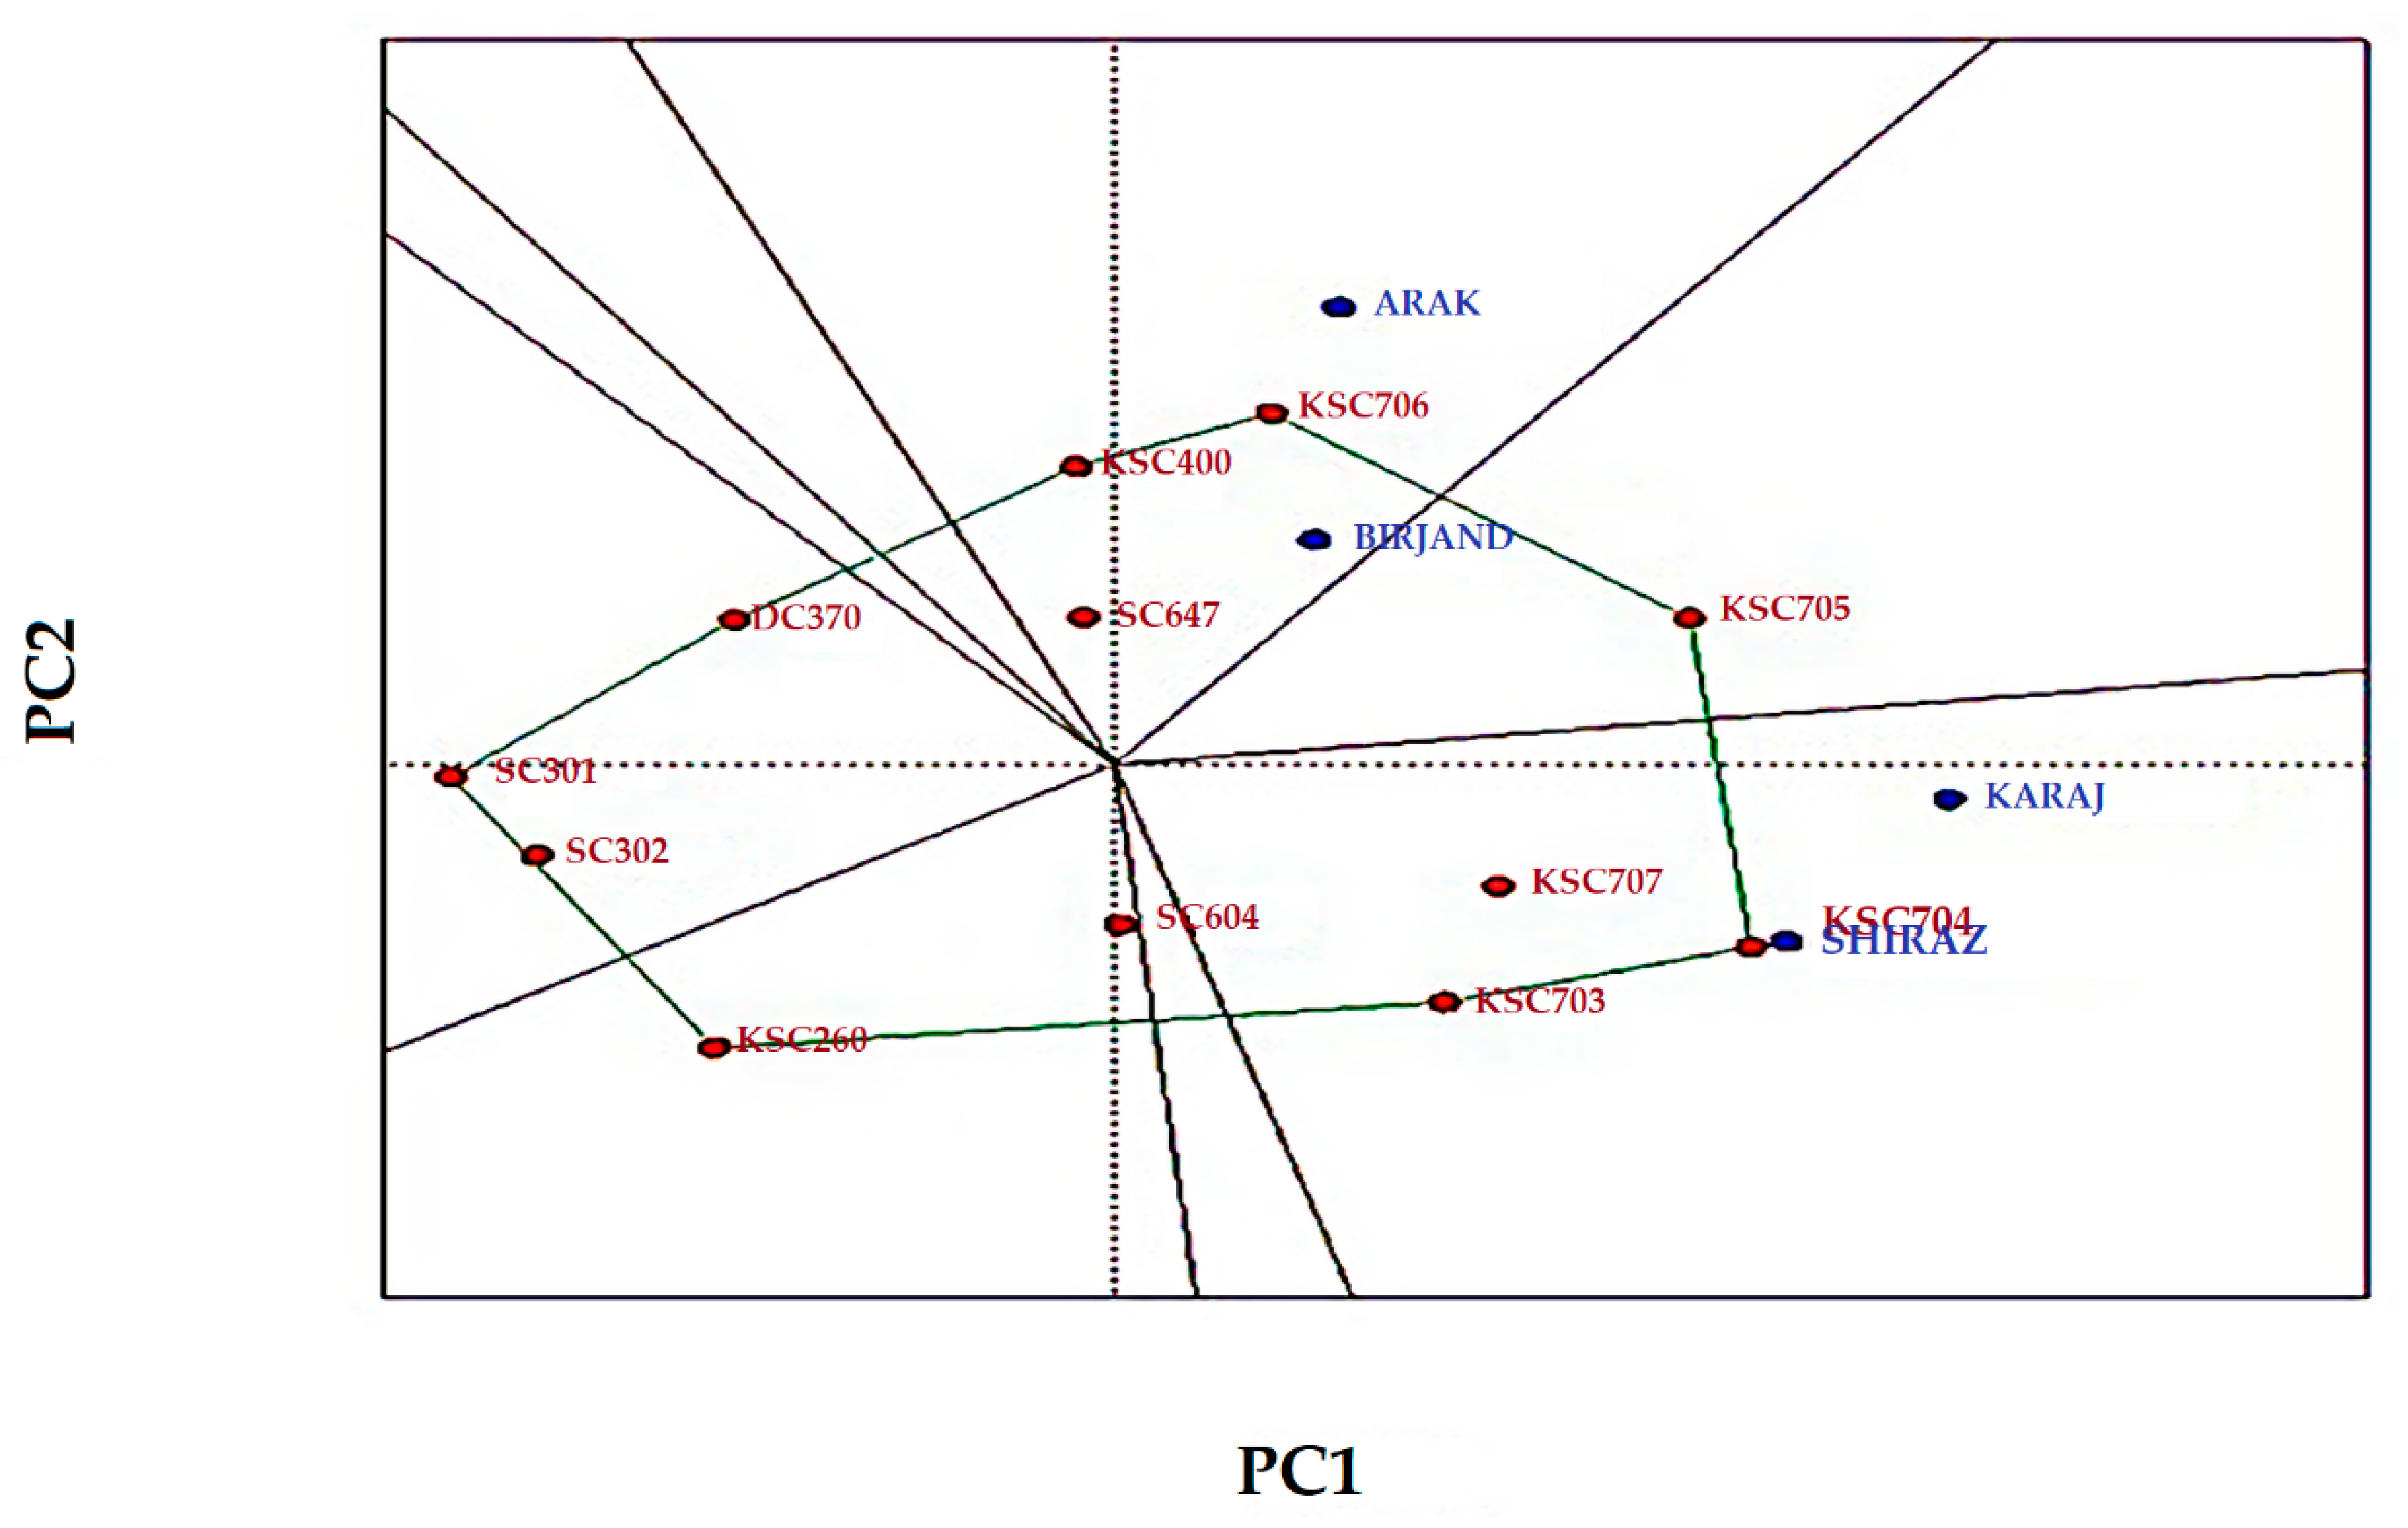
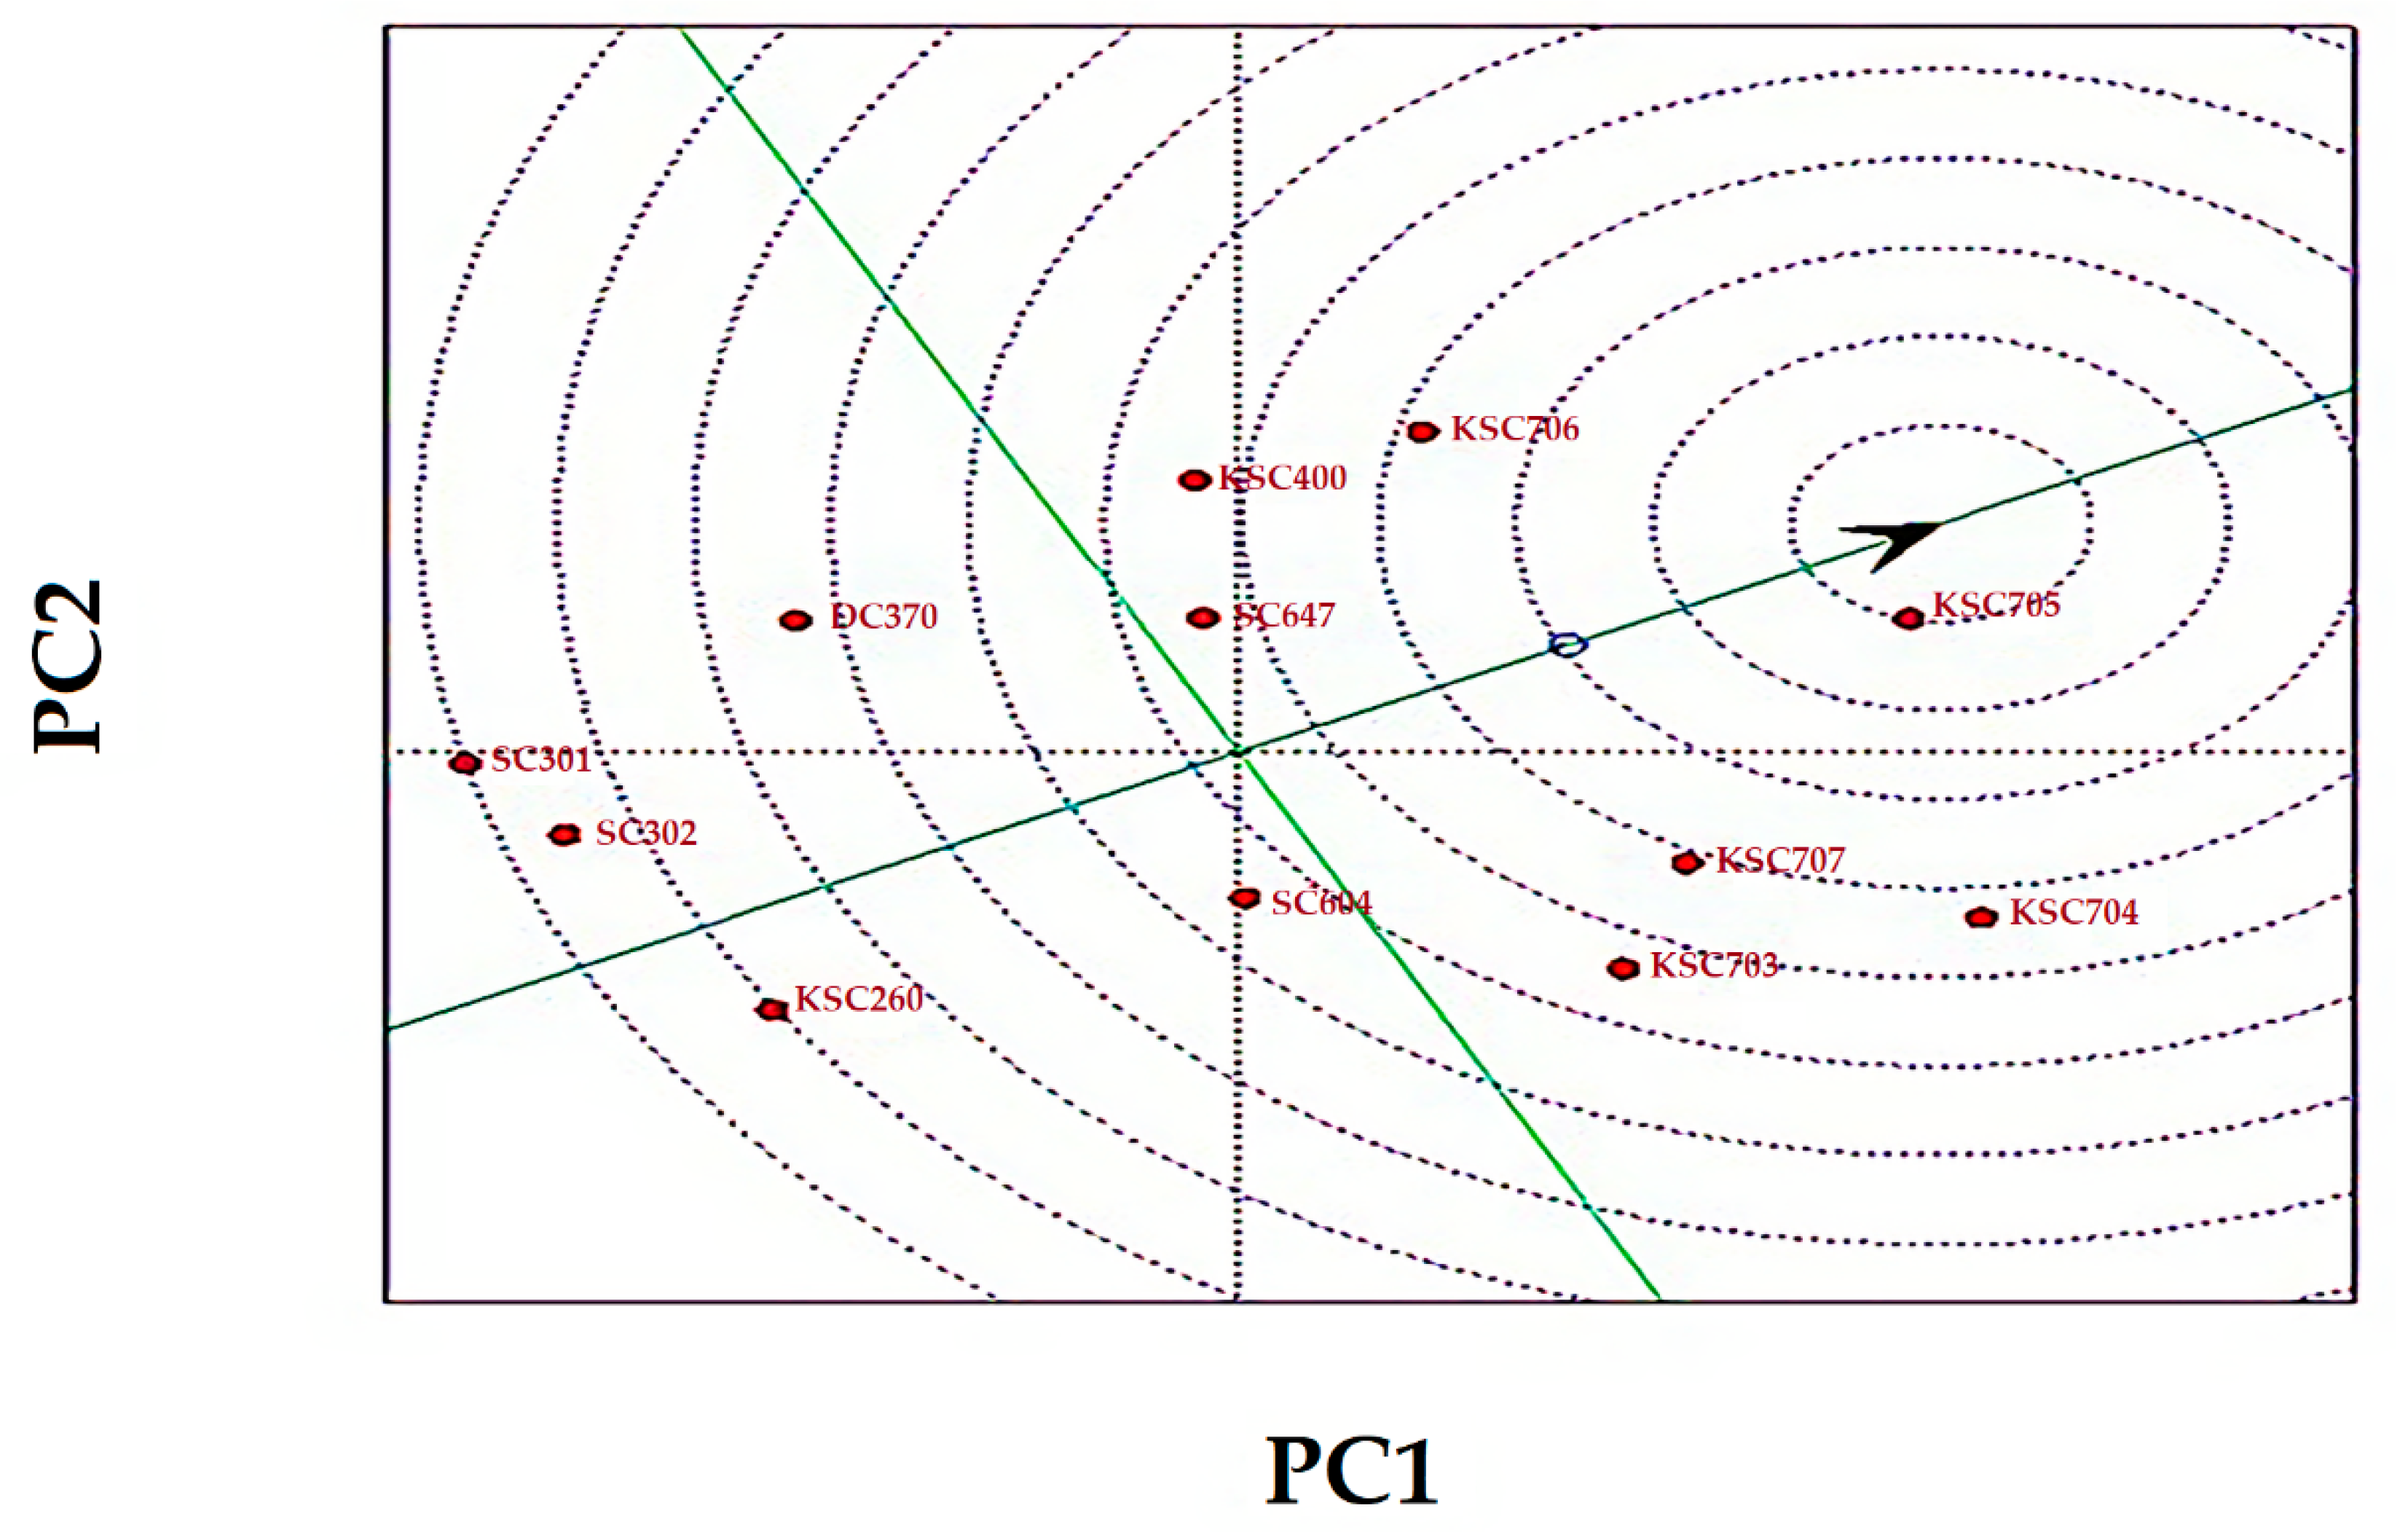
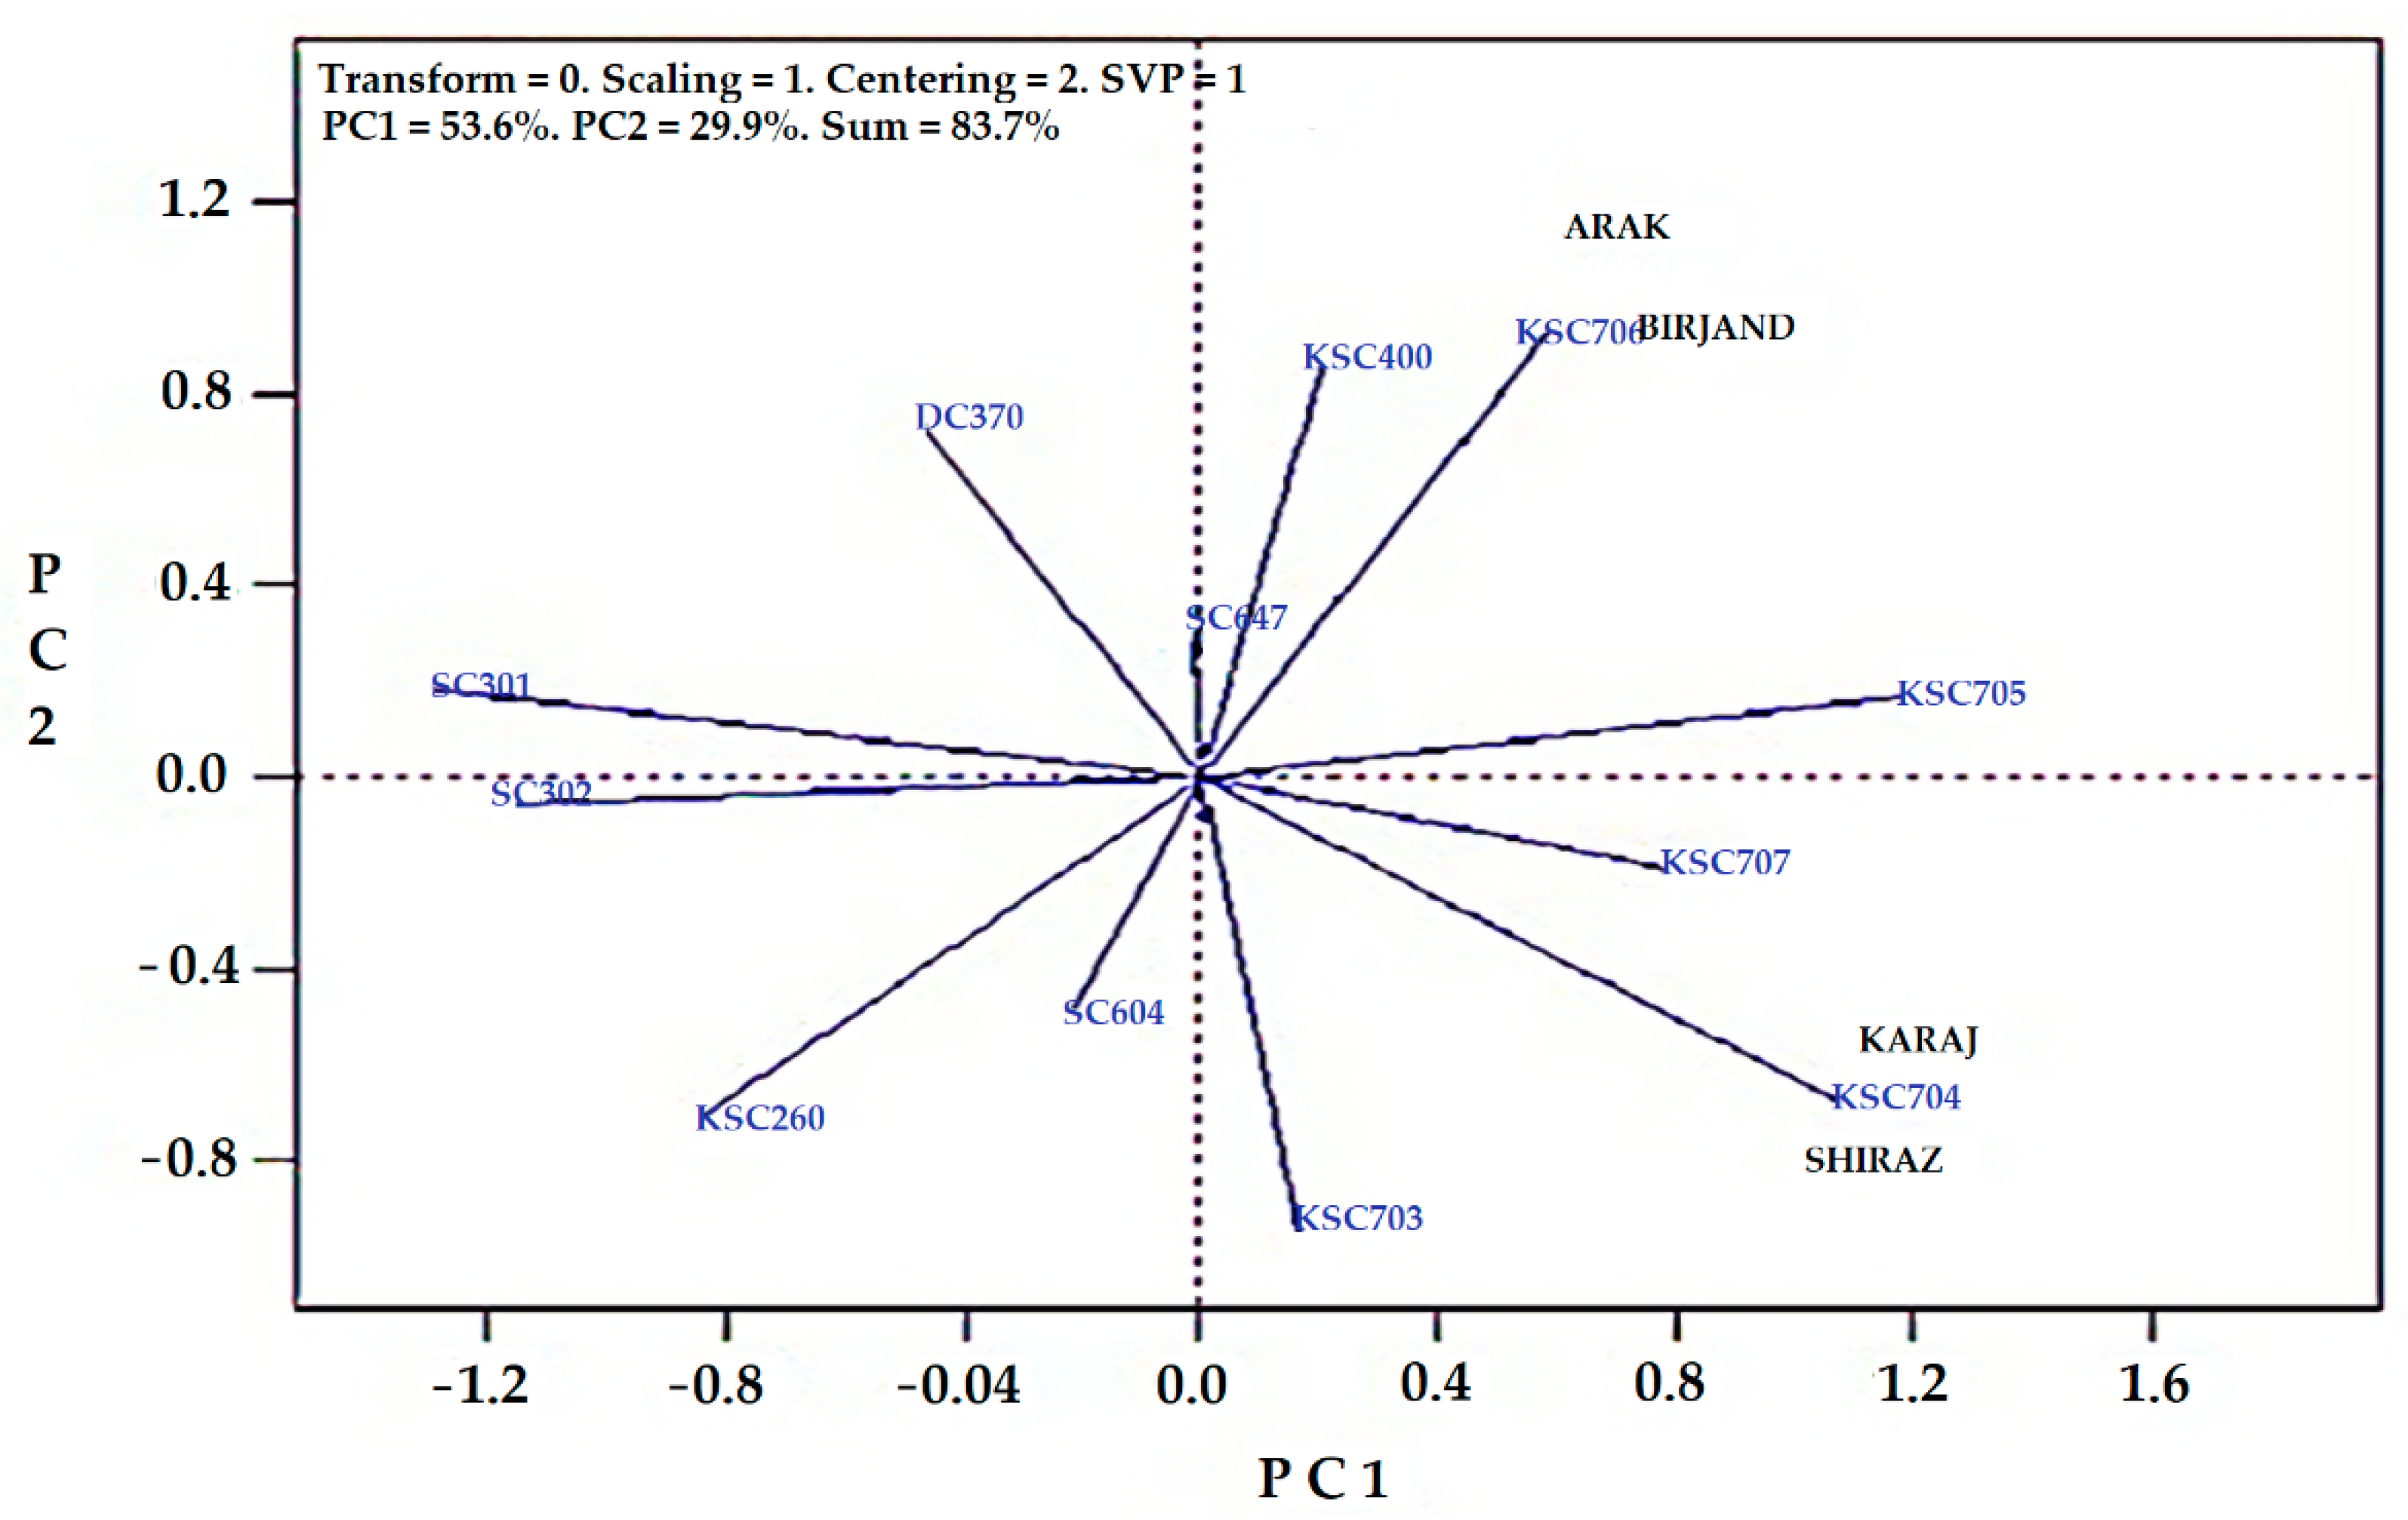
- A study of grain yield and stability of hybrids using the biplot of average environment coordinates showed that the KSC705 genotype has higher stability and grain yield than other genotypes.
- Both SC302 and SC301 genotypes had minimum stability on grain yield in this study.
- The KSC704 and KSC707 genotypes were desirable for yield in Shiraz and Karaj, and KSC706 were desirable in Arak and Birjand.
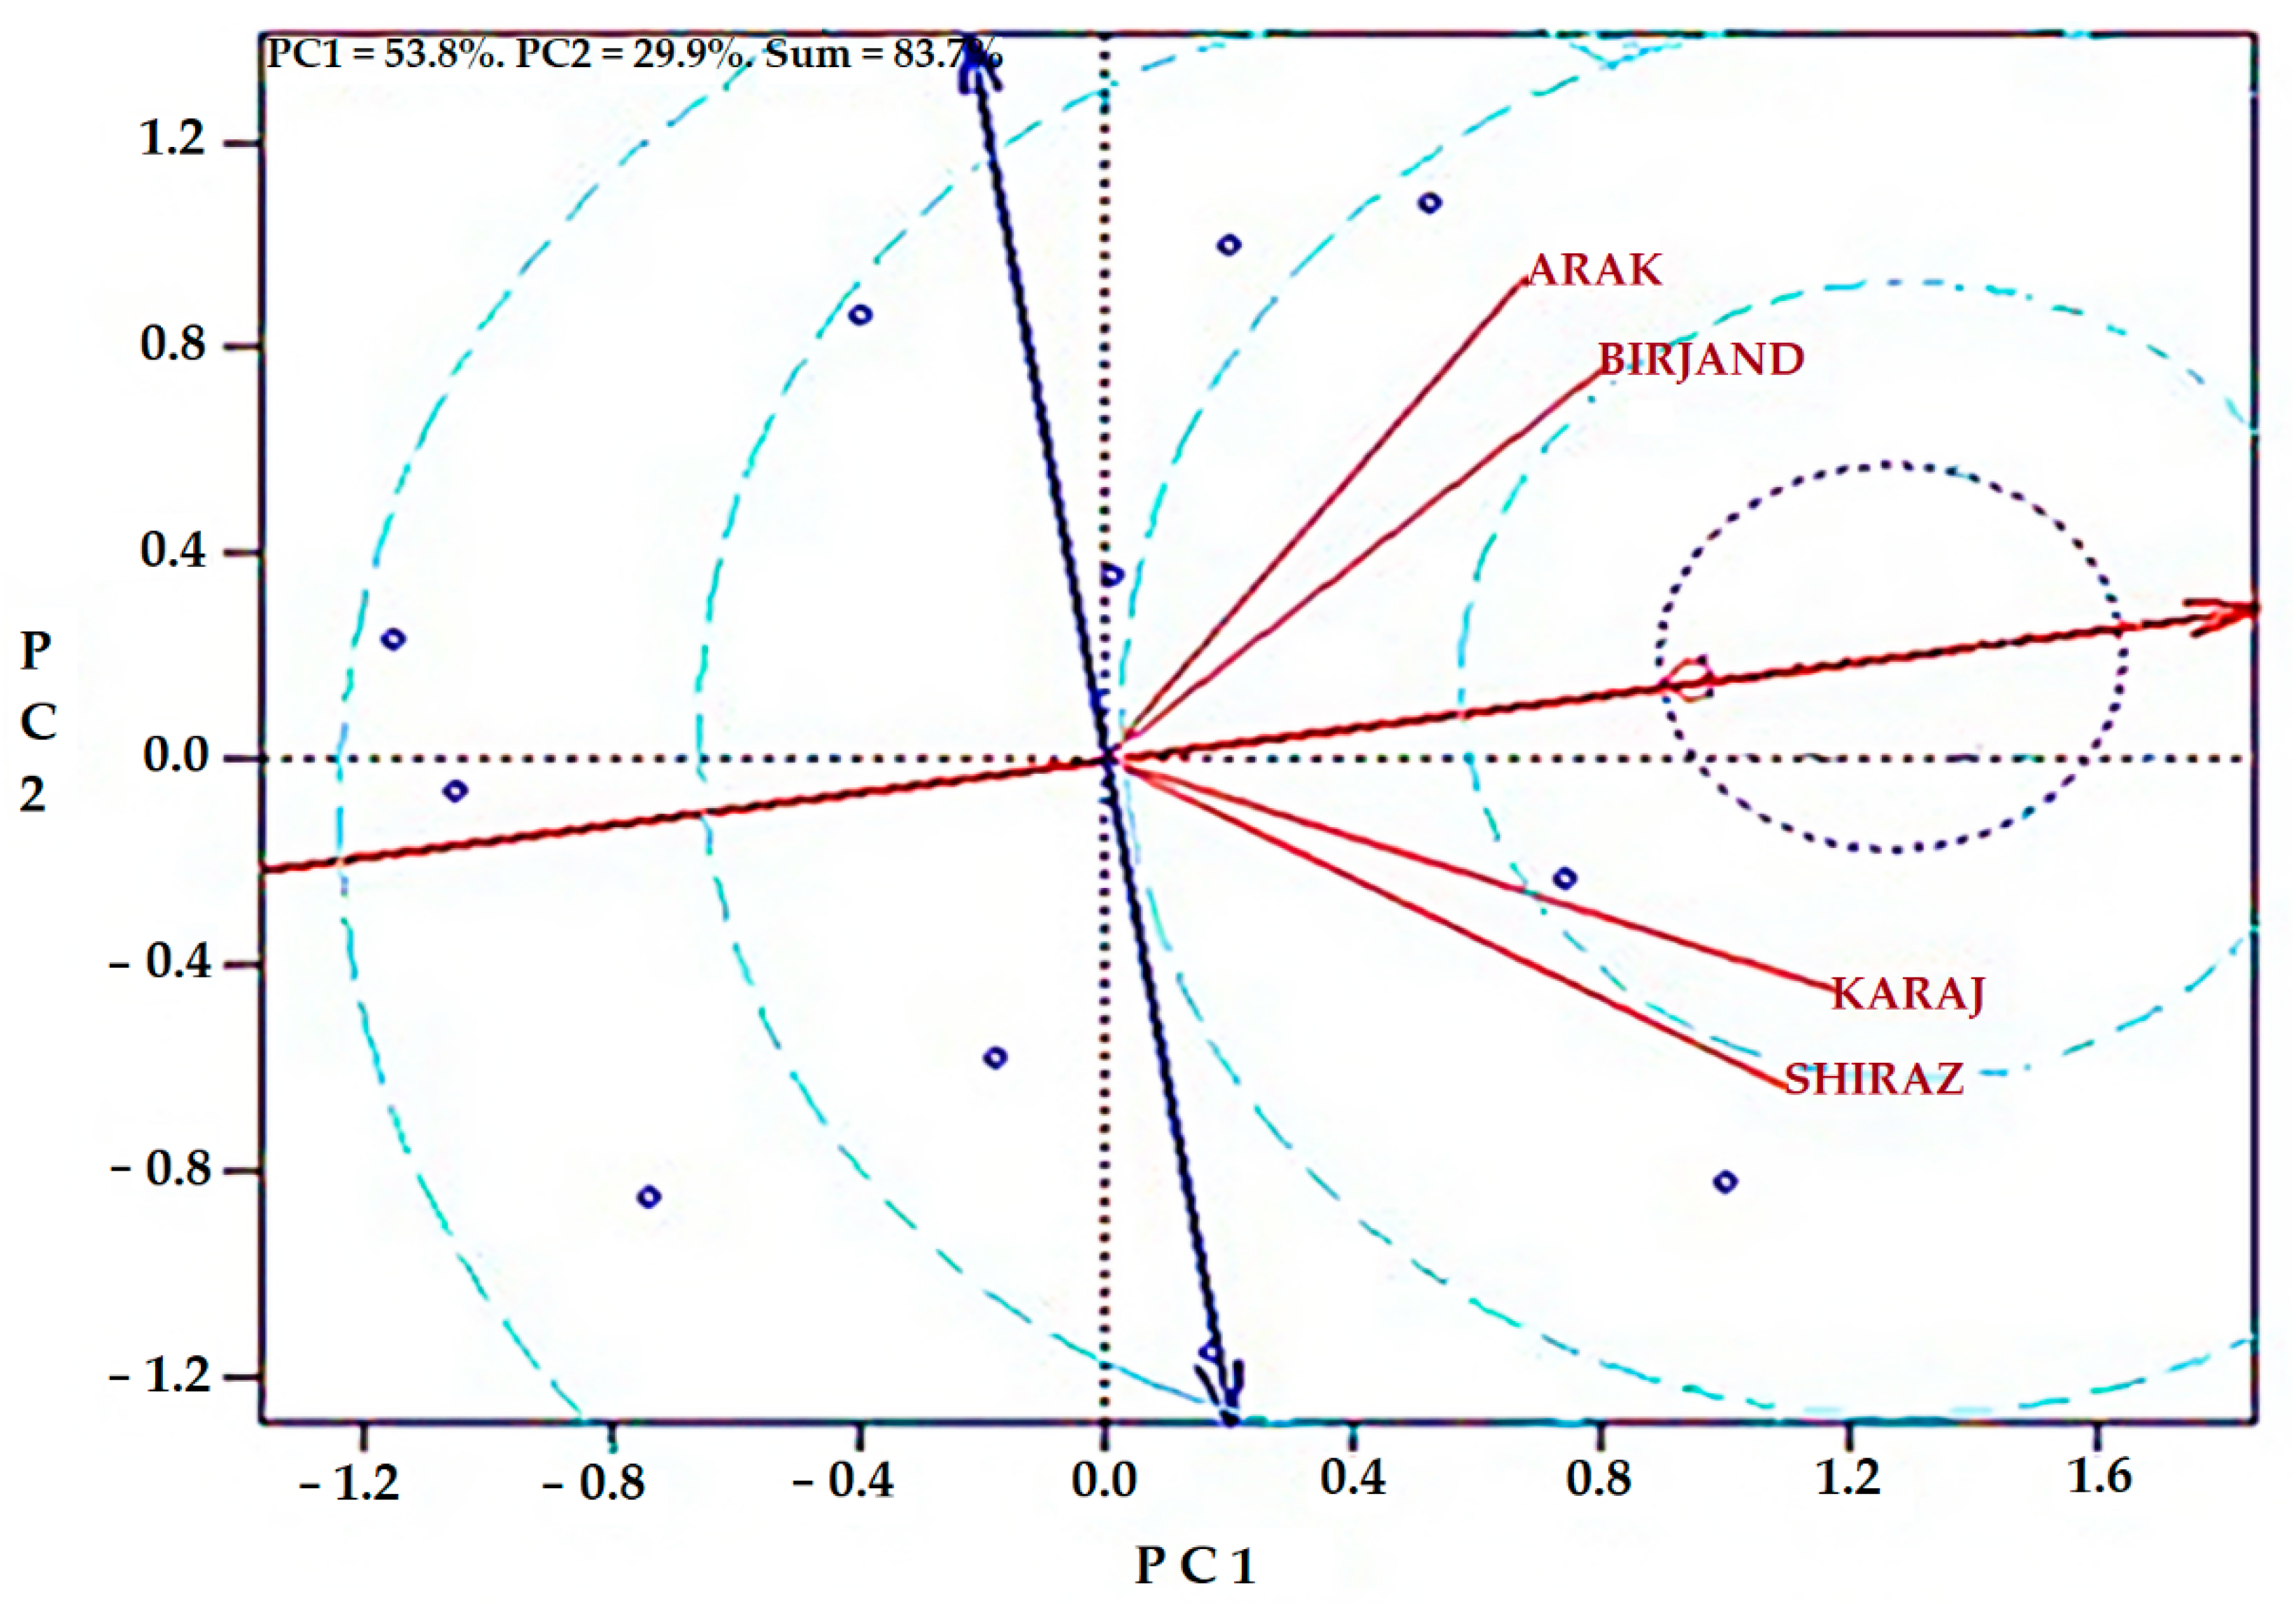
- Additionally, Arak-Birjand, Karaj-Shiraz showed a positive and significant correlation.
- Birjand and Karaj showed the highest genotype interactions with each other.
Author Contributions
Funding
Institutional Review Board Statement
Informed Consent Statement
Data Availability Statement
Conflicts of Interest
References
- FAOSTAT. Statistical Data. Food and Agriculture Organization of the United Nations, Rome. 2017. Available online: http://www.fao.org/faostat/ (accessed on 1 December 2021).
- Bao, Y.; Hoogenboom, G.; McClendon, R.; Vellidis, G. A comparison of the performance of the CSM-CERES-Maize and EPIC models using maize variety trial data. Agric. Syst. 2017, 150, 109–119. [Google Scholar] [CrossRef]
- Choukan, R.; Hosseinzadeh, A.; Ghanadha, M.R.; Taleei, A.; Mohammadi, S.A. Classification of maize inbred lines based on morphological traits. Seed Plant 2005, 9, 139–157. [Google Scholar]
- Yan, W.; Hunt, L.; Sheng, Q.; Szlavnics, Z. Cultivar Evaluation and Mega-Environment Investigation Based on the GGE Biplot. Crop Sci. 2000, 40, 597–605. [Google Scholar] [CrossRef]
- Yan, W.; Kang, M.S.; Ma, B.; Woods, S.; Cornelius, P.L. GGE biplot vs. AMMI analysis of genotype-by-environment data. Crop Sci. 2007, 47, 643–653. [Google Scholar] [CrossRef]
- Miah, M.; Ahmed, S.; Uddin, M. Assessment of yield stability of maize inbred lines in multi-environment trials. Bangladesh J. Sci. Ind. Res. 2016, 51, 61–68. [Google Scholar] [CrossRef][Green Version]
- Malosetti, M.; Ribaut, J.M.; van Eeuwijk, F.A. The statistical analysis of multi-environment data: Modeling geno-type-by-environment interaction and its genetic basis. Front. Physiol. 2013, 4, 44. [Google Scholar] [CrossRef] [PubMed]
- Muller, M.-H.; Délieux, F.; Fernández-Martínez, J.M.; Garric, B.; Lecomte, V.; Anglade, G.; Leflon, M.; Motard, C.; Segura, R. Occurrence, distribution and distinctive morphological traits of weedy Helianthus annuus L. populations in Spain and France. Genet. Resour. Crop Evol. 2009, 56, 869–877. [Google Scholar] [CrossRef]
- Akcura, M.; Kokten, K. Variations in grain mineral concentrations of Turkish wheat landraces germplasm. Qual. Assur. Saf. Crop. Foods 2017, 9, 153–159. [Google Scholar] [CrossRef]
- Rezaizad, A.; Siahbidi, A.Z.; Moradgholi, F. Stability Analysis of Oil Yield in Different Oilseed Rape (Brassica napus L.) Genotypes in Two normal and Delayed Sowing Date in Kermanshah Province. J. Crop Breed. 2018, 10, 129–137. [Google Scholar] [CrossRef][Green Version]
- Yan, W. GGEbiplot—A Windows Application for Graphical Analysis of Multienvironment Trial Data and Other Types of Two-Way Data. Agron. J. 2001, 93, 1111–1118. [Google Scholar] [CrossRef]
- Maboeta, M.S.; van Rensburg, L.; Jansen van Rensburg, P.J. Earthworm (Eisenia fetida) bioassay to assess the possible effects of platinum tailings disposal facilities on the environment along a gradient. Appl. Ecol. Environ. Res. 2008, 6, 13–19. [Google Scholar] [CrossRef]
- Dehghani, H.; Ebadi, A.; Yousefi, A. Biplot Analysis of Genotype by Environment Interaction for Barley Yield in Iran. Agron. J. 2006, 98, 388–393. [Google Scholar] [CrossRef]
- Mortazavian, S.M.M.; Nikkhah, H.R.; Hassani, F.A.; Sharif-al-Hosseini, M.; Taheri, M.; Mahlooji, M. GGE biplot and AMMI analysis of yield performance of barley genotypes across different environments in Iran. J. Agric. Sci. Technol. 2014, 16, 609–622. [Google Scholar]
- Changizi, M.; Choukan, R.; Heravan, E.M.; Bihamta, M.R.; Darvish, F. Evaluation of genotype× environment interaction and stability of corn hybrids and relationship among univariate parametric methods. Can. J. Plant Sci. 2014, 94, 1255–1267. [Google Scholar] [CrossRef]
- Choukan, R. Genotype, environment and genotype× environment interaction effects on the performance of maize (Zea mays L.) inbred lines. Crop Breed. J. 2011, 1, 97–103. [Google Scholar]
- Fan, X.; Kang, M.S.; Chen, H.; Zhang, Y.; Tan, J.; Xu, C. Yield Stability of Maize Hybrids Evaluated in Multi-Environment Trials in Yunnan, China. Agron. J. 2007, 99, 220–228. [Google Scholar] [CrossRef]
- Mohammed, A. Genotype by environment interaction and yield stability analysis of open pollinated maize varieties using AMMI model in Afar Regional State, Ethiopia. J. Plant Breed. Crop Sci. 2020, 12, 8–15. [Google Scholar] [CrossRef]
- Mousavi, S.M.N.; Bojtor, C.; Illés, Á.; Nagy, J. Genotype by Trait Interaction (GT) in Maize Hybrids on Complete Fertilizer. Plants 2021, 10, 2388. [Google Scholar] [CrossRef]
- Shojaei, S.H.; Mostafavi, K.; Lak, A.; Omrani, A.; Omrani, S.; Mousavi, S.M.N.; Illés, Á.; Bojtor, C.; Nagy, J. Evaluation of stability in maize hybrids using univariate parametric methods. J. Crop Sci. Biotechnol. 2021, 9, 1–8. [Google Scholar] [CrossRef]
- Mousavi, S.M.N.; Illés, Á.; Bojtor, C.; Nagy, J. The impact of different nutritional treatments on maize hybrids morpho-logical traits based on stability statistical methods. Emir. J. Food Agric. 2020, 9, 666–672. [Google Scholar] [CrossRef]
- Bojtor, C.; Mousavi, S.M.N.; Illés, Á.; Széles, A.; Nagy, J.; Marton, C.L. Stability and Adaptability of Maize Hybrids for Precision Crop Production in a Long-Term Field Experiment in Hungary. Agronomy 2021, 11, 2167. [Google Scholar] [CrossRef]
- Jahanbakhshi, A.; Yeganeh, R.; Momeny, M. Influence of ultrasound pre-treatment and temperature on the quality and thermodynamic properties in the drying process of nectarine slices in a hot air dryer. J. Food Process. Preserv. 2020, 44, e14818. [Google Scholar] [CrossRef]
- Illés, Á.; Bojtor, C.; Szeles, A.; Mousavi, S.M.N.; Toth, B.; Nagy, J. Analyzing the effect of intensive and low-input agro-technical support for the physiological, phenometric, and yield parameters of different maize hybrids using multivariate statistical methods. Int. J. Agron. 2021, 2, 11. [Google Scholar]
- Ma, B.L.; Yan, W.; Dwyer, L.M.; Frégeau-Reid, J.; Voldeng, H.D.; Dion, Y.; Nass, H. Graphic Analysis of Genotype, Environment, Nitrogen Fertilizer, and Their Interactions on Spring Wheat Yield. Agron. J. 2004, 96, 169–180. [Google Scholar] [CrossRef]
- Mafouasson, H.N.A.; Gracen, V.; Yeboah, M.A.; Ntsomboh-Ntsefong, G.; Tandzi, L.N.; Mutengwa, C.S. Geno-type-by-environment interaction and yield stability of maize single cross hybrids developed from tropical inbred lines. Agronomy 2018, 8, 62. [Google Scholar] [CrossRef]
- Luo, J.; Pan, Y.-B.; Que, Y.; Zhang, H.; Grisham, M.P.; Xu, L. Biplot evaluation of test environments and identification of mega-environment for sugarcane cultivars in China. Sci. Rep. 2015, 5, 15505. [Google Scholar] [CrossRef] [PubMed]
- Yan, W.; Tinker, N.A. Biplot analysis of multi-environment trial data: Principles and applications. Can. J. Plant Sci. 2006, 86, 623–645. [Google Scholar] [CrossRef]
- Arshadi, A.; Karami, E.; Sartip, A.; Zare, M.; Rezabakhsh, P. Genotypes performance in relation to drought tolerance in barley using multi-environment trials. Agron. Res. 2018, 16, 5–21. [Google Scholar] [CrossRef]
- Yan, W.; Kang, M.S. GGE Biplot Analysis: A Graphical Tool for Breeders, Geneticists, and Agronomists; CRC Press: Boca Raton, FL, USA, 2002. [Google Scholar]
- Kaya, Y.; Akçura, M.; Taner, S. GGE-biplot analysis of multi-environment yield trials in bread wheat. Turk. J. Agric. For. 2006, 30, 325–337. [Google Scholar]
- Li, Z.; Coffey, L.; Garfin, J.; Miller, N.D.; White, M.R.; Spalding, E.P.; Hirsch, C.N. Genotype-by-environment interactions affecting heterosis in maize. PLoS ONE 2018, 13, e0191321. [Google Scholar] [CrossRef]
- Kendal, E.; Tekdal, S.; Karaman, M. Proficiency of Biplot Methods (AMMI and GGE) in the Appraisal of Triticale Genotypes in Multiple Environments. Appl. Ecol. Environ. Res. 2019, 17, 5995–6007. [Google Scholar] [CrossRef]
- Aktas, B.; Ure, T. Evaluation of multi-environment grain yield trials in maize hybrids by GGE-Biplot analysis method. Maydica 2021, 65, 9. [Google Scholar]
- Al-Naggar, A.M.M.; Shafik, M.M.; Musa, R.Y.M. Genetic Diversity Based on Morphological Traits of 19 Maize Genotypes Using Principal Component Analysis and GT Biplot. Annu. Res. Rev. Biol. 2020, 7, 68–85. [Google Scholar] [CrossRef]


| Area | Longitude | Latitude | Elevation AMSL (m) | Average Rainfall (mm) |
|---|---|---|---|---|
| Karaj | 50°54′ E | 35°55′ N | 1312 | 247.3 |
| Birjand | 59°12′ E | 32°52′ N | 1491 | 171 |
| Shiraz | 52°36′ E | 29°32′ N | 1484 | 324.2 |
| Arak | 49°46′ E | 34°06′ N | 1708 | 341.7 |
| Genotype No. | Genotype | Genotype No. | Genotype |
|---|---|---|---|
| G1 | KSC703 | G7 | KSC707 |
| G2 | KSC260 | G8 | DC370 |
| G3 | KSC705 | G9 | SC647 |
| G4 | KSC400 | G10 | SC302 |
| G5 | KSC706 | G11 | SC604 |
| G6 | KSC704 | G12 | SC301 |
| Region | EC(ds/m) | Acidity | Lime (%) | Organic Carbon (%) | Organic Materials (%) | Clay (%) | Silt (%) | Sand (%) |
|---|---|---|---|---|---|---|---|---|
| Karaj | 0.20 | 8.2 | 7 | 32 | 45 | 32 | 25 | 22 |
| Birjand | 0.46 | 7.08 | 15 | 17 | 29 | 10 | 42 | 42 |
| Shiraz | 0.75 | 7.8 | 4 | 21 | 25 | 41 | 31 | 46.1 |
| Arak | 2.9 | 8 | 9 | 23 | 12 | 23 | 21 | 38 |
| Source of Variation | DF | Sum of Square | Mean Square | Percent of Total Variation |
|---|---|---|---|---|
| Environment (E) | 3 | 98.7251194 | 32.9083731 | <0.0001 |
| Year (Y) | 1 | 24.4766722 | 24.4766722 | <0.0001 |
| Environment × Year | 3 | 8.1064361 | 2.7021454 | 0.0164 |
| Genotype (G) | 11 | 172.2179778 | 15.6561798 | <0.0001 |
| Error1 | 16 | 105.436131 | 3.195034 | -- |
| Genotype × Environment (GE) | 33 | 145.5750139 | 4.4113641 | <0.0001 |
| Year × Genotype | 11 | 59.2709611 | 5.3882692 | <0.0001 |
| Location × Year × Genotype | 33 | 105.4361306 | 3.1950343 | <0.0001 |
| Error | 176 | 146.396370 | 0.770507 | -- |
| CV (%) | 18.24 | |||
Publisher’s Note: MDPI stays neutral with regard to jurisdictional claims in published maps and institutional affiliations. |
© 2022 by the authors. Licensee MDPI, Basel, Switzerland. This article is an open access article distributed under the terms and conditions of the Creative Commons Attribution (CC BY) license (https://creativecommons.org/licenses/by/4.0/).
Share and Cite
Shojaei, S.H.; Mostafavi, K.; Bihamta, M.R.; Omrani, A.; Mousavi, S.M.N.; Illés, Á.; Bojtor, C.; Nagy, J. Stability on Maize Hybrids Based on GGE Biplot Graphical Technique. Agronomy 2022, 12, 394. https://doi.org/10.3390/agronomy12020394
Shojaei SH, Mostafavi K, Bihamta MR, Omrani A, Mousavi SMN, Illés Á, Bojtor C, Nagy J. Stability on Maize Hybrids Based on GGE Biplot Graphical Technique. Agronomy. 2022; 12(2):394. https://doi.org/10.3390/agronomy12020394
Chicago/Turabian StyleShojaei, Seyed Habib, Khodadad Mostafavi, Mohammad Reza Bihamta, Ali Omrani, Seyed Mohammad Nasir Mousavi, Árpád Illés, Csaba Bojtor, and Janos Nagy. 2022. "Stability on Maize Hybrids Based on GGE Biplot Graphical Technique" Agronomy 12, no. 2: 394. https://doi.org/10.3390/agronomy12020394
APA StyleShojaei, S. H., Mostafavi, K., Bihamta, M. R., Omrani, A., Mousavi, S. M. N., Illés, Á., Bojtor, C., & Nagy, J. (2022). Stability on Maize Hybrids Based on GGE Biplot Graphical Technique. Agronomy, 12(2), 394. https://doi.org/10.3390/agronomy12020394