
Spatial Variability of Soil Properties and Its Effect on Maize Yields within Field—A Case Study in Hungary

 ,
,
Abstract
:1. Introduction
2. Materials and Methods
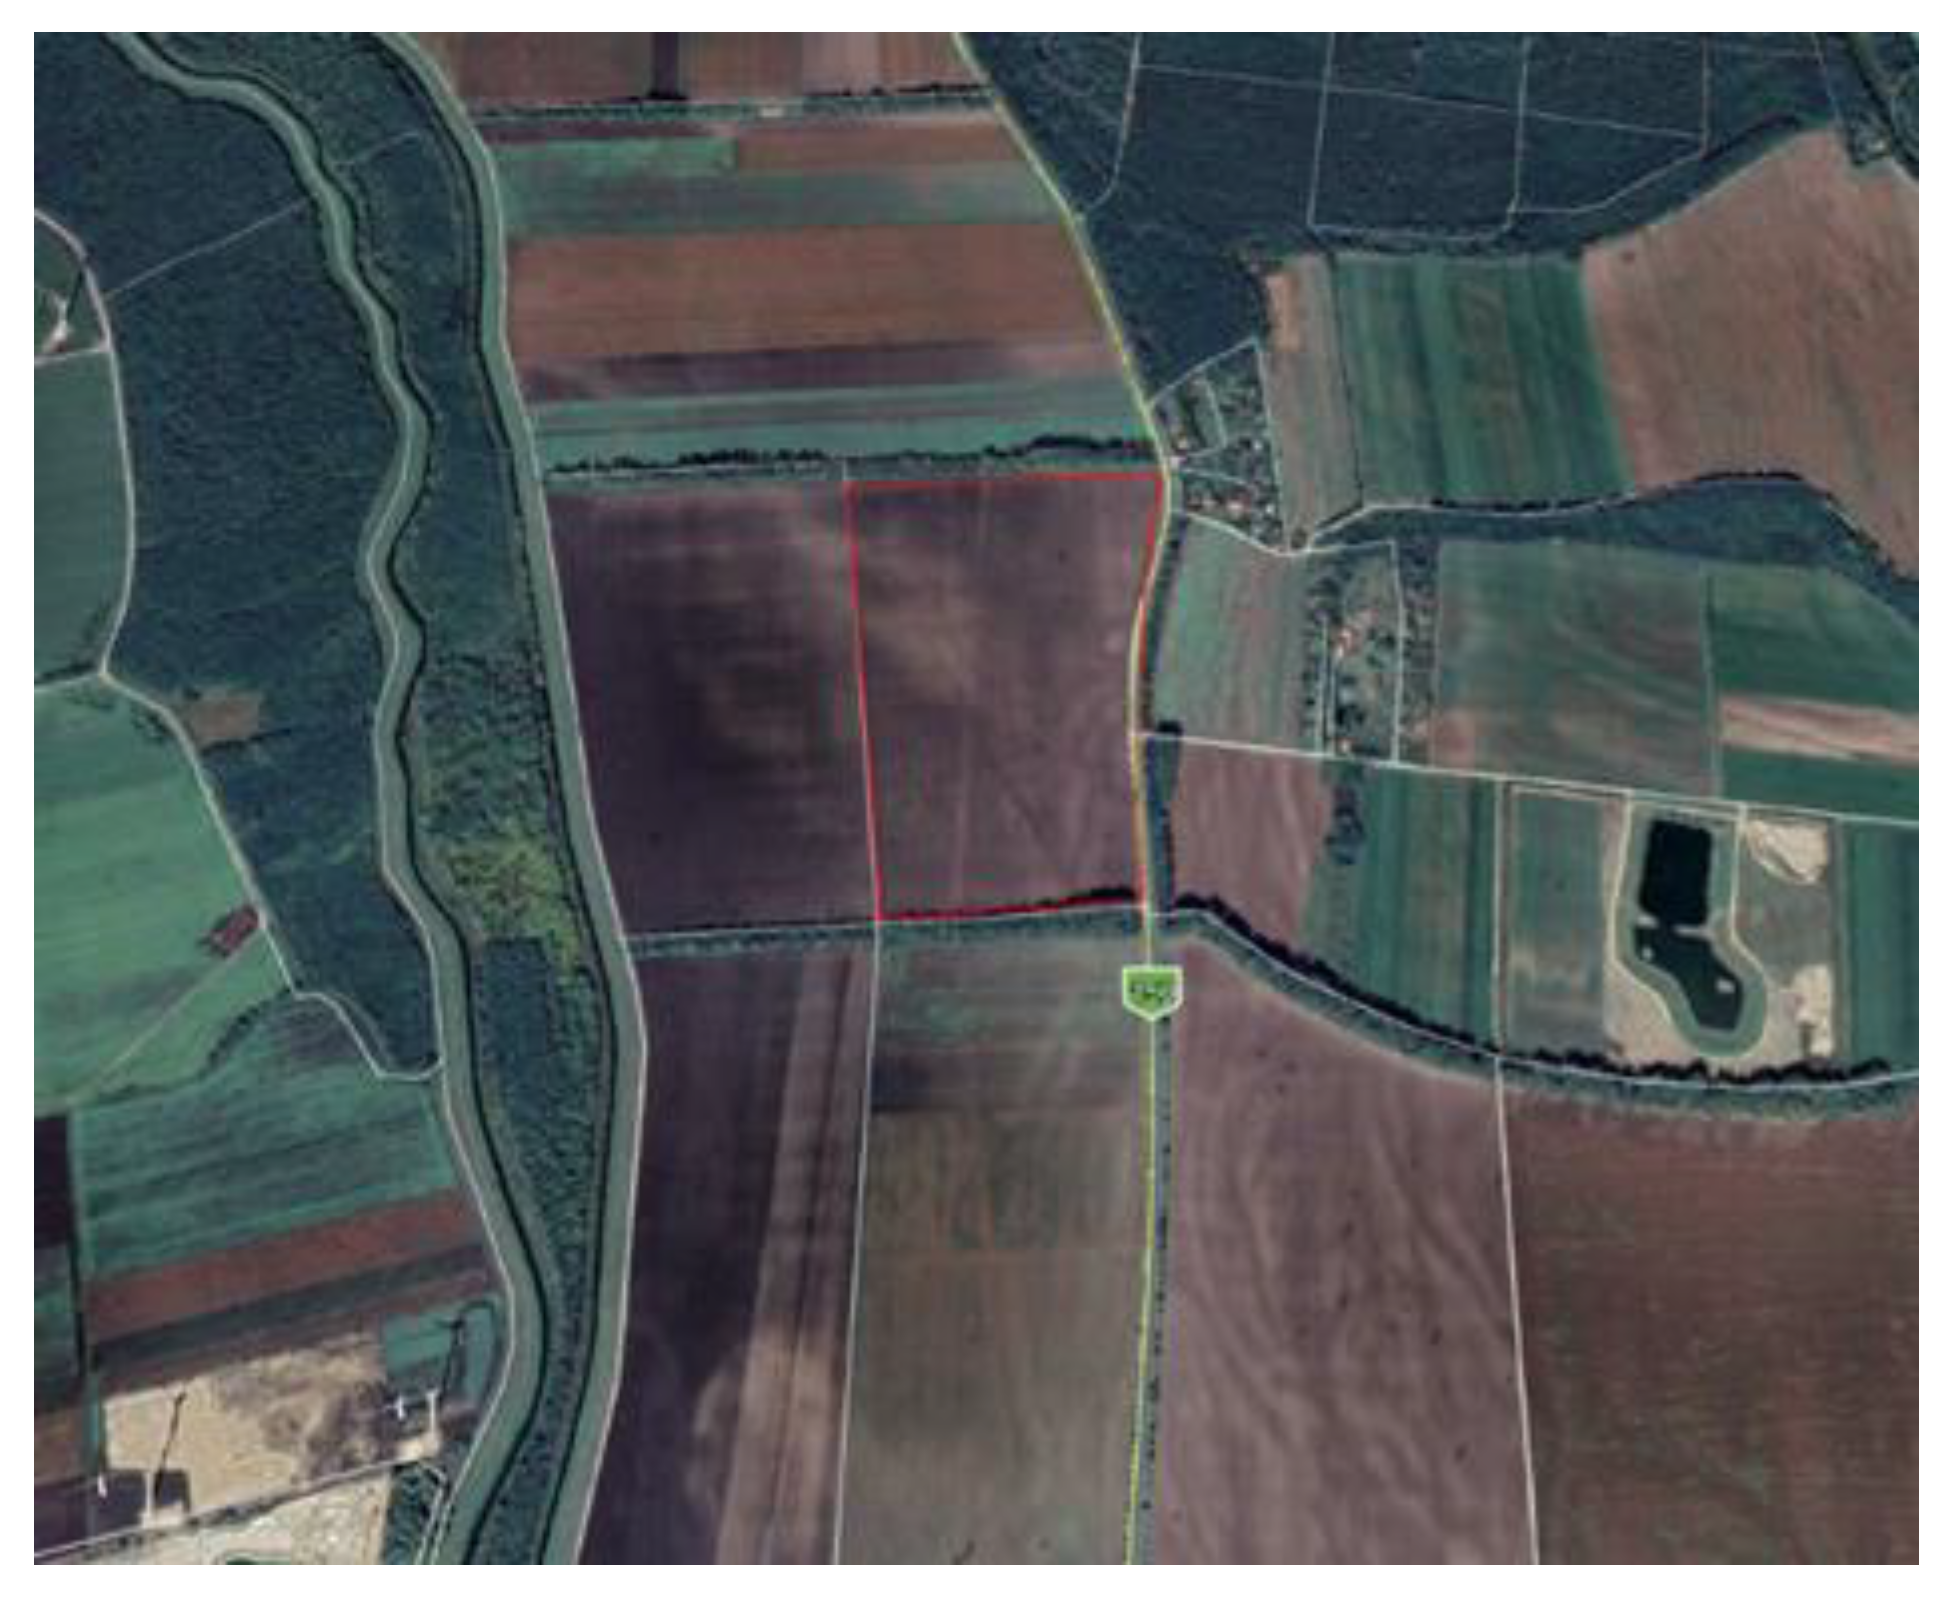
2.1. Study Area
2.2. Soil Sampling, Site-Specific Measurements and Remotely Sensed Crop Data
2.3. Weather, Meteorological Data
2.4. Dataset Definition and Statistical Analysis
3. Results and Discussion
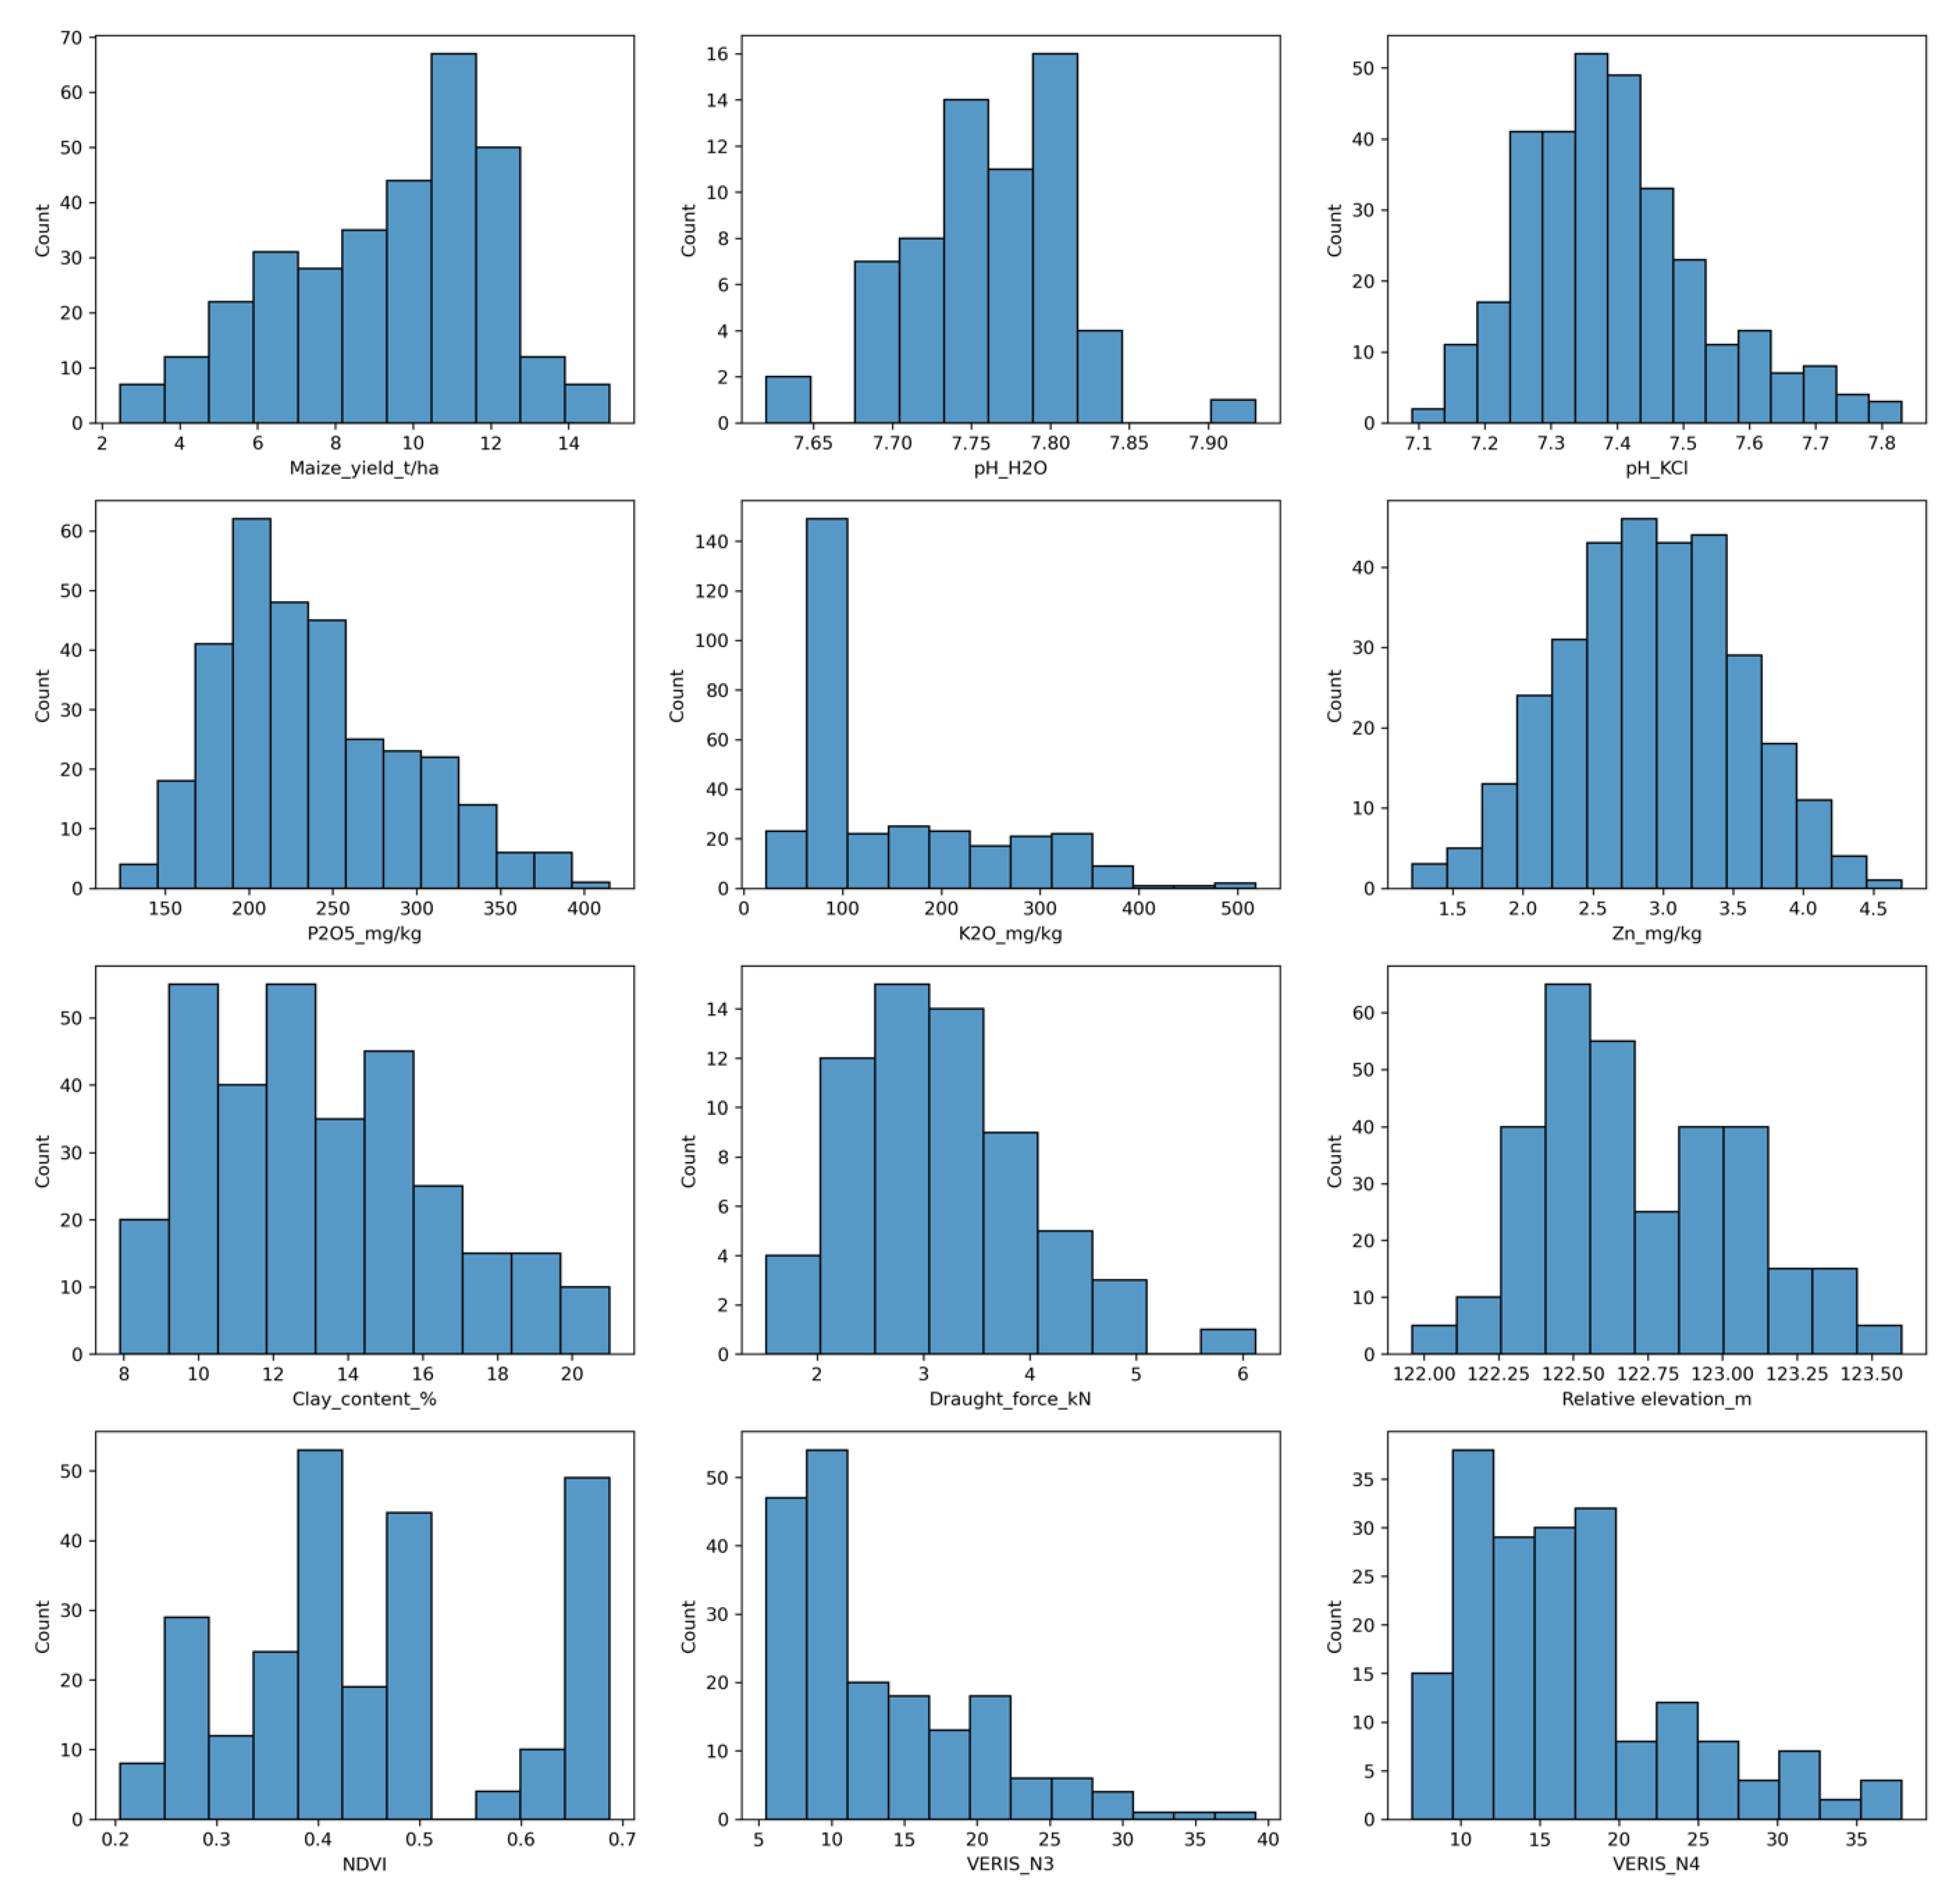
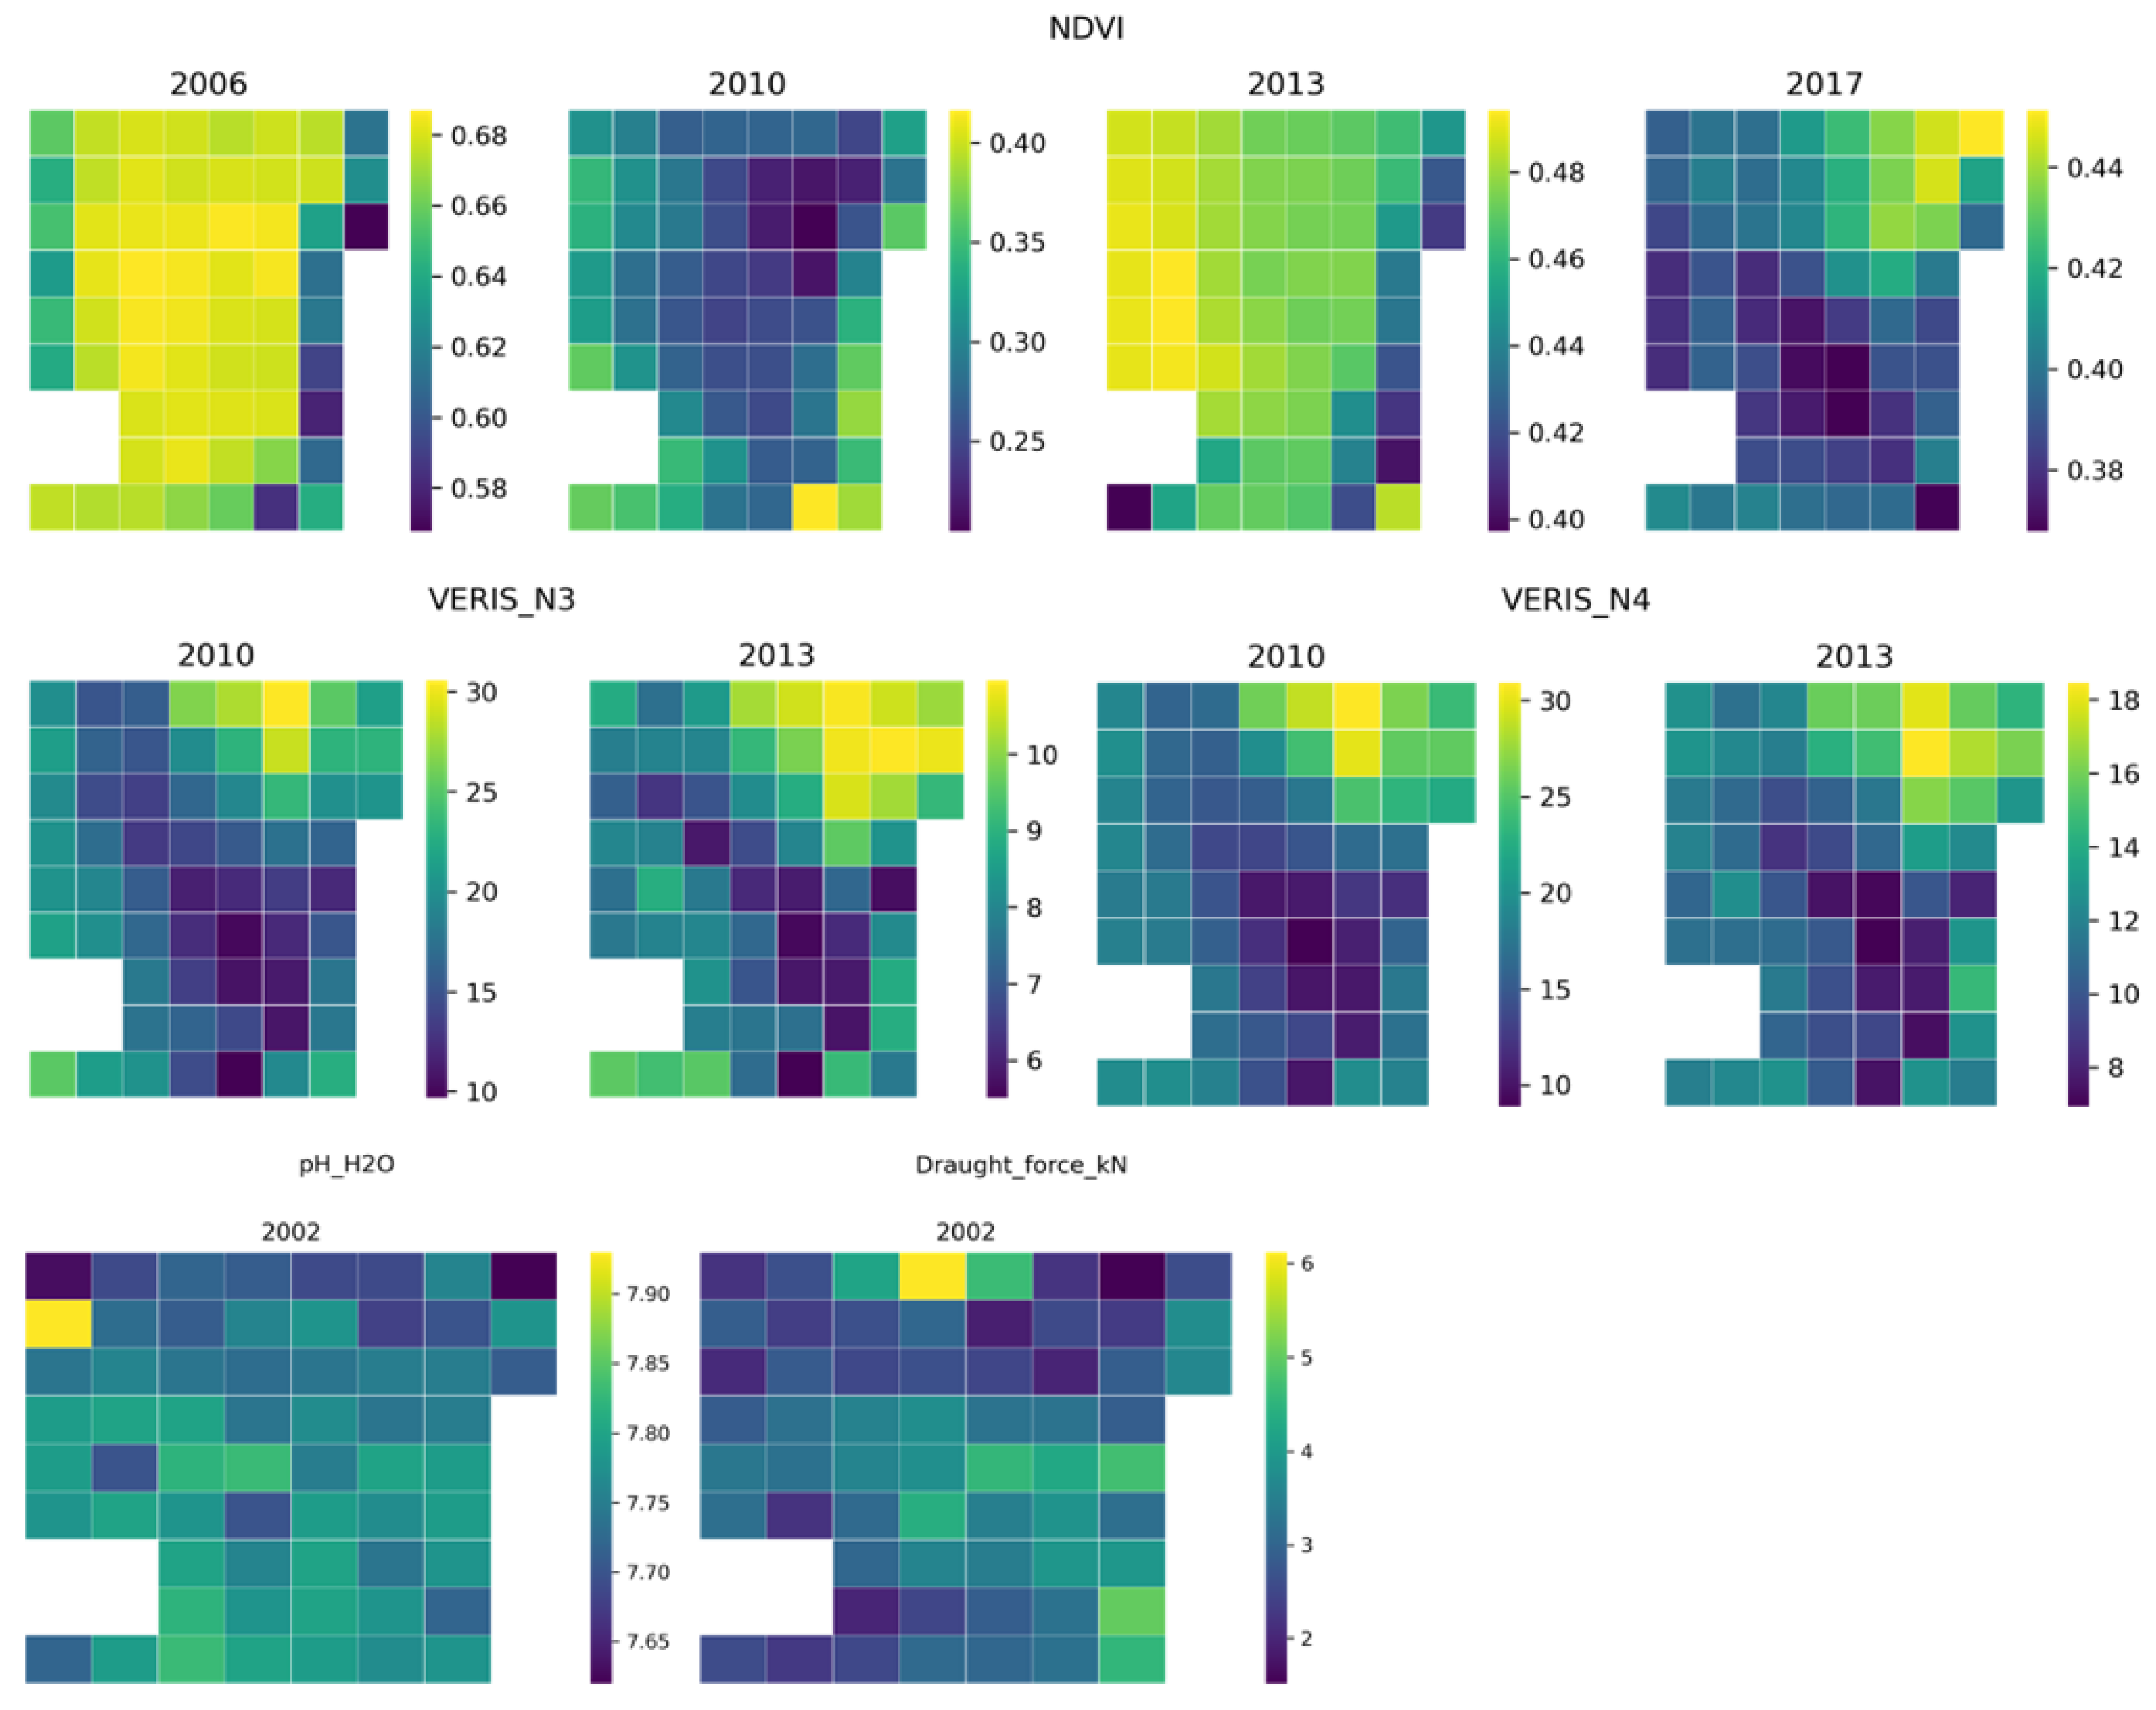
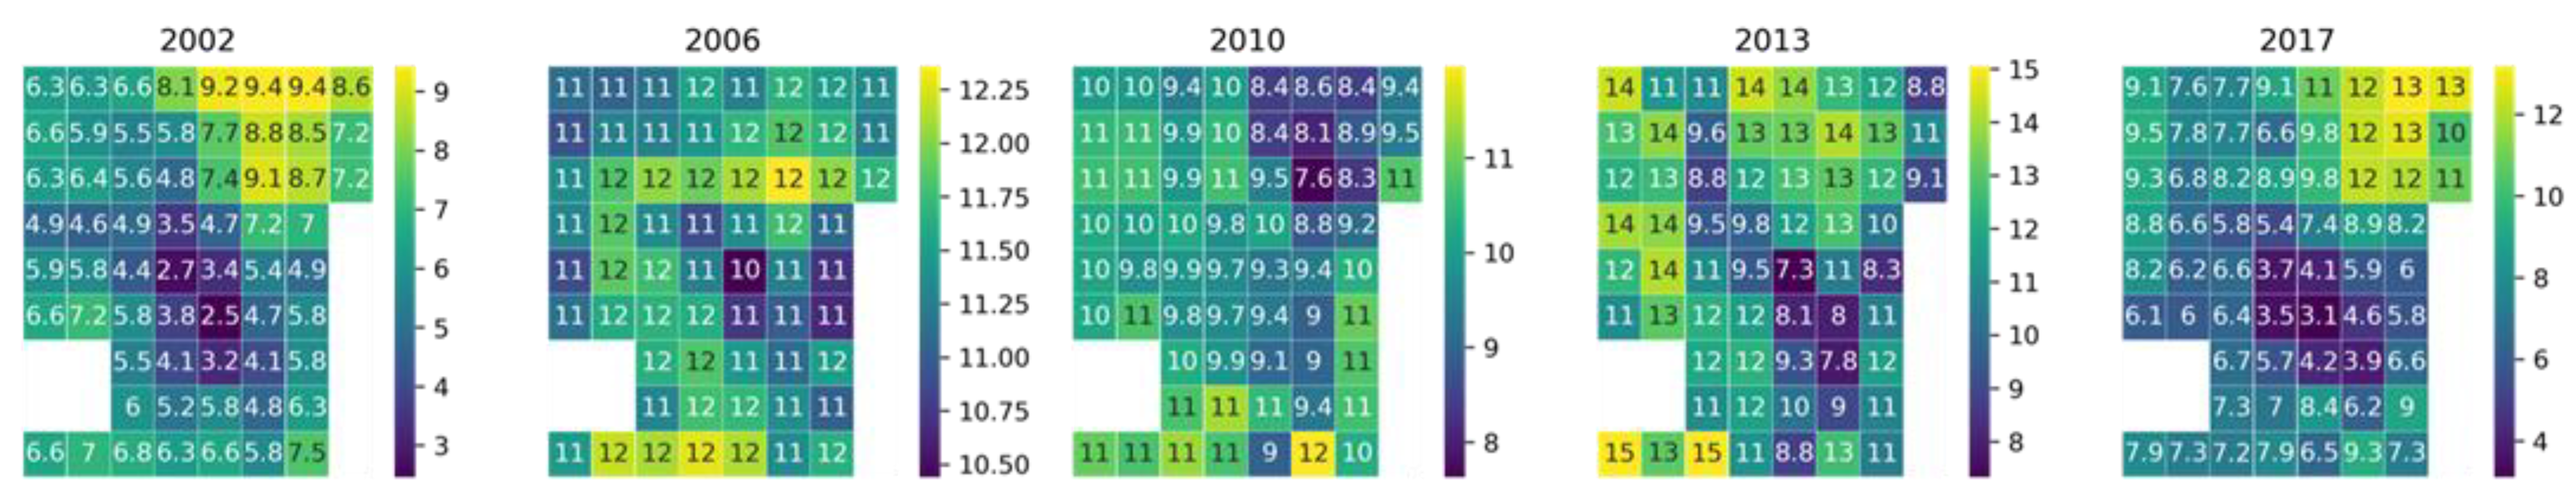
3.1. Basic Statistics-Spatial Variability of Maize Yields, Soil Properties, Electrical Conductivity, and Vegetation Indices
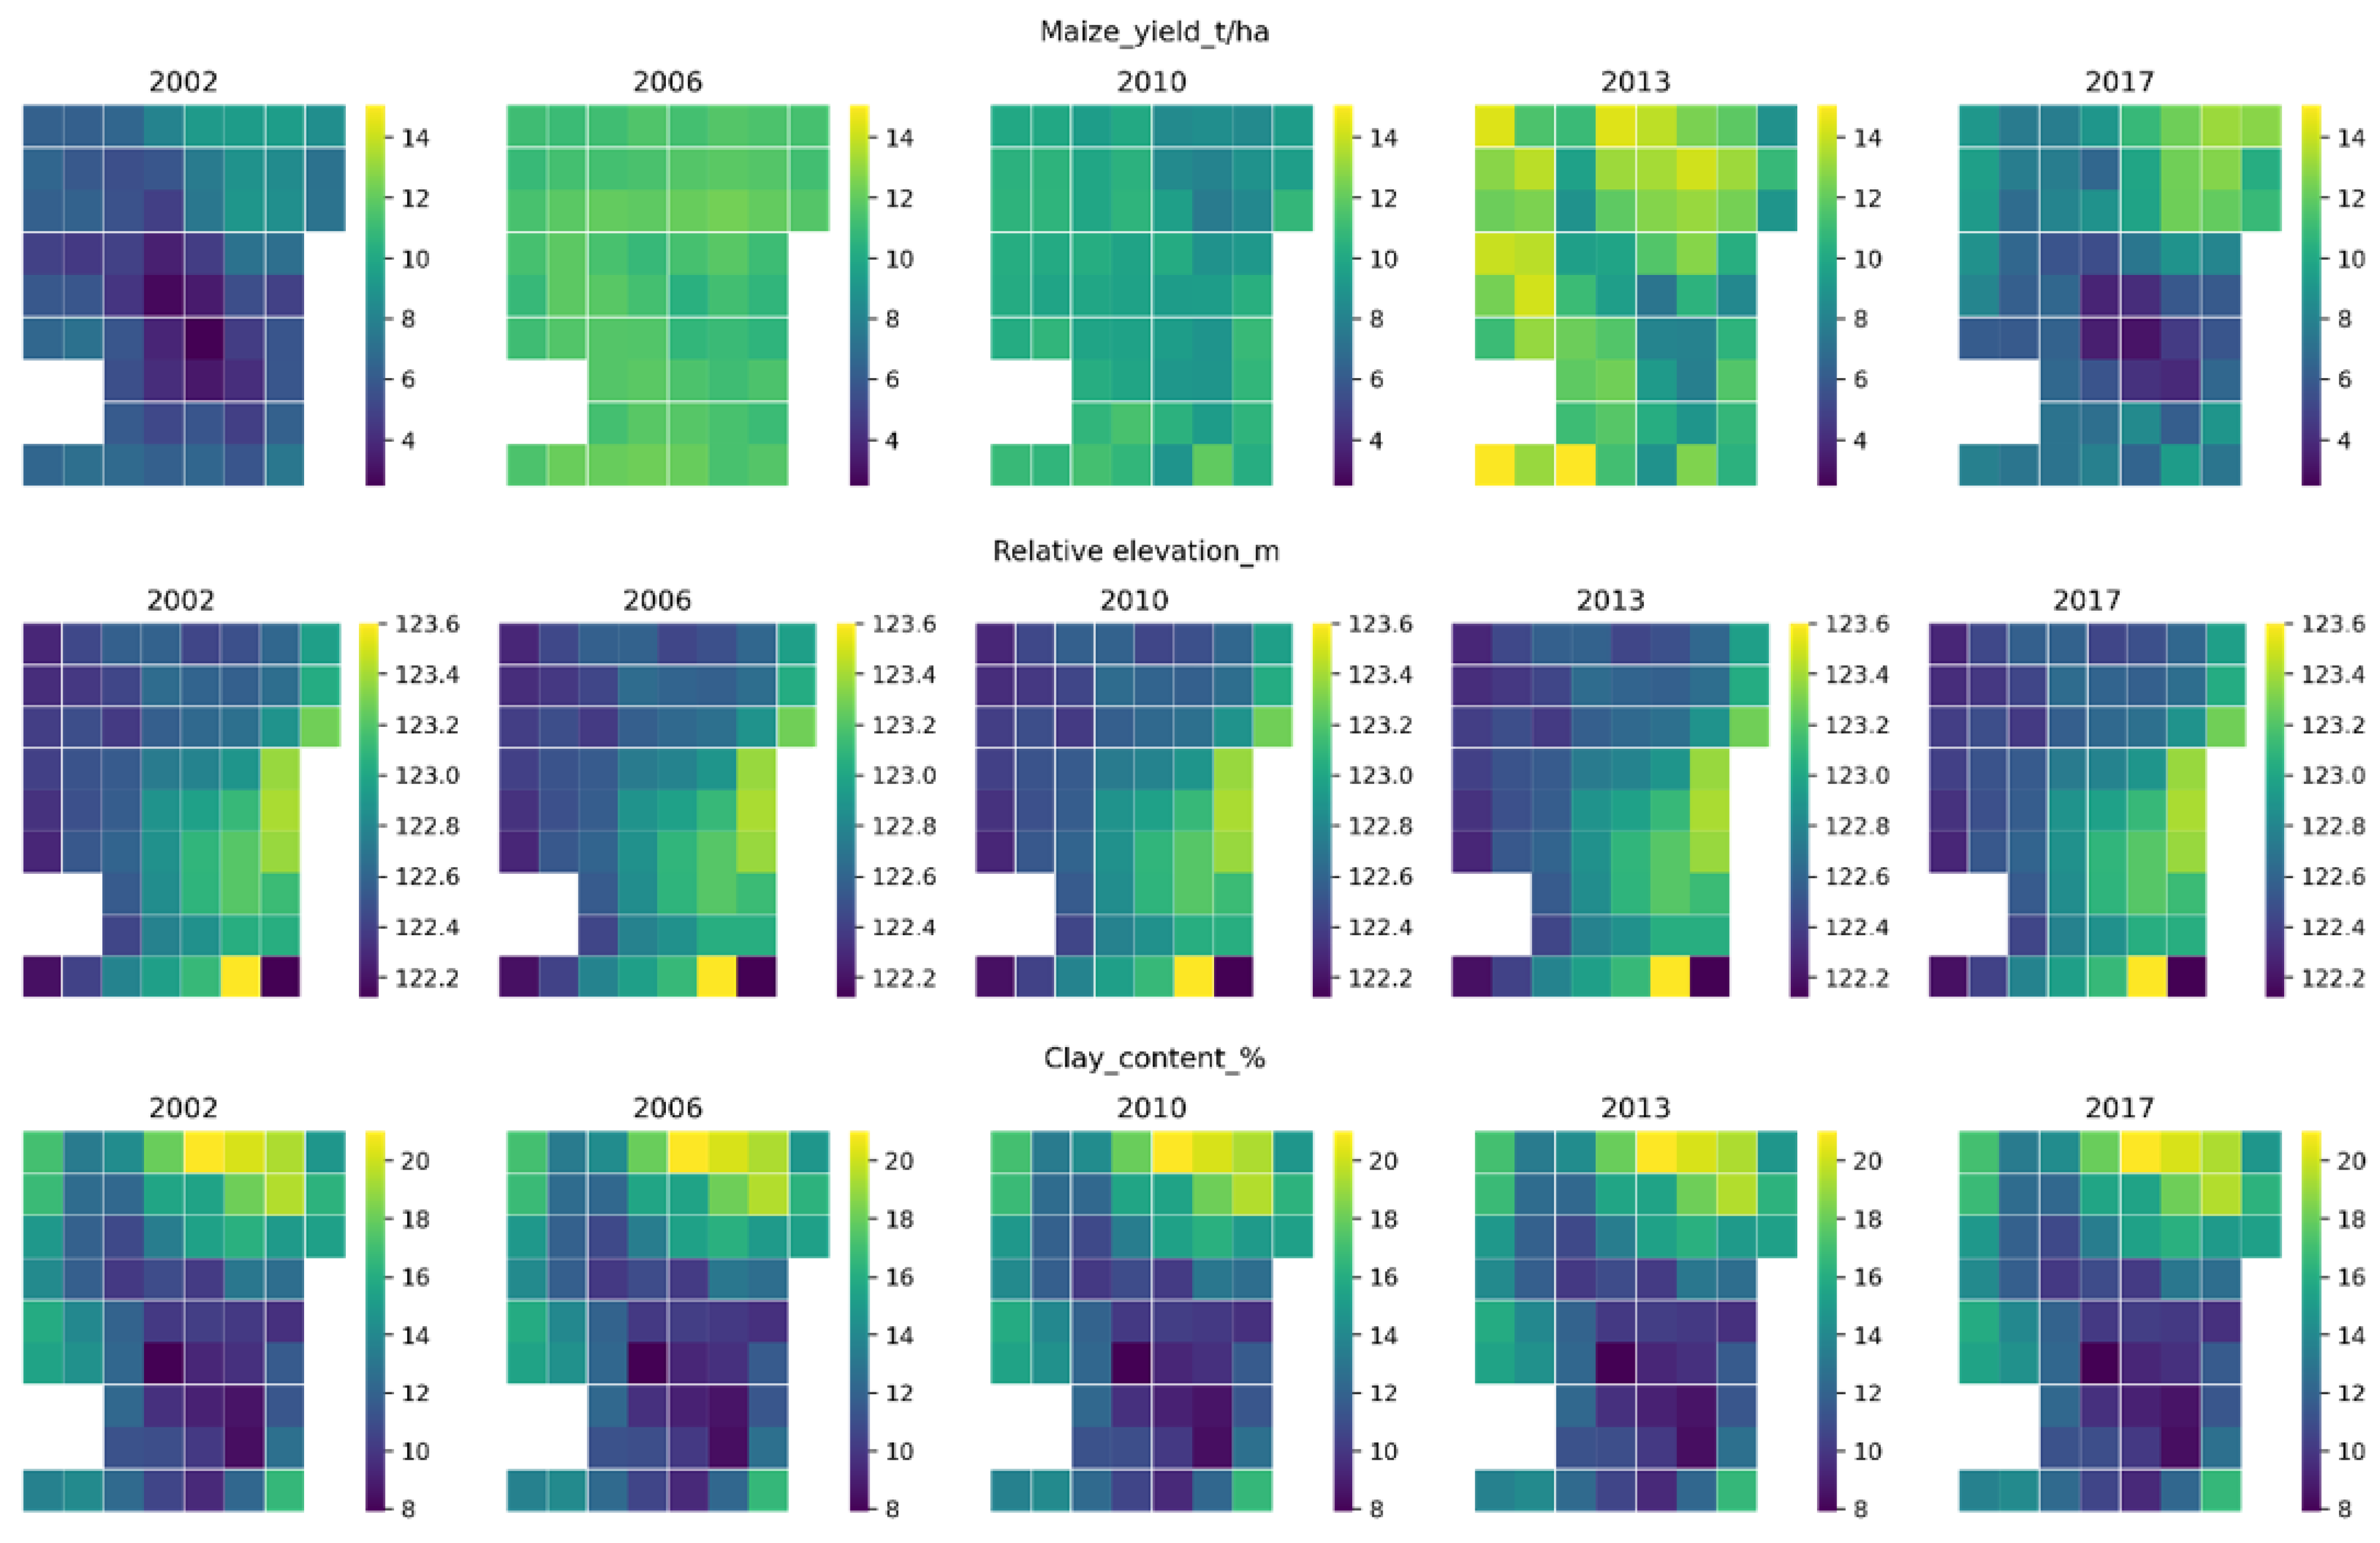
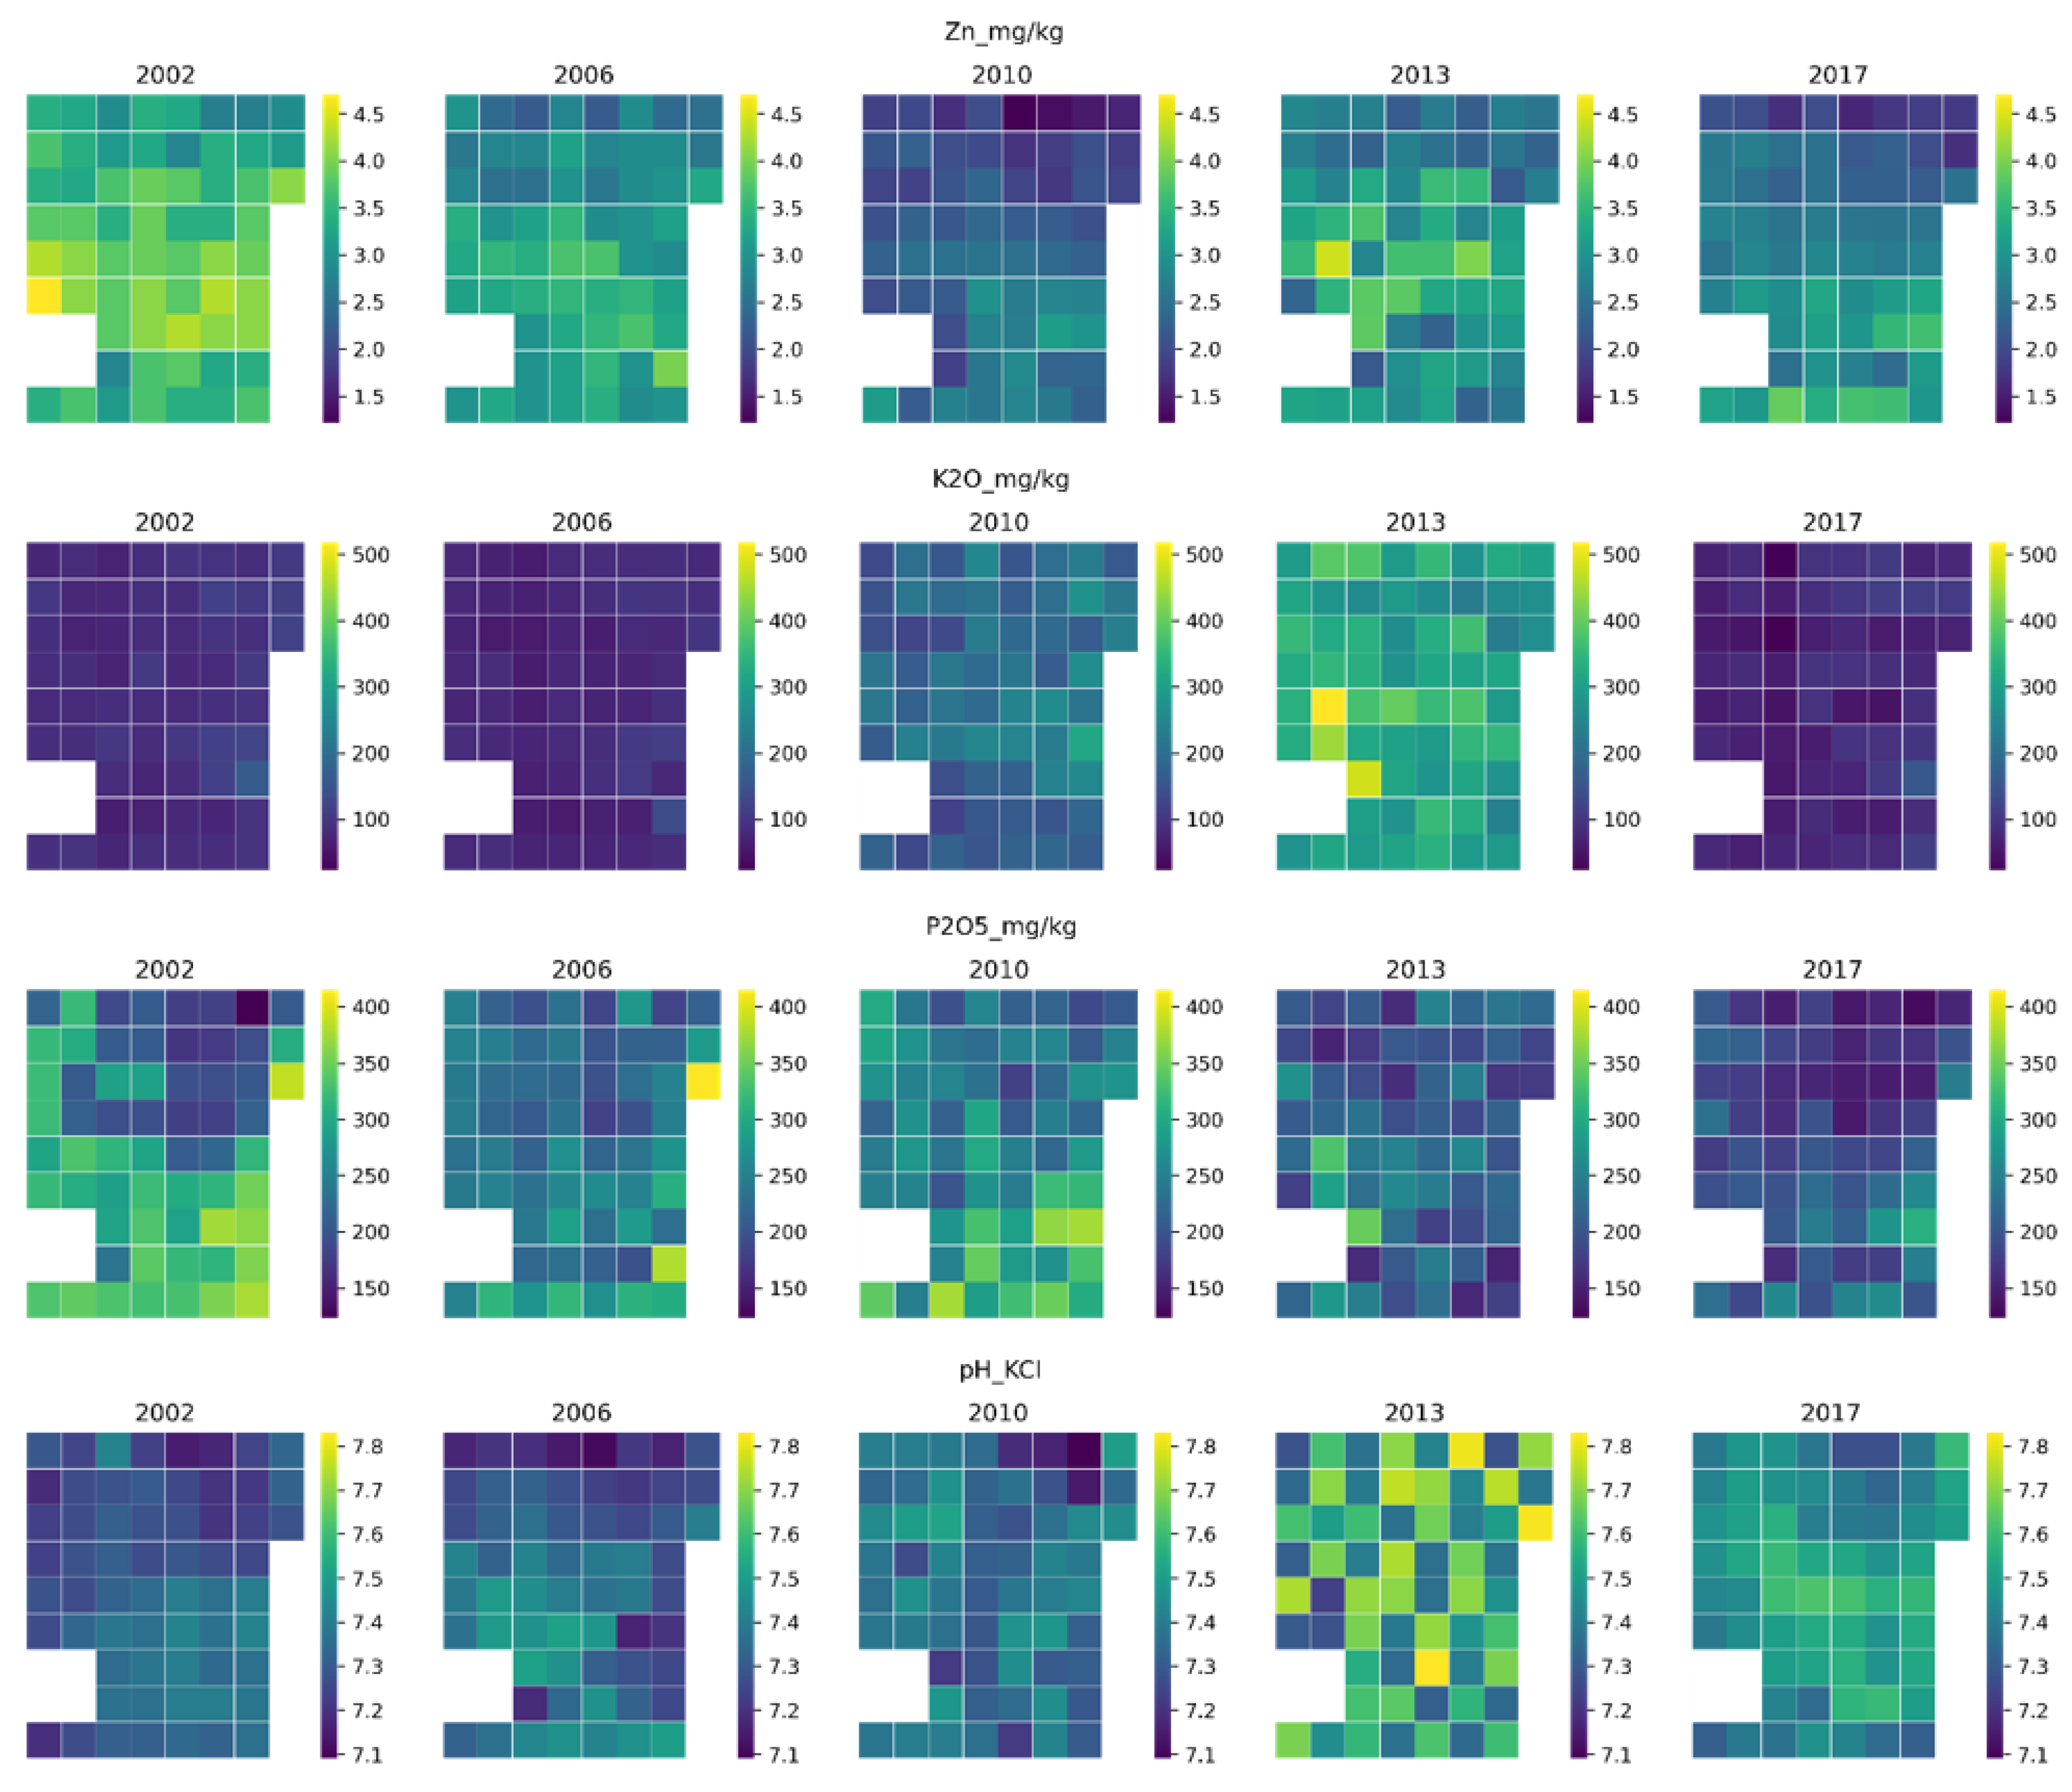
3.2. Spatial Distribution of Maize Yields and Site-Specific Variables
3.3. Relationship of All Variables and Maize Yields
4. Conclusions
Author Contributions
Funding
Institutional Review Board Statement
Informed Consent Statement
Data Availability Statement
Acknowledgments
Conflicts of Interest
Appendix A
References
- Awe, G.O.; Reichert, J.M.; Timm, L.C.; Wendroth, O.O. Temporal processes of soil water status in a sugarcane field under residue management. Plant Soil 2014, 387, 395–411. [Google Scholar] [CrossRef]
- Gajda, A.M.; Czyż, E.A.; Dexter, A.R. Effects of long-term use of different farming systems on some physical, chemical and microbiological parameters of soil quality. Int. Agrophys. 2016, 30, 165–172. [Google Scholar] [CrossRef]
- Aranyos, J.T.; Tomócsik, A.; Makádi, M.; Mészáros, J.; Blaskó, L. Changes in physical properties of sandy soil after long-term compost treatment. Int. Agrophys. 2016, 30, 269–274. [Google Scholar] [CrossRef] [Green Version]
- Nyéki, A.; Kerepesi, C.; Daróczy, B.; Benczúr, A.; Milics, G.; Kovács, A.J.; Neményi, M. Maize Yield Prediction Based on Artificial Intelligence Using Spatio-Temporal Data. In Proceedings of the Precision Agriculture’19, Wageningen, The Netherlands, 8 July 2019; Wageningen Academic Publishers: Wageningen, The Netherlands, 2019. [Google Scholar]
- Basso, B.; Bertocco, M.; Sartori, L.; Martin, E.C. Analyzing the effects of climate variability on spatial pattern of yield in a maize–wheat–soybean rotation. Eur. J. Agron. 2007, 26, 82–91. [Google Scholar] [CrossRef]
- Schepers, A.R.; Shanahan, J.F.; Liebig, M.A.; Schepers, J.S.; Johnson, S.H.; Luchiari, A. Appropriateness of management zones for characterizing spatial variability of soil properties and irrigated corn yields across years. Agron. J. 2004, 96, 195. [Google Scholar] [CrossRef] [Green Version]
- Sánchez, T.; Ligarreto, M.; Leiva, F.R. Spatial variability of soil chemical properties and its effect on crop yields: A case study in maize (Zea mays L.) on the Bogota Plateau. Agron. Colomb. 2010, 29, 265–274. [Google Scholar]
- Srinivasan, A. Handbook of Precision Agriculture: Principles and Applications; CRC Press: Boca Raton, FL, USA, 2006; ISBN 9781482277968. [Google Scholar]
- Jug, I.; Brozović, B.; Đurđević, B.; Wilczewski, E.; Vukadinović, V.; Stipešević, B.; Jug, D. Response of crops to conservation tillage and nitrogen fertilization under different agroecological conditions. Agronomy 2021, 11, 2156. [Google Scholar] [CrossRef]
- Jin, J.; Jiang, C. Spatial variability of soil nutrients and site-specific nutrient management in the China. Comput. Electron. Agric. 2002, 36, 165–172. [Google Scholar] [CrossRef]
- Wendroth, O.; Jürschik, P.; Kersebaum, K.C.; Reuter, H.; van Kessel, C.; Nielsen, D.R. Identifying, understanding, and describing spatial processes in agricultural landscapes—four case studies. Soil Tillage Res. 2001, 58, 113–127. [Google Scholar] [CrossRef]
- Mzuku, M.; Khosla, R.; Reich, R.; Inman, D.; Smith, F.; MacDonald, L. Spatial variability of measured soil properties across site-specific management zones. Soil Sci. Soc. Am. J. 2005, 69, 1572–1579. [Google Scholar] [CrossRef] [Green Version]
- Diacono, M.; Castrignanò, A.; Troccoli, A.; De Benedetto, D.; Basso, B.; Rubino, P. Spatial and temporal variability of wheat grain yield and quality in a mediterranean environment: A multivariate geostatistical approach. Field Crops Res. 2012, 131, 49–62. [Google Scholar] [CrossRef]
- Kool, D.; Tong, B.; Tian, Z.; Heitman, J.L.; Sauer, T.J.; Horton, R. Soil water retention and hydraulic conductivity dynamics following tillage. Soil Tillage Res. 2019, 193, 95–100. [Google Scholar] [CrossRef] [Green Version]
- Nyéki, A.; Milics, G.; Kovács, A.J.; Neményi, M. Effects of soil compaction on cereal yield. Cereal Res. Commun. 2017, 45, 1–22. [Google Scholar] [CrossRef] [Green Version]
- Soane, B.D.; van Ouwerkerk, C. Soil Compaction in Crop Production; Elsevier: Amsterdam, The Netherlands, 2013; ISBN 9780080934006. [Google Scholar]
- Orrben, C.L.; Tharp, W.E. Soil Survey of Monroe County, Iowa; Bureau of Chemistry and Soils: Washington, DC, USA, 1935; ISBN 31210008546176. [Google Scholar]
- Franke, A.C.; Laberge, G.; Oyewole, B.D.; Schulz, S. A comparison between legume technologies and fallow, and their effects on maize and soil traits, in two distinct environments of the West African Savannah. Nutr. Cycl. Agroecosyst. 2008, 82, 117–135. [Google Scholar] [CrossRef] [Green Version]
- Shukla, A.K.; Behera, S.K.; Lenka, N.K.; Tiwari, P.K.; Prakash, C.; Malik, R.S.; Sinha, N.K.; Singh, V.K.; Patra, A.K.; Chaudhary, S.K. Spatial variability of soil micronutrients in the intensively cultivated trans-gangetic plains of India. Soil Tillage Res. 2016, 163, 282–289. [Google Scholar] [CrossRef]
- FAO World Reference Base for Soil Resources 2014. Available online: https://www.fao.org/3/i3794en/I3794en.pdf (accessed on 26 January 2022).
- Soil Classification. Available online: https://www.nrcs.usda.gov/wps/portal/nrcs/main/soils/survey/class/ (accessed on 5 January 2022).
- Nyéki, A.; Kerepesi, C.; Daróczy, B.; Benczúr, A.; Milics, G.; Nagy, J.; Harsányi, E.; Kovács, A.J.; Neményi, M. Application of spatio-temporal data in site-specific maize yield prediction with machine learning methods. Precis. Agric. 2021, 22, 1397–1415. [Google Scholar] [CrossRef]
- Neményi, M.; Mesterházi, P.Á.; Milics, G. An application of tillage force mapping as a cropping management tool. Biosyst. Eng. 2006, 94, 351–357. [Google Scholar] [CrossRef]
- Szőllősi, I. A 3T SYSTEM Készülékkel Mért Penetrációs Ellenállás És Nedvességtartalom Összefüggése Vályog Fizikai Féleségű Talajon. Agrokémia És Talajt. 2003, 52, 263–274. [Google Scholar] [CrossRef]
- Foroughifar, H.; Jafarzadeh, A.A.; Torabi, H.; Pakpour, A.; Miransari, M. Using geostatistics and geographic information system techniques to characterize spatial variability of soil properties, including micronutrients. Commun. Soil Sci. Plant Anal. 2013, 44, 1273–1281. [Google Scholar] [CrossRef]
- Ayoubi, S.H.; Zamani, S.M.; Khormali, F. Spatial variability of some soil properties for site specific farming in northern Iran. Int. J. Plant Prod. 2007, 1, 225–236. [Google Scholar]
- Miao, Y.; Mulla, D.J.; Robert, P.C. Identifying important factors influencing corn yield and grain quality variability using artificial neural networks. Precis. Agric. 2006, 7, 117–135. [Google Scholar] [CrossRef]
- Vidana Gamage, D.N.; Biswas, A.; Strachan, I.B. Spatial variability of soil thermal properties and their relationships with physical properties at field scale. Soil Tillage Res. 2019, 193, 50–58. [Google Scholar] [CrossRef]
- Usowicz, B.; Lipiec, J. Spatial variability of soil properties and cereal yield in a cultivated field on sandy soil. Soil Tillage Res. 2017, 174, 241–250. [Google Scholar] [CrossRef]
- Rugira, P.; Ma, J.; Zheng, L.; Wu, C.; Liu, E. Application of DSSAT CERES-maize to identify the optimum irrigation management and sowing dates on improving maize yield in Northern China. Agronomy 2021, 11, 674. [Google Scholar] [CrossRef]
- Scudiero, E.; Teatini, P.; Manoli, G.; Braga, F.; Skaggs, T.; Morari, F. Workflow to establish time-specific zones in precision agriculture by spatiotemporal integration of plant and soil sensing data. Agronomy 2018, 8, 253. [Google Scholar] [CrossRef] [Green Version]


| 2002 | 2006 | 2010 | 2013 | 2017 | |
|---|---|---|---|---|---|
| Sum. precipitation during vegetation period (IV-X) | 353.8 | 405.4 | 597.9 | 398.4 | 332.7 |
| evapotranspiration (mm) | 911 | 881 | 690 | 845 | 951 |
| aridity index | 2.6 | 2.2 | 1.2 | 2.1 | 2.9 |
| precipitation in May (mm) | 25.9 | 90 | 150.3 | 125.9 | 26.7 |
| precipitation in June (mm) | 40.2 | 59.1 | 100 | 42.2 | 40 |
| Mean (STD) | |||||
|---|---|---|---|---|---|
| Min-Max | |||||
| CV | |||||
| Variable | 2002 | 2006 | 2010 | 2013 | 2017 |
| Maize_yield_t/ha | 6.12 (1.62) | 11.48 (0.41) | 9.89 (0.86) | 11.52 (1.91) | 7.79 (2.41) |
| 2.46–9.43 | 10.44–12.36 | 7.63–11.97 | 7.33–15.05 | 3.11–13.18 | |
| 0.27 | 0.04 | 0.09 | 0.17 | 0.31 | |
| pH_H2O | 7.76 (0.05) | - | - | - | - |
| 7.62–7.93 | - | - | - | - | |
| 0.01 | - | - | - | - | |
| pH_KCl | 7.3 (0.07) | 7.33 (0.1) | 7.36 (0.09) | 7.53 (0.17) | 7.46 (0.09) |
| 7.15–7.42 | 7.11–7.51 | 7.09–7.52 | 7.23–7.83 | 7.24–7.62 | |
| 0.01 | 0.01 | 0.01 | 0.02 | 0.01 | |
| P2O5_mg/kg | 271.16 (67.56) | 244.05 (42.86) | 265.14 (46.83) | 214.43 (39.15) | 193.65 (36.8) |
| 123–388 | 181–415 | 180–376 | 151–347 | 131–308 | |
| 0.25 | 0.18 | 0.18 | 0.18 | 0.19 | |
| K2O_mg/kg | 90.83 (15.91) | 79.03 (13.66) | 194.21 (41.46) | 318.89 (53.08) | 77.72 (21.83) |
| 65–162 | 58–135 | 121–317 | 226–518 | 22.6–158 | |
| 0.18 | 0.17 | 0.21 | 0.17 | 0.28 | |
| Zn_mg/kg | 3.61 (0.43) | 3.06 (0.37) | 2.24 (0.41) | 3 (0.51) | 2.67 (0.51) |
| 2.7–4.7 | 2.2–4 | 1.21–3.14 | 2.17–4.43 | 1.58–3.88 | |
| 0.12 | 0.12 | 0.18 | 0.17 | 0.19 | |
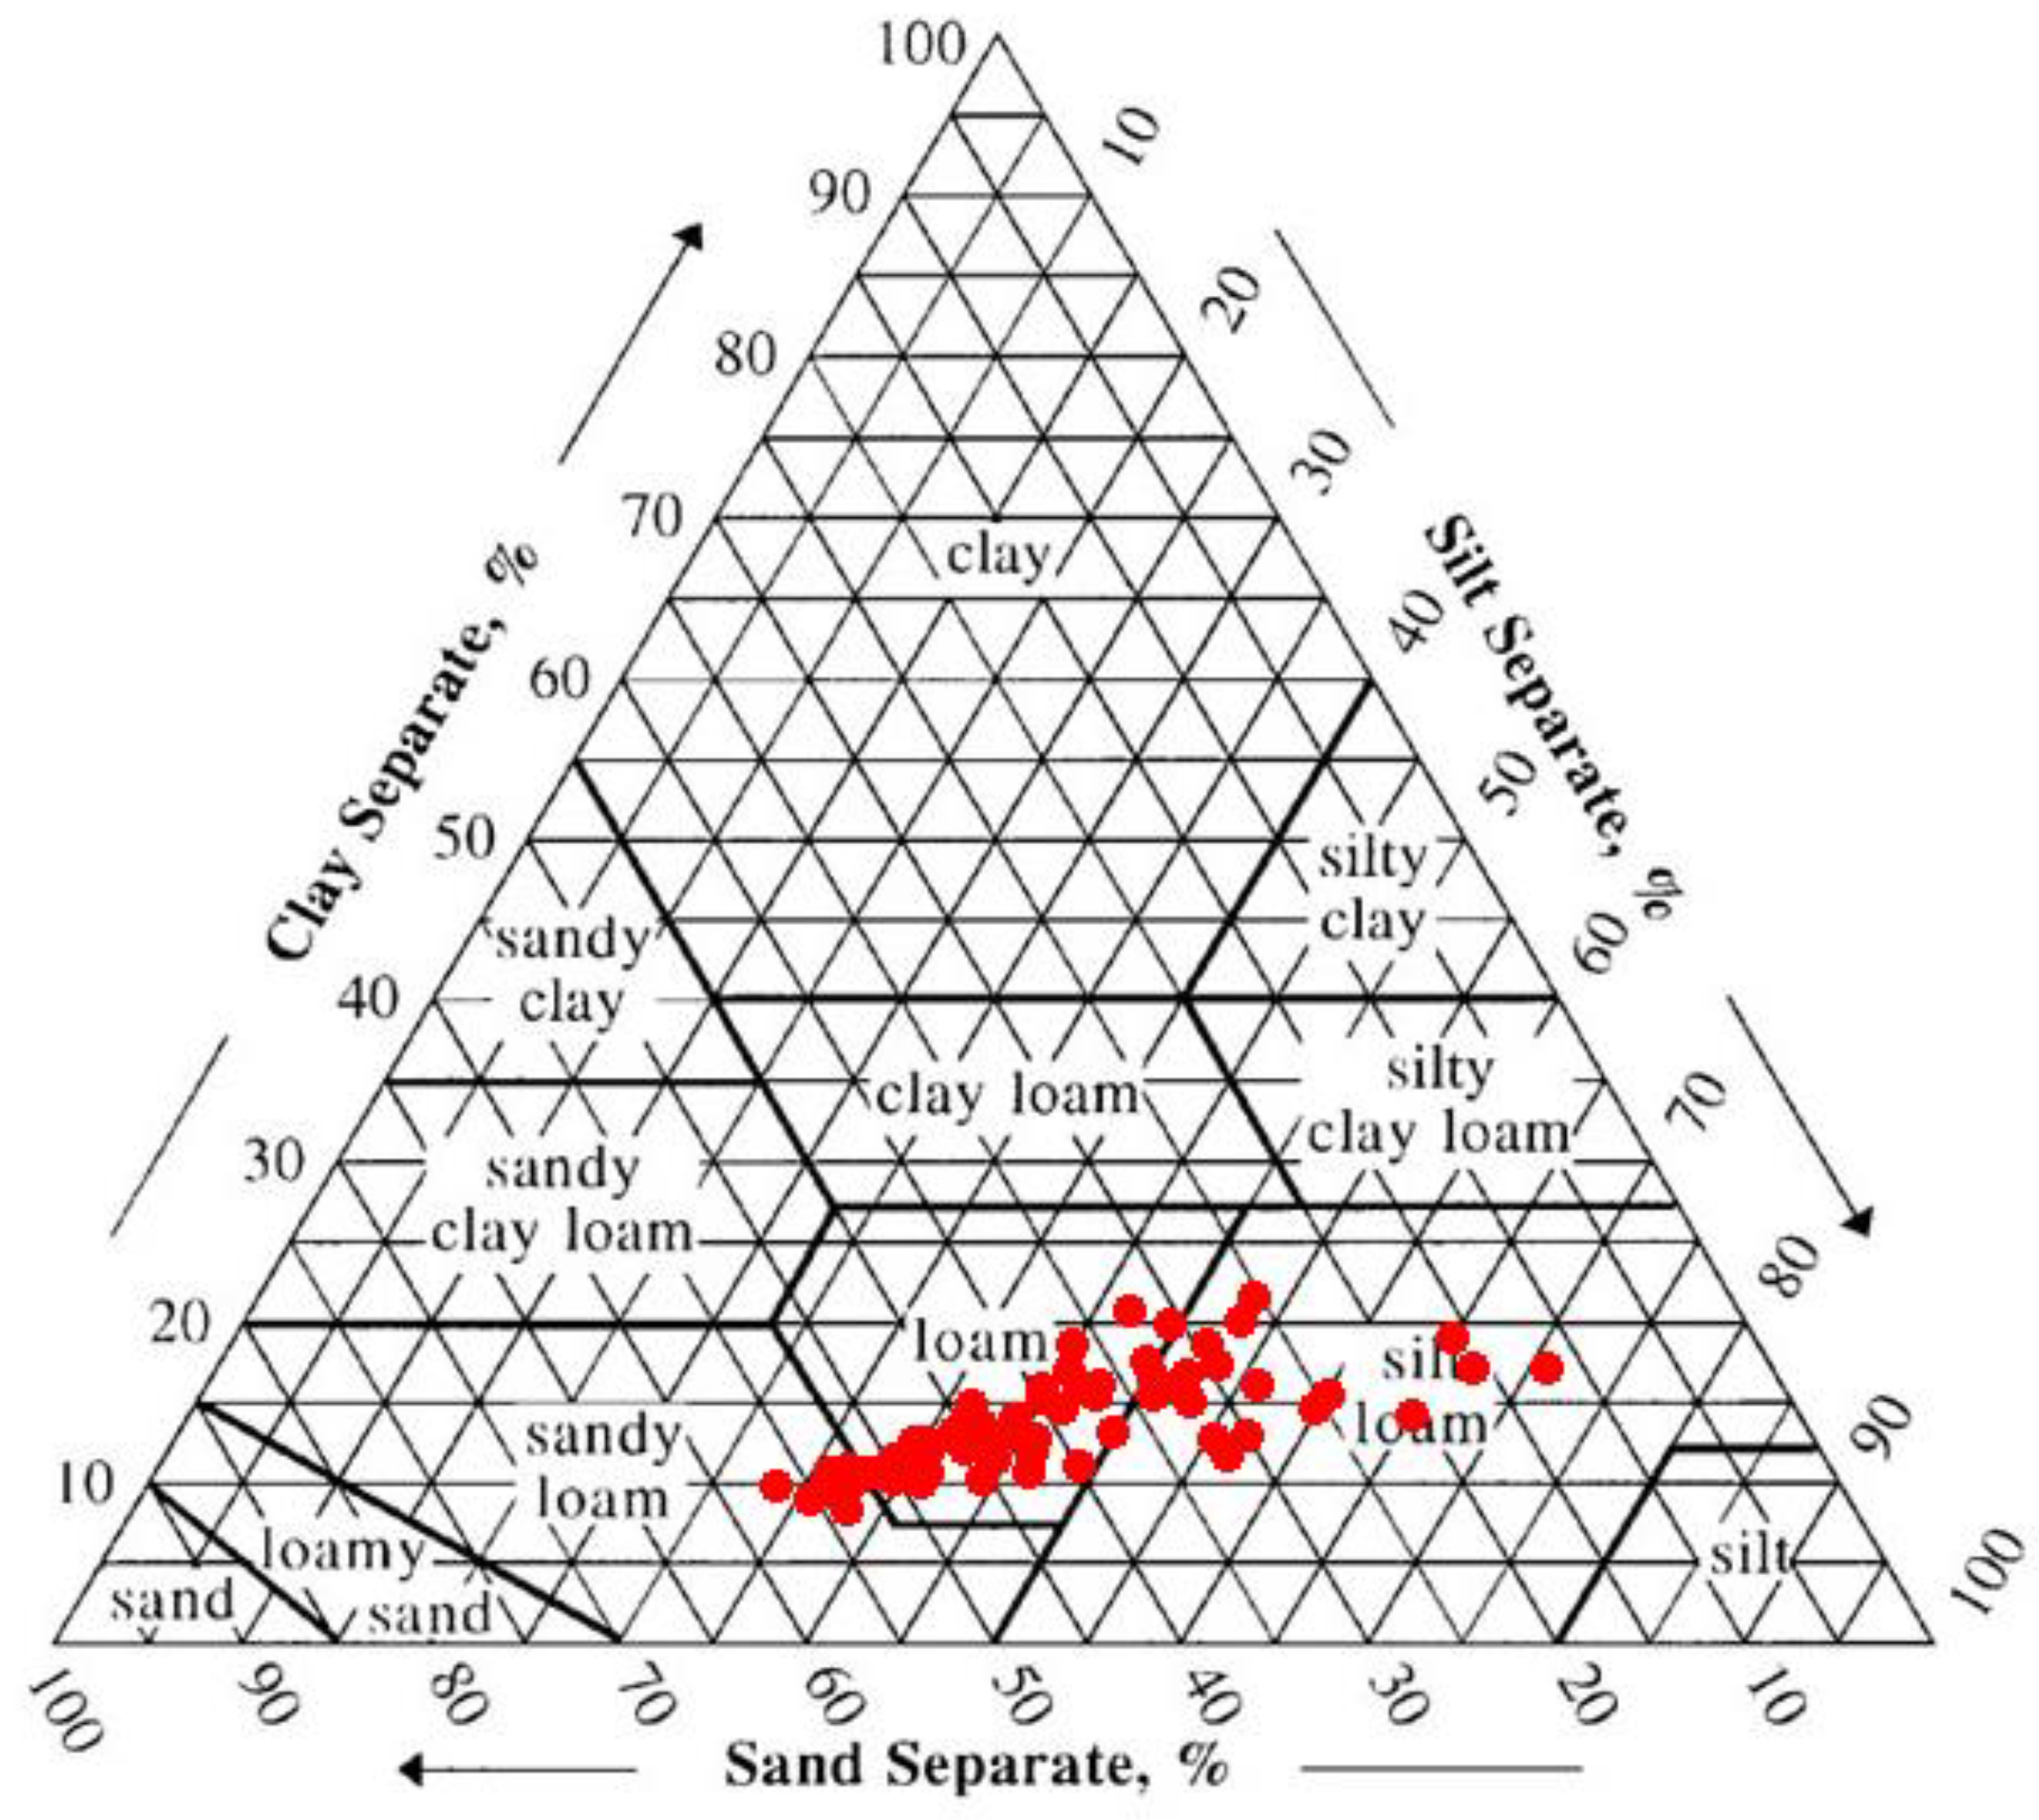
| Clay_content_% | 13.25 (3.14) | 13.25 (3.14) | 13.25 (3.14) | 13.25 (3.14) | 13.25 (3.14) |
| 7.9–21 | 7.9–21 | 7.9–21 | 7.9–21 | 7.9–21 | |
| 0.24 | 0.24 | 0.24 | 0.24 | 0.24 | |
| Draught_force_kN | 3.17 (0.86) | - | - | - | - |
| 1.52–6.12 | - | - | - | - | |
| 0.27 | - | - | - | - | |
| Relative elevation_m | 122.72 (0.35) | 122.72 (0.35) | 122.72 (0.35) | 122.72 (0.35) | 122.72 (0.35) |
| 121.96–123.6 | 121.96–123.6 | 121.96–123.6 | 121.96–123.6 | 121.96–123.6 | |
| 0 | 0 | 0 | 0 | 0 | |
| NDVI | - | 0.66 (0.03) | 0.29 (0.05) | 0.47 (0.02) | 0.4 (0.02) |
| - | 0.57–0.69 | 0.2–0.42 | 0.4–0.49 | 0.37–0.45 | |
| - | 0.04 | 0.16 | 0.05 | 0.05 | |
| Veris_N3 | - | - | 18 (4.84) | 8.18 (1.51) | 13.58 (7.18) |
| - | - | 9.68–30.55 | 5.51–10.96 | 5.5–39.12 | |
| - | - | 0.27 | 0.18 | 0.53 | |
| Veris_N3 | - | - | 17.57 (5.1) | 11.76 (2.74) | 21.54 (7.67) |
| - | - | 8.89–30.94 | 6.94–18.47 | 8.33–37.83 | |
| - | - | 0.29 | 0.23 | 0.36 | |
| Cone_Index_Mpa | - | - | - | 44.68 (7.61) | - |
| - | - | - | 22.47–58.74 | - | |
| - | - | - | 0.17 | - |
Publisher’s Note: MDPI stays neutral with regard to jurisdictional claims in published maps and institutional affiliations. |
© 2022 by the authors. Licensee MDPI, Basel, Switzerland. This article is an open access article distributed under the terms and conditions of the Creative Commons Attribution (CC BY) license (https://creativecommons.org/licenses/by/4.0/).
Share and Cite
Nyéki, A.; Daróczy, B.; Kerepesi, C.; Neményi, M.; Kovács, A.J. Spatial Variability of Soil Properties and Its Effect on Maize Yields within Field—A Case Study in Hungary. Agronomy 2022, 12, 395. https://doi.org/10.3390/agronomy12020395
Nyéki A, Daróczy B, Kerepesi C, Neményi M, Kovács AJ. Spatial Variability of Soil Properties and Its Effect on Maize Yields within Field—A Case Study in Hungary. Agronomy. 2022; 12(2):395. https://doi.org/10.3390/agronomy12020395
Chicago/Turabian StyleNyéki, Anikó, Bálint Daróczy, Csaba Kerepesi, Miklós Neményi, and Attila József Kovács. 2022. "Spatial Variability of Soil Properties and Its Effect on Maize Yields within Field—A Case Study in Hungary" Agronomy 12, no. 2: 395. https://doi.org/10.3390/agronomy12020395
APA StyleNyéki, A., Daróczy, B., Kerepesi, C., Neményi, M., & Kovács, A. J. (2022). Spatial Variability of Soil Properties and Its Effect on Maize Yields within Field—A Case Study in Hungary. Agronomy, 12(2), 395. https://doi.org/10.3390/agronomy12020395