Article

Ammonium to Total Nitrogen Ratio Interactive Effects with Salinity Application on Solanum lycopersicum Growth, Physiology, and Fruit Storage in a Closed Hydroponic System

by
Nikolaos Tzortzakis
1,2,*,
Georgia Pitsikoulaki
2,
Aristeidis Stamatakis
3 and
Antonios Chrysargyris
1
1
Department of Agricultural Sciences, Biotechnology and Food Science, Cyprus University of Technology, Lemesos 3603, Cyprus
2
Department of Sustainable Agriculture, Mediterranean Agronomic Institute of Chania, 73100 Chania, Greece
3
Max Planck Institute for Plant Breeding Research, D-50829 Koln, Germany
*
Author to whom correspondence should be addressed.
Agronomy 2022, 12(2), 386; https://doi.org/10.3390/agronomy12020386
Submission received: 11 January 2022 / Revised: 28 January 2022 / Accepted: 1 February 2022 / Published: 3 February 2022

Abstract

:
Using high-salinity water for plant fertigation may have negative consequences for plant growth, overall yield and crop quality. In the present study, the effects of NaCl-salinity in conjunction with three different ammonium to nitrate ratios (Nr) on tomato (Solanum lycopersicum Mill.) plant growth, nutritional status, yield, fruit quality and postharvest storage were examined. The electrical conductivity (EC) was increased by adding NaCl into the nutrient solution and three different Nr ratios were applied, Nr0.05, Nr0.10 and Nr0.15, while the other macronutrient and micronutrient concentrations were constant in all treatments. The EC of the nutrient solution supplied to the plants was 2.2 mS cm−1 at the low salinity treatments and 7.5 mS cm−1 at the high salinity treatments. Increased salinity resulted in decreased plant growth factors and fruit yield, despite the Nr. An increased Nr reduced the pH value of the nutrient solution, while the fruits of the plants cultivated under high salinity obtained reduced Ca, K, Mg, P and N content. Reduced Ca content can lead to blossom end rot disorder and this was evidenced on tomato cultivation under high salinity. However, in the present study, this disorder appeared at the very late stages and did not affect the marketability of the fruits. On the other hand, both salinity and Nr0.15 increased fruit firmness at harvest or following storage, while citric acid, total soluble solid and vitamin C contents were also increased by salinity. Total phenols were increased by salinity at harvest, and lycopene and β-carotene content were increased by salinity at harvest and/or following storage at 12 °C or 25 °C. Salinity enhances fruit quality and improves the organoleptic characteristics of the crop, while an appropriate Nr ratio may restrict the detrimental effects of salinity on the nutritional status of plants by regulating the pH in hydroponic systems.

1. Introduction

Salinity and a lack of high-quality irrigation water are two key side effects of ongoing climate change that have a negative impact on plant physiological processes, plant growth and agronomic performance, with serious implications for global horticulture crop output [1,2]. According to reports, an increase in water and soil salinity is causing problems in 20% of agricultural and 33% of irrigated lands around the world [3,4]. Increased salt levels in soil solution are known to raise osmotic pressure in the rhizosphere, resulting in a reduction in water availability and nutrient uptake by plants [5]. Salinity stress has also been shown to have a deleterious impact on plant physiological and biochemical processes, affecting both the primary and secondary metabolism of plants [6]. Increasing sodium chloride (NaCl) levels has been demonstrated to have a negative effect on plant height and vigor [7,8,9], leaf area [10,11] and leaf number [12,13]. High salinity also reduces plant photosynthetic rate [14], which can alter protein content [15], which in turn alters quality and activates many plant secondary metabolic processes [16], as well as antioxidant mechanisms to combat salinity impacts [17,18].
Nitrogen (N) is the sole nutrient that can be delivered to plants in both anionic (nitrate; NO3) and cationic (ammonium; NH4+) form by fertigation, and both N forms have different absorption rates depending on their external concentrations [19]. Plant responses to NH4+ vary by species and are influenced by environmental factors such as temperature, light intensity, pH and nutrient concentrations in the growth media [20]. The form of N used by a plant may affect its morphology and chemical composition, with NH4+ likely to cause lower levels of potassium (K), calcium (Ca) and magnesium (Mg) and higher levels of phosphorus (P), sulphur (S) and organic N [21]. Several studies have found that the form of nitrogen, rather than the total nitrogen amount, is more important, with major implications not only for the overall yield but also for the marketable quality of the final vegetable products [22,23,24]. As a result, changing the composition of the nutrient solution (NS) can be a cost-effective way to improve vegetable quality by reducing antinutritional components [25] or increasing the beneficial compounds levels [26]. Most plants exhibit growth reduction and severe toxicity symptoms if NH4+ is the dominant or sole form of the supplied N, due to the intracellular concentration of ammonia, which is highly toxic for the plant cells [19], being increased as result. Despite the fact that the energetic cost of NO3 absorption and assimilation is significantly higher than that of NH4+, the majority of plant species prefer NO3 to NH4+ [27]. This is because large concentrations of NH4+ in the solution (>0.5 mM) can be harmful to plants (particularly at low pH levels), reducing biomass production [27,28]. The concentration of nitrate in edible tissues, on the other hand, is an essential quality attribute of vegetables. Nitrate levels in vegetables are frequently addressed as a potential health hazard. Furthermore, nitrite can react with amines and amides in the body to generate nitrosamines and nitrosamides, both of which have been linked to cancer [22].
Although various studies have demonstrated that high salinity has a negative impact on plant growth and fruit yield, tomato is regarded as a species which is fairly resilient to salt stress [29,30]. However, there is still a gap in our understanding of the plant physiology parameters, biochemical alterations and postharvest performance of saline-grown tomato plants in combination with nitrogen forms and ratios, for example, the ratio of ammonium ions to total nitrogen (Nr: NH4+/total N). Several studies have involved a broad spectrum of Nr ranging from 0 to 1 [31] but this has not enabled an accurate optimization of the Nr responses. Therefore, interest has been focused on a narrower range of Nr [32]. As a result, this study’s main objectives were to: (a) investigate the effects of the application of ammonium to total nitrogen ratios as well as salinity conditions via nutrient solution on tomato plant growth, mineral content and fruit quality; (b) assess the postharvest performance of fruits when plants were subjected to Nr or saline conditions under storage and shelf-life conditions. The findings of this study could lead to a better knowledge of plant responses to salinity and/or Nr application for the purpose of using hydroponic nutrient solution to aid in tomato plant development and fruit shelf-life.

2. Materials and Methods

2.1. Plant Material and Growing Conditions

The present study was carried out in a run-to-waste system hydroponic Venlo double-roof type glasshouse with a North-South orientation, located at the Mediterranean Agronomic Institute of Chania, Greece, at the latitude of 35.35° N, longitude of 24.02° E and altitude of 8 m. The study took place during the autumn–spring growing period (from the middle of October until the end of March in 2014–2015). Air temperature and relative humidity were averaged from 15.3 °C to 24.6 °C and 62.1–89.5%, respectively (Figure S1).
Tomato seedlings (Solanum lycopersicum Mill. cv. Belladonna) grown in standard potting mix were purchased from a local nursery. Seedlings were transplanted into perlite filled bags (three seedlings per bag, spaced at 33 cm) at the two true-leaf stage.

2.2. Experimental Set Up

Seedlings were given a seven-day period to become acclimatized to the new growing media (perlite). Six treatments were examined, considering three different NH4-N/Ntotal supply ratios (Nr) in conjunction with two salinity levels (three N ratio × two salinity × four replication plots). The treatments were named as plants grown with (i) Nr0.05 + LS (NH4-N/Ntotal: 0.05, low salinity of 2.2 mS cm−1), (ii) Nr0.10 + LS (NH4-N/Ntotal: 0.10, low salinity of 2.2 mS cm−1), (iii) Nr0.15 + LS (NH4-N/Ntotal: 0.15, low salinity of 2.2 mS cm−1), (iv) Nr0.05 + HS (NH4-N/Ntotal: 0.05, high salinity of 7.5 mS cm−1), (v) Nr0.10 + HS (NH4-N/Ntotal: 0.10, high salinity of 7.5 mS cm−1) and (vi) Nr0.15 + HS (NH4-N/Ntotal: 0.15, high salinity of 7.5 mS cm−1). For the purposes of our study, we opted to use the moderate salinity level of 50 mM NaCl in order to avoid subjecting plants to severe stress that could not allow fruit formation and the harvesting of fruit due to early plant death. Therefore, the term salinity is used to differentiate the experimental treatments (0 and 50 mM NaCl). To achieve the targeted salinity conditions in treatments (iv), (v) and (vi), electrical conductivity (EC) was gradually increased with the addition of NaCl over a nine-days period (from 2.20 for standard NS up to 7.50 mS cm−1 for salinity treatment) to avoid osmotic shock. The different Nr supply was on molar basis. Six tanks containing the six different nutrient solutions used for fertigation, with each tank being 300 L in volume, were established in the glasshouse. The composition of macronutrients in standard NS (1:100 v/v) was: NO3-N = 14.96 mmol L−1, K = 8.75 mmol L−1, PO4−3-P = 1.07 mmol L−1, Ca = 7.22 mmol L−1, Mg = 3.04 mmol L−1, SO4−2-S = 3.37 mmol L−1 and sodium (Na) = 0.34 mmol L−1; while the micronutrient contents were: boron (B) = 25.00 μmol L−1, iron (Fe) = 20.00 μmol L−1, manganese (Mn) = 10.00 μmol L−1, copper (Cu) = 0.77 μmol L−1, zinc (Zn) = 4.00 μmol L−1 and molybdenum (Mo) = 0.50 μmol L−1. The pH of NS treatment was adjusted at optimal levels (5.6) for both types of solutions with the addition of HNO3 (0.9% v/v) and the ratio of N/P/K was constant in all treatments. Fresh NS was prepared twice weekly, according to fertigation needs, while pH and EC levels were checked and adjusted whenever a new solution was prepared. Fertigation was applied via a drip irrigation system seven times per day (at full development stage) for three minutes per application, with a total volume of 777 mL of solution applied daily per plant. The fertigation schedule was adjusted from time to time depending on the plant developmental stage and the current environmental conditions. In general, an effort was made to collect 25% of the drainage solution from the nutrient solution that was applied.
The experiment was laid out as a completely randomized design, with four replication plots for each of the six treatments and six plants per replication plot, giving us a total of twenty-four plants per treatment, out of which sixteen individual plants (four plants per replication) were considered as experimental units and subjected to further measurements.
Plants were grown in bags filled with perlite as a growing media. The bags were placed on the metal channels, forming planting rows which had a distance of 0.8 m. The central corridor was 1.3 m wide. Three tomato plants (Solanum lycopersicum Mill. cv. Belladonna) were planted in each bag, spaced 0.33 m apart. The bags had slits on the bottom to allow drainage. The first fruit set was 4 weeks and the first harvest took place after 12 weeks after transplanting.
A vertical single stem pruning system was applied to the plants and pruning was performed almost every week. Sulfur was spread on the glasshouse floor during the cultivation period in order to protect the crop from pathogen infection. Crop protection was performed with the use of approved insecticides (AFFIRM, Decis) against Tuta absoluta (considered the most serious pest enemy for tomato cultivation in Crete) every 10 days. Additional sprayings with Switch and Mepam were performed three times during the cultivation period against Botrytis cinerea with the appearance of the first symptoms (middle January). Additionally, yellow sticky traps were hung for protection from pests (Bemisia tabaci).
Pollination was performed with bumble bees that were established in the glasshouse for the whole growing period. The bumble bees were applied twice during cultivation. The insecticides used against T. absoluta were always applied during the late afternoon; by that time the bees had already entered the beehive. The beehive remained closed until the next day to protect the bumble bees from the insecticide. The beehive was removed from the glasshouse before the spraying of fungicides.

2.3. Plant Growth and Physiological Parameters

Forty-eight tomato plants (eight plants per treatment) were marked and used for plant growth measurements. Plant growth characteristics were recorded once, at the end of the study (12 weeks after transplanting). The recorded parameters included plant height (cm), number of leaves, stem diameter (cm), number of fruits, fresh fruit weight (g) and total yield (kg).
Leaf chlorophyll was extracted with dimethyl sulfoxide (DMSO) and Chlorophyll a (Chl a), Chlorophyll b (Chl b) and total Chlorophylls (total Chl) were assayed and expressed as μg g−1 Fw [33]. Leaf photosynthetic rate (Pn), stomatal conductance (gs) and internal leaf concentration of CO2 (Ci) were recorded with a Li-Cor gas analyzer (Li-6400, Li-Cor, Inc., Lincoln, NE, USA). All gas exchange measurements started 3 h after the onset of the photoperiod with the following instrumental adjustments: leaf chamber (6 cm2), temperature 26 ± 2 °C and photon flux density 1300 μmol m2 s1 at ambient CO2 concentration. For each treatment, measurements were taken from two fully expanded, healthy and sun-exposed leaves per plant from four plants in total.

2.4. Fruit Harvesting

For yield estimation, fruit were harvested from the first four clusters of selected tomato plants. These were then weighed and yield was expressed as kg per plant. For chemical analyses, twenty-four fruits from each treatment were selected from the last (fourth) cluster at the end of March and further divided into three batch samples. One batch of fruit was evaluated immediately after harvest and the other two batches were used for the assessment of storage performance. All the selected fruit were visually inspected prior to harvesting in order to make sure they were healthy and free of injuries, bruises and pathogen infestations. Moreover, the fruits affected by the physiological disorder “blossom-end rot” (BER) were also counted at each harvesting date.

2.5. Analysis of the Drainage Solution

Once a week, samples of the drainage solution were collected from every experimental plot. The samples were immediately taken to the laboratory and the pH and the EC were measured. The nitrates of the drainage solution were determined by means of a spectrophotometer according to the ultraviolet spectrophotometric screening method [34]. This technique is used for screening samples that have low organic matter contents. Measurement of UV absorption at 220 nm enables the rapid determination of NO3. Due to the fact that dissolved organic matter may also absorb at 220 nm and NO3 does not absorb at 275 nm, a second measurement made at 275 nm and was sometimes used to correct the NO3 value.

2.6. Mineral Composition Analysis

After harvesting, leaf and fruit mineral content was determined. Sub-samples of 0.2–0.3 g were placed in the oven (500 °C for 6 h) for ashing and were acid digested with 10 mL 2N HCl. The content of P, K, Ca, Mg, Na, aluminium (Al), Fe, Zn, Mn, B and Cu was determined with an atomic emission spectrometer (ICP-AES PSFO 2.0, Leeman Labs Inc., Hudson, NY, USA). The content of N was determined by using the Kjeldahl method (Kjeldahl nitrogen determination apparatus, Gerhardt Ltd., Brackley, UK). Data were expressed as g kg−1 and mg kg−1 dry weight for macro and micro-nutrients, respectively [17,35].

2.7. Fruit Macroscopic Examination and Quality Analysis

Fruit color was measured with CR-300 chromatometer (Minolta, Tokyo, Japan), with two measurements per fruit being taken on the equatorial axis. The values of L*, a* and b* were measured (where: L* = lightness, a* = redness and b* = yellowness), and color indices (chroma, hue value, whitening index-WI and color index-CI) were computed [36]. Firmness was measured in one batch of the samples with a GY-2 penetrometer (Zhejiang Top Instrument, Hangzhou, China) equipped with a plunger of 3.5 mm in diameter. Fruits were probed randomly in two sides and data were expressed in Newton.
The other two batches of fruit were further used for postharvest performance, one batch of fruits was stored at room temperature at 25 °C, and the other group was stored in a fridge at 12 °C for 7 days. Following the 7 days of storage, the fruits were weighed again, evaluated macroscopically and measured for quality changes.
Fruit quality-related attributes, namely total soluble solids (TSS), titratable acidity (TA) and ascorbic acid (AA) content were measured [37]. TSS were measured with a digital refractometer (PR-100; ATAGO, Tokyo, Japan) and TSS content was expressed as ºBrix. For TA determination, tomato juice (5 mL) was diluted with distilled water to a final volume of 50 mL, titrated with 0.1 N NaOH, in the presence of phenol-phtalein as an indicator, and expressed as citric acid percentage [37]. The ascorbic acid content was determined using the 2.6-Dichloroindophenol titrimetric method [38].

2.8. Determination of Carotenoids and Total Phenolics

Total phenolic composition was determined according to previous reports by the authors [33,37]. Briefly, methanolic extracts of blended tomato (2.5 g) following the addition of 1.5 mL of deionized water, 125 μL of Folin–Ciocalteu’s reagent (Merck Group, Darmstadt, Germany) and 1.25 mL of 7% (w/v) sodium carbonate and incubation for 90 min were measured at 755 nm (Specord 205, Analytik Jena, Jena, Germany). Results were expressed as gallic acid equivalents (μmol GAE g−1 fresh weight).
Carotenoids (lycopene and β-carotene) content was measured according to the Nagata and Yamashita method with adjustments [39]. Briefly, 1 g of blended tomatoes was placed in 50 mL tubes and stored at −20 °C. After de-freezing, 16 mL of acetone:hexane 4:6 (v:v) were added to each tube and shaken vigorously for phase separation. From each tube, an aliquot was taken with a syringe from the upper phase and measured with a spectrophotometer at λ = 663, 645, 505 and 453 nm, using as reference a solution of acetone:hexane (4:6) ratio. Carotenoids content was calculated according to the following Nagata and Yamashita [39] Equations (1) and (2):
Lycopene (mg 100 mL−1 of extract) = −0.0458 ∗ A663 + 0.204 ∗ A645 + 0.372 ∗ A505 − 0.0806 ∗ A453.
β-carotene (mg 100 mL−1 of extract) = 0.216 ∗ A663 − 1.22 ∗ A645 − 0.304 ∗ A505 + 0.452 ∗ A45.

2.9. Organoleptic Control

The main idea was to study the effects of ammonium or salinity impacts on fruit quality (organoleptic test) immediately after harvest and to detect differences in the quality characteristics according to the treatments. Codded tomato samples from the six treatments (ammonium levels of 0.05, 0.10 and 0.15; salinity of low and high levels) were given as a blind test to a total of ten people (five men and five women) of various age groups and nationalities [37]. Participants were asked to rate the appearance, color, aroma, sweetness and texture of fruit on a scale of 1 to 5 (where 1 was for poor/soft/acidic/no, 2 for medium/little soft/less acidic/probably no, 3 for good/good/mild/sometimes, 4 for very good/little hard/little sweet/probably yes and 5 for excellent/hard/sweet/yes). Participants’ preferences, the satisfaction index and the intention of the participants to buy the product were recorded too. The visual appearance evaluation was performed on intact fruit while the evaluation of aroma, texture and sweetness was performed on freshly cut fruit. All tests took place on lab benches with full light and without any disturbance during the testing procedure.

2.10. Statistical Methods

Statistical analysis was performed using the SPSS v22.0 (SPSS Inc., Chicago, IL, USA) program. Data were evaluated for normality before being subjected to analysis of variance (ANOVA). The significance of the differences between mean values was tested using the Duncan’s multiple range test (DMRT) at p ≤ 0.05, following one- and two-way ANOVA. For testing the panel’s ratings, significant differences in rates were expressed in percentage values after a logarithmic transformation prior to analysis. Results were expressed as mean values ± SE (n = 8 for plant growth/physiological/fruit quality and n = 4 for chemical analyses).

3. Results

3.1. Plant Growth and Physiological Parameters

Table 1 presents the impacts of different ammonium to total nitrogen ratios as well as the different levels of salinity in the nutrient solution on plant growth-related attributes on hydroponically grown tomato plants. Two-way analysis of variance showed that Nr affected leaf photosynthesis and internal CO2 concentration (p < 0.05), whereas salinity affected tomato stem diameter, leaf photosynthesis and internal CO2 concentration (p < 0.05). The interaction of Nr × salinity application affected fruit number (p < 0.001).
A salinity of 50 mM NaCl at a medium (Nr0.10) and high (Nr0.15) ammonium to total nitrogen ratio decreased (up to 18.7%) plant height in comparison to low salinity and low-medium Nr (Table 1). High salinity decreased stem diameter, fruit fresh weight and therefore crop yield in comparison to low saline-treated plants, while the fruit number produced remained unaffected. Plants grown under a low Nr ratio (Nr0.05) revealed the lowest photosynthetic rates in comparison with the plants grown in Nr0.15 + LS, Nr0.05 + HS and Nr0.10 + HS, and this counts as evidence for a higher internal CO2 concentration in the case of the latter (Nr0.10 + HS).
Blossom end rot appeared above the third cluster and ranged from 7–9.4% of the fruits where salinity was applied, with Nr0.05 giving the lowest value, while the percentage of the fruits with blossom end rot was increased at higher Nr ratios.

3.2. Drainage Solution and Leaf and Fruit Mineral Content

Increasing Nr to 0.15 markedly suppressed the nutrient solution pH in the root environment of tomatoes as indicated by the values measured in the drainage water (Figure S2). This effect was more profound after the 13th of December and until the middle of February due to the low air temperature and light intensity on that period. Even an Nr of 0.15 resulted in pH values below 5.0 during that season. Conversely, when Nr was as low as 0.05, the pH in the root zone was raised to values above 7.0 during the winter. However, salinity did not have any effect on the drainage solution pH, but salinity increased the EC of the drainage solution (varying from 8 to 12 mS cm−1), with a more pronounced increase at the lower Nr (Figure S2). Increased salinity and Nr resulted in decreased nitrate accumulation in the drainage nutrient solution (Figure S2).
The impacts of salinity and/or ammonium to total nitrogen levels on mineral content in tomato leaves and fruits is presented in Table 2. Two-way ANOVA revealed that Nr significantly affected the content of p (p < 0.05) in leaves, while salinity significantly affected the content of Mg and Na (p < 0.001), specifically K, P and B (p < 0.01) and N and Zn (p < 0.05), in leaves. The interaction of Nr × salinity affected N content (p < 0.001) in leaves. In fruit, salinity significantly affected Na (p < 0.01), specifically N, K, and Mn (p < 0.05), whereas the interaction of Nr × salinity affected Mn content (p < 0.05). No changes on fruit mineral content were found in terms of the different Nr applications (Table 2).
In leaves, N content increased at low Nr levels (i.e., Nr0.05 + LS), but decreased at ≥Nr0.10 + LS, while the opposite effects were observed in saline-treated plants, with N content increasing at ≥Nr0.10 + HS (Table 2). In contrast, leaf K content decreased (up to 53%) in saline-treated plants, independently of the Nr levels. The content of Mg, Na and Zn was increased in saline-treated plants, and the levels were more pronounced at the high Nr ratio of 0.15 (Nr0.15 + HS). The content of Fe and Mn was greater as a result of the Nr0.15 + HS treatment, while the greater B content was found as a result of the Nr0.10 + HS treatment. No differences were observed in leaf Ca, P and Cu content as averaged in 25.93 g kg−1, 4.01 g kg−1 and 1.74 mg kg−1, respectively.
In the fruits, the content of N, K, Ca, P and Mg was increased in non-saline treated plants and at a low Nr ratio, while Mg was also accumulated in case of a higher Nr ratio in non-saline treated tomatoes (Table 2). Indeed, Na was accumulated in saline treated plants, independently of the Nr ratio. Copper and Mn content was greatest at low Nr ratios in non-saline treated plants. Iron content was increased at Nr0.15 + LS but decreased in saline-treated plants. Both Zn and B remained unchanged in all examined treatments (Table 2).

3.3. Quality Parameters at Harvested Fruits

Harvested fruits were analyzed for quality related attributes. The analysis of variance of the fruit quality data revealed that fruit dry matter content, TSS, Vitamin C content (p < 0.001), citric acid content, color index (p < 0.01), fruit firmness, color b* and Hue (p < 0.05) were all influenced by salinity. The Nr ratio did not affect fruit quality parameters, while the interaction Nr × salinity significantly affected the color index (p < 0.01), Hue and whitening index (p < 0.05), as presented in Table 3.
The content of TSS in tomato fruit was significantly higher in plants grown under salinity (50 mM NaCl), regardless of the Nr ratio, as shown in Table 3. Citric acid content was lower in non-saline grown plants. Fruit firmness was the greatest in the saline-treated plants with a high Nr ratio (Nr0.15 + HS), while a low Nr ratio resulted in decreased firmness. Plants grown in saline conditions produced fruits with increased dry matter content, which significantly differed at Nr0.10 + HS compared to the fruits harvested from the non-saline grown plants. Vitamin C content in tomato fruit was increased at a salinity of 50 mM NaCl at ≥Nr0.10 (i.e., Nr0.10 + HS and Nr0.15 + HS) in comparison to the fruits harvested from the non-saline grown plants.
Fruit lightness was decreased in saline-treated plants compared to the non-saline grown plants (Table 3). A higher L* value in fruit was found in the case of the low Nr ratio in non-saline grown plants, which resulted in the Hue and whitening index being increased and the color index being decreased. The color a* and b* values, and therefore the fruit chroma, was unchanged in the examined NaCl and Nr applications.
The total phenols content increased at the Nr0.05 + HS, whereas the lycopene and β-carotene content was the same for all the treatments, with an average of 0.058 and 0.046 mg g−1 fresh weight for lycopene and β-carotene, respectively (Table 3).

3.4. Organoleptic Test

Sensory evaluation took place through a panel test of the examined samples at the day of harvest for fruit harvested within a 5-days harvesting period (Table 4). Considering the salinity effect, all testers were able to determine variations between the tested samples. Fifty percent of the testers preferred the fruits that were harvested from saline-grown plants, 40% of the testers preferred fruits harvested from non-saline grown plants, whereas only 10% of the participants preferred none of the examined samples (data not presented). Higher aroma and sweetness scores were found in fruit subjected to salinity, while fruit appearance, color, texture, overall satisfaction and marketability did not differ significantly with a salinity of 50 mM NaCl (despite the increased scores in saline treated tomatoes compared to the non-saline treated fruit).
Considering the Nr effect, 90% of the testers could determine differences between samples. Fifty percent of the testers preferred the fruits that were harvested from high Nr ratio (Nr0.15) treated plants, 30% of the testers preferred fruits harvested from Nr0.10 treated plants and 20% of the testers preferred fruits harvested from Nr0.05 treated plants (data not presented). The greatest scores for fruit color were found in the cases of Nr0.10 and Nr0.15 treated plants, while lower color scores were found for the Nr0.05 treatment. All the other fruit quality related attributes revealed similar scores by the testers.

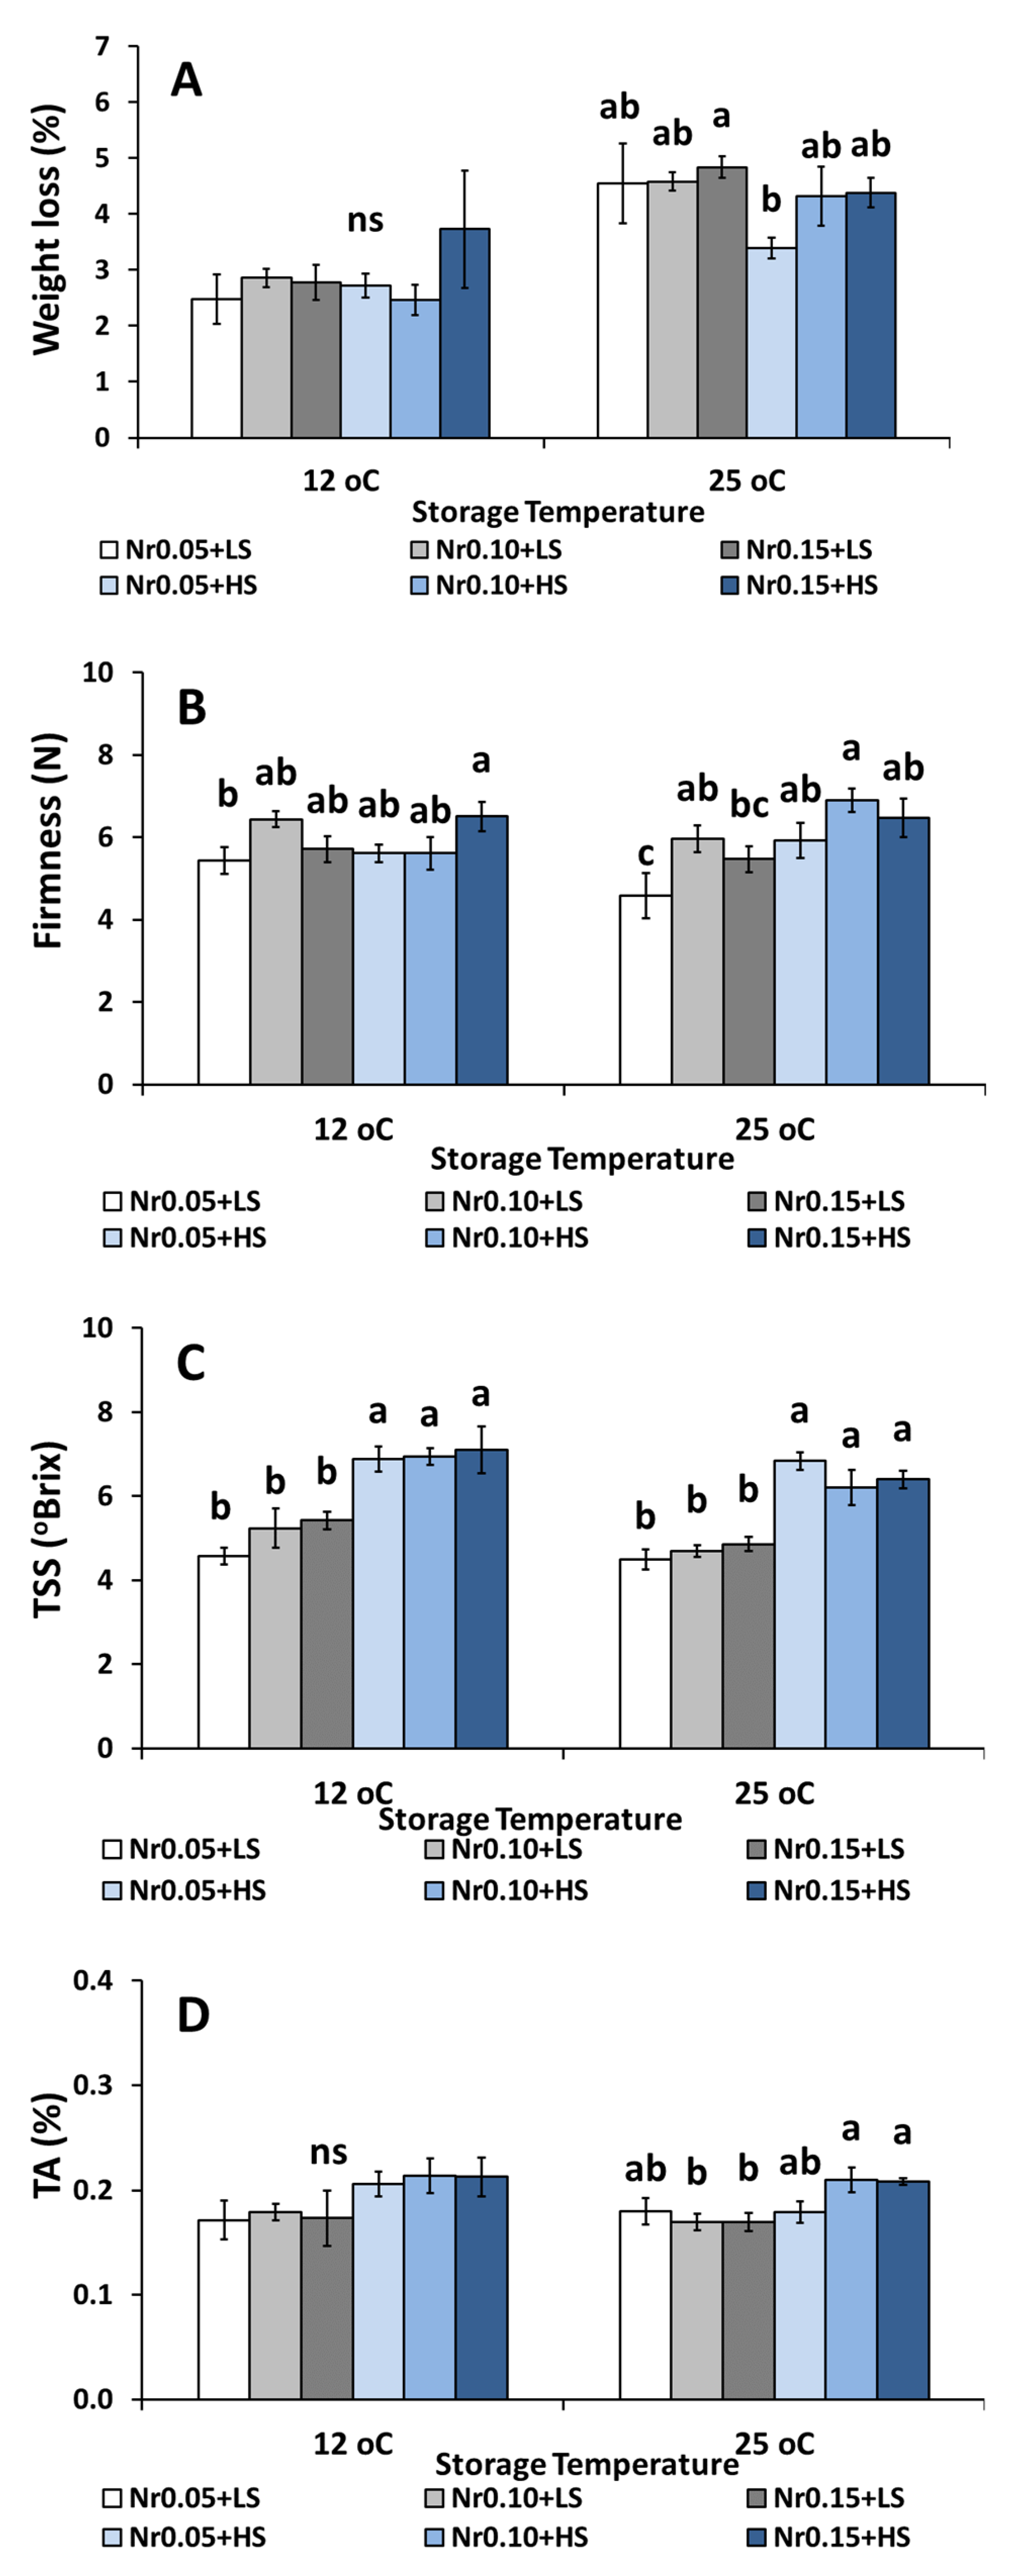
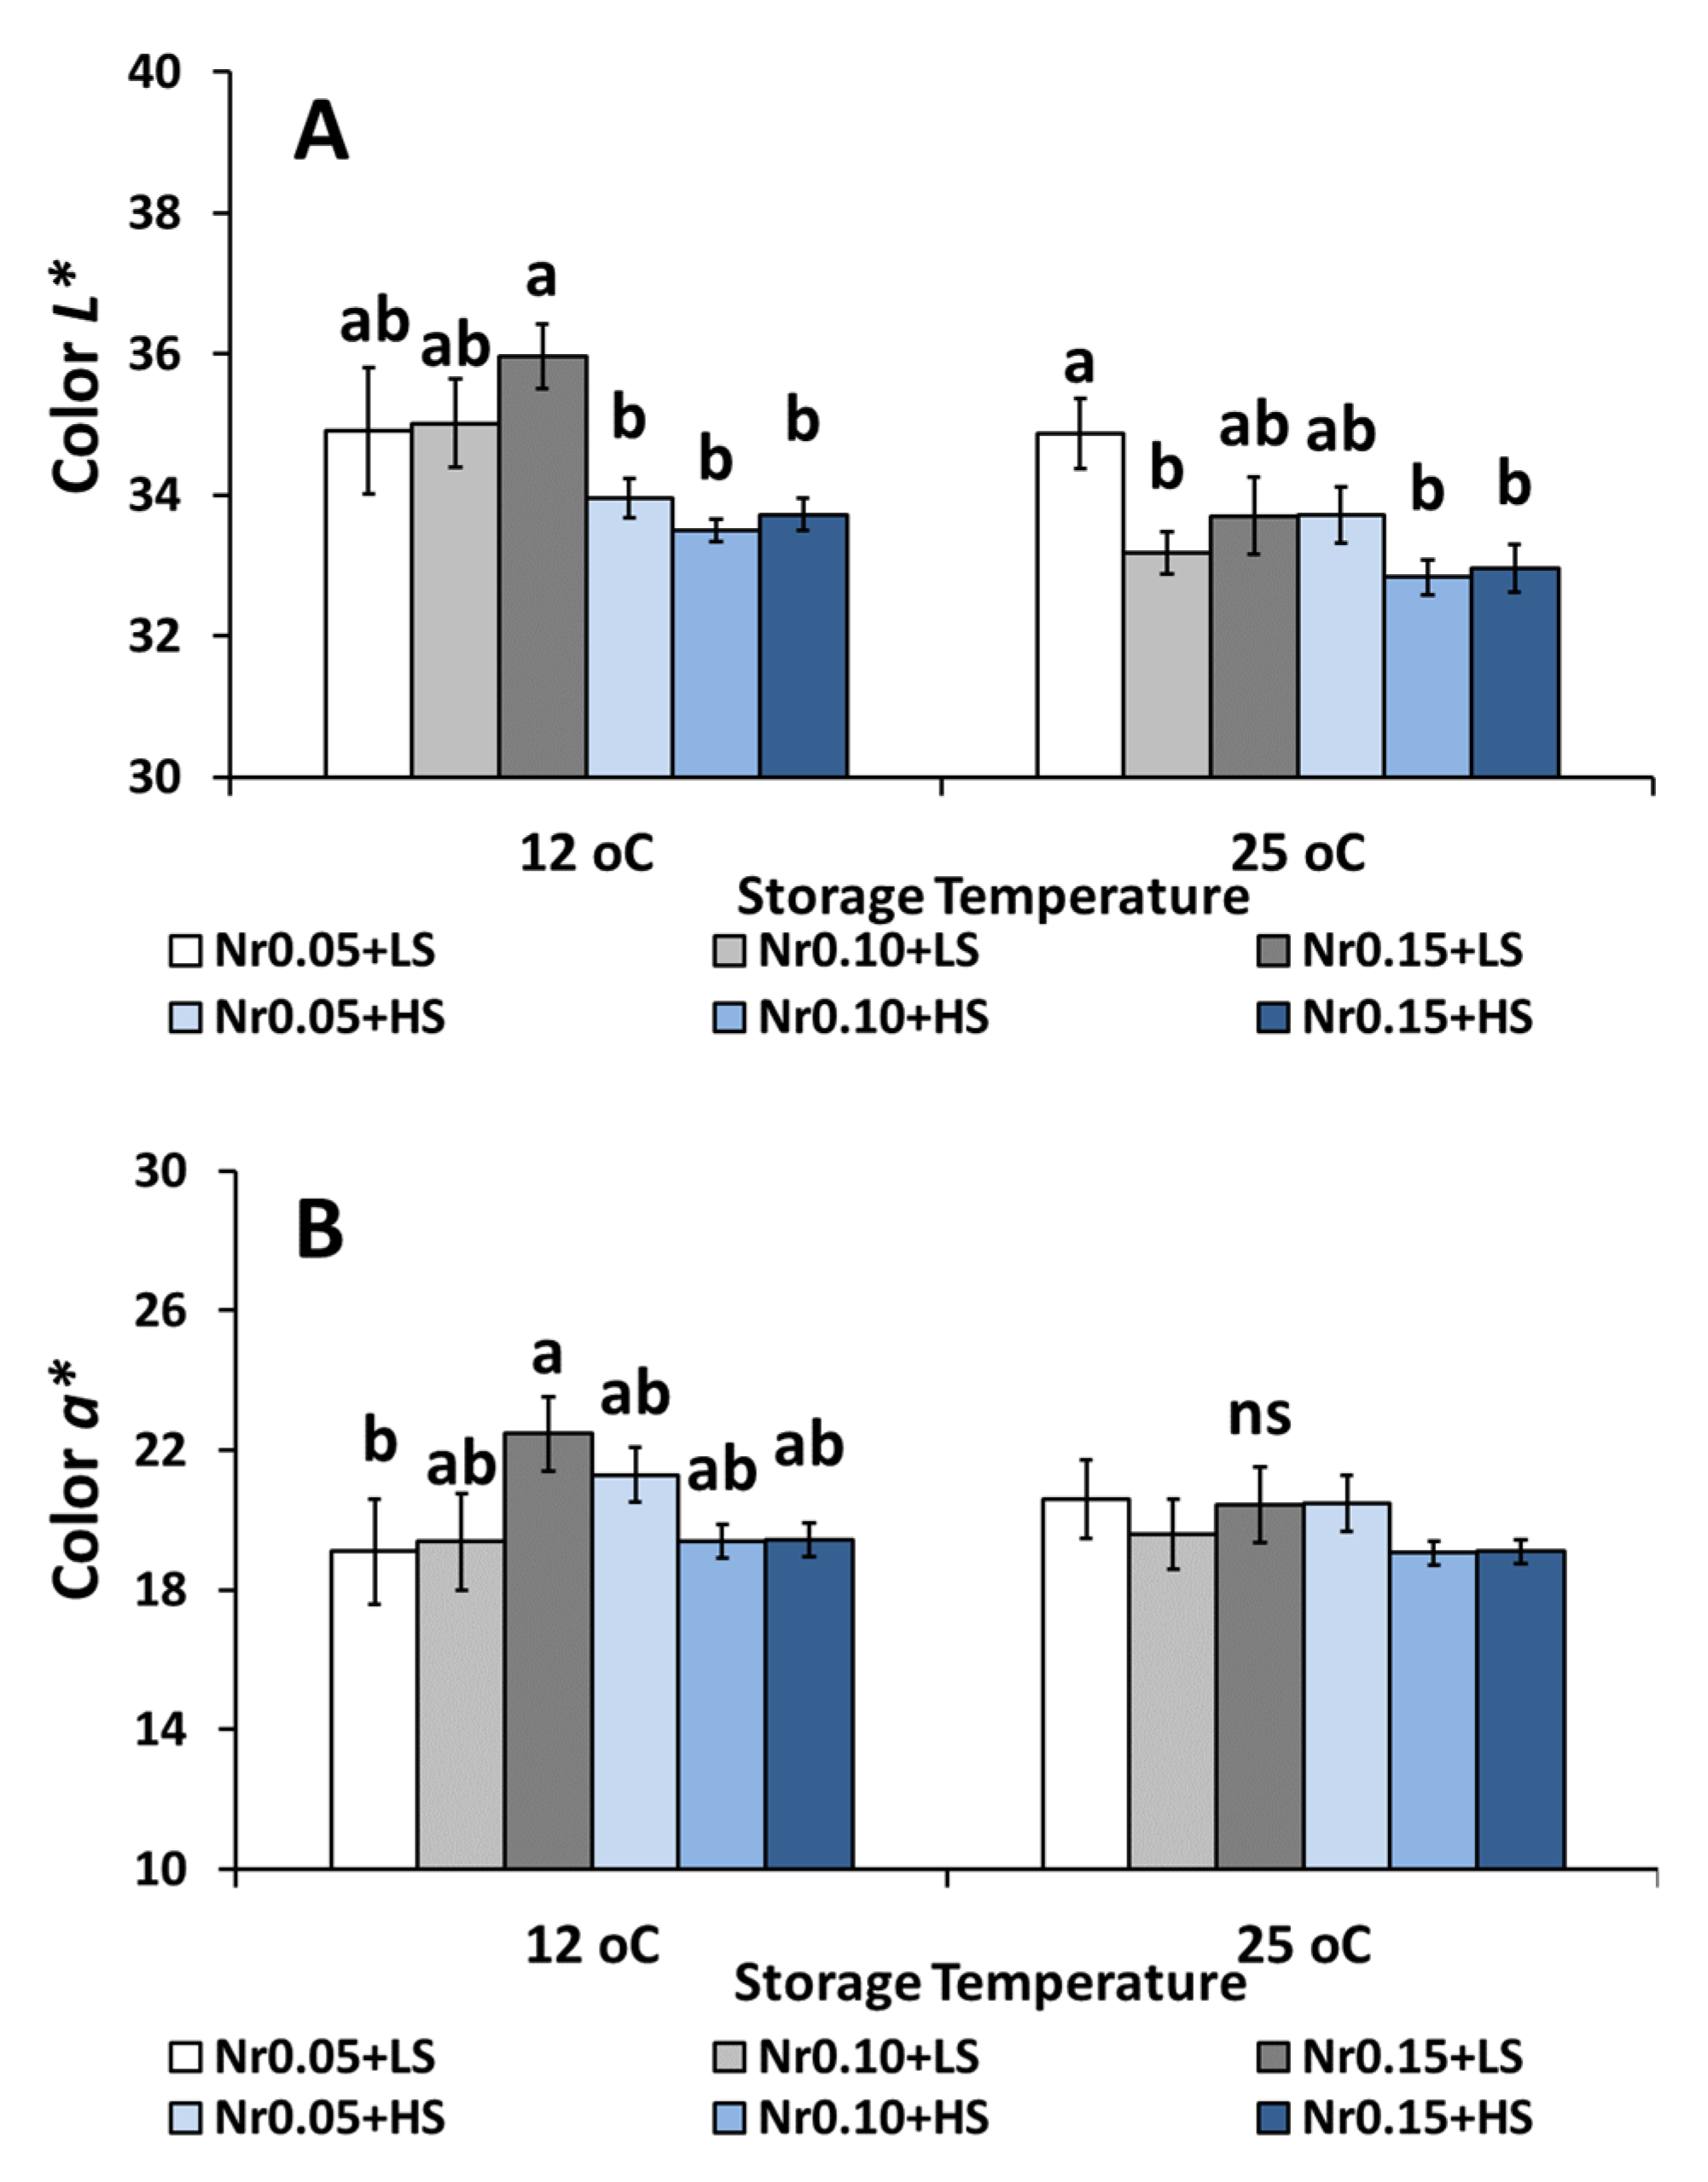
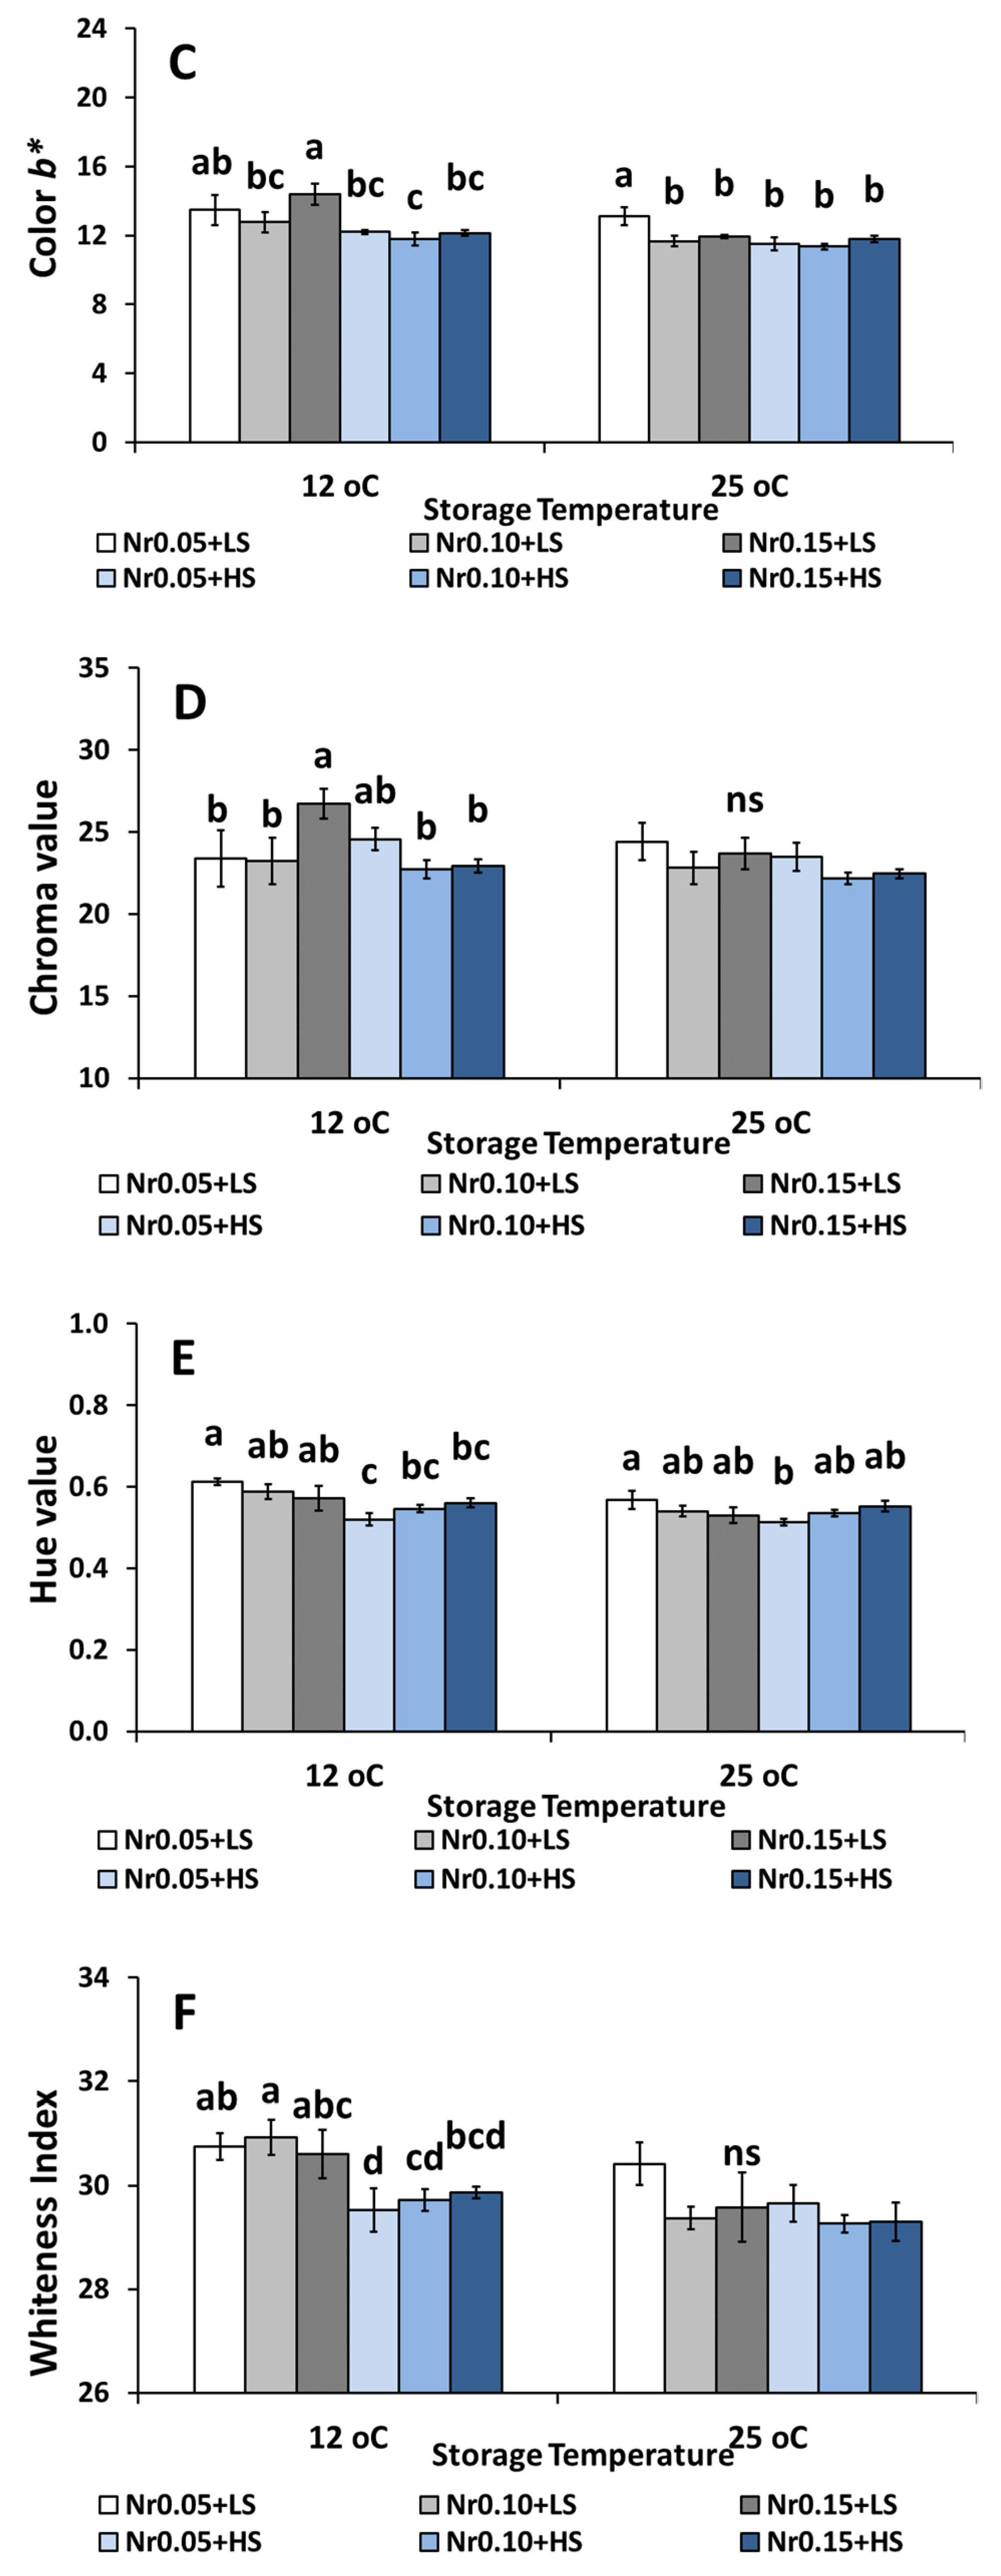
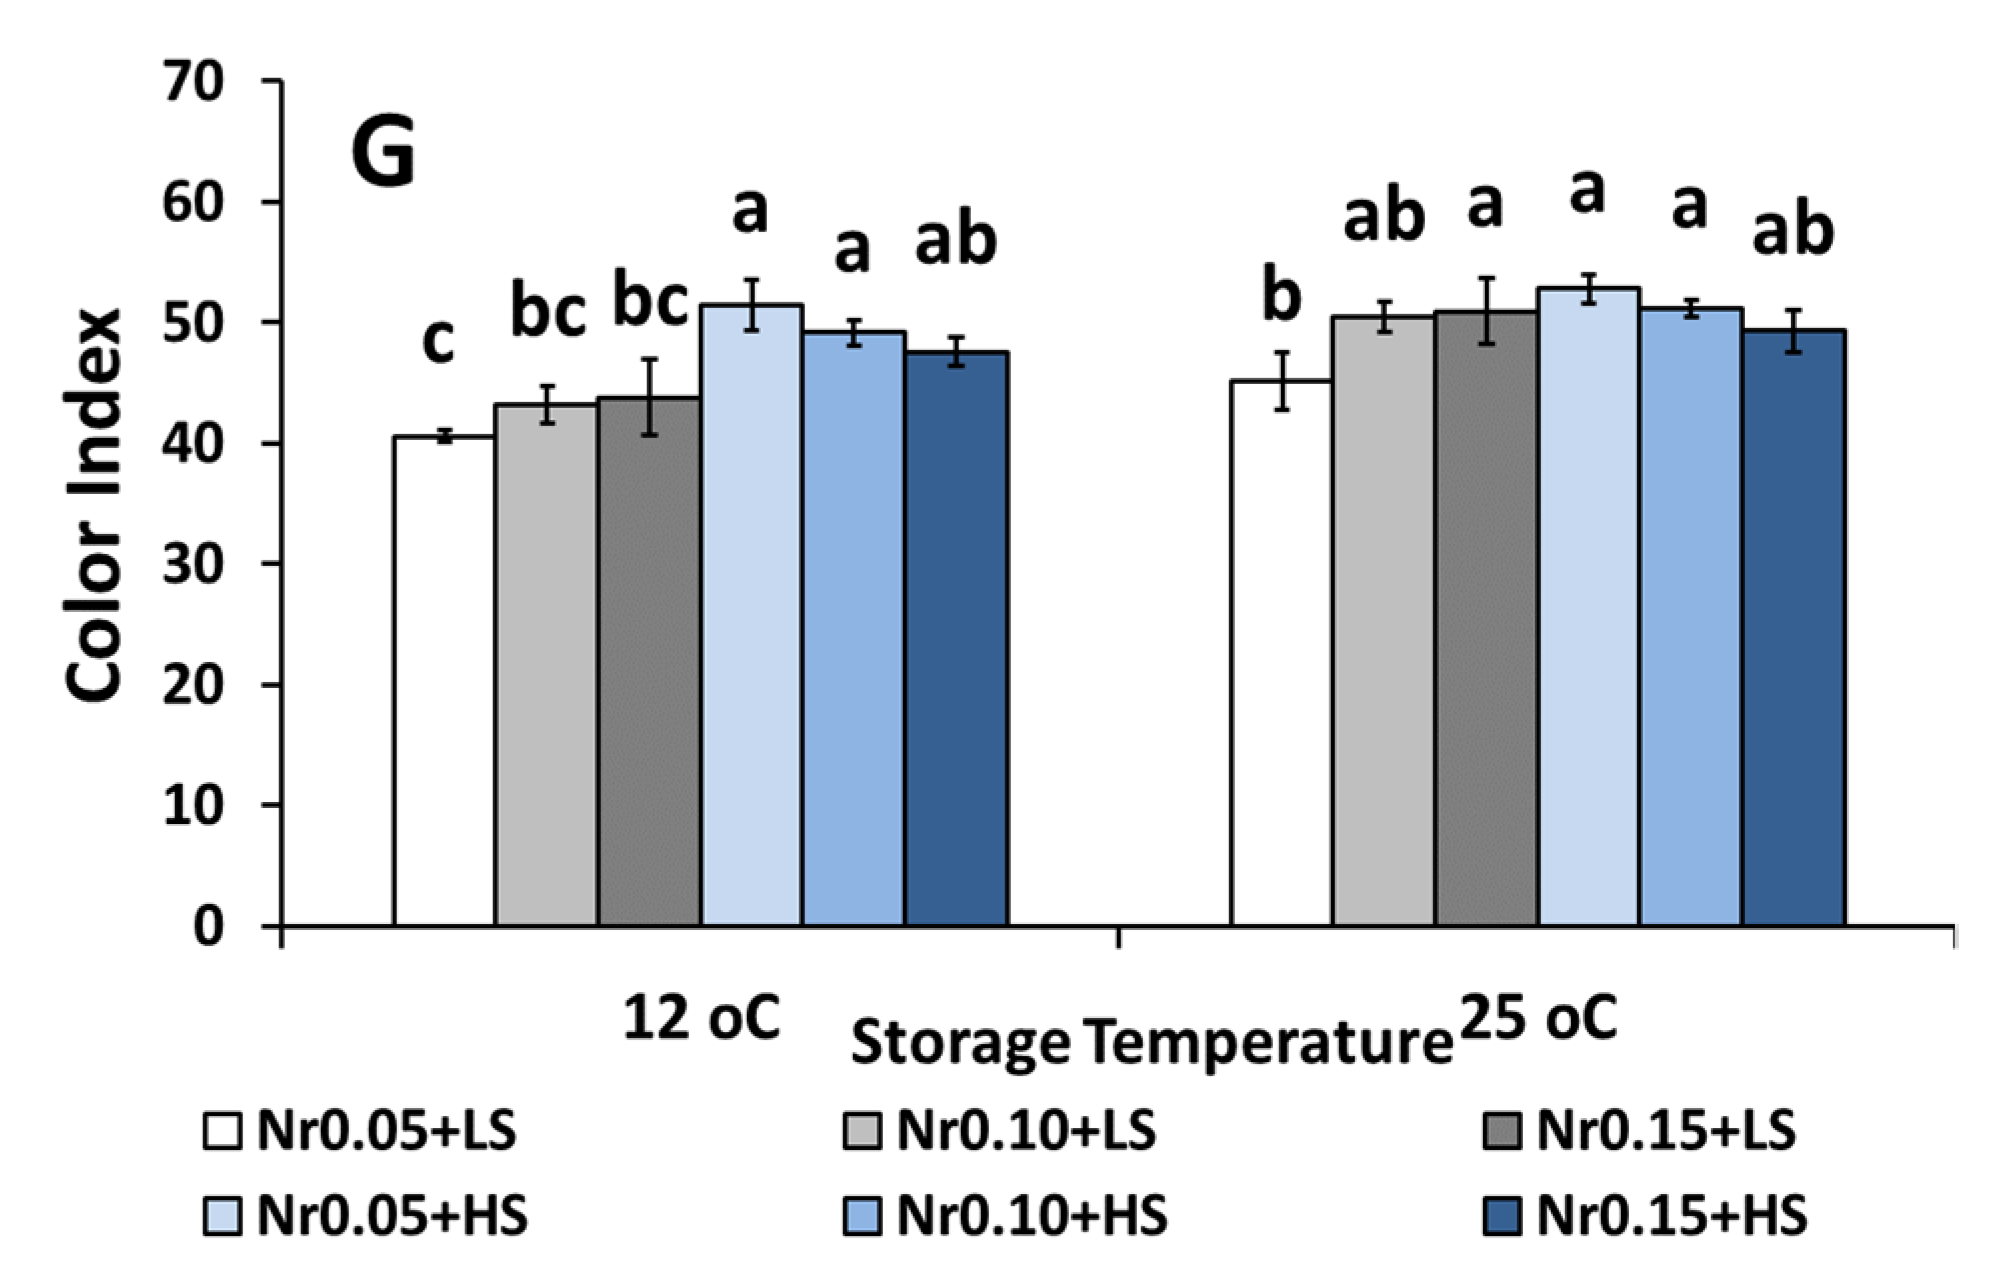
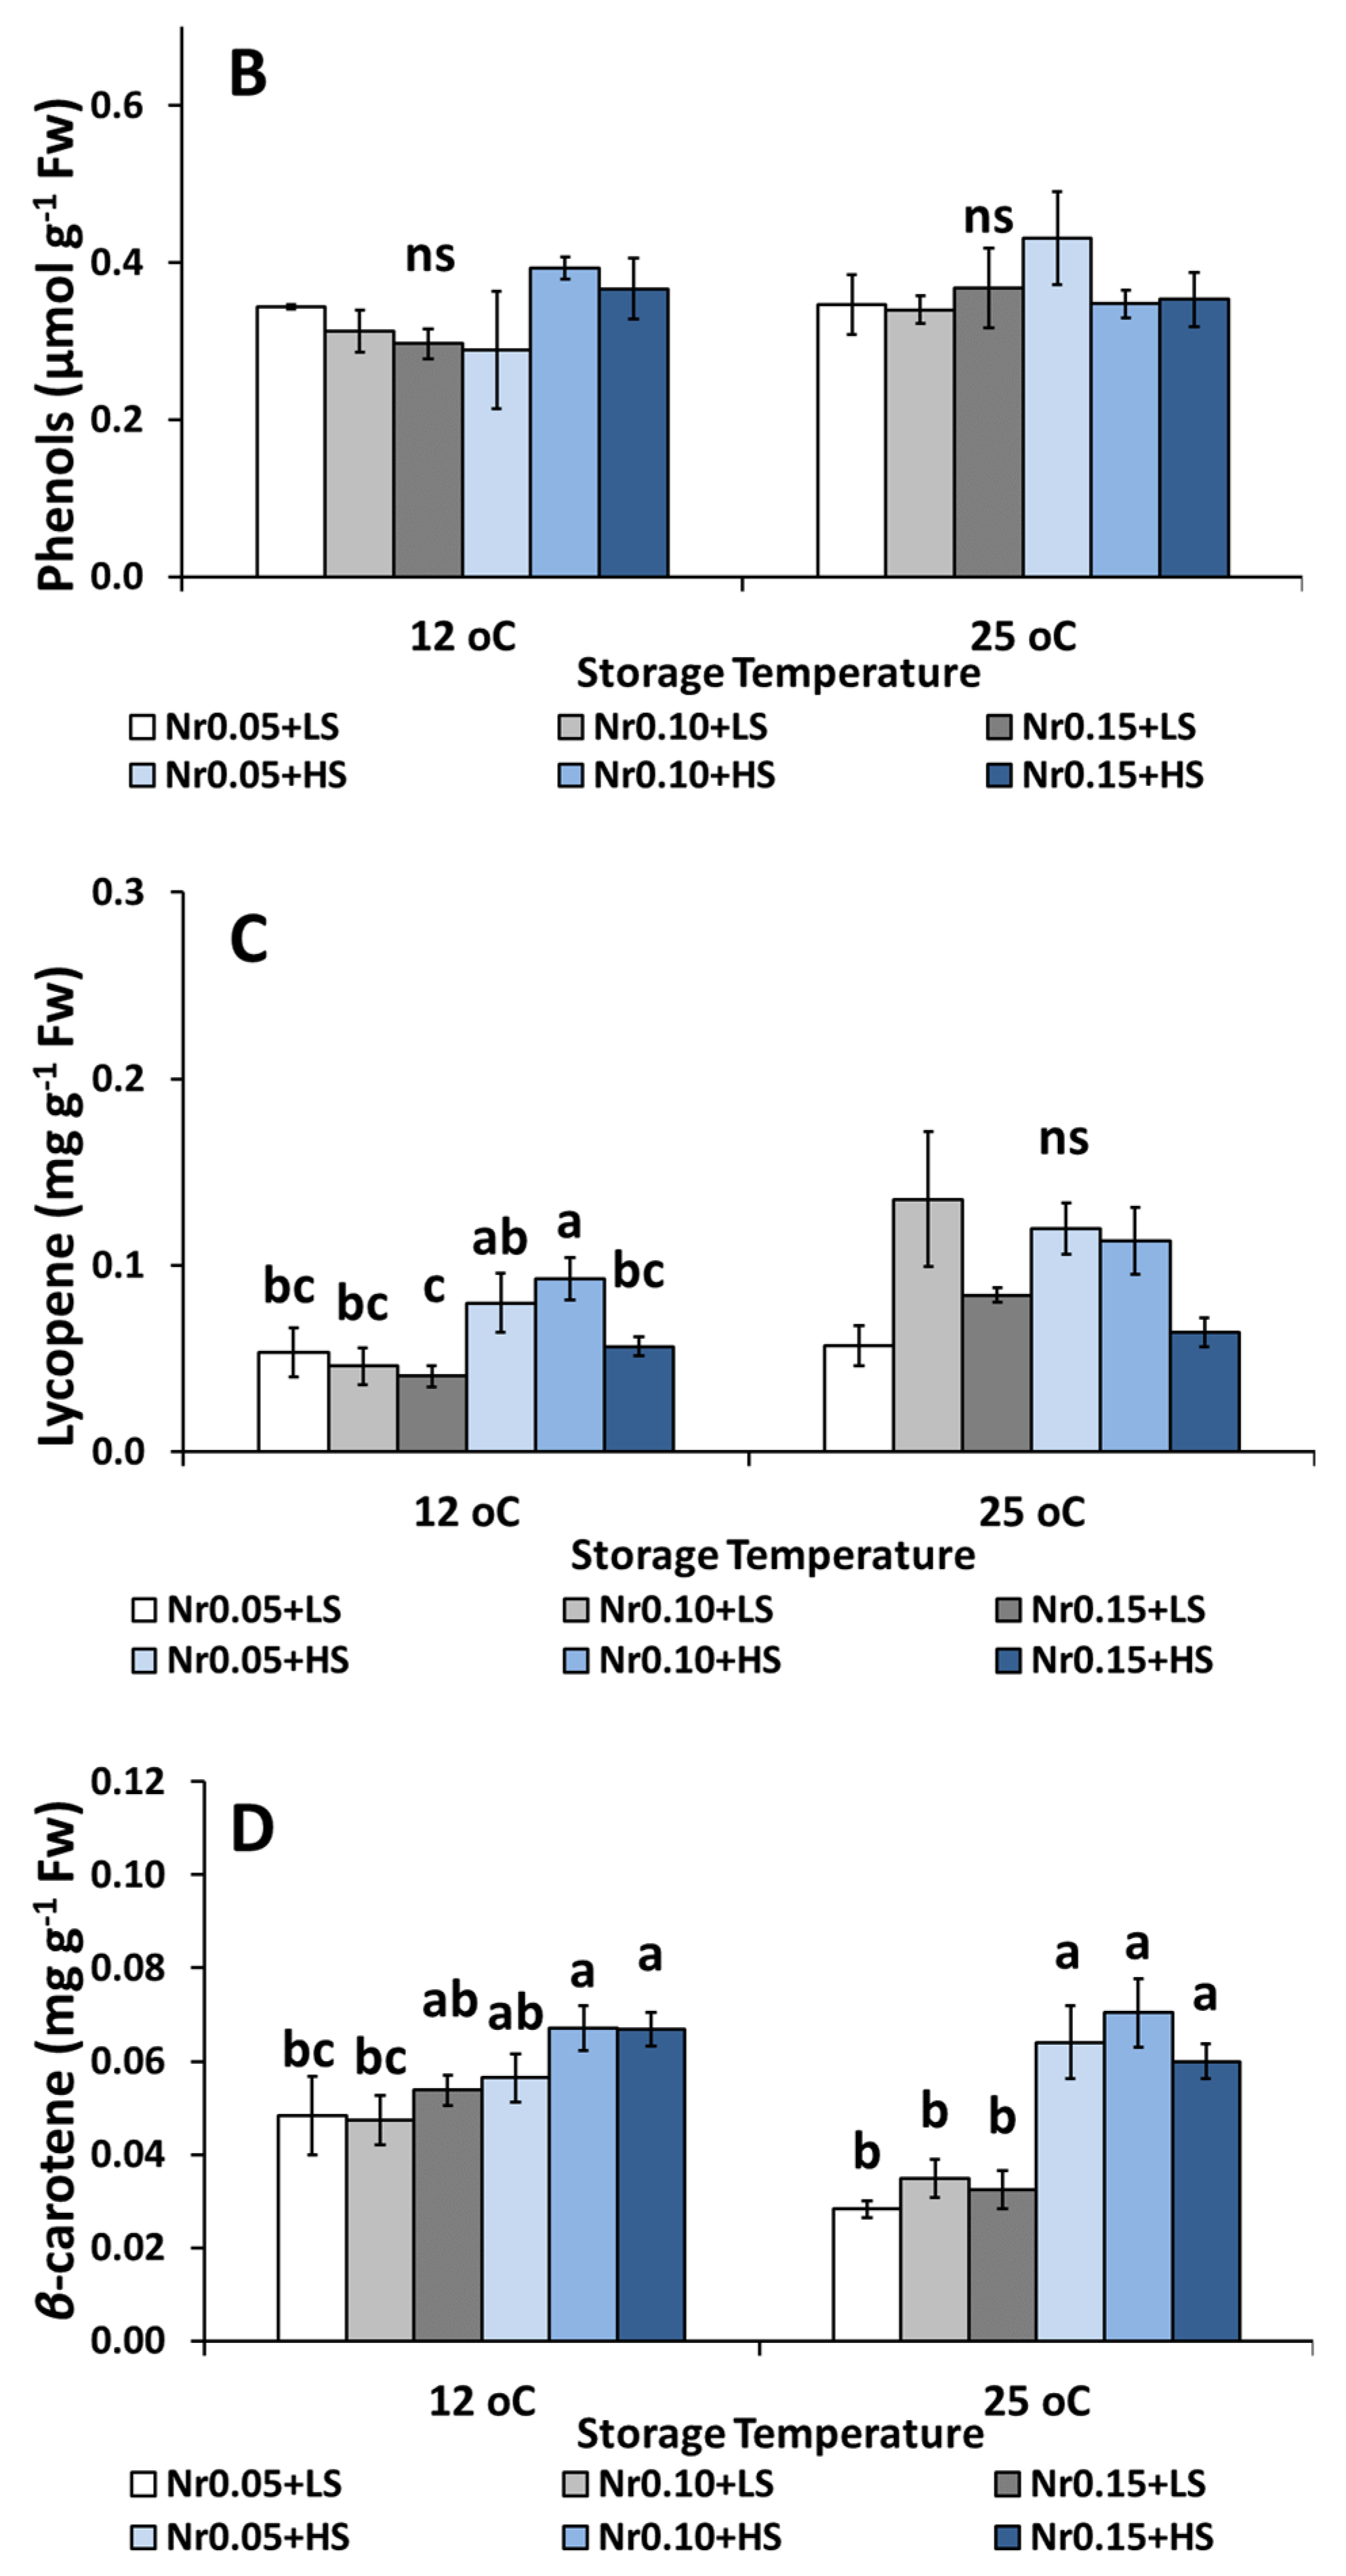
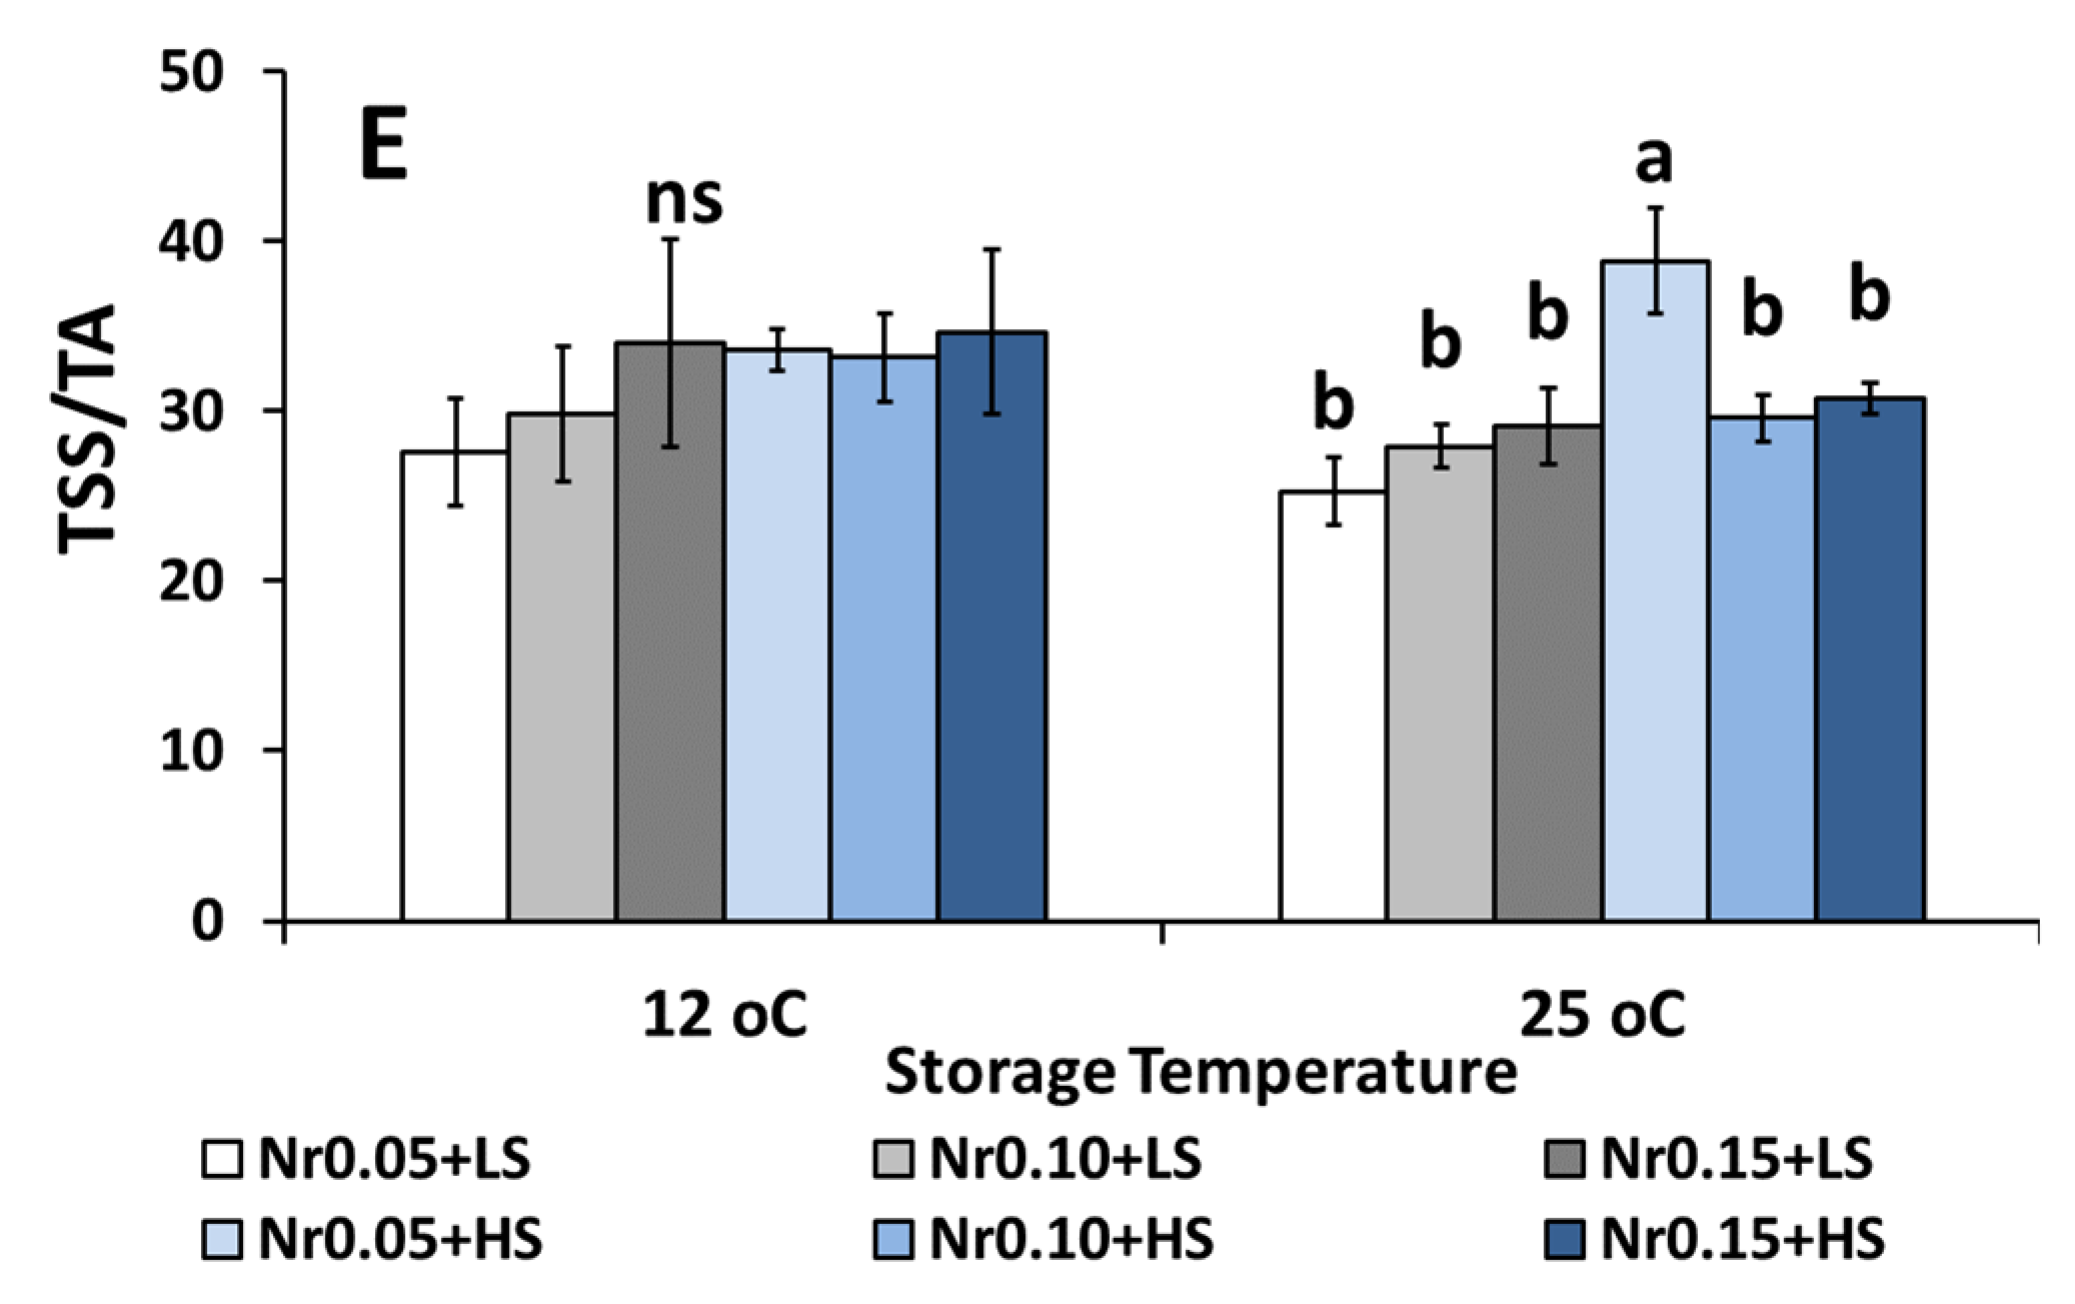
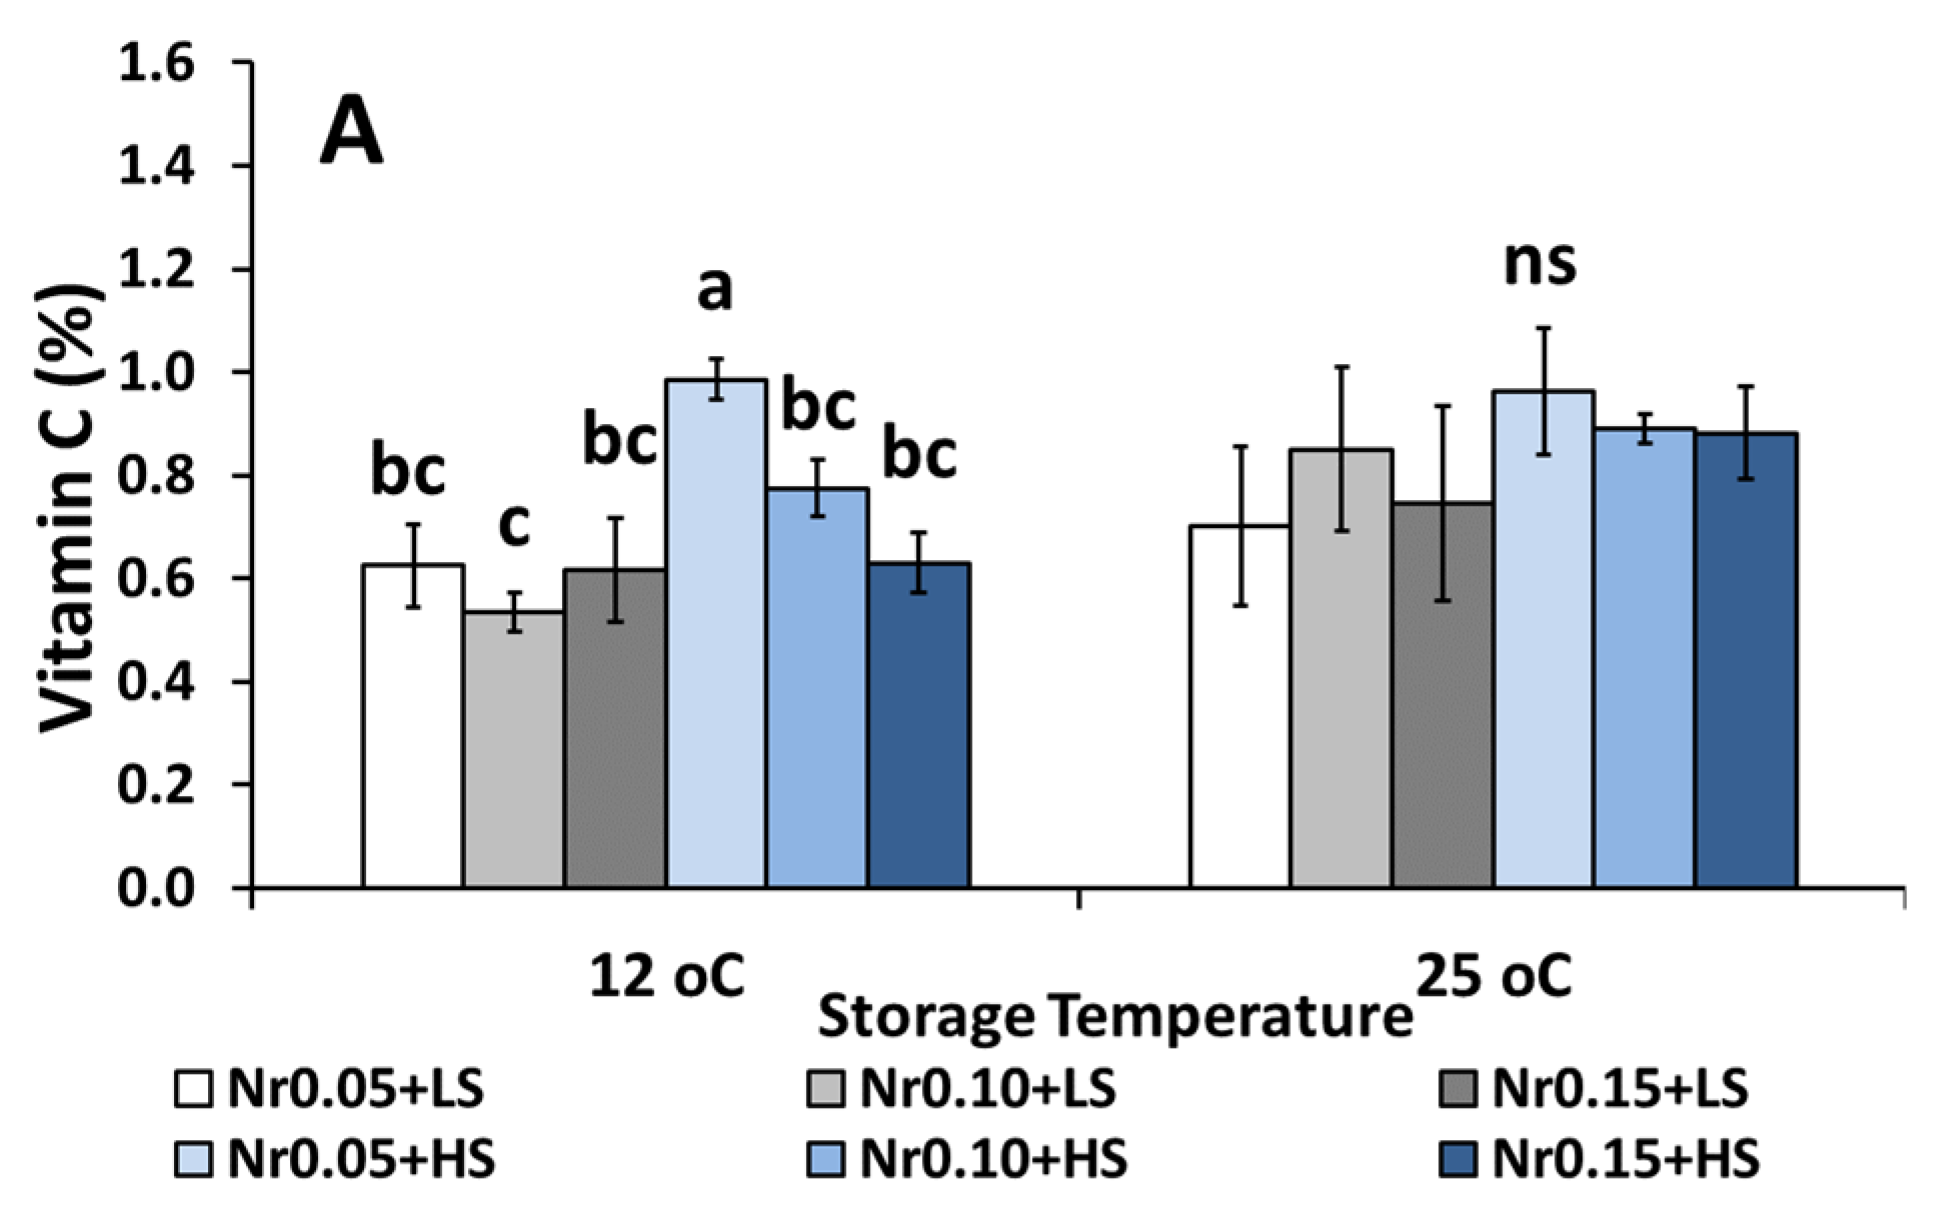
3.5. Postharvest Fruit Quality Attributes

Harvested fruits from plants grown under a salinity of 0 or 50 mM NaCl and/or an ammonium to total nitrogen ratio of Nr0.05, Nr0.10 or Nr0.15 were stored for 7 days at 12 °C and 25 °C, reflecting storage conditions in packinghouse or shelf-life conditions. At 12 °C, fruit firmness was maintained for the Nr0.15 + HS plants in comparison to the Nr0.05 + LS ones (Figure 1B). A salinity of 50 mM NaCl increased fruit TSS, independently of the different Nr (Figure 1C), while the fruit weight loss, TA and ripening index (TSS/TA) were not affected by neither salinity nor Nr (Figure 1A,D,E). At 25 °C, fruit firmness was maintained for the saline-treated plants at all Nr levels as well as for the Nr0.10 + LS treatment in comparison to Nr0.05 + LS (Figure 1B). Fruit weight loss decreased for the Nr0.05 + HS plants compared to the Nr0.15 + LS ones (Figure 1A). Similar to the results at 12 °C, at 25 °C, fruit TSS was increased in saline-treated plants, independent of the different Nr ratios (Figure 1C). Fruit titratable acidity was increased at ≥Nr0.10 in saline-treated plants compared to the non-saline treated plants (Figure 1D). The highest ripening index was observed for the Nr0.05 + HS plants in comparison to the other treatments (Figure 1E).
Fruit color attributes were more affected in commodities stored at 12 °C than in commodities stored at 25 °C (Figure 2). At 12 °C, Nr0.15 + LS treatment revealed fruits with increased lightness (L*), redness (a*), yellowness (b*) and chroma (Figure 2A–D). The greatest Hue value was found for the Nr0.05 + LS plants, the greatest WI was found for Nr0.10 + LS plants, while the greatest color index was observed for Nr0.05 + HS plants (Figure 2E–G). At 25 °C, the Nr0.05 + LS treatment revealed fruits with increased lightness (L*), yellowness (b*) and Hue values (Figure 2A–E) but with a lower color index (Figure 2G). Indeed, no differences were found in color a*, chroma and WI among the saline and/or Nr treatments at 25 °C storage conditions (Figure 2B,D,F).
At 12 °C, fruit vitamin C was increased in the case of Nr0.05 + HS (Figure 3A). Lycopene content was increased for Nr0.10 + HS plants in comparison to Nr0.05 + LS, Nr0.10 + LS, Nr0.15 + LS and Nr0.15 + HS plants (Figure 3C). The content of β-carotene was increased in the cases of Nr0.10 + HS and Nr0.15 + HS in comparison to the Nr0.05 + LS and Nr0.10 + LS plants (Figure 3D). The total phenols content in fruits was similar in both of the storage conditions in terms of temperature for both the saline and Nr treated plants (Figure 3B). At 25 °C, the content of β-carotene in fruits was increased in the saline-treated plants compared to the non-saline treated plants, independently of the Nr (Figure 3D). Similar to the total phenols content at 25 °C, the vitamin C and lycopene content remained unchanged for all treatments (Figure 3A,C).

4. Discussion

In the present study, which examined the impact of salinity and/or the ammonium–nitrate ratio (Nr0.05; Nr0.10 and Nr0.15) on tomato cultivation, the results revealed that NaCl-salinity significantly reduced the vegetative growth of tomato plants to the degree that the plant height, stem diameter, fruit fresh weight and total yield were directly affected. Other parameters such as the number of leaves per plant were not significantly influenced. The reduction in vegetative growth and yield under high salinity treatment is consistent with the results of Psaras et al. [40], Stamatakis et al. [41] and Costan et al. [35] concerning tomato crops. However, a different response was observed in an eggplant crop under salinity, where the vegetative parts and the leaf area were not significantly reduced by moderate levels of salinity and the most detrimental effects were observed on mean fruit weight and yield [42]. These findings further support the notion that the eggplant species is less sensitive to salinity stress than the tomato species. Furthermore, our findings showed that growing tomato plants in saline conditions increased the occurrence of BER symptoms by up to 9.4 percent, decreasing the marketability of the fruit significantly. Zhai et al. [43] found that high salinity increased the incidence of BER because high salinity is related to impaired Ca2+ uptake, which is the primary cause of BER symptoms.
The increased NH4+ levels in the present study did not greatly affect the growth and yield of tomatoes, possible due to the low NH4+ levels used. However, in the context of a higher Nr ratio in cucumber plants, plant yield was significantly decreased [20]. This decrease in yield due to the increased Nr within the N supply might be attributed to the inhibition of the uptake of K+ and other cations [44]. In an early spring trial, providing 30% of total N in the form of NH4+ significantly enhanced both the fresh and dry shoot weight of lettuce [19].
With respect to the nutrient solution, pH was both affected by the Nr ratio as well as the environmental conditions. A more intense drop in the pH value was observed under a high Nr and under the cold weather conditions of winter, while higher spring temperatures spring might alleviate the high Nr effect. In general, an increased Nr leads to pH reduction due to the release of H+ ion into the nutrient/soil solution [19,22]. The impacts of a particular NH4+-N/total-N supply ratio may be quite different in an opened hydroponic system than in a closed one [19]. It is well known that too high or too low pH values in the root environment of plants may quickly result in nutrient deficiencies or toxicities, even when the supply of nutrients is optimal [32].
Nitrate accumulation either in the drainage solution or in the plants is related to low light density and low–cool temperatures, whereas these conditions were observed in the glasshouse from December to the middle of February. At the same time, the accumulation of nitrates in the drainage solution reached its peak during this period. The positive correlation of nitrate accumulation in the drainage solution and the plants with the weather conditions occurs mainly due to the incapability of the plants to absorb and/or metabolize the nitrates due to reduced photosynthesis rates and the reduced activity of the enzyme nitrate reductase under these conditions (poor light density, cool temperatures) [45]. Furthermore, ammonium increases the acidity of the cells and decreases the permeability of the cell membrane, leading to an inhibition of nitrate absorption and reduction. This is consistent with the present study, where the highest accumulation of nitrate in the drainage solution was observed under high ammonium rates.
In terms of leaf nutrient content, the results showed that the levels of Ca in the leaves did not change regardless of the treatments used. This is consistent with the findings of Tuna et al., who claimed that Ca is replaced by Na in cell membranes during salt stress [46], and previous studies on tomato crops subjected to salinity [35]. As in the case of Ca, p and Cu levels also remained unaffected by the tested treatments. Several previous studies have shown that salinity either increases [35] or has no effect on p uptake [47,48]. Additionally, it has been reported that p levels increased in a mountainous population of Cichorium spinosum but were unaffected in the seaside population when plants were subjected to the application of increased Nr [22]. As a result, it is reasonable to believe that a variety of factors influence p uptake, including temperature, water availability in the root environment, species and even cultivar [49]. Salinity decreased K levels in the present study, and these data indicate that K+ and Na+ are in competition. The decrease in K levels in leaf tissues is consistent with the findings of del Amor et al. and Atluntas et al., who revealed that a decrease in K content is balanced out by an increase in Na content [50,51]. Similarly, when plants were cultivated in a saline environment, Na+ levels are much greater, which is confirmed by the results of del Amor et al. [50] and Costan et al. [35]. The Zn levels in the present study were increased with the application of 50 mM NaCl and with high Nr levels, in comparison to saline with low Nr treatments and/or non-saline conditions, indicating the interactive role between ammonium and sodium ions. Indeed, salinity itself had previously been shown to increase Zn levels in tomato leaves [35] and lavender leaves [52]. Finally, the fact that Fe and Mn content increased with the application of saline and high Nr is in agreement with the findings of Turan et al., who have stated that salinity increases the concentration of Mn in the shoot and root tissues of maize [53]. It has also been reported that increased Nr levels result in decreased Zn, Cu and Mn levels in C. spinosum [22].
Regarding fruit nutrient status, Ca content was negatively influenced with an increasing Nr due to NH4+/Ca2+ competition, while Na+/K+ and Na+/Ca2+ competition also occurred under high salinity. Reduced Ca content in fruits can lead to BER disorder, which is quite common in the case of tomato crops. In the present study, this disorder appeared above the third cluster, and ranged from 7–9.4% in the fruits where salinity was applied, with Nr0.05 giving the lowest value, while the percentage of the fruits with BER was increased at higher Nr ratios. Potassium content decreased with salinity, especially at increased Nr ratios, with the application of Nr0.15 under high salinity giving the lowest value. This indicates the strong competition of K+ with both NH4+ and Na+ in this case. Similar results were found by Adler and Wilcox in a study with respect to salt-stressed muskmelon plants, suggesting that the influx of Na is regulated by K/Na selectivity and exchanges across cell membranes [54]. Additionally, an increased Nr ration resulted in the decreased content of several minerals in cucumber fruits [44]. Phosphorus content was reduced by salinity at low Nr. In general, salinity decreases the concentration of p in plant tissue [35,55], with several contradictions being present in previous studies, as it has been indicated that salinity either increased or has no effect on p uptake. Plant growing conditions, the plant type and even the cultivar play an important role in p accumulation [49]. In the present study, the reduced Mg content in the context of high salinity at Nr0.05 indicates competition between Mg and Na but not with ammonium ions. The nitrogen content of the fruits decreased with salinity at low and moderate Nr levels, which could be attributed to the reduced nitrate uptake and translocation into the plant under high salinity conditions. In the present study, the nitrogen content of the fruits was restored when nitrogen was supplied in ammonium form (Nr0.15). The application of an increased Nr ratio to hydroponically grown cucumber resulted in decreased Ca, Mg, K Cu, Mn and NO3 content in cucumber fruits [44].
Low pH values are considered to be responsible for increased Al released from the perlite into the drainage solution; this is consistent with the results of the present study, which indicated the Al increment at low pH values (increased Nr). Iron content was increased by increasing the Nr under low salinity. This is consistent with Flores et al. [56], who, in the context of a tomato crop, indicated an increased correlation between nitrogen assimilation and the levels of Fe by adding nitrogen in ammonium form, resulting in reduced energy requirements for plant growth. Salt stress reduced the Cu content, and this has also been evidenced in salt-stressed maize grown in both soil [57] and solution cultures [58]. Manganese content was suppressed by salinity and a high Nr ratio (Nr0.10; Nr0.15). Salinity reduces Mn content in the shoot tissue of horticultural crops, for example, squash [59] and corn [57], according to most research, regardless of whether they were grown in soils or in solution cultures. However, some studies on tomato crops have shown that salinity either has no effect [60] or increases the Mn content [59] of leaves or shoot tissue.
Several quality characteristics of the tomato are influenced by salinity and the Nr ratio. Citric acid content in general significantly increased with salinity. The increased acidity of salt-stressed vegetable crops has been reported for tomatoes [35,41] and eggplants [42] and has been associated with an increase in the level of organic acids which are involved in the osmoregulation mechanism of plants under high salinity conditions [61]. The total soluble solid contents were also significantly higher under high salinity, and were not affected by either the Nr or by the storage temperatures. The beneficial effects of salinity on soluble solids content are consistent with prior research [40,62], though it should be noted that when results are expressed on a fresh weight basis, such an increase could be due to a concentration effect rather than an increase in total soluble solids [63]. Additionally, Ben and Kafkafi [64] previously reported that TSS in melon fruit remained the same when the melon plants exposed to different Nr levels. Fruit firmness was influenced by both salinity and the Nr ratio. More specifically, salinity had a positive effect on fruit firmness at the point of harvest, while the Nr ratio had a positive effect only under high salinity conditions or following storage. As expected, the dehydration due to weight loss of the tomatoes stored at room temperature was much more intense than the ones that were stored at 12 °C and remained unaffected by salinity or Nr.
The vitamin C content of the fruits was higher due to salinity at the point of harvest, while an increased Nr ratio decreased the vitamin C content under high salinity conditions following storage for a week at 12 °C. Storage at room temperature diminished the effect of both salinity and Nr on vitamin C content. These enhancing effects of salinity on fruit firmness and vitamin C content of tomato are in agreement with the results of other investigators [65,66]. The effect on concentration impacts originates from reduced water content in the fruit due to plant adaptation to salinity. Other investigators [32] obtained fruits with lower firmness (softer fruits) when the Nr was increased by more than 0.15.
Plant stress factors such as salinity play an important role in terms of the antioxidant content of fruits. The total phenol content was increased by salinity at low Nr at the point of harvest. Moreover, the content of lycopene and β-carotene increased in fruits derived from the saline treated plants following storage at 12 °C. However, the Nr levels seemed not to affect the fruits’ antioxidant-related measures (vitamin C, lycopene, β-carotene and total phenolics) at the harvesting stage, but decreased vitamin C and lycopene levels were found in fruits stored at 12 °C for 1 week in relation to high salinity and Nr ratio treatments. Tomato fruit has been found to contain more total phenols when grown in saline conditions [62], while lavender plants have been found to contain more total phenols when grown in salinity levels of more than 50 mM NaCl [52]. Similar to the findings of our study, Serio et al. found that lycopene content was unchanged in tomato fruit when plants were exposed to salinity [67]; however, Moya et al. found the opposite [62]. These contradictory outcomes could be related to the severity of salinity stress, since different NaCl levels were applied in these studies and mild stress (4.5 dS m−1) appears to be favorable to tomato fruit lycopene content when compared to more severe stress (6.0 dS m−1).
Moderate salinity enhances fruit carotenoid content in tomato [66], possibly via the activation of the biosynthetic pathway, inducing up-regulation of the genes encoding the enzymes related to lycopene levels [68]. Concerning the tomatoes that were stored at room temperature, only β-carotene content was increased due to the increased EC of the nutrient solution. Similar results regarding salinity and increased antioxidant activity were observed in pepper fruit but only in mature red fruits while at the green (immature) stage, the results were controversial [69]. Furthermore, in previous studies, the antioxidant status of tomatoes increased after ten days of storage in similar conditions (15 °C and 25 °C respectively), whereas the lycopene content was 1.8-fold higher than that of refrigerated tomatoes (7 °C). This could be explained due to a reduction in the water content of the fruits stored as well as the slowdown of the fruits’ metabolism in chilled temperatures [70].
Regarding the color of tomatoes, salinity decreased fruit lightness at the point of harvest, as reported in previous studies on tomato [66], while the values a* (red colour) and b* (yellow colour) were not affected. After storage at 12 °C for a week, all color factors were improved with increasing Nr, while salinity in general had a negative effect. Following storage at 25 °C, salinity decreased the lightness of the tomatoes at high and low Nr. This is not consistent with research in which salinity in general improved color factors due to the increase of tomato pigments (lycopene and β-carotene) [30], although, in our study, only β-carotene increased at high salinity levels and lycopene was affected to a lesser extent, with this being in agreement with previous reports on tomatoes under saline conditions [35].
Following organoleptic tests, the increased Nr improved the fruits’ appearance, color, marketability and aroma, with significant higher scores associated with fruit color according to the panelists, and with the fruits cultivated under Nr0.10 and Nr0.15 getting more positive records than the Nr0.05 sample. The fruit of the 50 mM NaCl treated plants performed better in terms of aroma and sweetness scores. In addition, the texture, satisfaction level and marketability of the salinity treated fruit received the best numerical score. The results of the questionnaires back up previously stated findings that salinity has a positive effect on some quality measures of tomato fruit. According to research, increased salt levels in NS result in increased fruit dry matter, sugars and organic acid content, as well as improving flavor and maintaining firmness in hydroponically produced tomato plants [71,72]. The findings of our study highlight the relevance of organoleptic tests in addition to chemical composition investigations because consumer approval is critical for fruit marketability.
The storage temperature did not greatly affect fruit metabolism due to a short duration of 7 days and the ripening stage of the fruits (red fruits). Indeed, fruits stored at chilled conditions at 12 °C, in comparison to those strored at 25 °C, revealed lower fruit weight loss, as chilled conditions delayed the plant’s metabolism and the evapotranspiration of the plant tissue. Neither storage at 12 °C or 25 °C, nor Nr levels affected the total soluble solids content of the fruits, while salinity increased TSS. The vitamin C content at 12 °C was increased at low Nr levels with the application of salinity, which is in agreement with previous studies which reported an increase in vitamin C content in tomato fruit grown hydroponically under saline conditions [41]. However, Vitamin C was unaffected in the case of fruits stored at 25 °C. Storage for 7 d showed that the content of vitamin C, lycopene, β-carotene and total phenols was almost the same or slightly higher than prior to storage, regardless of storage temperature, Nr level and salinity level (with exception of lycopene and β-carotene content, which were increased with the application of salinity at 25 °C), a finding which is very important for the preservation of fruit quality. Similar to the present results, it has been reported in previous studies that lycopene content in tomatoes stored at 15 °C and 25 °C was higher (1.8-fold) than in refrigerated tomatoes (7 °C) [70]. Fruit quality is influenced by genotype. Manzo et al. found substantial differences in post storage quality between short and long shelf-life cultivars [73], while Petric et al. emphasized the need of maintaining good post-storage quality at the right temperature [74]. Following storage at 25 °C, no differences were observed between the salinity levels concerning color attributes (L*, a*, b*), owing to the fact that all the tested fruit were harvested at the mature red stage and that no further color development should be expected after this stage, but also the fact that lycopene content, which is responsible for the red color of the fruits, remained unaffected for all the tested treatments [73].

5. Conclusions

This study explored the effects of salinity on hydroponically grown tomato plants and evaluated whether the application of different Nr levels affected the negative effects posed by NaCl stress. Moreover, the postharvest performance of fruit stored either in chilled conditions or at shelf life was examined. Despite the negative effects of salinity on plant growth as well as yield, the fruit fresh weight was only decreased significantly with the application of high Nr. Salinity and high ammonium ratios (high Nr) induced nutrient imbalances in the fruit, such as Ca, and affected BER in fruits, the symptoms of which appeared on the fruits above the third cluster after five months of tomato cultivation (March) and did not affect the marketability of the examined fruits. It was profound that salinity improved and/or maintained various fruit quality related attributes, including total acid content, total soluble solids content, firmness and vitamin C content, while an increased Nr also preserved fruit firmness after storage. These characteristics are considered favorable by consumers and are important in terms of fruit storability and postharvest life. Lycopene, β-carotene and vitamin C were increased by salinity during harvesting or following storage. The organoleptic control showed that tomato fruits cultivated in an increasing Nr or under high salinity were more preferable to consumers due to the improvement of some organoleptic characteristics. Salinity enhances fruit quality and improves the organoleptic characteristics of the crop, while an appropriate Nr ratio may restrict the negative effects of salinity on the nutritional status of plants by regulating the pH in hydroponic systems. More research on this topic in needed in order to look into the interactions between different Nr ratios and NaCl salinity in other fruits and vegetables, and also to determine whether the application of minerals and which application methods are effective tools to reduce the harmful impacts of salt.

Supplementary Materials

The following supporting information can be downloaded at: https://www.mdpi.com/article/10.3390/agronomy12020386/s1, Figure S1. Average, minimum and maximum air relative humidity (RH) and temperature (°C) during the experiment. Figure S2. The effect of salinity (Sal) levels (LS: Low Salinity of 0 mM NaCl; HS: High Salinity of 50 mM NaCl) and the application of NH4/Ntotal ratios (Nr0.05, Nr0.10, and Nr0.15) on the fluctuation of the electrical conductivity (EC; mS cm−1), pH and nitrates content of the drainage solution during cultivation.

Author Contributions

Conceptualization, N.T. and A.S.; methodology, N.T. and A.S.; software, A.C. and A.S.; validation, N.T., A.C. and A.S.; formal analysis, A.C., A.S. and N.T.; investigation, G.P., A.C., A.S. and N.T.; resources, N.T. and A.S.; data curation, A.C. and A.S.; writing—original draft preparation, A.C. and N.T.; writing—review and editing, A.C., A.S. and N.T.; visualization, A.C. and A.S.; supervision, N.T.; project administration, N.T.; funding acquisition, N.T. and A.S. All authors have read and agreed to the published version of the manuscript.

Funding

This research received no external funding.

Institutional Review Board Statement

Not applicable.

Data Availability Statement

Not applicable.

Conflicts of Interest

The authors declare no conflict of interest.

References

  1. Wu, G.; Zhang, C.; Chu, L.Y.; Shao, H.B. Responses of higher plants to abiotic stresses and agricultural sustainable development. J. Plant Interact. 2007, 2, 135–147. [Google Scholar] [CrossRef]
  2. Munns, R.; Tester, M. Mechanisms of salinity tolerance. Annu. Rev. Plant Biol. 2008, 59, 651–681. [Google Scholar] [CrossRef] [PubMed] [Green Version]
  3. Shahbaz, M.; Ashraf, M. Improving Salinity Tolerance in Cereals. Crit. Rev. Plant Sci. 2013, 32, 237–249. [Google Scholar] [CrossRef]
  4. Shrivastava, P.; Kumar, R. Soil salinity: A serious environmental issue and plant growth promoting bacteria as one of the tools for its alleviation. Saudi J. Biol. Sci. 2015, 22, 123–131. [Google Scholar] [CrossRef] [PubMed] [Green Version]
  5. Yildirim, E.; Taylor, A.G. Effect of biological treatments on growth of bean plants under salt stress. Annu. Rep. Bean Improv. Coop. 2005, 48, 176–177. [Google Scholar]
  6. Hendawy, S.F.; Khalid, K.A. Response of sage (Salvia officinalis L.) plants to zinc application under different salinity levels. J. Appl. Sci. Res. 2005, 1, 147–155. [Google Scholar]
  7. Gama, P.B.S.S.; Inanaga, S.; Tanaka, K.; Nakazawa, R. Nakazawa Physiological response of common bean (Phaseolus vulgaris L.) seedlings to salinity stress. Afr. J. Biotechnol. 2007, 6, 079–088. [Google Scholar]
  8. Jamil, M.; Rehman, S.; Rha, E.S. Salinity effect on plant growth, PSII photochemistry and chlorophyll content in sugar beet (Beta vulgaris L.) and cabbage (Brassica oleracea capitata L.). Pak. J. Bot. 2007, 39, 753–760. [Google Scholar]
  9. Memon, S.A.; Hou, X.; Wang, L.J. Morphlogical analysis of salt stress response of pak choi. Electron. J. Environ. Agric. Food Chem. 2010, 9, 248–254. [Google Scholar]
  10. Pinheiro, D.T.; Delazari, F.; Nick, C.; Mattiello, E.M.; dos Santos Dias, D.C.F. Emergence and vegetative development of melon in function of the soil salinity. Aust. J. Crop. Sci. 2019, 13, 458–464. [Google Scholar] [CrossRef]
  11. Petretto, G.L.; Urgeghe, P.P.; Massa, D.; Melito, S. Effect of salinity (NaCl)on plant growth, nutrient content, and glucosinolate hydrolysis products trends in rocket genotypes. Plant Physiol. Biochem. 2019, 141, 30–39. [Google Scholar] [CrossRef] [PubMed]
  12. Belmecheri-Cherifi, H.; Albacete, A.; Martínez-Andújar, C.; Pérez-Alfocea, F.; Abrous-Belbachir, O. The growth impairment of salinized fenugreek (Trigonella foenum-graecum L.) plants is associated to changes in the hormonal balance. J. Plant Physiol. 2019, 232, 311–319. [Google Scholar] [CrossRef] [PubMed]
  13. Ramos-Sotelo, H.; Valdez-Ortiz, Á.; Germán-Báez, L.J.; Fierro-Sañudo, J.F.; León-Cañedo, J.A.; Alarcón-Silvas, S.G.; Reyes-Moreno, C.; Páez-Osuna, F. Quality of lettuce Lactuca sativa (var. Tropicana M1) grown with two low-salinity shrimp effluents. Food Chem. X 2019, 2, 100027. [Google Scholar] [CrossRef] [PubMed]
  14. Sarabi, B.; Fresneau, C.; Ghaderi, N.; Bolandnazar, S.; Streb, P.; Badeck, F.W.; Citerne, S.; Tangama, M.; David, A.; Ghashghaie, J. Stomatal and non-stomatal limitations are responsible in down-regulation of photosynthesis in melon plants grown under the saline condition: Application of carbon isotope discrimination as a reliable proxy. Plant Physiol. Biochem. 2019, 141, 1–19. [Google Scholar] [CrossRef]
  15. Kapoor, K.; Srivastava, A. Assessment of salinity tolerance of Vigna mungo var. Pu-19 using ex vitro and in vitro methods. Asian J. Biotechnol. 2010, 2, 73–85. [Google Scholar] [CrossRef] [Green Version]
  16. Piñero, M.C.; Pérez-Jiménez, M.; López-Marín, J.; del Amor, F.M. Fruit quality of sweet pepper as affected by foliar Ca applications to mitigate the supply of saline water under a climate change scenario. J. Sci. Food Agric. 2018, 98, 1071–1078. [Google Scholar] [CrossRef]
  17. Chrysargyris, A.; Papakyriakou, E.; Petropoulos, S.A.; Tzortzakis, N. The combined and single effect of salinity and copper stress on growth and quality of Mentha spicata plants. J. Hazard. Mater. 2019, 368, 584–593. [Google Scholar] [CrossRef]
  18. Incerti, A.; Navari-Izzo, F.; Pardossi, A.; Izzo, R. Seasonal variations in polyphenols and lipoic acid in fruits of tomato irrigated with sea water. J. Sci. Food Agric. 2009, 89, 1326–1331. [Google Scholar] [CrossRef]
  19. Savvas, D.; Passam, H.C.; Olympios, C.; Nasi, E.; Moustaka, E.; Mantzos, N.; Barouchas, P. Effects of ammonium nitrogen on lettuce grown on pumice in a closed hydroponic system. HortScience 2006, 41, 1667–1673. [Google Scholar] [CrossRef] [Green Version]
  20. Kotsiras, A.; Olympios, C.M.; Passam, H.C. Effects of nitrogen form and concentration on yield and quality of cucumbers grown on rockwool during spring and winter in southern Greece. J. Plant Nutr. 2005, 28, 2027–2035. [Google Scholar] [CrossRef]
  21. Santamaria, P.; Elia, A. Producing nitrate-free endive heads: Effect of nitrogen form on growth, yield, and ion composition of endive. J. Am. Soc. Hortic. Sci. 1997, 122, 140–145. [Google Scholar] [CrossRef] [Green Version]
  22. Chatzigianni, M.; Alkhaled, B.; Livieratos, I.; Stamatakis, A.; Ntatsi, G.; Savvas, D. Impact of nitrogen source and supply level on growth, yield and nutritional value of two contrasting ecotypes of Cichorium spinosum L. grown hydroponically. J. Sci. Food Agric. 2018, 98, 1615–1624. [Google Scholar] [CrossRef] [PubMed]
  23. Perner, H.; Schwarz, D.; Krumbein, A.; George, E. Influence of sulfur supply, ammonium nitrate ratio, and arbuscular mycorrhizal colonization on growth and composition of Chinese chive. Sci. Hortic. 2011, 130, 485–490. [Google Scholar] [CrossRef]
  24. Fallovo, C.; Rouphael, Y.; Rea, E.; Battistelli, A.; Colla, G. Nutrient solution concentration and growing season affect yield and quality of Lactuca sativa L. var. acephala in floating raft culture. J. Sci. Food Agric. 2009, 89, 1682–1689. [Google Scholar] [CrossRef]
  25. Rouphael, Y.; Kyriacou, M.C.; Petropoulos, S.A.; De Pascale, S.; Colla, G. Improving vegetable quality in controlled environments. Sci. Hortic. 2018, 234, 275–289. [Google Scholar] [CrossRef]
  26. Palaniswamy, U.R.; Bible, B.B.; McAvoy, R.J. Oxalic acid concentrations in Purslane (Portulaca oleraceae L.) is altered by the stage of harvest and the nitrate to ammonium ratios in hydroponics. Sci. Hortic. 2004, 102, 267–275. [Google Scholar] [CrossRef]
  27. Boschiero, B.N.; Mariano, E.; Azevedo, R.A.; Ocheuze Trivelin, P.C. Influence of nitrate-ammonium ratio on the growth, nutrition, and metabolism of sugarcane. Plant Physiol. Biochem. 2019, 139, 246–255. [Google Scholar] [CrossRef]
  28. Szczerba, M.W.; Britto, D.T.; Balkos, K.D.; Kronzucker, H.J. Alleviation of rapid, futile ammonium cycling at the plasma membrane by potassium reveals K+-sensitive and -insensitive components of NH4+ transport. J. Exp. Bot. 2008, 59, 303–313. [Google Scholar] [CrossRef] [Green Version]
  29. Maggio, A.; Raimondi, G.; Martino, A.; De Pascale, S. Salt stress response in tomato beyond the salinity tolerance threshold. Environ. Exp. Bot. 2007, 59, 276–282. [Google Scholar] [CrossRef]
  30. Giannakoula, A.E.; Ilias, I.F. The effect of water stress and salinity on growth and physiology of tomato (Lycopersicon esculentum Mill.). Arch. Biol. Sci. 2013, 65, 611–620. [Google Scholar] [CrossRef]
  31. Claussen, W. Growth, water use efficiency, and proline content of hydroponically grown tomato plants as affected by nitrogen source and nutrient concentration. Plant Soil 2002, 247, 199–209. [Google Scholar] [CrossRef]
  32. Akl, I.A.; Savvas, D.; Papadantonakis, N.; Lydakis-Simantiris, N.; Kefalas, P. Influence of Ammonium to Total Nitrogen Supply Ratio on Growth, Yield and Fruit Quality of Tomato Grown in a Closed Hydroponic System. Eur. J. Hortic. Sci. 2003, 68, 204–211. [Google Scholar]
  33. Chrysargyris, A.; Antoniou, O.; Athinodorou, F.; Vassiliou, R.; Papadaki, A.; Tzortzakis, N. Deployment of olive-stone waste as a substitute growing medium component for Brassica seedling production in nurseries. Environ. Sci. Pollut. Res. 2019, 26, 35461–35472. [Google Scholar] [CrossRef]
  34. Eaton, A.; Clesceri, L.; Rice, E.; Greenberg, A. Standard Methods for Examination of Water and Wastewater: Centennial Edition, 1368; American Public Health Association: Washington, DC, USA, 2005. [Google Scholar]
  35. Costan, A.; Stamatakis, A.; Chrysargyris, A.; Petropoulos, S.A.; Tzortzakis, N. Interactive effects of salinity and silicon application on Solanum lycopersicum growth, physiology and shelf life of fruit produced hydroponically. J. Sci. Food Agric. 2019, 100, 732–743. [Google Scholar] [CrossRef] [PubMed]
  36. Xylia, P.; Clark, A.; Chrysargyris, A.; Romanazzi, G.; Tzortzakis, N. Quality and safety attributes on shredded carrots by using Origanum majorana and ascorbic acid. Postharvest Biol. Technol. 2019, 155, 120–129. [Google Scholar] [CrossRef]
  37. Chrysargyris, A.; Rousos, C.; Xylia, P.; Tzortzakis, N. Vapour application of sage essential oil maintain tomato fruit quality in breaker and red ripening stages. Plants 2021, 10, 2645. [Google Scholar] [CrossRef] [PubMed]
  38. AOAC. Official Methods of Analysis of AOAC International; Horwitz, W., Latimer, G., Eds.; AOAC International: Gaithersburg, MD, USA, 2016. [Google Scholar]
  39. Nagata, M.; Yamashita, I. Simple Method for Simultaneous Determination of Chlorophyll and Carotenoids in Tomato Fruit. Nippon. Shokuhin Kogyo Gakkaishi 1992, 39, 925–928. [Google Scholar] [CrossRef] [Green Version]
  40. Psarras, G.; Bertaki, M.; Chartzoulakis, K. Response of greenhouse tomato to salt stress and K+ supplement. Plant Biosyst. 2008, 142, 149–153. [Google Scholar] [CrossRef]
  41. Stamatakis, A.; Papadantonakis, N.; Savvas, D.; Lydakis-Simantiris, N.; Kefalas, P.; Savvas, D.; Lydakis-Simantiris, N.; Kefalas, P. Effects of silicon and salinity on fruit yield and quality of tomato grown hydroponically. Acta Hortic. 2003, 609, 141–147. [Google Scholar] [CrossRef]
  42. Savvas, D.; Lenz, F. Response of eggplants grown in recirculating nutrient solution to salinity imposed prior to the start of harvesting. J. Hortic. Sci. Biotechnol. 2000, 75, 262–267. [Google Scholar] [CrossRef]
  43. Zhai, Y.; Yang, Q.; Hou, M. The effects of saline water drip irrigation on tomato yield, quality, and blossom-end rot incidence-A 3a case study in the South of China. PLoS ONE 2015, 10, e0142204. [Google Scholar]
  44. Kotsiras, A.; Olympios, C.M.; Drosopoulos, J.; Passam, H.C. Effects of nitrogen form and concentration on the distribution of ions within cucumber fruits. Sci. Hortic. 2002, 95, 175–183. [Google Scholar] [CrossRef]
  45. Balotf, S.; Kavoosi, G. Differential nitrate accumulation, nitrate reduction, nitrate reductase activity, protein production and carbohydrate biosynthesis in response to potassium and sodium nitrate. Afr. J. Biotechnol. 2011, 10, 17973–17980. [Google Scholar]
  46. Tuna, A.L.; Kaya, C.; Ashraf, M.; Altunlu, H.; Yokas, I.; Yagmur, B. The effects of calcium sulphate on growth, membrane stability and nutrient uptake of tomato plants grown under salt stress. Environ. Exp. Bot. 2007, 59, 173–178. [Google Scholar] [CrossRef]
  47. Kostic, L.; Nikolic, N.; Bosnic, D.; Samardzic, J.; Nikolic, M. Silicon increases phosphorus (P) uptake by wheat under low P acid soil conditions. Plant Soil 2017, 419, 447–455. [Google Scholar] [CrossRef]
  48. Agostinho, F.B.; Tubana, B.S.; Martins, M.S.; Datnoff, L.E. Effect of different silicon sources on yield and silicon uptake of rice grown under varying phosphorus rates. Plants 2017, 6, 35. [Google Scholar] [CrossRef] [PubMed]
  49. Grieve, C.; Grattan, S. Mineral Nutrient Acquisition and Response by Plants Grown in Saline Environments. Agric. Ecosyst. Environ. 1999, 32, 203–229. [Google Scholar]
  50. Del Amor, F.M.; Martinez, V.; Cerdá, A. Salt tolerance of tomato plants as affected by stage of plant development. HortScience 2001, 36, 1260–1263. [Google Scholar] [CrossRef] [Green Version]
  51. Altuntas, O.; Dasgan, H.Y.; Akhoundnejad, Y. Silicon nutrition ameliorates salt stress of Capsicum annuum L. by ion regulation. In Proceedings of the XVIth EUCARPIA Capsicum and Eggplant Working Group Meeting in Memoriam Dr. Alain Palloix, Kecskemét, Hungary, 12–14 September 2016; pp. 465–469. [Google Scholar]
  52. Chrysargyris, A.; Michailidi, E.; Tzortzakis, N. Physiological and biochemical responses of Lavandula angustifolia to salinity under mineral foliar application. Front. Plant Sci. 2018, 9, 489. [Google Scholar] [CrossRef] [Green Version]
  53. Ali Turan, M.; Hassan Awad Elkarim, A.; Taban, N.; Taban, S. Effect of salt stress on growth and ion distribution and accumulation in shoot and root of maize plant. Afr. J. Agric. Res. 2010, 5, 584–588. [Google Scholar]
  54. Adler, P.R.; Wilcox, G.E. Ammonium Increases the Net Rate of Sodium Influx and Partitioning to the Leaf of Muskmelon. J. Plant Nutr. 1995, 18, 1951–1962. [Google Scholar] [CrossRef]
  55. Sharpley, A.N.; Meisinger, J.J.; Power, J.F.; Suarez, D.L. Root extraction of nutrients associated with long-term soil management. Adv. Soil Sci. 1992, 19, 151–217. [Google Scholar]
  56. Flores, P.; Carvajal, M.; Cerdá, A.; Martínez, V. Salinity and ammonium/nitrate interactions on tomato plant development, nutrition, and metabolites. J. Plant Nutr. 2001, 24, 1561–1573. [Google Scholar] [CrossRef]
  57. Rahman, S.; Vance, G.F.; Munn, L.C. Salinity Induced Effects on the Nutrient Status of Soil, Corn Leaves and Kernels. Commun. Soil Sci. Plant Anal. 1993, 24, 2251–2269. [Google Scholar] [CrossRef]
  58. Izzo, R.; Navari-Izzo, F.; Quartacci, M.F. Growth and mineral absorption in maize seedlings as affected by increasing nacl concentrations. J. Plant Nutr. 1991, 14, 687–699. [Google Scholar] [CrossRef]
  59. Maas, E.V.; Ogata, G.; Garber, M.J. Influence of salinity on Fe, Mn, and Zn uptake by plants. Agron. J. 1972, 64, 793–795. [Google Scholar] [CrossRef]
  60. Al-Harbi, A.R. Growth and Nutrient Composition of Tomato and Cucumber Seedlings as Affected by Sodium Chloride Salinity and Supplemental Calcium. J. Plant Nutr. 1995, 18, 1403–1416. [Google Scholar] [CrossRef]
  61. Krauss, S.; Schnitzler, W.H.; Grassmann, J.; Woitke, M. The influence of different electrical conductivity values in a simplified recirculating soilless system on inner and outer fruit quality characteristics of tomato. J. Agric. Food Chem. 2006, 54, 441–448. [Google Scholar] [CrossRef]
  62. Moya, C.; Oyanedel, E.; Verdugo, G.; Flores, M.F.; Urrestarazu, M.; Álvaro, J.E. Increased electrical conductivity in nutrient solution management enhances dietary and organoleptic qualities in soilless culture tomato. HortScience 2017, 52, 868–872. [Google Scholar] [CrossRef] [Green Version]
  63. Zushi, K.; Matsuzoe, N. Metabolic profile of organoleptic and health-promoting qualities in two tomato cultivars subjected to salt stress and their interactions using correlation network analysis. Sci. Hortic. 2015, 184, 8–17. [Google Scholar] [CrossRef]
  64. Ben, G.O.; Kafkafi, U. Melon fruit quality as affected by timing, duration, and concentration of phosphate and nitrogen sources in recycled hydroponic system. J. Plant Nutr. 2002, 25, 1563–1583. [Google Scholar] [CrossRef]
  65. Petersen, K.K.; Willumsen, J.; Kaack, K. Composition and taste of tomatoes as affected by increased salinity and different salinity sources. J. Hortic. Sci. Biotechnol. 1998, 73, 205–215. [Google Scholar] [CrossRef]
  66. De Pascale, S.; Maggio, A.; Fogliano, V.; Ambrosino, P.; Ritieni, A. Irrigation with saline water improves carotenoids content and antioxidant activity of tomato. J. Hortic. Sci. Biotechnol. 2001, 76, 447–453. [Google Scholar] [CrossRef]
  67. Serio, F.; De Gara, L.; Caretto, S.; Leo, L.; Santamaria, P. Influence of an increased NaCl concentration on yield and quality of cherry tomato grown in posidonia (Posidonia oceanica (L) Delile). J. Sci. Food Agric. 2004, 84, 1885–1890. [Google Scholar] [CrossRef]
  68. Giuliano, G.; Bartley, G.E.; Scolnik, P.A. Regulation of carotenoids biosynthesis during tomato development. Plant Cell 1993, 5, 379–387. [Google Scholar]
  69. Navarro, J.M.; Flores, P.; Garrido, C.; Martinez, V. Changes in the contents of antioxidant compounds in pepper fruits at different ripening stages, as affected by salinity. Food Chem. 2006, 96, 66–73. [Google Scholar] [CrossRef]
  70. Toor, R.K.; Savage, G.P. Changes in major antioxidant components of tomatoes during post-harvest storage. Food Chem. 2006, 99, 724–727. [Google Scholar] [CrossRef]
  71. Iglesias, M.J.; García-López, J.; Collados-Luján, J.F.; López-Ortiz, F.; Díaz, M.; Toresano, F.; Camacho, F. Differential response to environmental and nutritional factors of high-quality tomato varieties. Food Chem. 2015, 176, 278–287. [Google Scholar] [CrossRef]
  72. Saito, T.; Matsukura, C.; Ban, Y.; Shoji, K.; Sugiyama, M.; Fukuda, N.; Nishimura, S. Salinity stress affects assimilate metabolism at the gene-expression level during fruit development and improves fruit quality in tomato (Solanum lycopersicum L.). J. Jpn. Soc. Hortic. Sci. 2008, 77, 61–68. [Google Scholar] [CrossRef] [Green Version]
  73. Manzo, N.; Pizzolongo, F.; Meca, G.; Aiello, A.; Marchetti, N.; Romano, R. Comparative chemical compositions of fresh and stored vesuvian PDO “Pomodorino del Piennolo” tomato and the ciliegino variety. Molecules 2018, 23, 2871. [Google Scholar] [CrossRef] [Green Version]
  74. Petric, T.; Kiferle, C.; Perata, P.; Gonzali, S. Optimizing shelf life conditions for anthocyanin-rich tomatoes. PLoS ONE 2018, 13, e0205650. [Google Scholar] [CrossRef] [PubMed]
Figure 1. The effect of salinity (Sal) levels (LS: low salinity of 0 mM NaCl; HS: high salinity of 50 mM NaCl) and the application of NH4/Ntotal ratios (Nr0.05, Nr0.10 and Nr0.15) on tomato plants and the harvested fruit after storage for 7 days at 12 °C and 25 °C for (A) weight loss, (B) firmness, (C) total soluble solids-TSS, (D) titratable acidity-TA and (E) TSS/TA ratio. Non-significant differences are indicated by ns, while significant differences (p < 0.05) among treatments are indicated by different Latin letters according to Duncan’s multiple range test. Error bars show SE (n = 8).
Agronomy 12 00386 g001aAgronomy 12 00386 g001b
Figure 2. The effect of salinity (Sal) levels (LS: low salinity of 0 mM NaCl; HS: sigh salinity of 50 mM NaCl) and the application of NH4/Ntotal ratios (Nr0.05, Nr0.10, and Nr0.15) on tomato plants and the harvested fruit after storage for 7 days at 12 ° and 25 °C for fruit color parameters. (A) color L*, (B) color a*, (C) color b*, (D) chroma, (E) Hue, (F) whiteness index, and (G) color index. Non-significant differences are indicated by ns, while significant differences (p < 0.05) among treatments are indicated by different Latin letters according to Duncan’s multiple range test. Error bars show SE (n = 8).
Agronomy 12 00386 g002aAgronomy 12 00386 g002bAgronomy 12 00386 g002c
Figure 3. The effect of salinity (Sal) levels (LS: Low Salinity of 0 mM NaCl; HS: High Salinity of 50 mM NaCl) and the application of NH4/Ntotal ratios (Nr0.05, Nr0.10, and Nr0.15) on tomato plants and the harvested fruit after storage for 7 days at 12 °C and 25 °C for (A) vitamin C, (B) total phenols, (C) lycopene and (D) β-carotene content. Non-significant differences are indicated by ns, while significant differences (p < 0.05) among treatments are indicated by different Latin letters according to Duncan’s multiple range test. Error bars show SE (n = 8).
Agronomy 12 00386 g003aAgronomy 12 00386 g003b
Table 1. The effect of salinity (Sal) levels (LS: low salinity of 0 mM NaCl; HS: high salinity of 50 mM NaCl) and the application of NH4/Ntotal ratios (Nr0.05, Nr0.10 and Nr0.15) on the plant growth, yield and physiological parameters of hydroponically grown tomato plants.
Low Salinity High Salinity
Nr0.05 + LSNr0.10 + LSNr0.15 + LSNr0.05 + HSNr0.10 + HSNr0.15 + HSNr SalNr × Sal
Plant height (cm)180.00 ± 6.87 a183.37 ± 5.16 a170.62 ± 5.18 ab167.87 ± 6.33 ab149.00 ± 7.92 c160.85 ± 3.46 bcnsnsns
Number of leaves22.50 ± 0.70 a21.62 ± 0.59 a22.75 ± 0.70 a20.87 ± 0.39 a20.75 ± 0.90 a21.42 ± 0.52 ansnsns
Stem diameter (mm)8.25 ± 0.63 a8.31 ± 0.56 a7.87 ± 0.78 a5.50 ± 0.42 b5.12 ± 0.45 b5.28 ± 0.24 bns*ns
Fruit number11.25 ± 1.35 b15.33 ± 1.66 a12.14 ± 1.10 ab14.12 ± 0.89 ab11.71 ± 1.04 ab14.00 ± 1.09 abnsns***
Fruit fresh weight (g)202.38 ± 24.08 a180.83 ± 13.16 ab188.16 ± 8.74 a125.83 ± 2.96 c144.64 ± 7.51 bc127.92 ± 7.25 cnsnsns
Yield (kg per plant)2.30 ± 0.43 ab2.71 ± 0.24 a2.29 ± 0.26 ab1.77 ± 0.11 b1.67 ± 0.13 b1.77 ± 0.13 bnsnsns
Chlorophyll a (mg g1)14.60 ± 1.86 a9.18 ± 1.62 a13.91 ± 0.96 a13.14 ± 2.27 a14.52 ± 2.58 a11.79 ± 2.00 ansnsns
Chlorophyll b (mg g1)6.23 ± 0.80 a3.61 ± 0.57 a5.52 ± 0.51 a6.30 ± 1.10 a5.85 ± 0.96 a5.39 ± 1.24 ansnsns
Total Chlorophylls a (mg g1)20.82 ± 2.63 a12.80 ± 2.19 a19.43 ± 1.39 a19.42 ± 3.32 a20.37 ± 3.54 a17.17 ± 3.24 ansnsns
Photosynthetic rate (μmol m2s1)11.46 ± 1.99 b14.84 ± 1.11 ab17.82 ± 1.14 a17.52 ± 2.14 a18.17 ± 1.58 a15.60 ± 0.85 ab**ns
Stomatal conductance (μmol m2s1)0.611 ± 0.054 a0.687 ± 0.052 a0.683 ± 0.122 a0.529 ± 0.055 a0.660 ± 0.040 a0.455 ± 0.157 ansnsns
Internal CO2 (μmol mol1)280.66 ± 31.59 b341.00 ± 18.07 ab385.00 ± 30.09 ab385.50 ± 42.29 ab395.50 ± 31.33 a313.00 ± 35.79 ab**ns
Results are expressed as means ± SE (n = 8). Values in rows followed by the same Latin letter are not significantly different according to Duncan’s multiple range test at p ≤ 0.05. ns, * and *** indicate non-significant or significant differences at p ≤ 5% and 0.1%, respectively, following two-way ANOVA.
Table 2. The effect of salinity (Sal) levels (LS: low salinity of 0 mM NaCl; HS: high salinity of 50 mM NaCl) and the application of NH4/Ntotal ratios (Nr0.05, Nr0.10 and Nr0.15) on mineral content of tomato leaves and fruit of hydroponically grown tomato plants.
Low Salinity High Salinity
LeavesNr0.05 + LSNr0.10 + LSNr0.15 + LSNr0.05 + HSNr0.10 + HSNr0.15 + HSNr SalNr × Sal
N (g kg−1)31.17 ± 0.41 a26.82 ± 1.02 b27.10 ± 0.49 b28.77 ± 0.72 b33.35 ± 0.63 a33.50 ± 1.03 ans****
K(g kg−1)33.17 ± 1.45 a32.11 ± 1.55 a34.74 ± 1.00 a24.43 ± 1.51 b21.70 ± 0.67 b16.32 ± 1.72 cns**ns
Ca (g kg−1)26.46 ± 12.05 a23.63 ± 7.21 a19.11 ± 2.19 a23.71 ± 4.66 a29.76 ± 5.81 a32.92 ± 10.67 ansnsns
P (g kg−1)3.02 ± 0.25 a2.86 ± 0.45 a3.90 ± 0.45 a5.31 ± 1.09 a4.05 ± 0.44 a4.91 ± 1.66 a***ns
Mg(g kg−1)3.98 ± 0.33 c3.93 ± 0.34 c4.25 ± 0.26 c8.17 ± 0.62 b7.51 ± 0.88 b10.85 ± 1.36 ans***ns
Na(g kg−1)2.08 ± 0.18 c2.23 ± 0.15 c2.41 ± 0.40 c10.04 ± 1.10 b8.55 ± 1.19 b13.95 ± 2.02 ans***ns
Fe (mg kg−1)80.17 ± 6.05 ab71.49 ± 3.26 b73.36 ± 3.53 ab76.98 ± 2.13 ab78.38 ± 5.26 ab89.22 ± 7.92 ansnsns
Zn (mg kg−1)4.87 ± 0.82 c5.73 ± 2.03 c6.27 ± 2.67 c17.69 ± 1.96 b16.89 ± 3.83 b37.53 ± 8.25 ans*ns
Cu (mg kg−1)1.04 ± 0.24 a1.35 ± 0.46 a0.55 ± 0.21 a2.05 ± 0.54 a1.48 ± 0.49 a3.98 ± 0.83 ansnsns
Mn (mg kg−1)24.21 ± 2.36 b29.77 ± 7.82 ab40.97 ± 13.22 ab47.28 ± 10.47 ab51.37 ± 7.97 ab79.98 ± 33.47 ansnsns
B (mg kg−1)72.47 ± 3.62 ab63.16 ± 7.69 b69.34 ± 3.74 ab84.17 ± 5.56 ab89.81 ± 5.80 a79.52 ± 12.57 abns**ns
Fruits
N (g kg−1)29.90 ± 7.01 a29.35 ± 5.28 a19.12 ± 1.61 ab16.87 ± 0.95 b16.75 ± 0.72 b18.55 ± 1.97 abns*ns
K(g kg−1)27.60 ± 1.56 a24.10 ± 2.82 ab24.86 ± 1.01 ab21.22 ± 1.90 bc19.77 ± 1.68 bc16.95 ± 1.72 cns*ns
Ca (g kg−1)2.65 ± 0.30 a1.70 ± 0.11 b1.62 ± 0.02 b1.47 ± 0.08 b1.54 ± 0.09 b1.32 ± 0.05 bnsnsns
p(g kg−1)1.86 ± 0.18 a1.26 ± 0.08 b1.56 ± 0.27 ab1.13 ± 0.22 b1.12 ± 0.15 b1.15 ± 0.15 bnsnsns
Mg(g kg−1)0.73 ± 0.07 a0.55 ± 0.01 ab0.70 ± 0.14 a0.44 ± 0.06 b0.49 ± 0.06 ab0.56 ± 0.03 abnsnsns
Na(g kg−1)0.77 ± 0.08 b0.45 ± 0.09 b0.57 ± 0.09 b2.10 ± 0.39 a2.17 ± 0.15 a1.86 ± 0.29 ans**ns
Al(g kg−1)1.36 ± 0.05 a0.95 ± 0.20 ab0.71 ± 0.20 b1.11 ± 0.09 ab1.08 ± 0.10 ab0.82 ± 0.12 b*nsns
Fe (mg kg−1)47.72 ± 6.66 ab48.60 ± 2.35 ab67.53 ± 23.42 a31.72 ± 3.36 b28.10 ± 3.37 b29.22 ± 2.19 bnsnsns
Zn (mg kg−1)3.85 ± 0.46 a7.53 ± 2.77 a6.38 ± 3.27 a3.10 ± 1.23 a1.05 ± 0.38 a3.53 ± 1.62 ansnsns
Cu (mg kg−1)1.88 ± 0.36 a1.57 ± 0.77 ab0.55 ± 0.20 abndnd0.28 ± 0.01 bnsnsns
Mn (mg kg−1)14.32 ± 1.74 a4.88 ± 0.18 b7.57 ± 0.91 b4.01 ± 1.61 b4.57 ± 3.13 b3.23 ± 0.36 bns**
B (mg kg−1)18.20 ± 3.36 a14.46 ± 3.83 a18.19 ± 9.15 a12.07 ± 3.57 a13.36 ± 3.51 a8.39 ± 1.59 ansnsns
Results are expressed as mean values ± SE (n = 4). Values in rows followed by the same Latin letter are not significantly different according to Duncan’s multiple range test at p ≤ 0.05; nd—not detectable. ns, *, ** and *** indicate non-significant or significant differences at p ≤ 5%, 1% and 0.1%, respectively, following two-way ANOVA.
Table 3. The effect of salinity (Sal) levels (LS: low salinity of 0 mM NaCl; HS: high salinity of 50 mM NaCl) and the application of NH4/Ntotal ratios (Nr0.05, Nr0.10, and Nr0.15) on the tomato fruit quality related attributes of hydroponically grown tomato plants.
Low Salinity High Salinity
Nr0.05 + LSNr0.10 + LSNr0.15 + LSNr0.05 + HSNr0.10 + HSNr0.15 + HSNr SalNr × Sal
Dry matter content (%)4.48 ± 0.32 b5.02 ± 0.14 b4.78 ± 0.12 b6.73 ± 0.10 ab8.98 ± 2.02 a6.92 ± 0.28 abns***ns
Firmness (N)5.18 ± 0.35 c4.77 ± 0.20 c5.58 ± 0.31 bc5.31 ± 0.36 c6.31 ± 0.30 ab6.75 ± 0.26 ans*ns
TSS (ºBrix)4.00 ± 0.23 b3.84 ± 0.16 b4.12 ± 0.14 b5.46 ± 0.20 a5.76 ± 0.21 a5.22 ± 0.25 ans***ns
Citric acid (%)0.21 ± 0.01 b0.20 ± 0.02 b0.21 ± 0.01 b0.27 ± 0.03 a0.24 ± 0.02 ab0.27 ± 0.01 ans**ns
Ripening (TSS/TA)18.95 ± 1.17 a20.00 ± 2.53 a20.58 ± 2.36 a20.89 ± 2.57 a24.12 ± 2.07 a19.26 ± 1.62 ansnsns
Color (L* value)35.70 ± 0.83 a34.30 ± 0.44 ab34.77 ± 0.68 ab33.79 ± 0.23 b33.83 ± 0.31 b33.89 ± 0.33 bnsnsns
Color (a* value)18.65 ± 1.53 a20.08 ± 1.07 a20.26 ± 1.26 a21.02 ± 0.64 a18.39 ± 0.53 a20.55 ± 0.99 ansnsns
Color (b* value)12.75 ± 0.66 a12.26 ± 0.62 a12.61 ± 0.36 a11.74 ± 0.33 a11.45 ± 0.24 a11.89 ± 0.24 ans*ns
Chroma22.61 ± 1.60 a23.53 ± 1.22 a23.89 ± 1.21 a24.08 ± 0.64 a21.67 ± 0.51 a23.75 ± 0.97 ansnsns
Hue0.60 ± 0.01 a0.54 ± 0.00 bc0.56 ± 0.02 ab0.51 ± 0.01 c0.55 ± 0.01 abc0.53 ± 0.01 bcns**
Whitening index31.74 ± 0.42 a30.17 ± 0.32 b30.48 ± 0.50 b29.53 ± 0.33 b30.36 ± 0.40 b29.72 ± 0.33 bnsns*
Color index40.82 ± 1.19 c47.82 ± 1.38 b46.21 ± 2.25 b53.11 ± 1.72 a47.56 ± 1.65 b50.94 ± 1.71 bns****
Vitamin C (%)0.59 ± 0.08 bc0.52 ± 0.05 c0.74 ± 0.07 bc0.92 ± 0.13 ab1.15 ± 0.18 a1.14 ± 0.11 ans***ns
Lycopene (mg g−1 Fw)0.054 ± 0.014 a0.056 ± 0.009 a0.039 ± 0.009 a0.073 ± 0.013 a0.071 ± 0.013 a0.054 ± 0.005 ansnsns
β-carotene (mg g−1 Fw)0.052 ± 0.007 a0.044 ± 0.004 a0.038 ± 0.010 a0.041 ± 0.004 a0.049 ± 0.004 a0.049 ± 0.005 ansnsns
Total phenols (μmol GAE g−1 Fw)0.35 ± 0.02 ab0.29 ± 0.02 ab0.28 ± 0.01 b0.38 ± 0.04 a0.35 ± 0.02 ab0.32 ± 0.01 abnsnsns
Results are expressed as means ± SE (n = 8). Values in rows followed by the same Latin letter are not significantly different according to Duncan’s multiple range test at p ≤ 0.05. ns, *, ** and *** indicate non-significant or significant differences at p ≤ 5%, 1% and 0.1%, respectively, following two-way ANOVA.
Table 4. Quantitative analysis, expressed as percentage values (%) of quality attributes in relation to salinity levels (0 and 50 mM NaCl) and/or the application of NH4/Ntotal ratios (Nr0.05, Nr0.10 and Nr0.15) on hydroponically grown tomatoes. Assessments were reported by 10 panelists per treatment.
Treatment AppearanceColorAromaTextureSweetnessOverall SatisfactionMarketability
NH4/Ntotal ratiosNr0.0566.00 ± 4.26 a64.00 ± 2.66 b62.00 ± 6.28 a84.00 ± 5.81 a58.00 ± 4.66 a64.00 ± 4.98 a68.00 ± 4.42 a
Nr0.1078.00 ± 4.66 a76.00 ± 4.00 a76.00 ± 4.98 a82.00 ± 6.28 a70.00 ± 5.37 a74.00 ± 3.05 a80.00 ± 5.16 a
Nr0.1576.00 ± 4.00 a75.00 ± 3.33 a70.00 ± 6.14 a84.00 ± 4.98 a66.00 ± 4.26 a69.33 ± 2.99 a74.00 ± 5.20 a
Salinity0 mM NaCl66.00 ± 3.05 a78.00 ± 3.59 a56.00 ± 4.98 b70.00 ± 6.14 a74.00 ± 3.05 b66.00 ± 4.26 a74.00 ± 5.20 a
50 mM NaCl66.00 ± 5.02 a68.00 ± 5.33 a76.00 ± 5.81 a82.00 ± 7.57 a82.00 ± 2.53 a70.00 ± 6.14 a76.00 ± 6.53 a
Results are expressed as mean ± SE (n = 10). In each treatment, values in columns followed by the same Latin letter are not significantly different according to Duncan’s multiple range test at p ≤ 0.05.
Publisher’s Note: MDPI stays neutral with regard to jurisdictional claims in published maps and institutional affiliations.

