Article

Physiological and Biochemical Responses to Water Stress and Salinity of the Invasive Moth Plant, Araujia sericifera Brot., during Seed Germination and Vegetative Growth

1
Mediterranean Agroforestry Institute (IAM), Universitat Politècnica de València, Camino de Vera s/n, 46022 Valencia, Spain
2
Laboratory for Research on Medicinal and Aromatic Plants, Department of Biotechnology, Faculty of Nature and Life Sciences, Université Saad Dahleb de Blida 1, Route de Soumâa BP 270, 09000 Blida, Algeria
3
Institute for Plant Molecular and Cell Biology (IBMCP), Universitat Politècnica de València, Camino de Vera s/n, 46022 Valencia, Spain
4
Institute for the Conservation and Improvement of Valencian Agrodiversity (COMAV), Universitat Politècnica de València, Camino de Vera s/n, 46022 Valencia, Spain
*
Author to whom correspondence should be addressed.
Agronomy 2022, 12(2), 361; https://doi.org/10.3390/agronomy12020361
Submission received: 28 December 2021 / Revised: 24 January 2022 / Accepted: 29 January 2022 / Published: 31 January 2022

Abstract

:
Araujia sericifera is an invasive plant with an increasing presence in South East Spain, where it produces damage to native trees and shrubs and citric orchards. As the climatic conditions in the study area are becoming harsher due to the climate change, the stress tolerance of this species has been studied during germination and vegetative growth. Growth parameters, photosynthetic pigments, ion accumulation, and antioxidant mechanisms were analysed in plants that were subjected to water deficit and salt stress. Seed germination was reduced by salinity but 50% of the seeds still germinated at 50 mM NaCl. The ungerminated seeds did not lose their germination capacity as shown in ‘recovery’ germination assays in distilled water. Germination was less affected by osmotic stress that was induced by polyethylene glycol (PEG), and germination velocity increased in the recovery treatments after exposure to NaCl or PEG. Plant growth was practically unaffected by 150 mM NaCl but inhibited by higher NaCl concentrations or severe drought stress. Nevertheless, all the plants survived throughout the experiment, even under high salinity (600 mM NaCl). A. sericifera relative stress tolerance relies, at least to some extent, on effective antioxidant mechanisms that are based on flavonoid biosynthesis and the activation of antioxidant enzymes such as superoxide dismutase, ascorbate peroxidase, and glutathione reductase.

1. Introduction

Biological invasions, accentuated by global warming [1,2], are a major environmental threat and cause significant economic losses [3]. Many invasive species are characterised by improved stress tolerance, which, combined with efficient dispersal strategies, are key elements ensuring their increasing worldwide presence, mainly in areas that are affected by global climate change [4]. Therefore, the number of studies on the responses of invasive plant species to environmental stress factors has increased in the last decades [5,6,7,8,9,10].
Abiotic stress tolerance in plants is based on several mechanisms that ensure survival under drought, salinity, or extreme temperature conditions. A general stress response is the adjustment of the cellular osmotic pressure through the regulation of ion transport and synthesis of different osmolytes; these compounds are low molecular weight and highly soluble molecules, such as sugars, proline, polyols, and quaternary ammonium compounds, which do not interfere with normal metabolic and cellular processes, even when present at high concentrations [11,12]. Abiotic stress is associated with oxidative stress that is produced by the accumulation of reactive oxygen species (ROS) and causes significant damage to plants, including DNA damage and cellular death [13]. ROS mainly consist of hydroxyl radicals (OH), superoxide anions (O2), and hydrogen peroxide (H2O2). High and low temperatures, drought, or salinity are environmental conditions that can increase the concentration of these molecules within plant cells [13]. The presence of ROS in cells does not necessarily have a negative effect on the plant. Moderate concentrations of ROS are necessary for different developmental mechanisms, such as lignin formation in the cell wall, programmed cell death, or as second messengers in other pathways that are involved in normal plant development [14,15]. Therefore, ROS accumulation levels are critical and play a dual role in plant development [15]. A proper balance of ROS concentrations is controlled by a plant’s antioxidant systems that, upon activation, will reduce cellular ROS levels. Antioxidant systems’ nature varies from enzymes and other proteins to non-enzymatic compounds such as carotenoids, vitamins, flavonoids, or other phenolic compounds [13,16,17].
Global warming is driving a worsening of environmental conditions in many world areas [18]. Therefore, plants that are tolerant to abiotic stresses, such as increased temperature, drought, or salinity, will better withstand the new environmental constraints. For this reason, studying the responses of invasive species to abiotic stresses and the underlying mechanisms may help to predict their potential hazard and invasiveness and elucidate how invaders may cope with global warming [4].
Araujia sericifera Brot. (Apocynaceae) is a woody evergreen vine that is native to South America. It is also commonly called moth catcher, moth plant, or cruel plant due to its capability to trap diurnal and nocturnal Lepidoptera pollinators with the rigid anthers of its flowers [19]. The moth plant can grow over five meters tall and has dense foliage of broad perennial leaves that, upon invasion to areas of native trees and shrubs, can provoke smothering and break their branches due to its heavy and numerous fruits. It reproduces mainly by seeds, which are numerous and large, and show a silky pappus that helps its anemochory dispersion. However, they can also be dispersed through water to a lesser extent. Alternatively, moth plants can also reproduce by vegetatively by cuttings [20]. The plant sap is poisonous and causes skin irritation [21]. The species is native to southern Brazil, Argentina, Paraguay, and Uruguay [22,23], and was introduced in many areas worldwide due to its interest as an ornamental, medicinal, and textile plant [24,25].
Araujia serificera is considered a very aggressive invasive species in Spain and grows in agricultural environments and natural vegetation areas. It was first reported in Valencia in 1976 [26], and nowadays it is a dangerous weed in citrus groves in this region [20]. It is one of the 43 species of weeds that are classified as having the most significant harmful impact of the 193 non-native species that are found in Spain. In 2013, the Spanish Ministry of Agriculture, Food and Environment (MAGRAMA) included this species in the catalogue of exotic invasive species. It was also included, since 2012, on the European and Mediterranean Plant Protection Organization (EPPO) list of invasive alien plants [24]. It is a problem not only in Spain but also in other European countries (France, Greece, Italy and Portugal) as well as Australia, Israel, North America, New Zealand, and South Africa [19]. The species is found mainly in poorly tended or abandoned fruit orchards on the Mediterranean coast, coinciding with the citrus-growing area with which it is commonly associated. Seedlings germinate in the late spring under the canopy of trees and quickly seek a tutor to entangle and grow and find their best support in the lower branches of citrus trees or at the base of their rootstocks. Once they obtain the tutor, they rapidly develop several of their branches during the summer, emerging through the canopy, wrapping the tree as they fall by gravity, and their basal parts acquire a woody consistency [27]. It also invades urban ecosystems by climbing over different types of fences or trees [28].
As drought and secondary salinisation are enhanced by global warming and are becoming more frequent in the Mediterranean area, we aimed to study the responses to these two types of abiotic stresses in this invasive species. This study determines the limits of germination rates, seedling establishment, and vegetative growth of Araujia sericifera under drought and saline stress conditions and analyses its antioxidant protection and ionic adjustment under these two stressful conditions.

2. Materials and Methods

2.1. Seed Germination

The seeds of Araujia sericifera were separated from fruits that were collected from an organic tangerine orchard that is situated at the coordinates 39.6235090, −0.2905290 (9°37′24.6″N 0°17′25.9″W), in Puçol, Valencia province, Spain. The soil has a loam texture with 30.60% sand, 47.55% silt, and 21.85% clay, and the pH is basic [29]. Figure 1 depicts the mature fruits (a) and seeds (b) of one of the moth plants that was sampled.
The seeds were germinated in standard 9 cm Petri dishes on filter paper that was moistened with water or aqueous solutions of increasing NaCl concentration (50, 100, and 150 mM). The selected salt concentrations were relatively low as seed germination is generally the most stress-sensitive phase of the plant life cycle. In addition, drought tolerance was checked using iso-osmotic solutions of polyethylene glycol 6000 (PEG 6000). The proper concentration of PEG was calculated applying the Van’t Hoff equation [30]. For each treatment, 100 seeds were sown in 5 Petri dishes (20 seeds per plate), with filter paper that was moistened with 5 mL of distilled water for the control or the corresponding salt or PEG solutions. The plates were sealed with parafilm to avoid evaporation and were incubated in a growth chamber (model EGH1501HR from Equitec, Madrid, Spain) at 25 °C under an 11-hour photoperiod. The number of germinated seeds, measured as seeds with radicle emergence, was registered every two days along a two-week period. The germination capacity was expressed as the percentage of germination and the germination rate as MGT (mean germination time) and was calculated according to the formula
MGT = Σ D n/Σn
where D represents the days from the beginning of the germination test and n is the number of seeds newly germinated on day D [31]. All of the seeds that did not germinate in the previous experiment were thoroughly washed in distilled water and were then transferred to new Petri dishes with filter paper that was moistened with distilled water. They remained in the germination chamber under the conditions that were mentioned above to check their recovery capacity. The recovery germination percentage and time were calculated as described above.
Images of the seedlings were taken at the end of the germination tests and were processed by Digimizer v.4.6.1 software (MedCalc Software, Ostend, Belgium, 2005–2016).

2.2. Plant Growth and Stress Treatments

Plant material was obtained by germination of the seeds in standard Petri dishes with filter paper that was moistened in water. After two weeks, the germinated seeds were transferred to a substrate containing a mixture of peat, perlite, and vermiculite (2:1:1) in 0.5 L pots (11 cm diameter), placed in plastic trays, watered twice a week with half-strength Hoagland solution [32], and maintained in a phytotron under long-day photoperiod (16 h of light and eight h of darkness) conditions, and temperatures of 23 °C during the day and 17 °C at night. The relative humidity ranged between 50 and 80%. Different stresses were applied three weeks after transplantation and seven plants per treatment were used. Plants were watered twice a week; those from the control treatment with half-strength Hoagland nutrient solution added to the trays (1.5 L per tray), and plants from the salt stress treatments with the same volume of the nutrient solution containing NaCl at 150, 300, 450, and 600 mM final concentrations. The drought treatments were started at the same time by withholding irrigation. After one month of treatments, plant material was collected, and the following growth parameters were determined: stem length increase, number of newly formed leaves, leaf area (measured by the programme Digimizer), fresh and dry weight, and the percentage of water content, calculated as
WC% = [(FW − DW)/FW] × 100

2.3. Substrate Analysis

The substrate moisture was measured following the gravimetric method. A sample of each pot was weighed (SW), dried in an oven at 105 °C until reaching constant weight, and then weighed again (DSW). The soil water content was calculated as:
Soil moisture (%) = [(SW − DSW)/SW] × 100
The substrate’s electrical conductivity (EC1:5) was measured after four weeks of treatment. The samples were air-dried and then passed through a 2-mm sieve. A soil:water (1:5) suspension was prepared using deionised water at 20 °C, and mixed for one hour at 600 rpm. The electric conductivity was determined using a Crison Conductivity meter 522 and expressed in dS m−1.

2.4. Photosynthetic Pigments

Chlorophyll a (Chl a), chlorophyll b (Chl b), and total carotenoids (Caro) were determined following a previously described method [33]. Fresh leaf material (0.05–0.10 g) was ground in the presence of liquid nitrogen. A total of 1 mL of ice-cold 80% acetone was added to the sample, which was shaken overnight in the dark at 4 °C. After a 10 min centrifugation at 13,300 g and 4 °C, the supernatants were collected, and the absorbance was measured at 470, 646, and 663 nm. The following equations were used for the calculation of pigment concentrations [33]:
Chl a (µg/mL) = 12.21 × (A663) − 2.81 × (A646)
Chl b (µg/mL) = 20.13 × (A646) − 5.03 × (A663)
Caro (µg/mL) = (1000 × A470 − 3.27 × [Chl a] − 104 × [Chl b])/227
Chlorophyll and carotenoid contents were finally expressed in mg g−1 DW.

2.5. Ion Content Measurements

Monovalent ion contents after the stress treatments were determined according to a previously published procedure [34]. A total of 25 mL of water was added to 0.15 g of dried and ground leaf material, and upon homogenisation, the sample was incubated for 1 h at 95 °C in a water bath. After filtration through filter paper (particle retention 8–12 µm), sodium and potassium were quantified with a PFP7 flame photometer (Jenway Inc., Burlington, VT, USA), and chlorides were measured using a Merck Spectroquant Nova 60® spectrophotometer and its associated test kit (Merck, Darmstadt, Germany).

2.6. Malondialdehyde, Total Phenolics, and Flavonoids Quantification

Methanol extracts (80%, v/v, in water) were prepared by grinding 0.05–0.10 g of fresh leaves in a mortar, shaking the samples in a rocker shaker overnight at room temperature, followed by centrifugation at 13,300×g for 15 min. The MDA was quantified in the supernatants, as previously described [35]. Each sample was mixed with 0.5% thiobarbituric acid (TBA) that was prepared in 20% trichloroacetic acid (TCA) or with 20% TCA without TBA for the controls and then incubated at 95 °C for 15 min in a water bath. The reactions were stopped on ice, and the samples were centrifuged at 13,300×g for 10 min at 4 °C. The absorbance of the supernatants was measured at 532 nm. After subtracting the non-specific absorbance at 600 and 440 nm, the MDA concentration was calculated by applying the equations that were described by Hodges [35] based on the molar extinction coefficient of the MDA-TBA adduct at 532 nm (ε532 = 155 mM−1 cm−1).
The concentrations of total phenolic compounds (TPC) and total flavonoids (TF) were determined in the same 80% methanol extracts that were used for the MDA measurements. The TPC was determined according to the protocol of Blainski et al. [36], which is based on the reaction with the Folin-Ciocalteu reagent in the presence of NaHCO3. The reaction mixtures were incubated at room temperature in the dark for 90 min, and the absorbance was then recorded at 765 nm. The TPC concentration was expressed as equivalents of the standard gallic acid (mg eq. GA g−1 DW).
The TF were determined by nitration of catechol groups with NaNO2, followed by reaction with AlCl3 under alkaline conditions [37]. The absorbance of the samples was read at 510 nm using catechin as the standard. The TF concentration was expressed as equivalents of catechin (mg eq. C g−1 DW).

2.7. Antioxidant Enzyme Activities

The specific activity of four major antioxidant enzymes, superoxide dismutase (SOD), catalase (CAT), ascorbate peroxidase (APX), and glutathione reductase (GR), was determined in crude protein extracts that were prepared from leaves. The plant material was ground in liquid N2 and mixed with extraction buffer [20 mM Hepes, pH = 7.5, 50 mM KCl, 1 mM EDTA, 0.1% (v/v) Triton X-100, 0.2% (w/v) polyvinylpyrrolidone, 0.2% (w/v) polyvinylpolypyrrolidone, and 5% (v/v) glycerol]. To improve the protein extraction, 1/10 volume of ‘high salt buffer’ [225 mM Hepes, pH 7.5, 1.5 M KCl and 22.5 mM MgCl2] was added to the samples, mixed well by vortexing, and incubated for 15 min on ice. After centrifugation at 13,500 rpm for 15 min at 4 °C, the supernatants were collected, concentrated in U-Tube concentrators (Novagen, Madison, WI, USA), and centrifuged again to remove precipitated material. The supernatants, referred to as ‘protein extracts’, were frozen in liquid N2 and stored in aliquots at -75 °C. The protein concentration in the extracts was measured by the method of Bradford [38], using the Bio-Rad reagent and bovine serum albumin (BSA) as standard.
The SOD activity in the protein extracts was determined at 560 nm following the inhibition of nitroblue tetrazolium (NBT) photoreduction in the reaction mixtures containing riboflavin as the source of superoxide radicals [39]. A SOD unit was defined as the amount of enzyme that caused 50% inhibition of NBT photoreduction under the assay conditions.
The CAT activity was assessed by the decrease in absorbance at 240 nm, which parallels the consumption of H2O2 that is added to the extracts [40]. A CAT unit was defined as the amount of enzyme that will decompose one mmol of H2O2 per minute at 25 °C.
The APX activity was determined by the decrease in absorbance that was observed at 290 nm as ascorbate becomes oxidised in the reaction [41]. One APX unit was defined as the amount of enzyme that is required to consume one mmol of ascorbate per minute at 25 °C.
The GR activity was quantified according to Conell and Mullet [42], following the decrease in absorbance at 340 nm due to the oxidation of NADPH—the cofactor of the GR-catalysed reduction of oxidised glutathione (GSSG). One GR unit was defined as the amount of enzyme that will oxidise one mmol of NADPH per minute at 25 °C.

2.8. Statistical Analyses

The data were analysed using Statgraphics Centurion XVI (Statgraphics Technologies, The Plains, VA, USA). A Levene test was applied to check whether the analysis of variance (ANOVA) requirements were accomplished. The germination percentages were normalised by arcsine transformation prior to the analysis of variance. Significant differences between treatments were tested by one-way analysis of variance (ANOVA) at the 95% confidence level, and post hoc comparisons were made using Tukey’s HSD (honestly significant difference) test at p < 0.05. All the mean values throughout the text are followed by the standard deviation (SD). A multivariate analysis, including a principal component analysis (PCA) and Pearson’s moment-product correlations, were performed with individual values of all the parameters that were measured in the plants.

3. Results

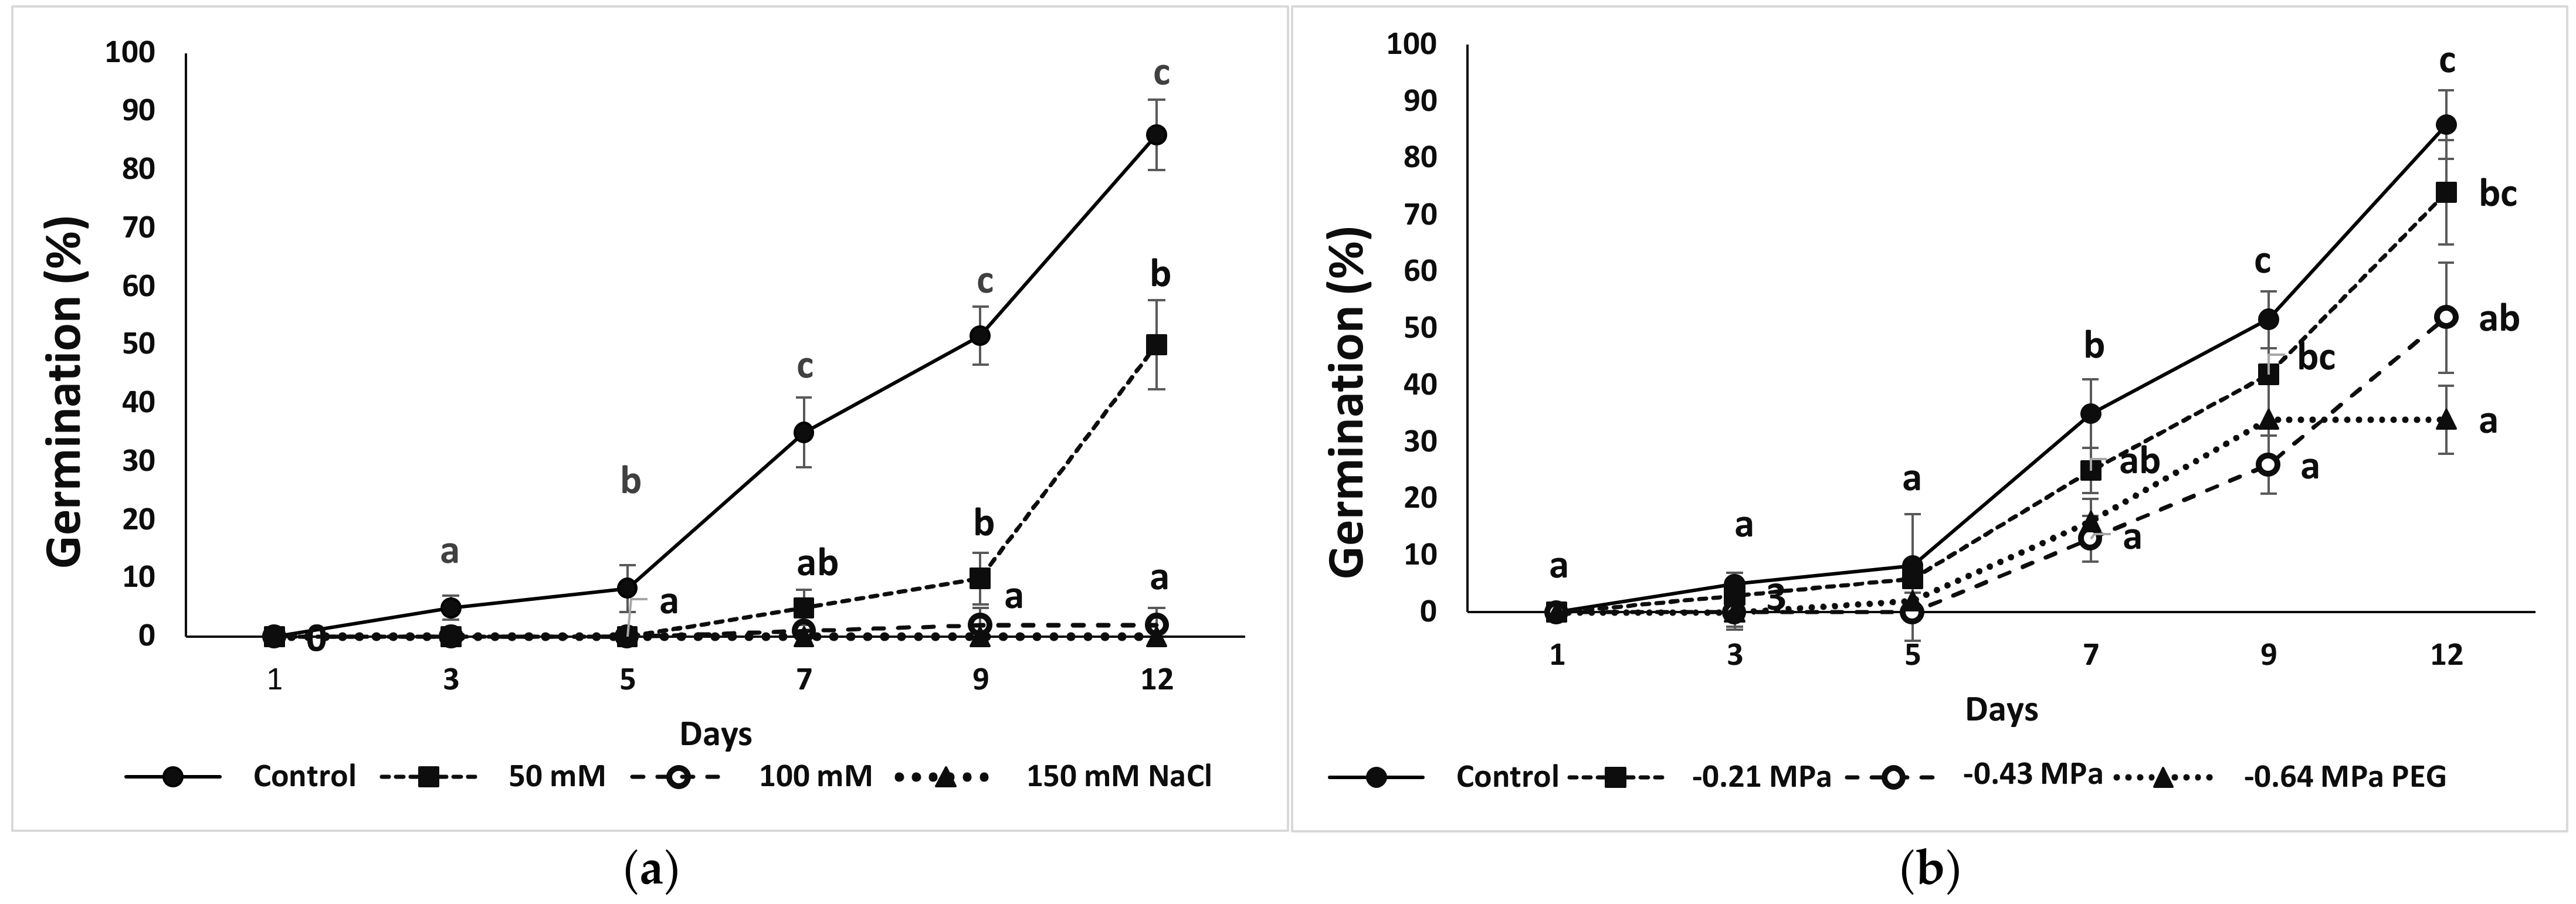
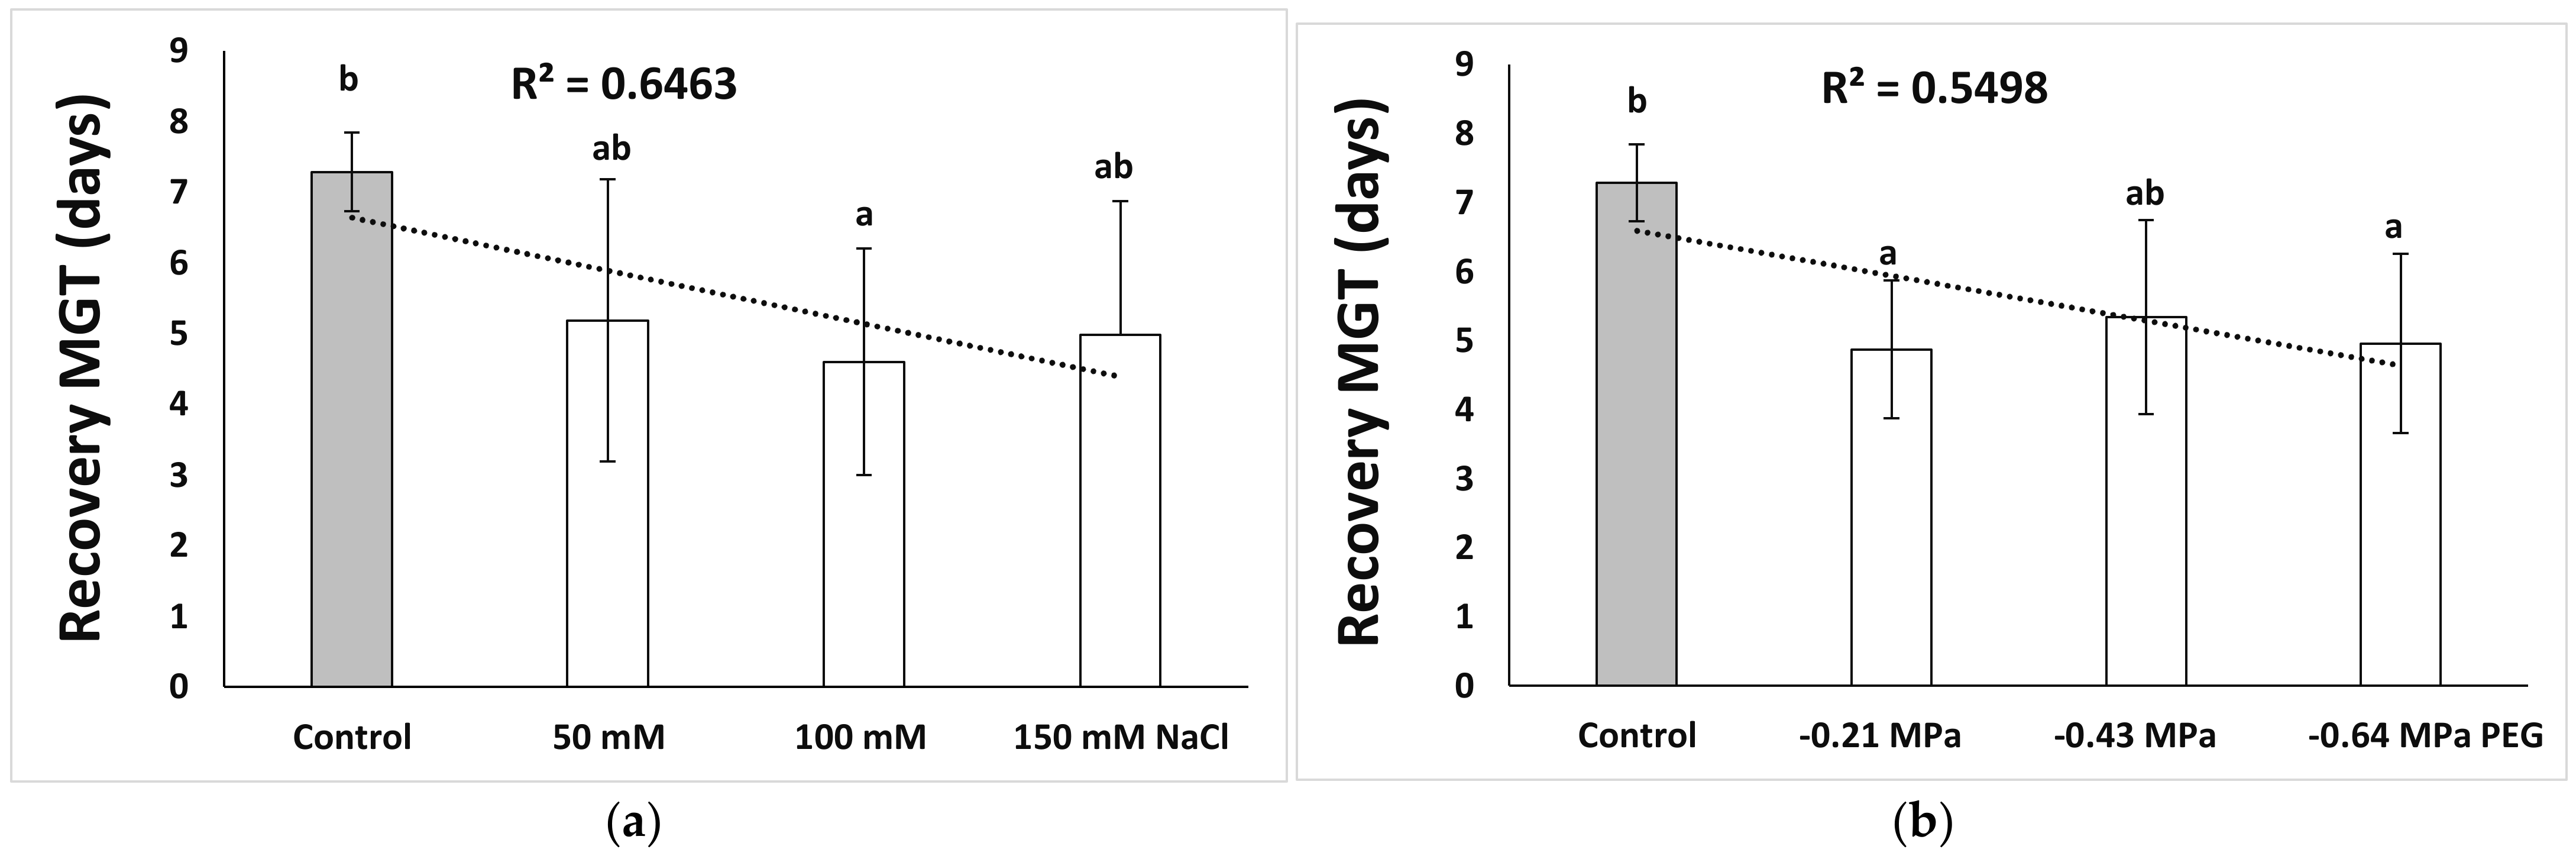
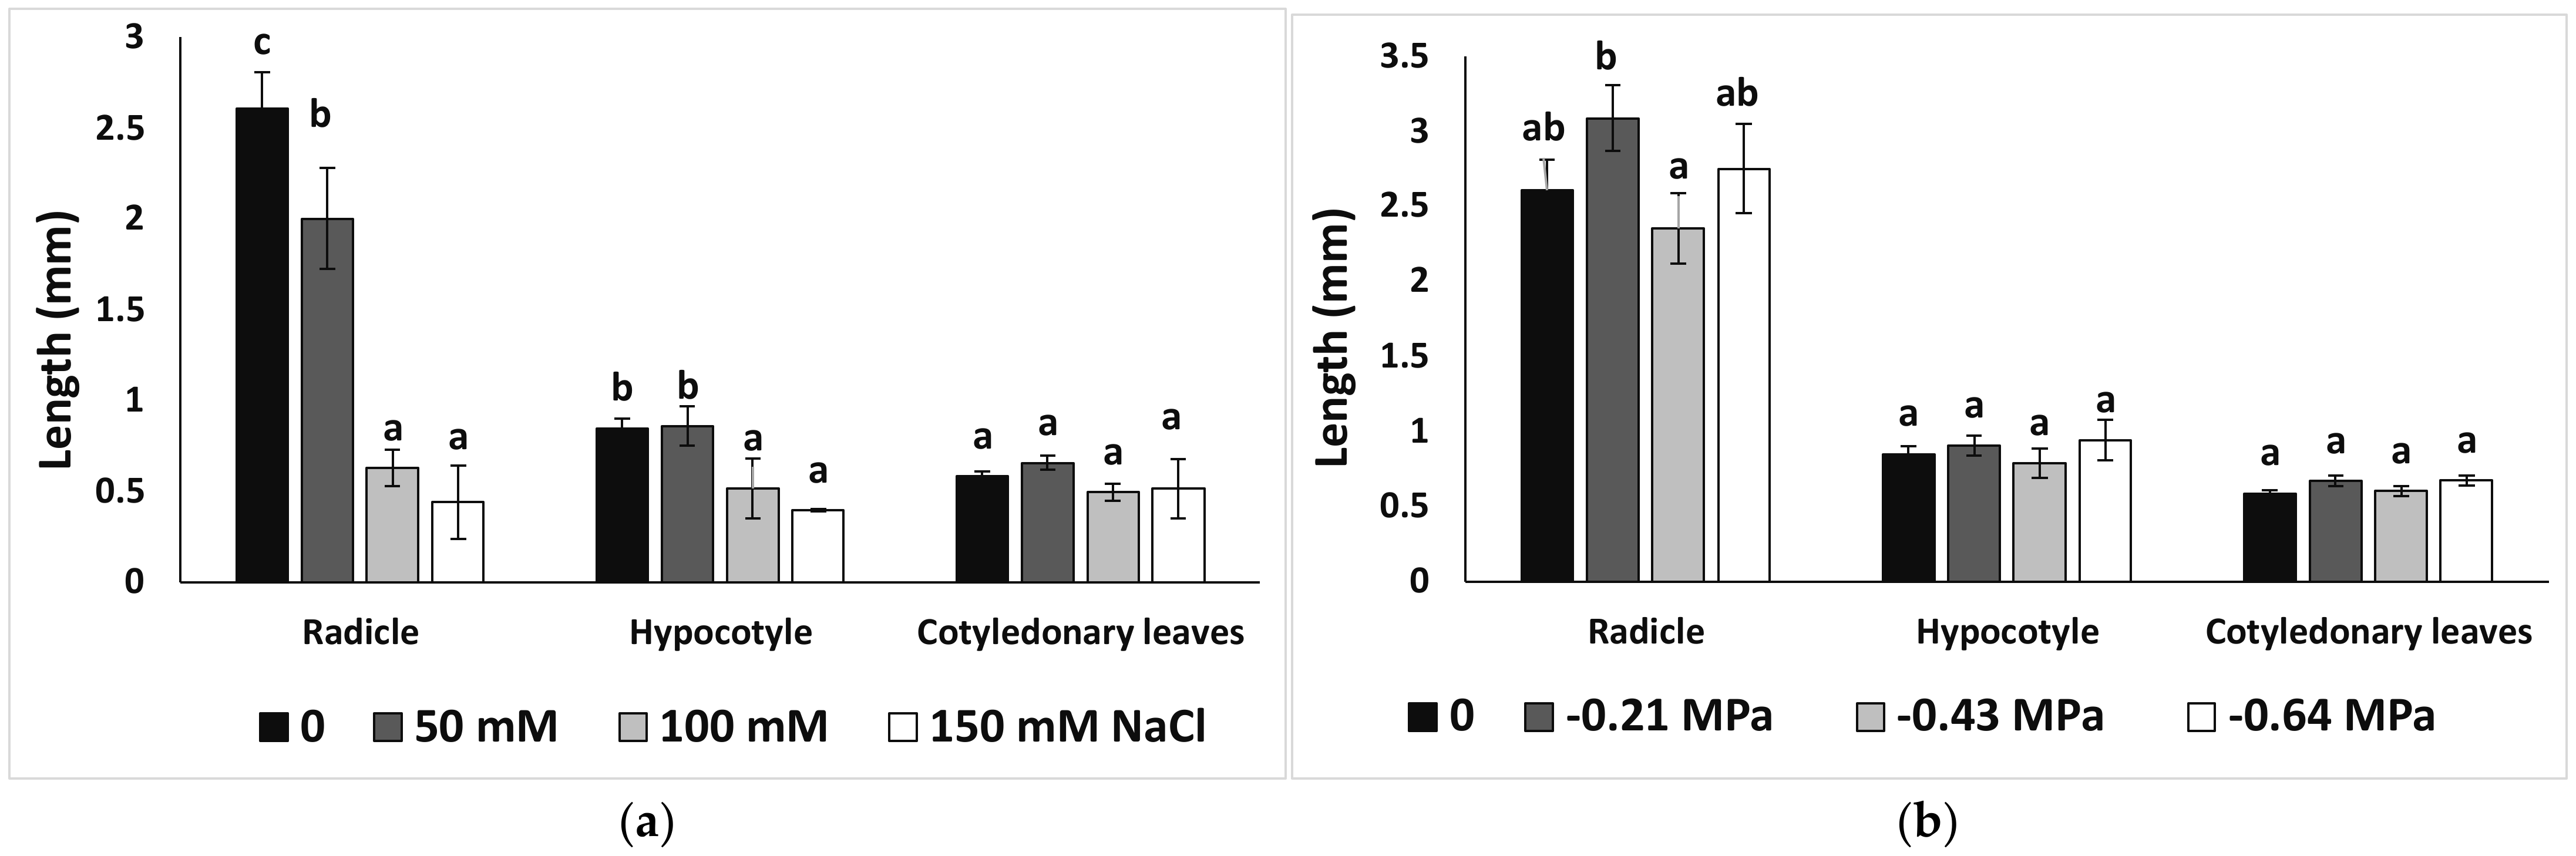
3.1. Seed Germination and Recovery of Germination

The seeds germinated within two weeks in a percentage of 86% under the control conditions, whereas only 50% of the seeds germinated under 50 mM NaCl. The seed germination was drastically decreased to 2% at a salt concentration of 100 mM and was completely inhibited at 150 mM NaCl (Figure 2a). On the contrary, the effect of PEG was not so drastic since seeds that were germinated in isosmotic concentrations of PEG corresponding to the tested salinities, at percentages of 74%, 52%, and 34%, respectively (Figure 2b).
To assess the recovery capability of moth plant seeds that were subjected to stress conditions, ungerminated seeds from treatments with either NaCl or PEG were thoroughly washed and transferred to new Petri dishes with filter paper that was moistened with distilled water. The germination percentage was higher in the recovery treatment than in the control one since the seeds germinated within one week and all the seeds, coming from the different salinity (Figure 3a) or PEG treatments (Figure 3b), reached a germination percentage of 100%.
Interestingly, we found that salt treatments linearly decreased the velocity of germination, dependent on the concentration of salts (Figure 4a), whereas a similar effect was not observed on PEG-treated seeds, for which the mean germination time was maintained similar to values that were registered for the control seeds, or even was shorter at some concentrations (Figure 4b).
In both recovery treatments, either after exposure to NaCl or PEG, the germination speed increased, as revealed by a mean germination time lower than in previous control treatments (Figure 5a,b).
After the two-week-long germination experiments, the lengths of the radicle, hypocotyl, and cotyledonary leaves of the seedlings were analysed using ImageJ software. Seedlings that were germinated under all NaCl concentrations showed a significant reduction in the length of the radicle, whereas hypocotyl length was only reduced in the presence of 100 and 150 mM NaCl (Figure 6a). The cotyledon length did not vary between germinating seeds at any salt concentration (Figure 6a). However, a different effect was observed for the seedlings that were grown under PEG-induced osmotic stress since radicle, hypocotyl, and cotyledon length did not differ significantly from those of the control at any PEG concentration that was tested (Figure 6b). Finally, none of the seedlings that were obtained from the recovery experiments showed any significant difference compared to the corresponding controls (data not shown).

3.2. Substrate Analysis

The substrate water accumulation was measured after the salt and drought experiments and was compared to that under the control conditions. As expected, the substrate moisture was drastically reduced upon the water stress treatment since the pots were not irrigated for one month (Table 1). On the contrary, non-significant differences in moisture levels were registered between the control and the substrates that were watered with different salt concentrations, except for a slight decrease at the highest tested, 600 mM NaCl (Table 1). On the other hand, the substrate electric conductivity (EC1:5) was significantly higher than in control, in a dose-dependent manner, between the salt treatments, whereas drought stress did not cause any significant change in the substrate EC (Table 1).

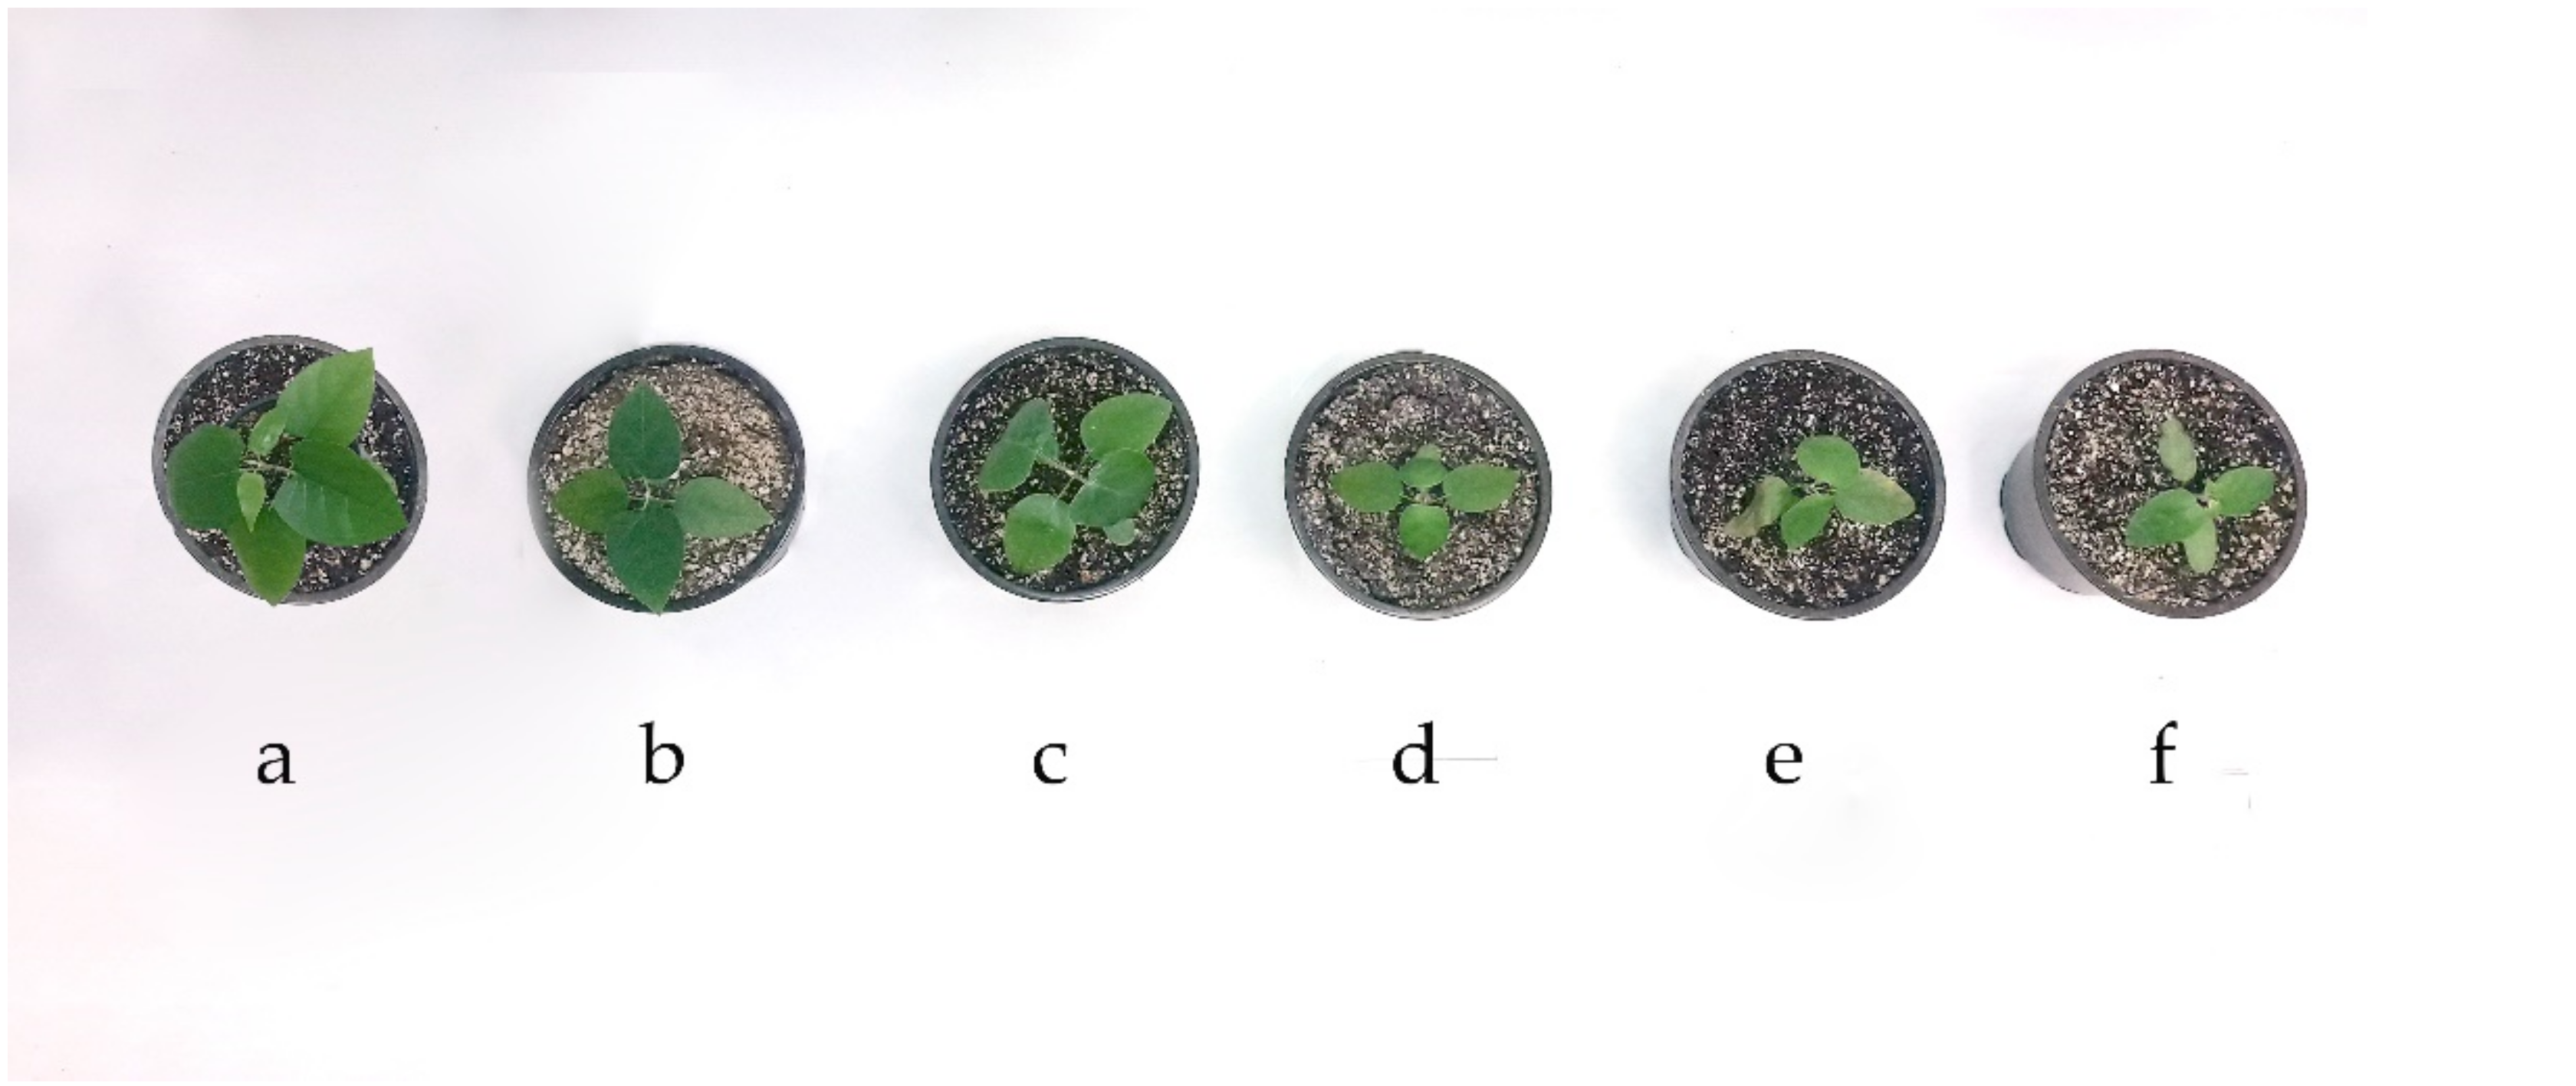
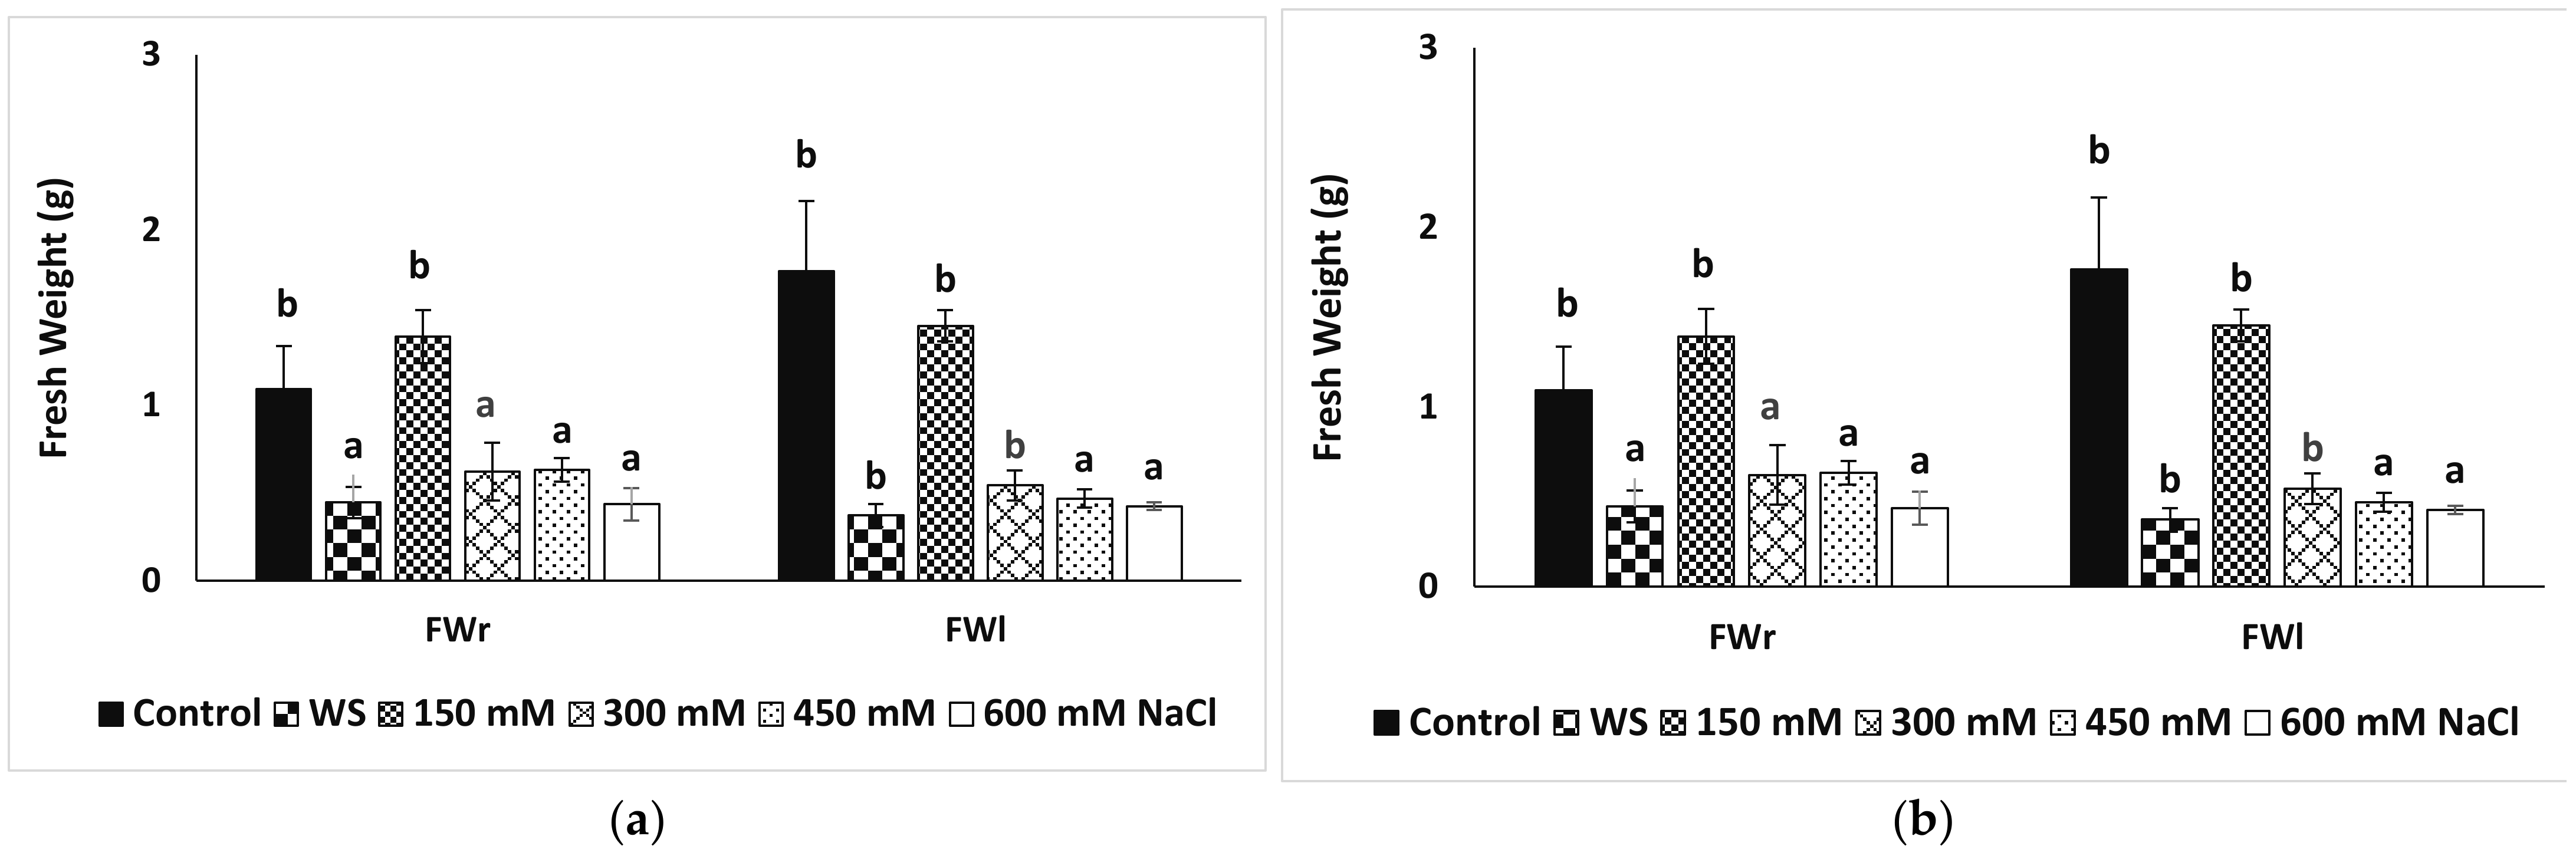
3.3. Growth Parameters and Photosyntetcic Pigments

A general plant response to abiotic stress conditions is the reduction of growth, as has been observed for Araujia sericifera plants in our experimental water deficit and salt-stress treatments (Figure 7).
The average fresh weight (FW) of the roots and leaves of the plants that were watered with 150 mM NaCl did not differ significantly from those of the control, non-stressed plants (Figure 8a). On the contrary, a substantial reduction was registered for plants that were subjected to water stress (60 and 80% reduction for the root and leaf FW, respectively) or higher salt concentrations (Figure 8a). Growth inhibition under salinity conditions was concentration-dependent, with the strongest reduction observed in the presence of 600 mM NaCl (60 and 75% FW reduction for the roots and leaves, respectively) (Figure 8a).
The water content in the roots decreased significantly, but only slightly (up to 7%) in response to all applied stress treatments. Similarly, the water stress and high salt concentrations (450 and 600 mM NaCl) induced a significant but still small reduction of the leaf water content (up to 11% with respect to the non-stressed controls) (Figure 8b). Therefore, the observed reduction of the root and leaf fresh weight was, indeed, primarily due to the inhibition of growth and not to a substantial water loss under stress.
To further assess the effect of water and salt stress on moth plant growth, additional morphological parameters, such as the increase in stem length and leaf number, and the leaf mean area, were measured for the control plants and those that were growing under the different applied stress treatments (Table 2). Supporting the fresh weight data, all these growth parameters showed a significant reduction in plants that were subjected to water deficit compared to the non-stressed controls. Salt stress also caused a significant relative reduction in the observed stem length and the leaf number increased during the experiments in a concentration-dependent manner, whereas the mean leaf area did not differ from the control in the presence of 150 mM NaCl but only at higher salt concentrations (Table 2). More specifically, the stem length increase, leaf number increase, and the mean leaf area were reduced to ca. 47%, 64%m, and 32% of the corresponding controls, respectively, in the water-stressed plants. The effect of the 600 mM NaCl treatment was a reduction to 40%, 58%, and 26% of the non-stressed controls, respectively, for the same variables (Table 2). To summarise, moth plant growth was inhibited by drought and salt stress, the latter in a concentration-dependent manner.
Finally, the leaf contents of photosynthetic pigments were determined. Drought stress caused no significant alteration, neither on chlorophylls a and b nor on carotenoid contents (Table 2). On the other hand, increasing the salt concentration generally induced a significant, concentration-dependent reduction of all the pigments that were tested (Table 2). The Chl a, Chl b, and Caro levels in plants that were subjected to 600 mM NaCl were reduced by 55%, 47%, and 52%, respectively, compared to plants that were grown under control conditions.

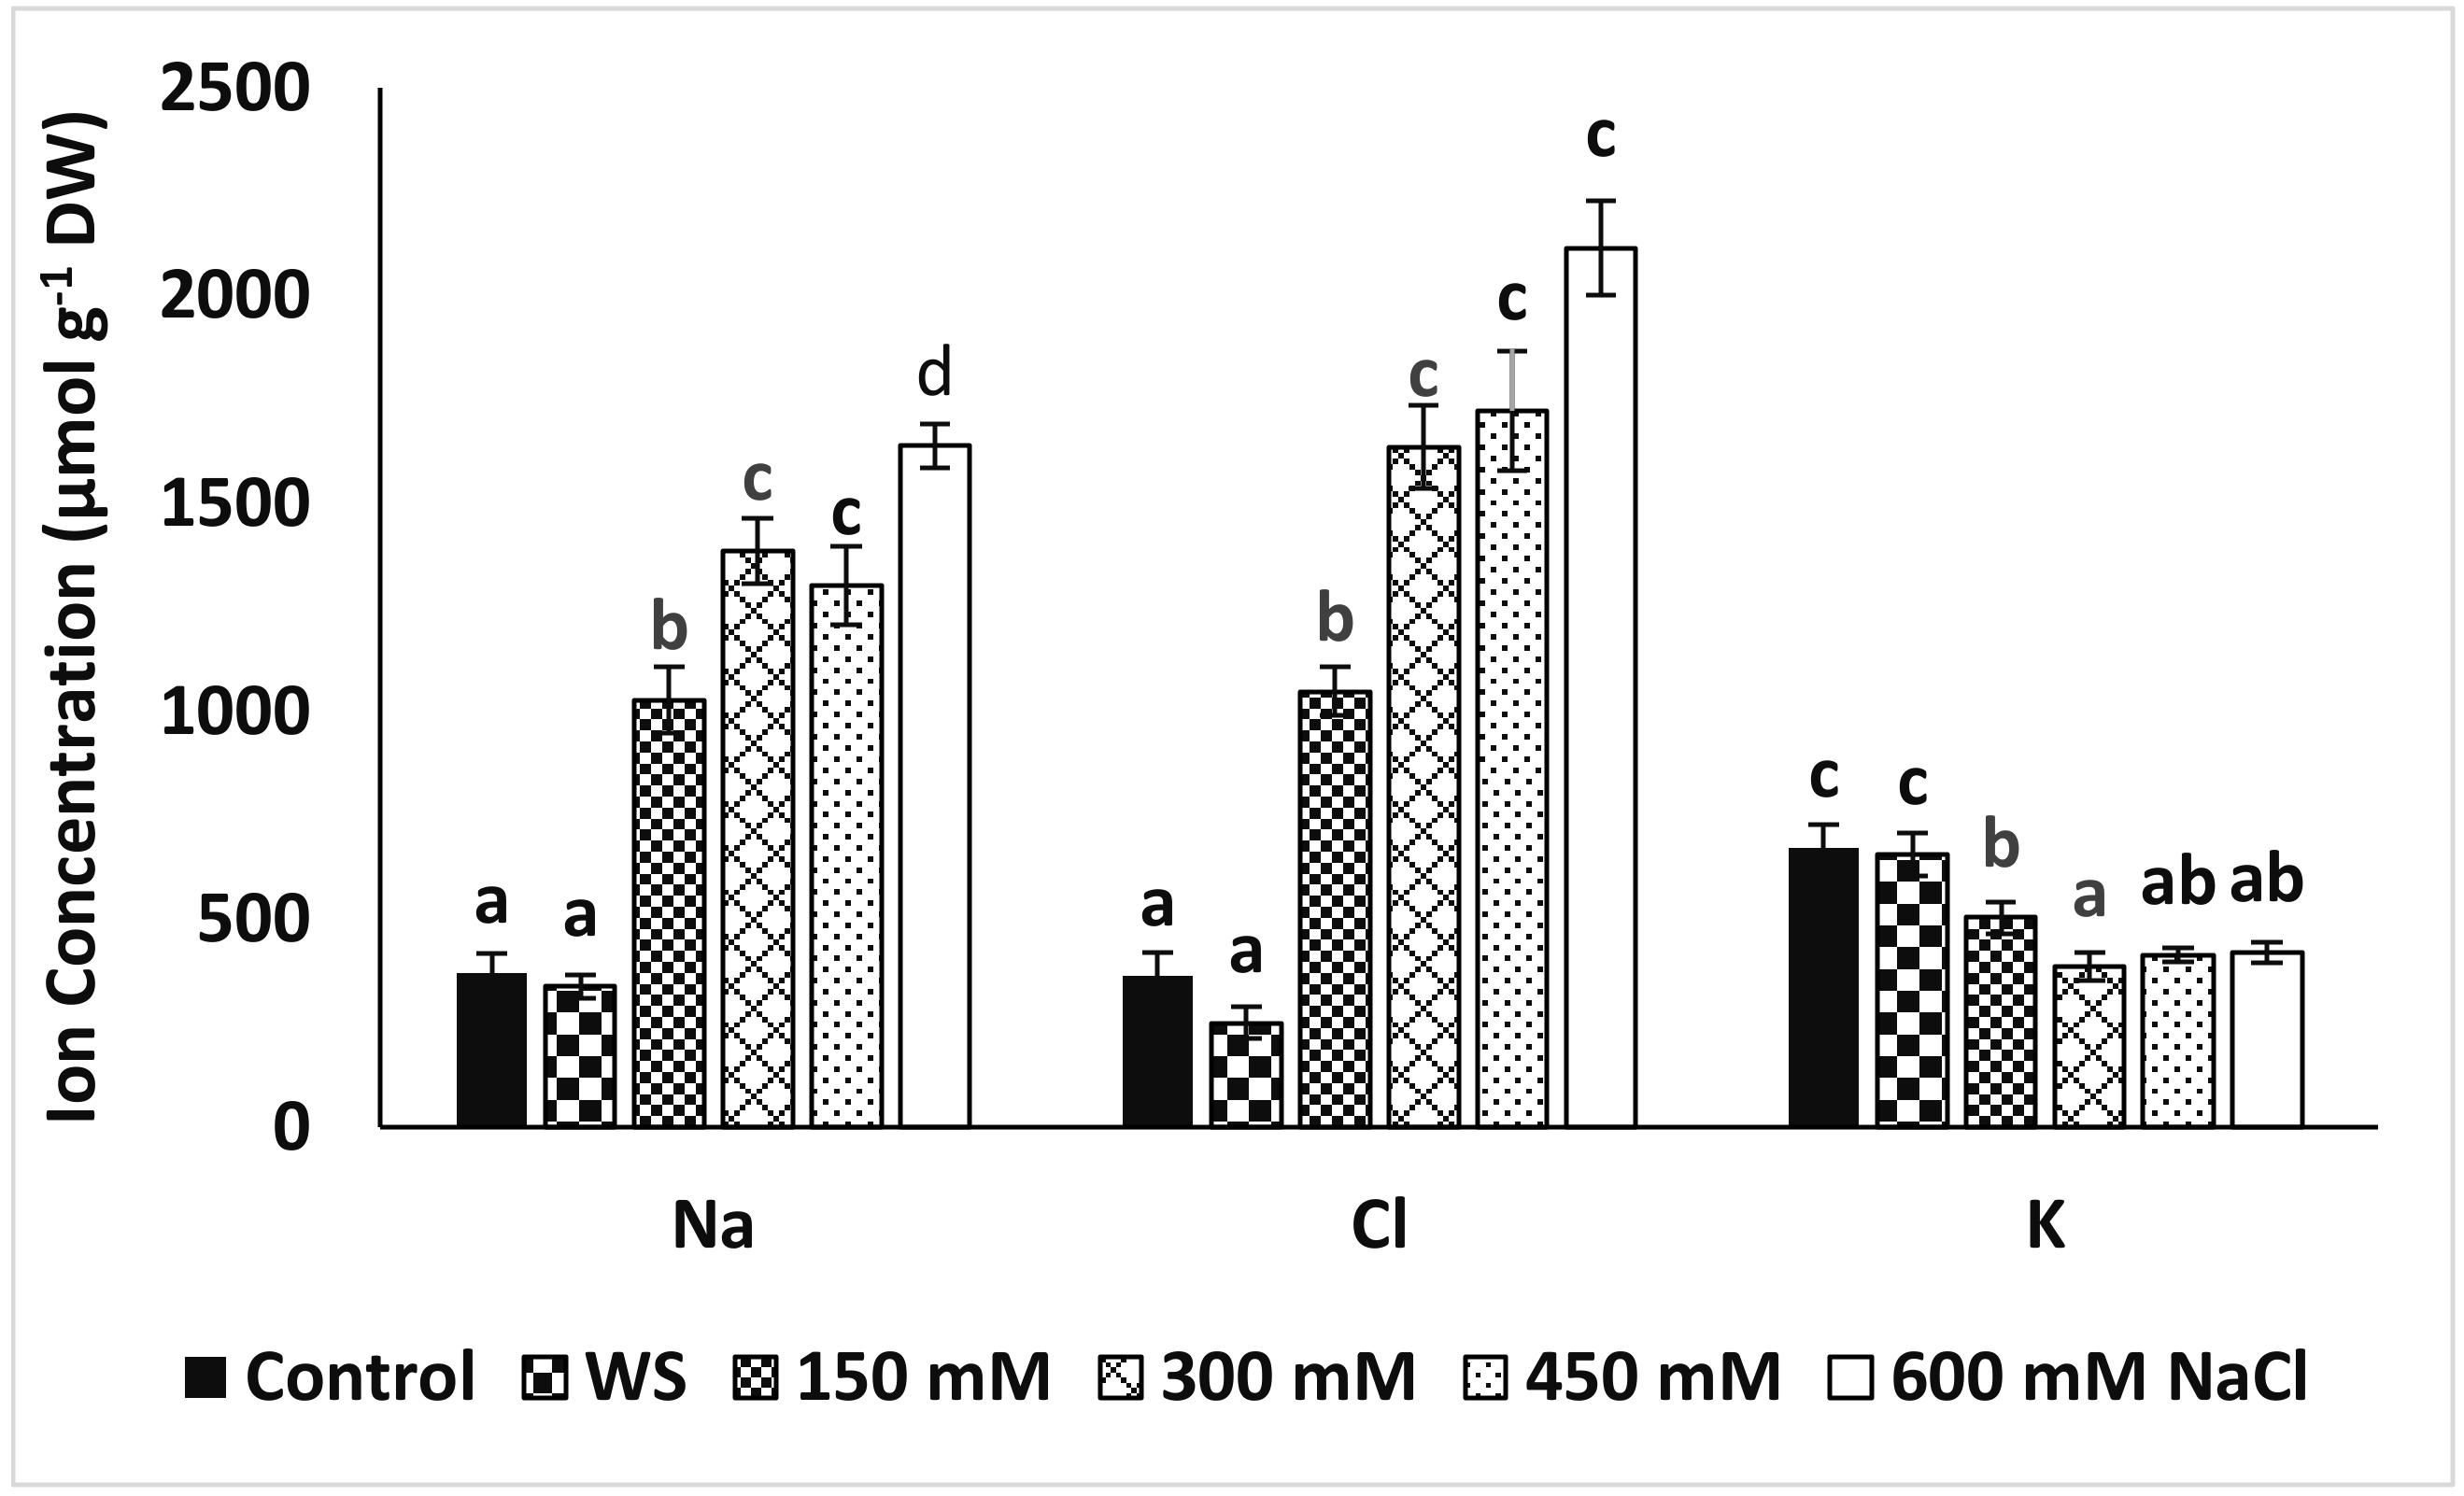
3.4. Ion Accumulation in Leaves

The leaf contents of monovalent ions (Na+, Cl, and K+) were determined since the control of ion transport and ion homeostasis is one of the essential plant responses to abiotic stress. The leaves that were excised from water-stressed plants did not show any significant difference in Na+, Cl, or K+ accumulation compared to the control plants (Figure 8). However, Na+ and Cl- leaf levels increased in the salt-treated plants, in parallel to the increase in NaCl concentration in the irrigation solution (Figure 9). The highest concentrations of Na+ (1639 μmol g−1 DW) and Cl- (2116 μmol g−1 DW) were measured on leaves that were excised from the plants that were grown in the presence of 600 mM NaCl. On the contrary, the leaf K+ contents were not affected by the lowest salt concentration, compared to control plants (674 μmol g−1 DW), whereas significantly lower K+ levels were determined for higher NaCl concentrations, with a minimum of 422 μmol g−1 DW for the 600 mM NaCl treatment (Figure 8).

3.5. MDA, Non-Enzymatic Antioxidants, and Antioxidant Enzyme Activities

Different biochemical assays were performed using leaf extracts of moth plants that were grown under control or stress conditions to gain insight into the abiotic stress tolerance mechanisms that were mediated by the activation of antioxidant systems. The malondialdehyde (MDA, an excellent oxidative stress biomarker) leaf contents increased significantly with respect to the control value in all the stress treatments, with a maximum increase (3.1-fold) that was observed in the presence of 600 mM NaCl (Table 3). Differences in the total phenolic compounds (TPC) accumulation were minor, and only significant in plants that were treated with high salt concentrations, with a maximum measured increase of 1.4-fold in the presence of 600 mM NaCl compared to the control plants (Table 3). On the contrary, antioxidant flavonoids (TF) contents increased significantly in response to all the stress treatments, 2.38-fold over control values in the water-stressed plants, and from 1.76-fold to 3-fold in plants that were treated with 150 and 600 mM NaCl, respectively (Table 3).
Regarding antioxidant enzymes, catalase activity did not vary significantly under any of the applied treatments (Table 3). On the other hand, superoxide dismutase, ascorbate peroxidase, and glutathione reductase specific activities increased significantly in a concentration-dependent manner, in response to the salt treatments. The maximum values were 4-fold, 16-fold, and 3.9-fold higher than in the corresponding non-stressed controls, respectively, and were calculated in the presence of 600 mM NaCl (Table 3). Interestingly, only the APX activity, but not any of the other enzyme activities that were tested, increased significantly (7.6-fold higher than in the control) in plants that were subjected to water-deficit conditions (Table 3).

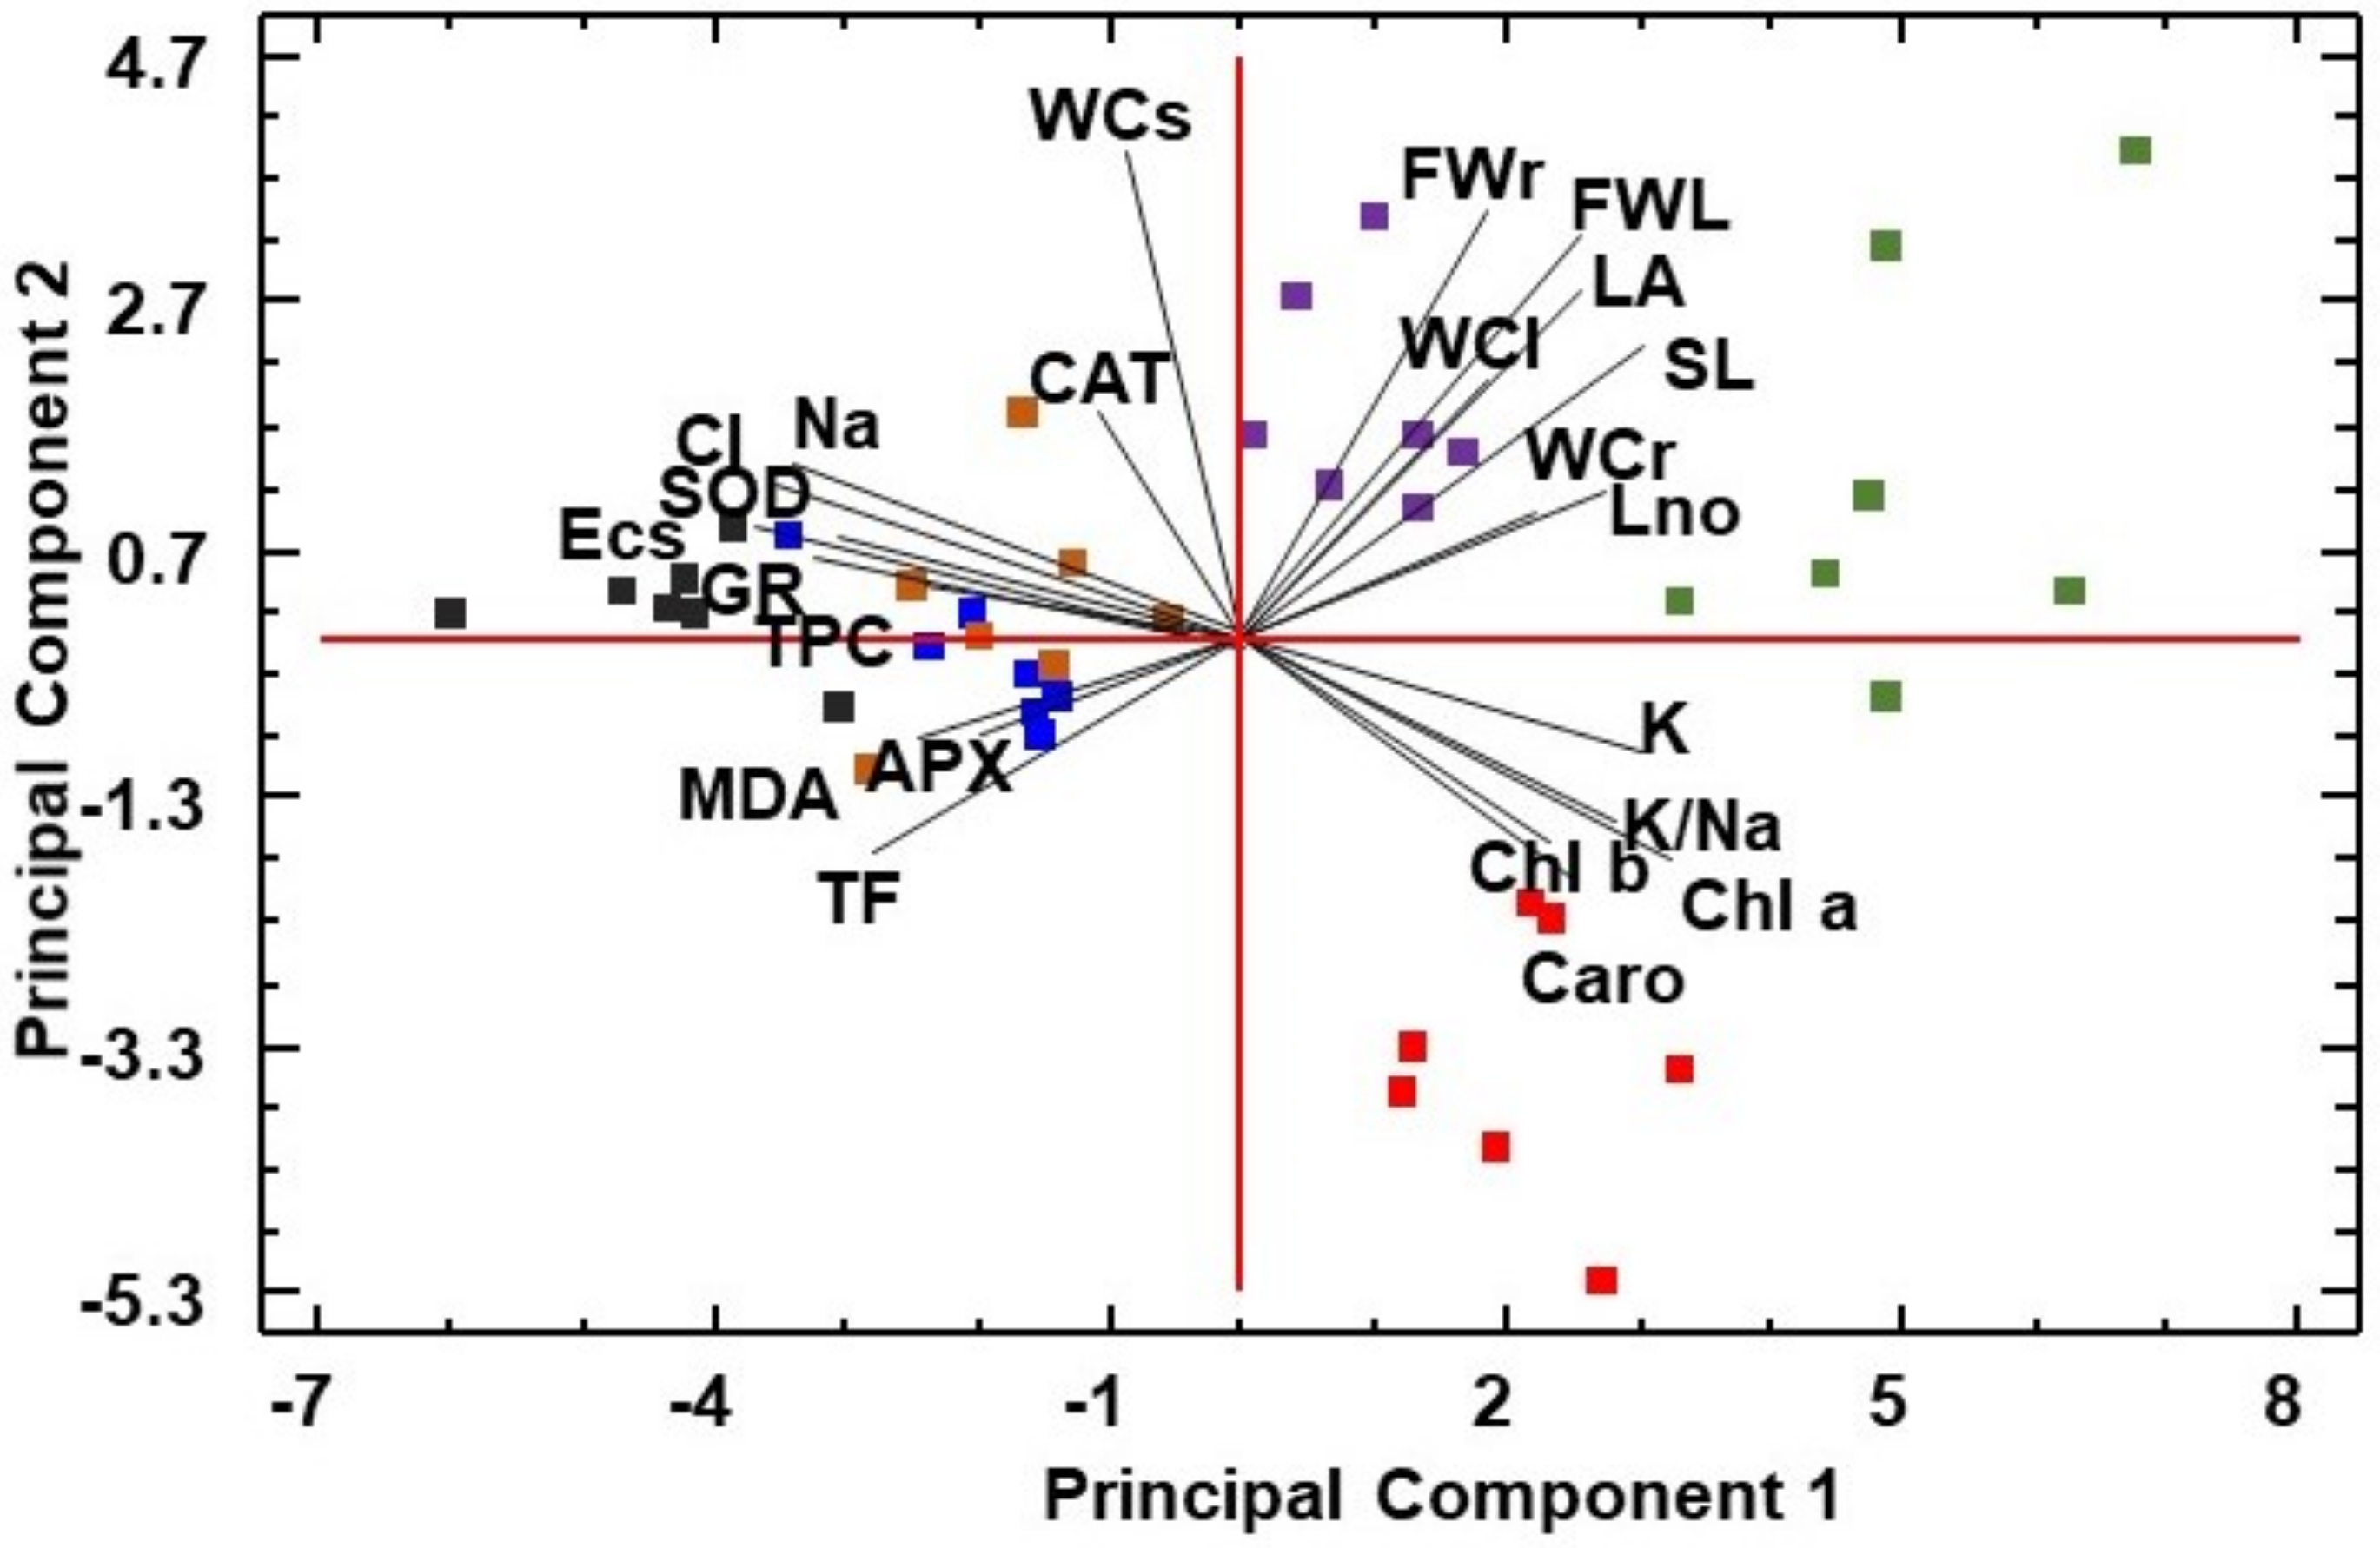
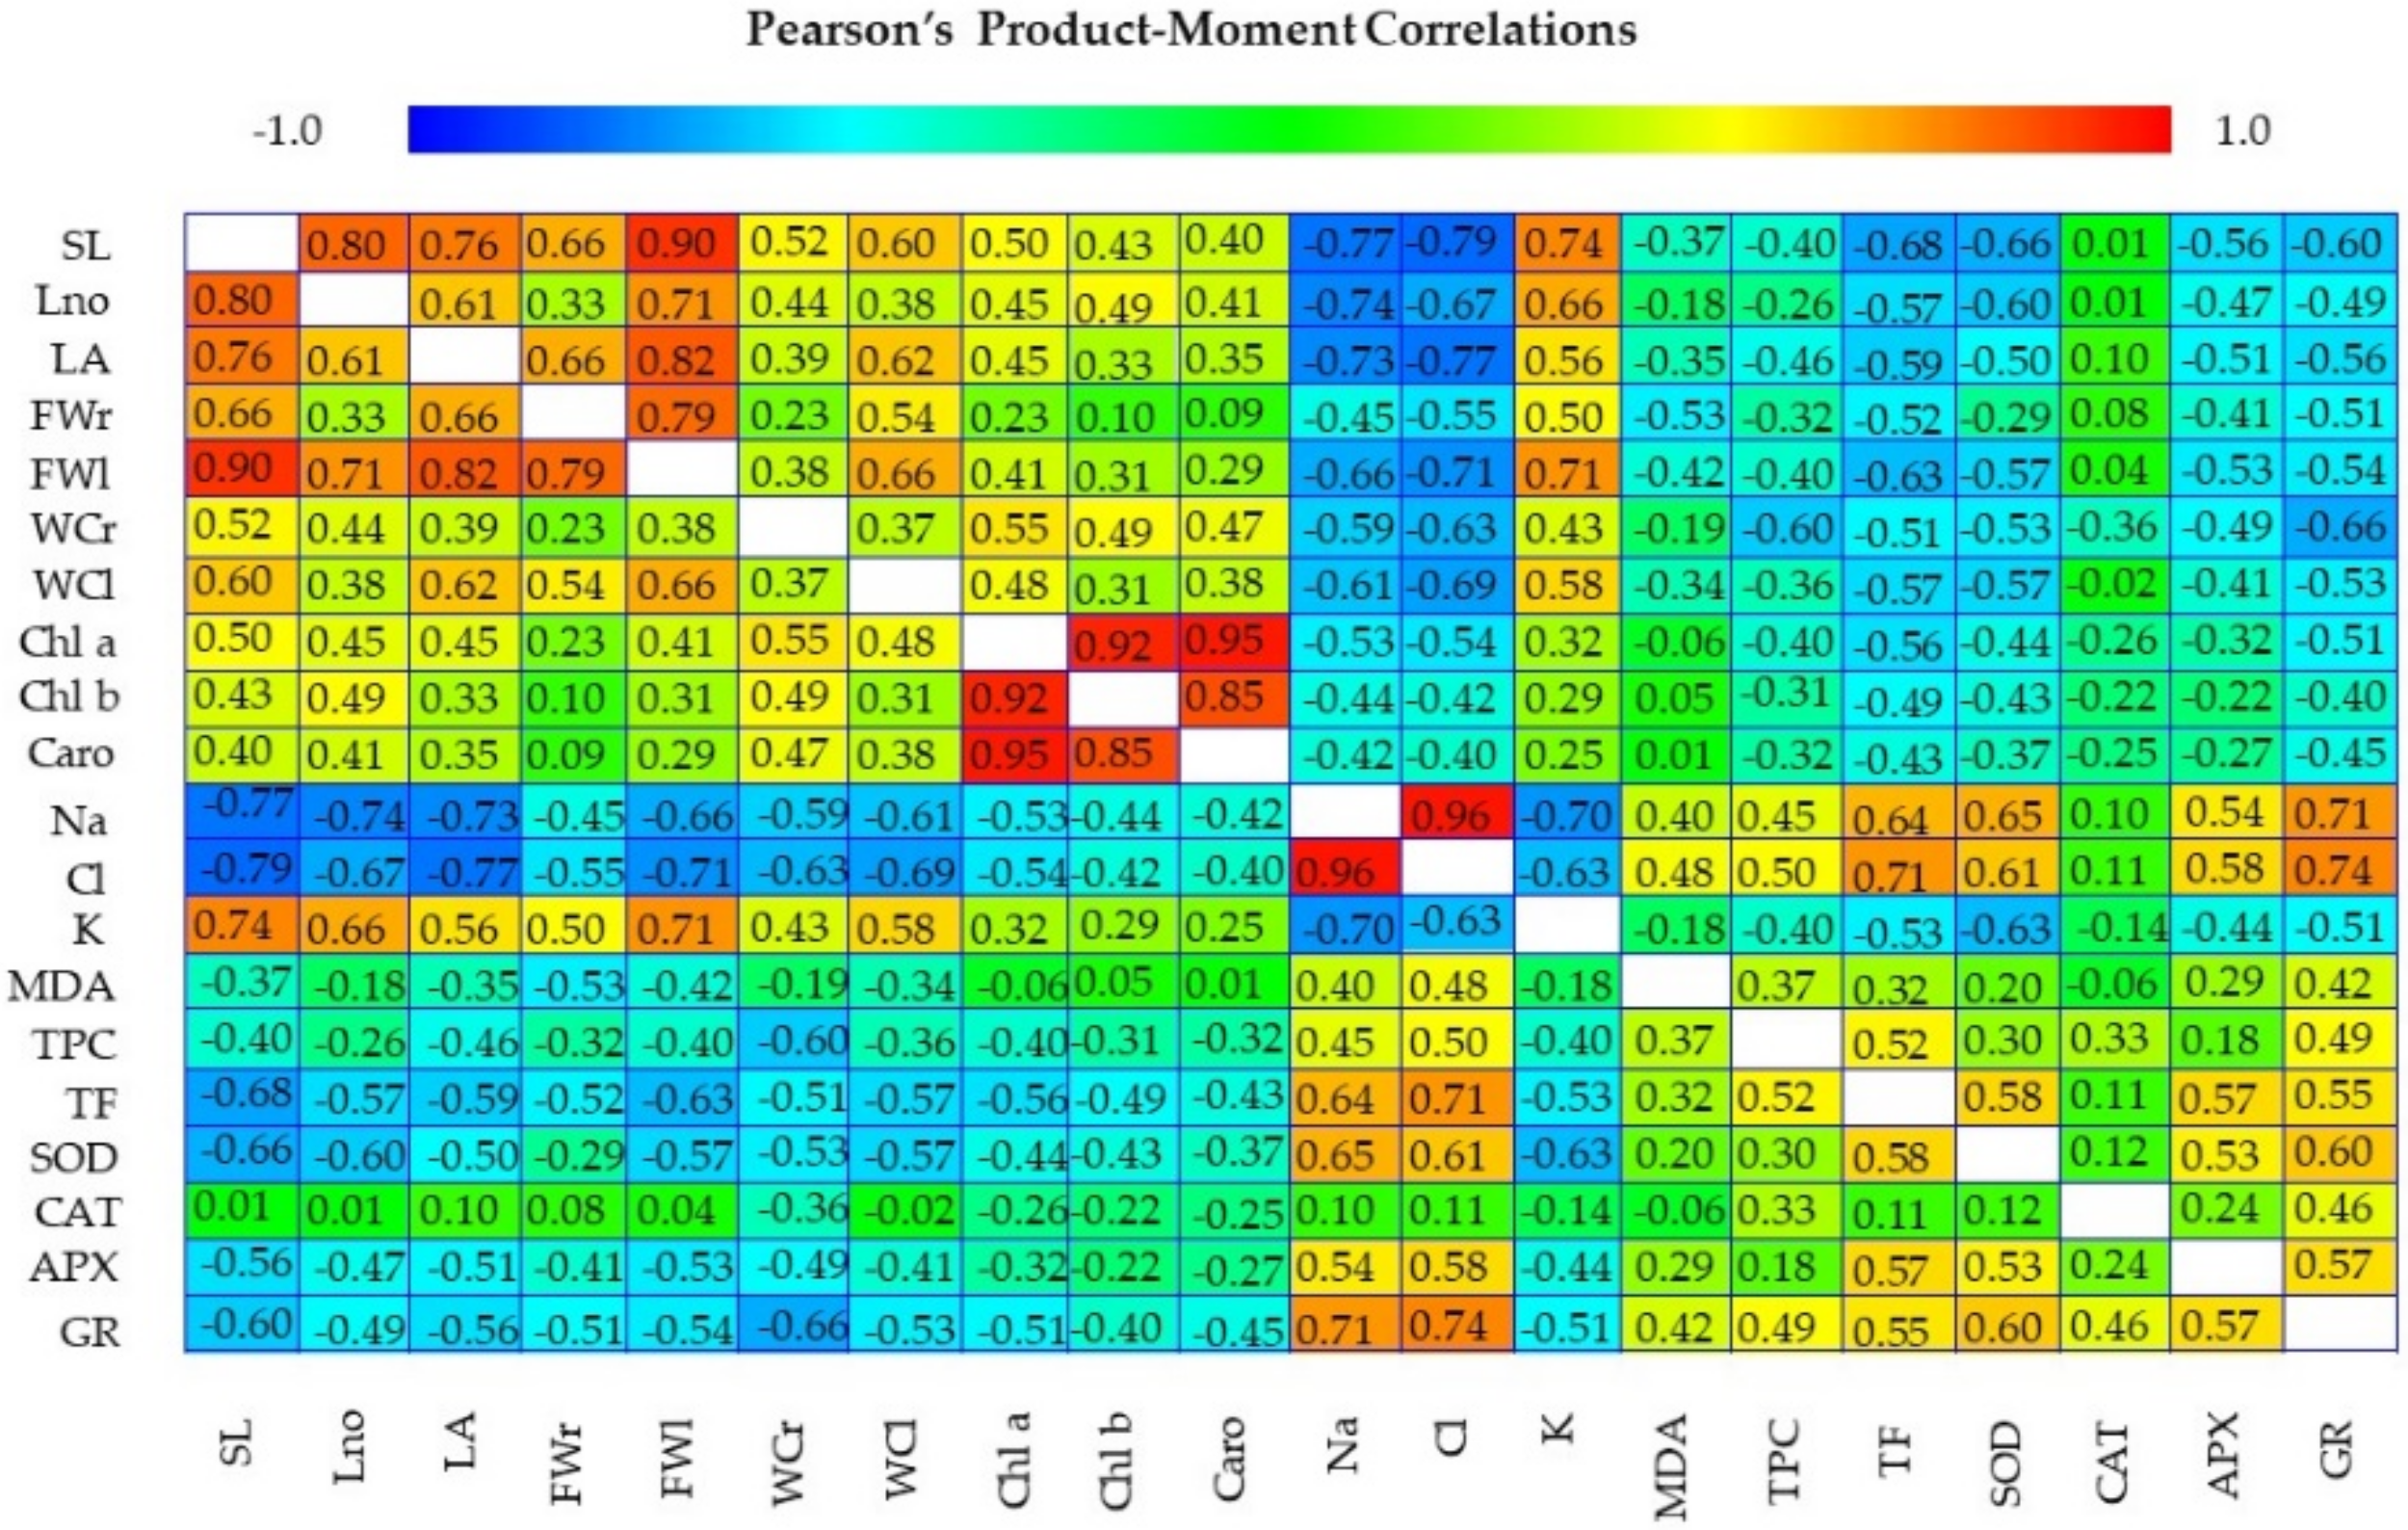
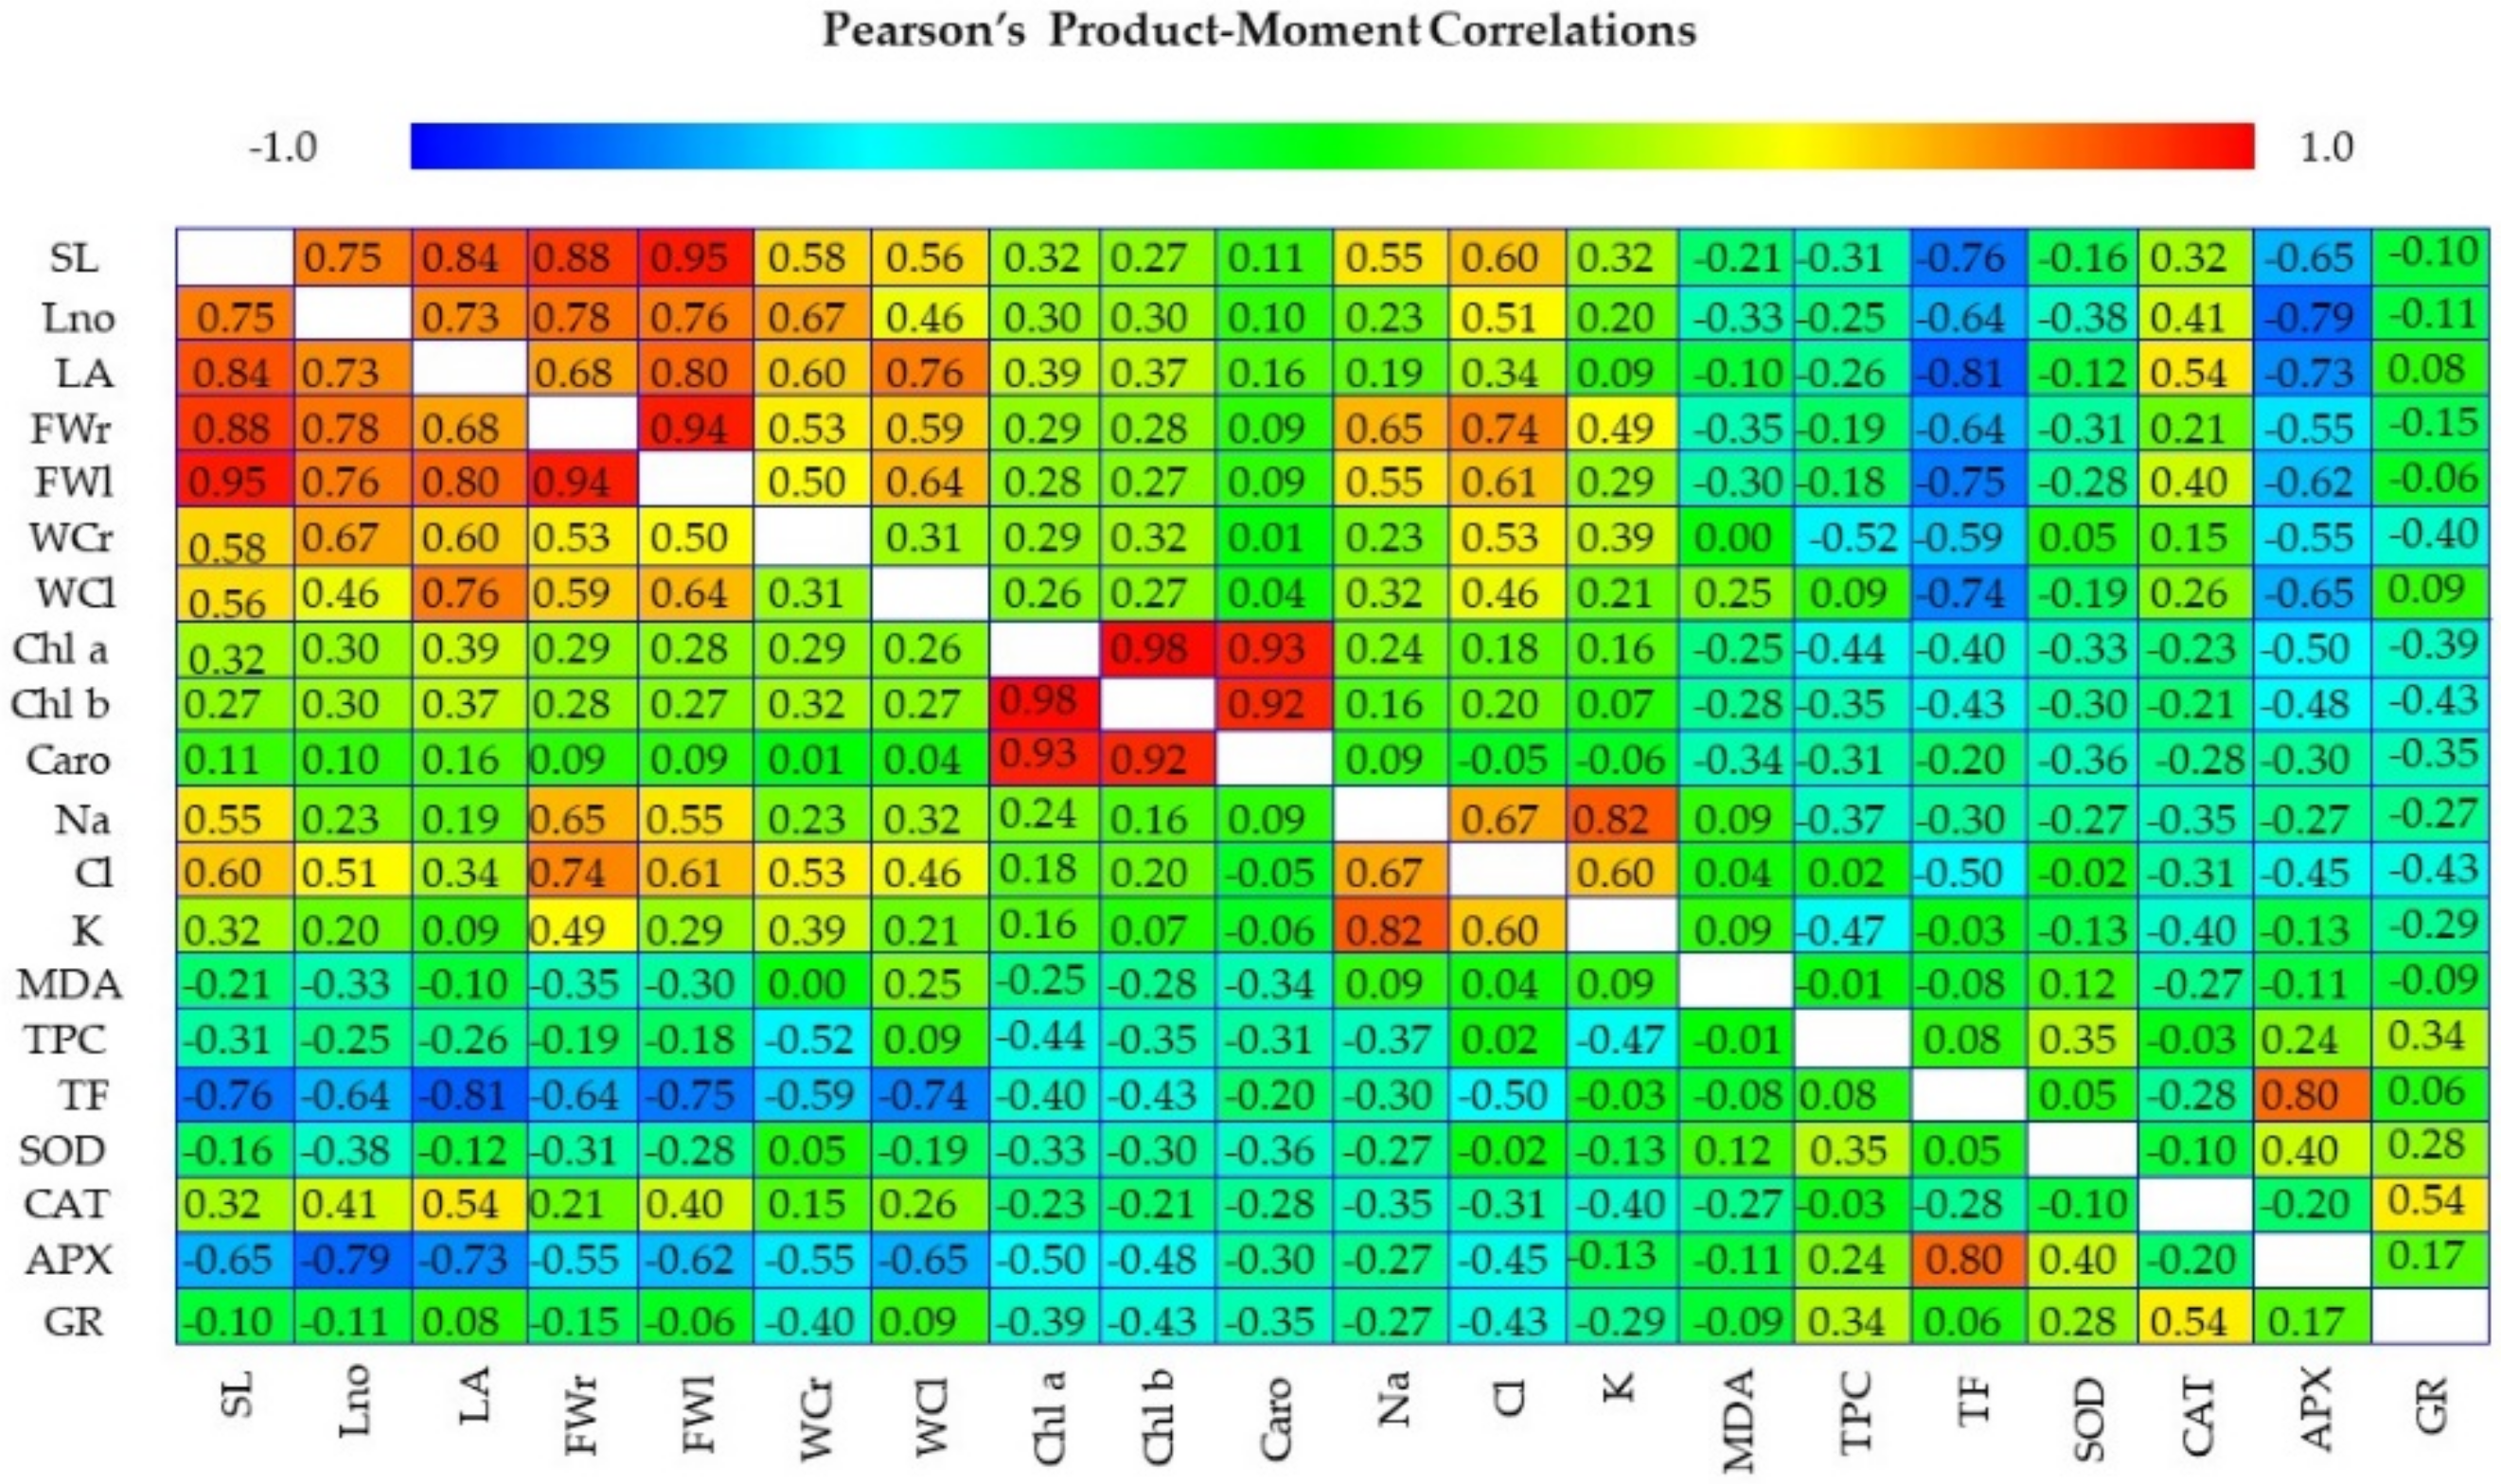
3.6. Multivariate Analysis

A principal component analysis (PCA) was carried out with all parameters that were measured in plants and their corresponding substrates (Figure 10). A total of five components had an eigenvalue that was higher than one, covering 80% of the total variance. The first component explained 49.5% of the variance and was related mainly to the substrate electric conductivity (ECs), whereas the second component, explaining an additional 16.5%, was related to the substrate moisture (WCs). The substrate EC was negatively correlated with photosynthetic pigments, K and the K/Na ratio, and positively correlated with Na, Cl, SOD, and GR. The growth parameters were dispersed along the OY axis, and were positively correlated with the substrate’s moisture, and negatively correlated with TF and MDA accumulation and the APX activity. The scatter plots of the analysed individuals indicated a clear separation of the treatments. The plants that were subjected to water stress were grouped separately from all the other treatments, whereas those from the 300, 450, and 600 mM NaCl treatments were situated more closely, with a certain degree of overlapping for 300 and 450 mM NaCl, due to similar responses of plants to these salt concentrations.
Pearson’s correlations were performed separately for the two stresses that were applied: salt stress (Figure 11) and water deficit (Figure 12), including all parameters that were measured in the plants. In both cases, as expected, all the growth parameters were strongly positively correlated with each other, as well as with the photosynthetic pigments (Figure 11 and Figure 12). However, some clear differences could be detected in the responses to the two treatments. In the case of salt stress, the growth variables correlated positively with potassium but negatively with sodium and chloride, whereas a negative correlation between sodium and potassium variation was observed (Figure 11). Such ion-dependent correlations were not significant in the analysis that was performed for the water stress treatment (Figure 12).
Regarding the variation of the antioxidant compound contents and the activity of antioxidant enzymes under salt stress, the strongest negative correlations with growth parameters were detected for total flavonoids (TF), superoxide dismutase (SOD), and glutathione reductase (GR), the latter positively correlated with sodium and chloride concentrations (Figure 11). Under water stress, the total flavonoids and ascorbate peroxidase showed the strongest negative correlations with the growth parameters (Figure 12).

4. Discussion

It is generally considered that global warming will favour biological invasions, as the higher plasticity of invaders may allow their better adjustment to warmer and drier conditions in the background of the new climatic scenario [43]. Climatic change can shift the distribution of plants, enabling the expansion of invasive species in new areas [44]. As global warming can worsen conditions for both invasive and native species, an interesting question is to assess the limits of abiotic stress tolerance of such species.
Propagule size and output are traits of outstanding importance for plants ability to colonise new environments. Invasive plant species often produce a large number of seeds that helps their seed dispersal, which contributes to their invasion capability success [45]. Germination in Araujia sericifera has been reported to be fast and efficient, with a high percentage of germination within two weeks under different experimental conditions, reduced only by low temperatures and darkness conditions [46]. Our data confirmed a seed germination percentage of 86% when seeds of A. sericifera were sown under control conditions, whereas the seed germination rate decreased in the presence of salt. Interestingly, seed germination was maintained at levels of 50% in the presence of 50 mM NaCl. Germination and early seedling development represent the bottleneck of the life cycle of plants, which are, in general, extremely susceptible to salinity at this developmental stage. Even the germination of halophytes can be inhibited at salt concentrations that are much lower than those at which adult plants usually grow [47,48,49,50,51]. For instance, 50 mM NaCl was reported to strongly reduce germination in several halophytic species [50], and the germination rate of the halophyte Plantago crassifolia decreased to 13% in the presence of 100 mM NaCl [51]. In addition to its toxicity, salt stress includes an osmotic component, altering water imbibition by seeds [52]. Germination in polyethylene glycol (PEG) solutions is the standard method to test the osmotic effect on germination, which mimics environmental drought conditions [53,54,55]. Moth plant seeds could germinate at a 34% ratio even under the highest PEG concentration that was tested. Therefore, our findings indicate that salinity has a more inhibitory effect than PEG-induced osmotic stress on the germination of A. sericifera, as reported for many other species [55,56,57]. This effect can be explained by the ‘ion toxicity’ component of salt stress that, in addition to the osmotic component, has several deleterious effects in plants, including the inhibition of many enzymatic activities [58]. On the other hand, our results also show that seeds are not affected by prior exposure to NaCl or polyethylene glycol, as virtually all the seeds germinated at a high rate in the ‘recovery of germination’ assays, with meant that the germination time was approximately half of that which was observed for seeds under the control conditions. This behaviour is specific for stress-tolerant species and halophytes [51,59,60], as well as in plants that are adapted to other harsh environments [54].
Similarly, early seedling development was not affected by polyethylene glycol but inhibited by salt, at least at the higher (100–150 mM NaCl) concentrations that were tested. Therefore, the germination and seedling establishment of A. sericifera proved to be efficient under experimental conditions mimicking drought, and its seeds maintained full viability after two weeks of exposure to a salt concentration of up to 150 mM NaCl. This stress tolerance in the initial developmental phase could be one of the reasons for the rapid expansion of the species in Mediterranean areas, where environmental stress conditions are often severe.
A well-known competitive advantage of invasive species is their rapid growth [61,62]. Moth plants showed this behaviour in our experimental conditions, as shown, for example, by an increase of almost eight cm in the stem length and the formation of seven new leaves during the course of the experiment under the non-stress conditions. The leaf fresh weight and leaf water content are amongst the most reliable parameters for assessing stress tolerance [63]. In our experiments, the salt concentrations of 300 mM NaCl and higher had a growth-restricting effect. In the presence of 150 mM NaCl, however, the fresh weight of leaves and roots, leaf water content, and the leaf area did not change significantly compared to the values that were measured in the non-stressed plants, indicating that Araujia seedlings are not affected by salinities up to 9 dS m−1 (EC1:5) that were reached in this salt treatment.
Control of ion transport is a general response to salinity stress in plants. The uptake of toxic ions, Na+ and Cl-, and their compartmentalisation in the vacuole is an essential mechanism in dicotyledonous halophytes and glycophytes [47]. As expected, the salt treatments caused a concentration-dependent increase of Cl- and Na+ contents in the leaves compared to the control plants. Sodium accumulation is associated with a drop in the intracellular K+ levels, as the two cations compete for the same binding sites in proteins and ion transporters [47,64]. The regulation of Na+ transport and enhancement of K+ uptake and accumulation are the primary survival mechanisms of many glycophytes in saline environments [65]. The potassium concentration was maintained in the leaves of moth plants that were treated with 150 mM NaCl, probably contributing to the observed tolerance to moderate salinity of this species. At 300 mM and higher NaCl concentrations, the plants showed the general behaviour of significantly reducing leaf K+ accumulation.
As mentioned above, environmental stress conditions enhance the production of harmful reactive oxygen species (ROS), which plants try to mitigate by activating different antioxidant mechanisms. Assessing the efficiency of these mechanisms in invasive plants may facilitate understanding their high adaptability to new environmental conditions; therefore, this approach is getting more attention from the research community [4]. Several studies have focused on the activation of antioxidant enzymes under stress conditions [66,67,68,69], whereas others have associated the stress tolerance of invasive species with the accumulation of phenolic compounds [70,71,72]. We observed that all the stress treatments induced a significant increase in malondialdehyde levels that were at least two-fold higher than in the controls, confirming the generation of oxidative stress as a secondary effect of drought and high salinity conditions. The total phenolic compounds showed a significant increase only in response to the high salt concentrations, 450 and 600 mM NaCl. The antioxidant flavonoids contents, on the other hand, increased significantly in all the stress treatments, especially in conditions of water deficit and high salinities, reaching a maximum increase of three-fold over control values in the presence of 600 mM NaCl. Increasing the concentrations of total phenolic compounds and, specifically, flavonoids by growing the plants in the presence of salt may also have an economic interest. Although A. sericifera is considered an aggressive invasive species, it is also a valuable medicinal plant [73] due to its high content of phenolics, particularly the subgroup of flavonoids, and other bioactive compounds [74,75].
Regarding antioxidant enzymatic systems, except for catalase, the activity of the other tested enzymes, superoxide dismutase, ascorbate peroxidase, and glutathione reductase, significantly increased under salt stress. Moreover, APX activity was also enhanced by the drought stress treatment. Accordingly, a relevant enzymatic activity was previously reported in A. sericifera [76], and recently a novel peroxidase whose activity increases under osmotic stress that is induced by PEG was described [77]. A different response to drought and high salinity was observed concerning the activation of antioxidant mechanisms. Under salt stress, the multivariate analysis indicated a stronger effect on superoxide dismutase and glutathione reductase. SOD is considered the first line of defence against oxidative stress in plants [78]. It catalyses the removal of O2- by dismutating it into H2O2 and O2 [79]. Salt-tolerant plants, such as halophytes, have generally higher levels of SOD, and the activity of this enzyme generally increases in the presence of salt, whereas in salt-susceptible plants, both increases and reductions of SOD activity under salt stress have been reported [80]. Glutathione reductase is an oxidoreductase with the main primary function of maintaining the intracellular levels of reduced glutathione (GSH), which is involved in a wide range of essential functions and has a strong reducing potential [81]. Increased, decreased, or unchanged levels in GR activity have been reported, depending on the species and the experimental conditions, but non-tolerant plants appear to predominantly activate the glutathione-dependent scavenging system [82]. In our study, the strongest negative correlation with the growth parameters under water stress was detected for the total flavonoids and ascorbate peroxidase activity. Ascorbate peroxidases catalyse the conversion of H2O2 into H2O, using ascorbate as a specific electron donor [83], and play a key role in drought stress responses and following recovery from drought [84]. The stress-induced activation of these enzymes and the accumulation of flavonoids and other antioxidant phenolics probably contribute to the moth plant’s relative stress tolerance.

5. Conclusions

The results that are presented here reveal the relatively high tolerance of Araujia sericifera to water stress and moderate salinities. Seed germination is susceptible to salinity, but seeds maintained full viability after two weeks of exposure to salt, up to 150 mM NaCl. Osmotic stress, that was mimicked by PEG, did not affect the germination of the moth plant seeds. During vegetative growth, the plants responded better to a mild salinity of 150 mM NaCl than to water stress. Although growth was reduced under stress, all the plants survived one month under salt concentrations as high as 600 mM NaCl, and also severe water deficit. The biochemical analysis of enzymatic and non-enzymatic antioxidant responses indicates that A. sericifera plants can efficiently activate antioxidant mechanisms. These findings suggest that moth plants may tolerate harsher environmental conditions and may be favoured in many areas of the world affected by climatic change.

Author Contributions

Conceptualization, L.A.B., M.B. (Monica Boscaiu) and O.V.; methodology, M.B. (Manel Bellache) and N.M.; software, N.T.-P.; validation, M.B. (Monica Boscaiu) and M.V.; formal analysis, M.B. (Manel Bellache); investigation, M.B. (Manel Bellache) and N.M.; resources, M.B. (Monica Boscaiu) and O.V.; data curation, R.M. and N.T.-P.; writing---original draft preparation, M.B. (Manel Bellache), M.B. (Monica Boscaiu) and M.V.; writing---review and editing, R.M. and O.V.; visualization, N.T. and R.M.; supervision, L.A.B. and M.B. (Monica Boscaiu); project administration, M.B. (Manel Bellache); funding acquisition, O.V. All authors have read and agreed to the published version of the manuscript.

Funding

This research received no external funding.

Institutional Review Board Statement

Not applicable.

Informed Consent Statement

Not applicable.

Data Availability Statement

Data is contained within the article.

Conflicts of Interest

The authors declare no conflict of interest.

References

  1. Bradley, B.A.; Wilcove, D.S.; Oppenheimer, M. Climate change increases risk of plant invasion in the Eastern United States. Biol. Invasions 2010, 12, 1855–1872. [Google Scholar] [CrossRef]
  2. Hulme, P.E. Climate change and biological invasions: Evidence, expectations, and response options. Biol. Rev. Camb. Philos. Soc. 2017, 3, 12971313. [Google Scholar] [CrossRef]
  3. Pimentel, D.; Lach, L.; Zuniga, R.; Morrison, D. Environmental and economic costs of nonindigenous species in the United States. BioScience 2000, 50, 53–65. [Google Scholar] [CrossRef]
  4. Pintó-Marijuan, M.; Munné-Bosch, S. Ecophysiology of invasive plants: Osmotic adjustment and antioxidants. Trends Plant Sci. 2013, 18, 660–666. [Google Scholar] [CrossRef] [PubMed]
  5. Khurshid, N.; Nasim, G.; Bajwa, K.; Adkins, S. Growth responses of Parthenium hysterophorus L. growing under salt stress. Pak. J. Weed Sci. Res. 2012, 18, 51–64. [Google Scholar]
  6. Onen, H.; Farooq, S.; Gunal, H.; Ozaslan, C.; Erdem, H. Higher Tolerance to abiotic stresses and soil types may accelerate common raag weed (Ambrosia artemisiifolia) invasion. Weed Sci. 2017, 65, 115–127. [Google Scholar] [CrossRef] [Green Version]
  7. Tanveer, M.; Shah, A.N. An insight into salt stress tolerance mechanisms of Chenopodium album. Environ. Sci. Pollut. Res. Int. 2017, 24, 16531–16535. [Google Scholar] [CrossRef]
  8. Yuan, X.; Wen, B. Seed germination response to high temperature and water stress in three invasive Asteraceae weeds from Xishuangbanna, SW China. PLoS ONE 2018, 13, e0191710. [Google Scholar] [CrossRef] [Green Version]
  9. Zeng, F.; Shabala, S.; Maksimović, J.D.; Maksimović, V.; Bonales-Alatorre, E.; Shabala, L.; Yu, M.; Zhang, G.; Živanović, B.D. Revealing mechanisms of salinity tissue tolerance in succulent halophytes: A case study for Carpobrotus rossi. Plant Cell Environ. 2018, 41, 2654–2667. [Google Scholar] [CrossRef]
  10. Santini, R.; De Lima, J.P.; Gratão, P.L.; Monteiro Camargo, A.F. Evaluation of growth and oxidative stress as indicative of salinity tolerance by the invasive tropical aquatic macrophyte tanner grass. Hydrobiologia 2022. [Google Scholar] [CrossRef]
  11. Türkan, I.; Demiral, T. Recent developments in understanding salinity tolerance. Environ. Exp. Bot. 2009, 67, 2–9. [Google Scholar] [CrossRef]
  12. Koyro, H.W.; Ahmad, P.; Gessisler, N. Abiotic stress responses in plants: An Overview. In Environmental Adaptations and Stress Tolerance of Plants in the Era of Climate Change 2012; Ahmad, P., Prsasad, M.N.V., Eds.; Springer Science+Business Media, LLC: New York, NY, USA, 2012; pp. 1–28. [Google Scholar] [CrossRef]
  13. Apel, K.; Hirt, H. Reactive oxygen species: Metabolism, oxidative stress, and signal transduction. Annu. Rev. Plant Biol. 2004, 55, 373–399. [Google Scholar] [CrossRef] [Green Version]
  14. Huang, S.; Van Aken, O.; Schwarzländer, M.; Belt, K.; Millar, A.H. The roles of mitochondrial reactive oxygen species in cellular signaling and stress response in plants. Plant Physiol. 2016, 171, 1551–1559. [Google Scholar] [CrossRef] [Green Version]
  15. Huang, H.; Ullah, F.; Zhou, D.-X.; Yi, M.; Zhao, Y. Mechanisms of ROS regulation of plant development and stress responses. Front. Plant Sci. 2019, 10, 800. [Google Scholar] [CrossRef]
  16. Gill, S.S.; Tuteja, N. Reactive oxygen species and antioxidant machinery in abiotic stress tolerance in crop plants. Plant Physiol. Biochem. 2010, 48, 909–930. [Google Scholar] [CrossRef]
  17. Hasanuzzaman, M.; Bhuyan, M.H.M.B.; Zulfiqar, F.; Raza, A.; Mohsin, S.M.; Mahmud, J.A.; Fujita, M.; Fotopoulos, V. Reactive oxygen species and antioxidant defense in plants under abiotic stress: Revisiting the crucial role of a universal defense regulator. Antioxidants 2020, 9, 681. [Google Scholar] [CrossRef]
  18. Intergovernmental Panel on Climate Change (IPPC). Summary for Policymakers. In Climate Change 2014: Mitigation of Climate Change. Contribution of Working Group III to the Fifth Assessment Report of the Intergovernmental Panel on Climate Change; Edenhofer, O., Pichs-Madruga, R., Sokona, Y., Farahani, E., Kadner, S., Seyboth, K., Adler, A., Baum, I., Brunner, S., Eickemeier, P., et al., Eds.; Cambridge University Press: Cambridge, UK; New York, NY, USA, 2015. [Google Scholar]
  19. Coombs, G.; Peter, C.I. The invasive ‘mothcatcher’ (Araujia sericifera Brot.; Asclepiadoideae) co-opts native honeybees as its primary pollinator in South Africa. AoB Plants 2010, 2010, plq021. [Google Scholar] [CrossRef] [Green Version]
  20. Sans Elorza, M.; Dana Sánchez, E.D.; Sobrino Vesperinas, E. (Eds.) Plantas alóctonas invasoras en España; Dirección General para la Biodiversidad: Madrid, Spain, 2004; p. 384. [Google Scholar]
  21. Gaig, P.; Gázquez, V.; Lombardero, M.; Botey, E.; García-Ortega, P. Moth plant (Araujia sericifera) allergy. Allergy 2005, 60, 1092–1093. [Google Scholar] [CrossRef]
  22. Forster, P.I.; Bruyns, P.V. Clarification of synonymy for the common moth-vine Araujia sericifera (Asclepiadaceae). Taxon 1992, 41, 746–749. [Google Scholar] [CrossRef]
  23. Zuloaga, F.; Morrone, O.; Belgrano, M. Catálogo de las Plantas Vasculares del Cono Sur (Argentina, sur de Brasil, Chile, Paraguay y Uruguay); Missouri Botanical Garden: Sant Louis, MI, USA, 2008; Volumes 1–3. [Google Scholar]
  24. D’Errico, G.; Crescenzi, A.; Landi, S. First report of the southern root-knot nematode Meloidogyne incognita on the invasive weed Araujia sericifera in Italy. Plant Dis. 2014, 98, 15931593. [Google Scholar] [CrossRef]
  25. Santa Cruz, J.; Cordero, S. First record of Araujia sericifera (Apocynaceae: Asclepiadoideae) for Chile, a new alien climbing species from South America. B Soc. Argent. Bot. 2018, 53, 313–317. [Google Scholar] [CrossRef] [Green Version]
  26. Gómez de Barreda, A. Araujia sencifera Brot., mala hierba trepadora en los agrios españoles. Levante Agric. 1976, 205, 13–15. [Google Scholar]
  27. Gómez de Barreda Ferraz, D.; De Luca, V.; Osca, J.M.; Verdeguer, M.; Muñoz, M. Control químico de la mala hierba invasora Araujia sericifera Brot. ITEA Inf. Tec. Econ. Agrar. 2020, 116, 212–226. [Google Scholar] [CrossRef]
  28. Ward, B.G.; Henzell, R.F.; Holland, P.T.; Spiers, A.G. Non-sprays methods to control invasive weeds in urban areas. In Proceedings of the 52nd New Zealand Plant Protection Conference, Auckland, New Zealand, 10–12 August 1999; pp. 1–5. [Google Scholar]
  29. Oddo, M. Effects of Different Weed Control Practices on Soil Quality in Mediterranean Crops. Ph.D. Dissertation, Universitat Politècnica de València, Valencia, Spain, 2 October 2017. [Google Scholar]
  30. Ben-Gal, A.; Neori-Borochov, H.; Yermiyahu, U.; Shani, U. Is osmotic potential a more appropriate property than electrical conductivity for evaluating whole plant response to salinity? Environ. Exp. Bot. 2009, 65, 232–237. [Google Scholar] [CrossRef]
  31. Ellis, R.A.; Roberts, E.H. The quantification of aging and survival in orthodox seeds. Seed Sci. Technol. 1981, 9, 373–409. [Google Scholar]
  32. Hoagland, D.R.; Arnon, D.I. The Water-Culture Method for Growing Plants without Soil; California Agriculture Experiment Station, College of Agriculture, University of California: Berkeley, CA, USA, 1950; Volume Circular 347, pp. 1–32. [Google Scholar]
  33. Lichtenthaler, H.K.; Wellburn, A.R. Determinations of total carotenoids and chlorophylls a and b of leaf extracts in different solvents. Biochem. Soc. T 1983, 11, 591–592. [Google Scholar] [CrossRef] [Green Version]
  34. Weimberg, R. Solute adjustments in leaves of two species of wheat at two different stages of growth in response to salinity. Physiol. Plantarum 1987, 70, 381–388. [Google Scholar] [CrossRef]
  35. Hodges, D.M.; Delong, J.M.; Forney, C.F.; Prange, R.K. Improving the thiobarbituric acid-reactive-substances assay for estimating lipid peroxidation in plant tissues containing anthocyanin and other interfering compounds. Planta 1999, 207, 604–611. [Google Scholar] [CrossRef]
  36. Blainski, A.; Lopes, G.C.; Palazzodemello, J.C. Application and analysis of the Folin Ciocalteu method for the determination of the total phenolic content from Limonium brasiliense L. Molecules 2013, 18, 6852–6865. [Google Scholar] [CrossRef] [Green Version]
  37. Zhishen, J.; Mengcheng, T.; Jianming, W. The determination of flavonoid contents in mulberry and their scavenging effects on superoxide radicals. Food Chem. 1999, 64, 555–559. [Google Scholar] [CrossRef]
  38. Bradford, M.M. A rapid and sensitive method for the quantitation of microgram quantities of protein utilizing the principle of protein-dye binding. Anal. Biochem. 1976, 72, 248–254. [Google Scholar] [CrossRef]
  39. Beyer, W.F., Jr.; Fridovich, I. Assaying for superoxide dismutase activity: Some large consequences of minor changes in conditions. Anal. Biochem. 1987, 161, 559–566. [Google Scholar] [CrossRef]
  40. Aebi, H. Catalase in vitro. Methods Enzymol. 1984, 105, 121–126. [Google Scholar] [CrossRef]
  41. Nakano, Y.; Asada, K. Hydrogen peroxide is scavenged by ascorbate specific peroxidase in spinach chloroplasts. Plant Cell Physiol. 1981, 22, 867–888. [Google Scholar]
  42. Conell, J.P.; Mullet, J.E. Pea chloroplast glutathione reductase: Purification and characterization. Plant Physiol. 1986, 82, 351–356. [Google Scholar] [CrossRef] [Green Version]
  43. Campoy, J.G.; Lema, M.; Fenollosa, E.; Munné-Bosch, S.; Retuerto, R. Functional responses to climate change may increase invasive potential of Carpobrotus edulis. Am. J. Bot. 2021, 108, 1902–1916. [Google Scholar] [CrossRef]
  44. Walther, G.-R.; Roques, A.; Hulme, P.E.; Sykes, M.T.; Pysek, P.; Kühn, I.; Zobel, M.; Bacher, S.; Botta-Dukát, Z.; Bugmann, H.; et al. Alien species in a warmer world: Risks and opportunities. Trends Ecol. Evol. 2009, 24, 686–693. [Google Scholar] [CrossRef] [Green Version]
  45. Mason, R.A.B.; Cooke, J.; Moles, A.T.; Leishman, M.R. Reproductive output of invasive versus native plants. Glob. Ecol. Biogeogr. 2008, 17, 633–640. [Google Scholar] [CrossRef]
  46. Vivian-Smith, G.; Panetta, F.D. Seedling recruitment, seed persistence and aspects of dispersal ecology of the invasive moth vine, Araujia sericifera (Asclepiadaceae). Aust. J. Bot. 2005, 53, 225–230. [Google Scholar] [CrossRef]
  47. Flowers, T.J.; Hajibagheri, M.A.; Clipson, N.J.W. Halophytes. Q. Rev. Biol. 1986, 61, 313–337. [Google Scholar] [CrossRef]
  48. Ungar, I.A. Seed germination and seed-bank ecology in halophytes. In Seed Development and Seed Germination; Kigel, J., Galili, G., Eds.; Marcel Dekker: New York, NY, USA, 1995; pp. 599–628. [Google Scholar]
  49. Gul, B.; Ansari, R.; Flowers, T.J.; Khan, M.A. Germination strategies of halophyte seeds under salinity. Environ. Exp. Bot. 2013, 92, 4–18. [Google Scholar] [CrossRef]
  50. Alhaddad, F.A.; Abu-Dieyeh, M.H.; ElAzazi, E.-S.M.; Ahmed, T.A. Salt tolerance of selected halophytes at the two initial growth stages for future management options. Sci. Rep. 2021, 11, 10194. [Google Scholar] [CrossRef] [PubMed]
  51. Vicente, O.; Boscaiu, M.; Naranjo, M.; Estrelles, E.; Bellés, J.M.; Soriano, P. Responses to salt stress in the halophyte Plantago crassifolia (Plantaginaceae). J. Arid Environ. 2004, 58, 463481. [Google Scholar] [CrossRef]
  52. Yupsanis, T.; Moustakas, M.; Eleftherrious, P.; Damalanidou, K. Protein phosporylation dephosphorylation in alfalfa seeds germinating under salt stress. J. Plant Physiol. 1994, 143, 234–240. [Google Scholar] [CrossRef]
  53. Hohl, M.; Schopfer, P. Water relations of growing maize coleoptiles. Comparison between mannitol and polyethylene glycol 6000 as external osmotica for adjusting turgor pressure. Plant Physiol. 1991, 95, 716–722. [Google Scholar] [CrossRef] [Green Version]
  54. Soriano, P.; Moruno, F.; Boscaiu, M.; Vicente, O.; Hurtado, A.; Llinares, J.V.; Estrelles, E. Is salinity the main ecologic factor that shapes the distribution of two endemic Mediterranean plant species of the genus Gypsophila? Plant Soil 2014, 384, 363–379. [Google Scholar] [CrossRef]
  55. Cicevan, R.; Al Hassan, M.; Sestras, A.; Boscaiu, M.; Zaharia, A.; Vicente Meana, Ó.; Sestras, R. Comparative analysis of osmotic and ionic stress effects on seed germination in Tagetes (Asteraceae) cultivars. Propag. Ornam. Plants 2015, 15, 63–72. [Google Scholar]
  56. Katembe, W.J.; Ungar, I.A.; Mitchell, J.P. Effect of salinity on germination and seedling growth of two Atriplex species (Chenopodiaceae). Ann. Bot. 1998, 82, 167–175. [Google Scholar] [CrossRef] [Green Version]
  57. Borsai, O.; Al Hassan, M.; Boscaiu, M.; Sestras, R.E.; Vicente, O. Effects of salt and drought stress on seed germination and seedling growth in Portulaca. Rom. Biotechnol. Lett. 2018, 23, 13340–13349. [Google Scholar]
  58. Munns, R. Comparative physiology of salt and water stress. Plant Cell Environ. 2002, 25, 239–250. [Google Scholar] [CrossRef]
  59. Keiffer, C.H.; Ungar, I.A. The effect of extended exposure to hypersaline conditions on the germination of five inland halophyte species. Am. J. Bot. 1997, 84, 104–111. [Google Scholar] [CrossRef]
  60. Nisar, F.; Gul, B.; Ajmal Khan, M.; Hameed, A. Germination and recovery responses of heteromorphic seeds of two co-occurring Arthrocnemum species to salinity, temperature and light. S. Afr. J. Bot. 2019, 121, 143–151. [Google Scholar] [CrossRef]
  61. Lambers, H.; Poorter, H. Inherent variation in growth rate between higher plants: A search for physiological causes and ecological consequences. Adv. Ecol. Res. 1992, 23, 188–261. [Google Scholar] [CrossRef]
  62. Reich, P.B.; Walters, M.B.; Ellsworth, D.S. From tropics to tundra: Global convergence in plant functioning. Proc. Natl. Acad. Sci. USA 1997, 94, 13730–13734. [Google Scholar] [CrossRef] [Green Version]
  63. Al Hassan, M.; Pacurar, A.; López-Gresa, M.P.; Donat-Torres, M.P.; Llinares, J.V.; Boscaiu, M.; Vicente, O. Effects of salt stress on three ecologically distinct Plantago species. PLoS ONE 2016, 11, e0160236. [Google Scholar] [CrossRef]
  64. Greenway, H.; Munns, R. Mechanisms of salt tolerance in non-halophytes. Annu. Rev. Plant Physiol. 1980, 31, 149–190. [Google Scholar] [CrossRef]
  65. Assaha, D.V.M.; Ueda, A.; Saneoka, H.; Al-Yahyai, R.; Yaish, M.W. The role of Na+ and K+ transporters in salt stress adaptation in Glycophytes. Front Physiol. 2017, 8, 509. [Google Scholar] [CrossRef]
  66. Morais, M.C.; Panuccio, M.R.; Muscolo, A.; Freitas, H. Salt tolerance traits increase the invasive success of Acacia longifolia in Portuguese coastal dunes. Plant Physiol. Biochem. 2012, 55, 60–65. [Google Scholar] [CrossRef]
  67. Kaur, T.; Bhat, J.A.; Raina, A.; Koul, S.; Vyas, D. Glutathione regulates enzymatic antioxidant defense with differential thiol content in perennial pepperweed and helps adapting to extreme environment. Acta Physiol. Plant. 2013, 35, 2501–2511. [Google Scholar] [CrossRef]
  68. Oliveira, M.T.; Matzek, V.; Dias Medeiros, C.; Rivas, R.; Falcão, H.M.; Santos, M.G. Stress tolerance and ecophysiological ability of an invader and a native species in a seasonally dry tropical forest. PLoS ONE 2014, 9, e105514. [Google Scholar] [CrossRef]
  69. Mamik, S.; Sharma, A.D. Protective role of boiling stable antioxidant enzymes in invasive alien species of Lantana exposed to natural abiotic stress like conditions. Russ. J. Biol. Invasions 2017, 8, 75–86. [Google Scholar] [CrossRef]
  70. Hussain, M.I.; González, L.; Souto, C.; Reigosa, M.J. Ecophysiological responses of three native herbs to phytotoxic potential of invasive Acacia melanoxylon R. Br. Agroforest. Syst. 2011, 83, 149–166. [Google Scholar] [CrossRef]
  71. Güçlütürk, I.; Detsi, A.; Weiss, E.K.; Ioannou, E.; Roussis, V.; Kefalas, P. Evaluation of anti-oxidant activity and identification of major polyphenolics of the invasive weed Oxalis pes-caprae. Phytochem. Anal. 2012, 23, 642–646. [Google Scholar] [CrossRef]
  72. Stefanowicz, A.M.; Kapusta, P.; Stanek, M.; Frąc, M.; Oszust, K.; Woch, M.W.; Zubek, S. Invasive plant Reynoutria japonica produces large amounts of phenolic compounds and reduces the biomass but not activity of soil microbial communities. Sci. Total Environ. 2021, 767, 145439. [Google Scholar] [CrossRef]
  73. Bello, R.; Barrachina, M.; Esplugues, J.; López de Medrano-Villar, M.J.; Primo-Yúfera, E. Analgesic activity and effects on isolated smooth muscle of different fractions of hexane extract from Araujia sericifera Brot. Phytother. Res. 1996, 10, 337–339. [Google Scholar] [CrossRef]
  74. Bucciarelli, A.; Lofiego, A.; Bensack, A.; Rihl, C.; Skliar, M. Gastroprotective activity of Araujia sericifera Brot. var. hortorum (E. Fourn.), a South American species of medicinal use. Rev. Asoc. Med. Bahía Blanca 2017, 27, 30–36. [Google Scholar]
  75. Palomino-Schätzlein, M.; Montaño, M.C.; Escrig, P.V.; Boira, H.; Corma, A.; Pineda-Lucena, A.; Primo, J.; Cabedo, N. Identification of bioactive compounds in polar and nonpolar extracts of Araujia sericifera. Planta Med. Int. Open 2017, 4, e93–e103. [Google Scholar] [CrossRef] [Green Version]
  76. Di Santo Meztler, P.; Fait, M.E.; Foresti, M.L.; Morcelle, S.R. Biocatalytic characterization of a naturally immobilized lipase found in Araujia sericifera Brot. (Apocynaceae) latex. Catal. Sci. Technol. 2014, 4, 1386–1394. [Google Scholar] [CrossRef] [Green Version]
  77. Landi, N.; Ragucci, S.; Letizia, F.; Fuggi, A.; Russo, R.; Pedone, P.V.; Di Maro, A. A haem-peroxidase from the seeds of Araujia sericifera: Characterization and use as bio-tool to remove phenol from aqueous solutions. Biocatal. Agric. Biotechnol. 2019, 20, 101215. [Google Scholar] [CrossRef]
  78. Alscher, R.G.; Erturk, N.; Heath, L.S. Role of superoxide dismutases (SODs) in controlling oxidative stress in plants. J. Exp. Bot. 2002, 372, 1331–1341. [Google Scholar] [CrossRef]
  79. Das, K.; Roychoudhury, A. Reactive oxygen species (ROS) and response of antioxidants as ROS-scavengers during environmental stress in plants. Front. Environ. Sci. 2014, 2, 53. [Google Scholar] [CrossRef] [Green Version]
  80. Bose, J.; Rodrigo-Moreno, A.; Shabala, S. ROS homeostasis in halophytes in the context of salinity stress tolerance. J. Exp. Bot. 2014, 65, 1241–1257. [Google Scholar] [CrossRef] [PubMed]
  81. Couto, N.; Wood, J.; Barber, J. The role of glutathione reductase and related enzymes on cellular redox homoeostasis network. Free Radic. Biol. Med. 2016, 95, 27–42. [Google Scholar] [CrossRef]
  82. Laxa, M.; Liebthal, M.; Telman, W.; Chibani, K.; Dietz, K.J. The role of the plant antioxidant system in drought tolerance. Antioxidants 2019, 8, 94. [Google Scholar] [CrossRef] [PubMed] [Green Version]
  83. Caverzan, A.; Passaia, G.; Rosa, S.B.; Ribeiro, C.W.; Lazzarotto, F.; Margis-Pinheiro, M. Plant responses to stresses: Role of ascorbate peroxidase in the antioxidant protection. Genet. Mol. Biol. 2012, 35 (Suppl. 1), 1011–1019. [Google Scholar] [CrossRef] [PubMed] [Green Version]
  84. Sofo, A.; Scopa, A.; Nuzzaci, M.; Vitti, A. Ascorbate peroxidase and catalase activities and their genetic regulation in plants subjected to drought and salinity stresses. Int. J. Mol. Sci. 2015, 16, 13561–13578. [Google Scholar] [CrossRef] [PubMed] [Green Version]
Figure 1. Mature fruits (a) and seeds (b) of Araujia sericifera that were collected in the area of Valencia, South East Spain. The scale bars represent 1 cm.
Agronomy 12 00361 g001
Figure 2. Germination percentages of Araujia sericifera seeds in the presence of increasing concentrations of NaCl (a) and isosmotic concentrations of PEG (b). Means ± SD, n = 5. Different lowercase letters indicate significant differences between the treatments for each germination time according to the Tukey test (α = 0.05).
Agronomy 12 00361 g002
Figure 3. Germination percentages of Araujia sericifera seeds in the ‘recovery of germination’ assays in distilled water, of seeds from the previous NaCl (a) and isosmotic PEG treatments (b). Means ± SD, n = 5. The different lowercase letters indicate significant differences between the treatments for each germination time according to the Tukey test (α = 0.05).
Agronomy 12 00361 g003
Figure 4. The mean germination time of Araujia sericifera seeds in the presence of increasing concentrations of NaCl (a) and isosmotic concentrations of PEG (b). Means ± SD, n = 5. The different lowercase letters above the bars indicate significant differences between the treatments according to the Tukey test (α = 0.05).
Agronomy 12 00361 g004
Figure 5. The mean germination time of Araujia sericifera in the ‘recovery of germination’ assays of seeds from previous NaCl (a) and isosmotic PEG (b) treatments. Means ± SD, n = 5. The grey columns show the MGT of the corresponding controls from the previous experiment (Figure 4). The different lowercase letters above the bars indicate significant differences between the treatments according to the Tukey test (α = 0.05).
Agronomy 12 00361 g005
Figure 6. Radicle, hypocotyl, and cotyledon length in seedlings of Araujia sericifera that were obtained from seeds that were germinated at the indicated NaCl (a) and isosmotic PEG concentrations (b). Means ± SD, n = 5). The different lowercase letters above the columns indicate significant differences between the treatments for each plant organ according to the Tukey test (α = 0.05).
Agronomy 12 00361 g006
Figure 7. The visual effects of water deficit and salt stress on Araujia sericifera plants after one-month of treatments: (a), control; (b), water stress; (c), 150 mM NaCl; (d), 300 mM NaCl; (e), 450 mM NaCl; (f), 600 mM NaCl.
Agronomy 12 00361 g007
Figure 8. Changes in the fresh weight (a) and water content (b) of the roots (FWr, WCr, respectively) and leaves (FWl, WCl, respectively) of Araujia sericifera plants after one month-treatments of water stress (WS, complete withholding of irrigation) and salt stress at the indicated NaCl concentrations. Means ± SD, n = 7. The different lowercase letters above the bars indicate significant differences between the treatments for each plant organ according to the Tukey test (α = 0.05).
Agronomy 12 00361 g008
Figure 9. Sodium (Na), chloride (Cl), and potassium (K) leaf contents of Araujia sericifera plants after one month-treatments of water stress (WS, complete withholding of irrigation) and salt stress at the indicated NaCl concentrations. Means ± SD, n = 7. The different lowercase letters above the bars indicate significant differences between the treatments for each ion according to the Tukey test (α = 0.05).
Agronomy 12 00361 g009
Figure 10. Principal component analysis: loading and scatter plots of the PCA scores were conducted with all the analysed traits in plants of Araujia sericifera after one month-treatments. The treatments: control—green, water stress—red, 150 mM NaCl—violet, 300 mM NaCl—brown, 450 mM NaCl—blue and 600 mM NaCl—black. Abbreviations: SL, stem length increase; Lno, leaf number increase; LA, leaf area; FWr, fresh weight of roots, FWl, fresh weight of leaves, WCr, water content of roots, WCl, water content of leaves; Chl a, chlorophyll a; Chl b, chlorophyll b; Caro, carotenoids; MDA, malondialdehyde; TFC, total phenolic compounds; TF, total flavonoids; SOD, superoxide dismutase; CAT, catalase; APX, ascorbate peroxidase; GR, glutathione reductase.
Agronomy 12 00361 g010
Figure 11. Pearson’s correlations between all the plant variables that were analysed in control and salt-stressed plants. Abbreviations: SL, stem length increase; Lno, leaf number increase; LA, leaf area; FWr, fresh weight of roots, FWl, fresh weight of leaves, WCr, water content of roots, WCl, water content of leaves; Chl a, chlorophyll a; Chl b, chlorophyll b; Caro, carotenoids.
Agronomy 12 00361 g011
Figure 12. Pearson’s correlations between all the plant variables that were analysed in the control and water-stressed plants. Abbreviations: SL, stem length increase; Lno, leaf number increase; LA, leaf area; FWr, fresh weight of roots, FWl, fresh weight of leaves, WCr, water content of roots, WCl, water content of leaves; Chl a, chlorophyll a; Chl b, chlorophyll b; Caro, carotenoids; malondialdehyde (MDA); total phenolic compounds (TFC); total flavonoids (TF); superoxide dismutase (SOD); catalase (CAT); ascorbate peroxidase (APX); glutathione reductase (GR).
Agronomy 12 00361 g012
Table 1. The substrate moisture (%) and electric conductivity (EC1:5) (dS m−1) in the pots after one month of treatments. The values shown are means ± SD, n = 7. The different lowercase letters within each row indicate significant differences between the treatments, according to the Tukey test (α = 0.05).
SubstrateControlWater
Stress
150 mM
NaCl
300 mM
NaCl
450 mM
NaCl
600 mM NaCl
Moisture68.48 ± 0.54 c9.79 ± 0.46 a67.97 ± 2.80 bc64.62 ± 3.12 bc66.37 ± 5.10 bc63.40 ± 1.58 b
EC1:51.07 ± 0.07 a0.54 ± 0.04 a9.45 ± 0.19 b19.96 ± 0.57 c20.27 ± 0.38 d26.6 ± 0.37 d
Table 2. The growth parameters and photosynthetic pigments in Araujia sericifera plants after one-month treatments. The values shown are means ± SD, n = 7. The different lowercase letters within each row indicate significant differences between the treatments according to the Tukey test (α = 0.05). Abbreviations: SL, stem length increase; Lno, leaf number increase; LA, leaf area; Chl a, chlorophyll a; Chl b, chlorophyll b; Caro, carotenoids.
ParameterControlWater
Stress
150 mM
NaCl
300 mM
NaCl
450 mM
NaCl
600 mM NaCl
SL
(cm)
7.73 ± 0.87 c3.66 ± 0.25 a5.27 ± 0.53 b3.47 ± 0.24 a3.61 ± 0.20 a3.12 ± 0.24 a
Lno
(units)
6.86 ± 0.48 c4.42 ± 0.63 b4.29 ± 0.22 b3.00 ± 0.52 a4.14 ± 0.31 b4.00 ± 0.00 ab
LA
(cm2)
23.46 ± 2.39 b7.47 ± 1.13 a22.81 ± 1.99 b8.64 ± 1.68 a8.74 ± 2.52 a6.17 ± 1.36 a
Chl a
(μg g−1DW)
44.76 ± 3.48 d40.53 ± 4.90 cd30.83 ± 3.19 abc33.98 ± 3.71 bc28.08 ± 5.93 ab20.13 ± 3.77 a
Chl b
(μg g−1DW)
7.31 ± 0.91 c6.48 ± 1.23 bc4.62 ± 0.71 bc5.13 ± 0.76 ab4.65 ± 0.89 ab3.85 ± 0.74 a
Caro
(μg g−1DW)
4.58 ± 0.38 c4.50 ± 0.46 c2.90 ± 0.27 ab3.64 ± 0.45 bc3.18 ± 0.69 ab2.19 ± 0.51 a
Table 3. Malondialdehyde (MDA), total phenolic compounds (TFC) and total flavonoids (TF) leaf contents, and superoxide dismutase (SOD), catalase (CAT), ascorbate peroxidase (APX), and glutathione reductase (GR) activities in Araujia sericifera plants after one month of the indicated treatments. The values shown are means ± SD, n = 7. The different lowercase letters within each row indicate significant differences between the treatments according to the Tukey test (α = 0.05). GA, gallic acid; C, catechin.
ParameterControlWater
Stress
150 mM
NaCl
300 mM
NaCl
450 mM
NaCl
600 mM NaCl
MDA
(nmol g−1DW)
39.59 ± 10.72 a89.58 ± 3.79 b88.11 ± 4.27 b87.31 ± 8.37 b110.41 ± 13.84 bc123.87 ± 6.43 c
TPC
(mg eq. GA g−1 DW)
40.91 ± 1.50 a43.04 ± 3.20 ab44.74 ± 1.69 ab47.53 ± 4.18 ab49.44 ± 2.72 b58.52 ± 5.74 c
TF
(mg eq. C g−1 DW)
40.81 ± 4.65 a97.28 ± 5.68 c71.77 ± 9.02 b87.08 ± 7.78 bc100.05 ± 14.73 cd122.29 ± 6.96 d
SOD
(Units mg−1 protein)
9.17 ± 2.49 a10.20 ± 2.16 a22.66 ± 6.32 b26.87 ± 4.23 bc31.45 ± 5.66 bc37.19 ± 5.28 c
CAT
(Units mg−1 protein)
3.33 ± 2.37 a1.48 ± 0.87 a2.86 ± 1.79 a3.51 ± 2.12 a2.11 ± 0.98 a7.01 ± 2.03 a
APX
(Units mg−1 protein)
0.15 ± 0.01 a1.14 ± 0.15 b0.88 ± 0.13 ab1.58 ± 0.24 bc1.66 ± 0.33 bc2.36 ± 0.93 c
GR
(Units mg−1 protein)
47.46 ± 19.25 a57.48 ± 9.17 a88.14 ± 12.96 ab122.99 ± 5.33 bc126.27 ± 23.19 bc185.91 ± 26.56 c
Publisher’s Note: MDPI stays neutral with regard to jurisdictional claims in published maps and institutional affiliations.

