Abstract
The field experiment was carried out in 2013 and 2014 as part of a long-term experiment to test the influence of different soil tillage systems (conventional, reduced, direct sowing) on (a) the yield of summer pea (Pisum sativum L.) and (b) the amount of biologically reduced atmospheric nitrogen (N), which was determined using the 15N dilution method (ID15N). Spring barley was used as a reference plant. Climatic conditions did not have a significant influence on the yield of pea seeds (mean value 4.56 t ha−1), post-harvest residues (3.76 t ha−1) and total biomass (8.33 t ha−1). Soil tillage system was found to have a significant impact on all components of the pea yield in years of experiment, with the highest average seed yield values observed with the conventional system (5.19 t ha−1) and significantly lower values observed with reduced tillage (4.34 t ha−1) and direct sowing (4.17 t ha−1). The content of total N was greatest in the pea biomass that was harvested in the conventional system (202 kg ha−1) and lowest with direct sowing (155 kg ha−1). Nitrogen accumulated in the pea seeds from three sources: atmosphere (mean value 35.2%), fertilizers (6.8%) and soil (57.9%), equating to 48.6, 9.9, and 85.4 kg ha−1, respectively. Soil tillage system was found to have a significant impact on the amount of N that was fixed from the atmosphere by the peas: 17.7% in conventional tillage, 37.9 in reduced system and 50.2% in direct sowing, which equates to a harvested seed yield of 28.9, 52.0 and 64.4 kg ha−1, respectively. In the post-harvest residues, the amount of N fixed from the atmosphere by the pea crop was also modified by the soil tillage system in range: 20.2% in conventional tillage and 32.6% in direct sowing (which equates to 7.4 and 8.5 kg N ha−1, respectively), but the difference was not significant.
1. Introduction
Pea (Pisum sativum L.) is a leguminous plant that is cultivated globally because of its nutritional value [1,2,3] and its beneficial effect as a pre-crop in crop rotations [4,5]. Despite the obvious advantages, the area under pea cultivation globally remains low and has decreased in recent years [6]. This is mainly caused by low profitability and fluctuating yields, produced by biotic and abiotic factors. However, due to symbiosis with Rhizobium, pea can fix atmospheric nitrogen (N), which can also help decrease costs for the grower through reduced inorganic applications, although some studies [7,8] recommend the application of a low dose of N (in the form of mineral fertilizer) at sowing time or at the beginning of pea growth (so-called starting dose).
In recent years, the substitution of soil ploughing by reduced or no-till soil cultivation systems has been employed [9,10,11,12,13]. The use of these simplified systems can decrease the expenditure on energy and labor [9] and can have positive effects on the soil environment, such as increased carbon (C) content and microbial activity [10].
Gajda et al. [14] investigated the influence of three soil tillage systems: conventional, reduced and no-till on the microbial C biomass and N content, microbial respiration rate, and dehydrogenase and arylsulfatase activity. After eight years, the reduced tillage system was observed to enhance soil biological activity by an average 15–40% in comparison to the conventional tillage system. Moreover, Małecka-Jankowaik et al. [8] stated that the long-term application of reduced tillage and direct sowing was favorable for increasing the activity of soil enzymes.
However, the advantages of no-till systems can be offset by a large weed population, which has a negative influence on legume yield. In this case, mechanical or chemical methods must be used to reduce or eliminate the weed population [10,15].
The concept of sustainable crop production seeks to determine new approaches to increase the cultivation of legumes in crop rotations and thereby maximize biological N fixation. Moreover, determination of the most appropriate method to quantify the amount of N that is biologically fixed from the atmosphere is critical to calculate the N balance (and fertilizer requirement) of cultivated plants. The 15N dilution isotope technique has been widely used to measure the amount of biological N fixation. This method is useful because it enables the amount of atmospheric N fixed by the legumes, and N uptake from the soil and fertilizer by the plants to be quantified.
The background of the hypothesis of our research was that long-term tillage systems can influence in different way on the process of nitrogen fixation by legume and its yield. The aim of this study was to investigate the long-term effect of different tillage systems on biological N reduction by pea plants as determined by the isotope dilution method (ID15N).
2. Materials and Methods
2.1. Site Description
The field experiment was carried out during 2013 and 2014 as part of a long-term field experiment that commenced in 1999 at the Agricultural Experimental Station in Brody (52°26′ N, 16°17′ E), which investigated the impact of different soil tillage systems (conventional, reduced, direct sowing) on crop yields. Table 1 shows meteorological conditions during the vegetation period in 2013–2014.

Table 1.
Air temperature (°C) and rainfall sum (mm) during the vegetation period in 2013–2014. Data source: Meteorological Station, Brody, Poland.
The soil at the study site is classified as Albic Luvisoil, and as Typic Hapludalf [16]. Following granulometric composition analysis, the field soil was ascertained to be sandy clay loam. The granulometric composition and some chemical properties of the field soil are presented in Table 2 and Table 3. Soil samples were taken from the top layer of soil profile up to 20 cm depth.
Table 2.
Selected physical properties of soil at the study site.
Table 3.
Selected chemical properties of soil at the study site.
2.2. Experiment Design and Agronomic Management
The current study was a one-way experiment with completely randomized blocks in three replications with two crops: spring pea var. Tarchalska (investigated plant) and summer barley var. Rubinek (reference plant). During the growth and development stages of the studied plants, agricultural practices were carried out in accordance with established management principles. Sowing and harvest dates depended on species and weather conditions. Seeds and grain were sown in the last week of March: pea at 100 seeds per 1 m2 and summer barley at 500 grains per 1 m2. The sowing depth in all tillage systems was 4 cm and the row space was 18 cm. In all the tillage systems, plots were drilled with a double disk drill (Great Plains, Solid Stand 100 equipped with a fluted coulter for residue cutting, a double disk for seed placement, and a press wheel (3 m wide), weight of the tractor was 2885 kg). The area of each replication was 24 m2 (plot area: 4 m width × 6 m length) where mineral fertilizer (82.5 kg P2O5 ha−1, 80 kg K2O ha−1) was applied in early spring in each year.
After the emergence of the plants, each plot was divided on two treated subplots (area of the subplot 2 m width × 2 m length = 4 m2, the total are of two treated subplots 8 m2 per replication), which were established in the middle of the plot of each replication. 15N fertilizer in the form of ammonium sulfate (15NH4)2SO4 in solution (containing 37.5 at%15N) was applied at a rate of 30 kg N ha−1 to the subplots in the pea and spring barley (reference plant) plots. The amount of N applied was considered as a starting dose. A reference crop is a plant that does not biologically fix nitrogen and its only source of nitrogen are soil and fertilizer, by using 15N it is possible to compare the analyzed features in biomass both studied crops. To evaluate the yield and study the features, the pea and spring barley were harvested from each subplot from area 2 m2, where 15N fertilizer was applied. Yield of seeds/grain plus post-harvest residues (vegetative parts of plants) are considered “total biomass”. During the growing season, recommended pesticides were used to target specific insect and plant species.
The experimental design contained three soil tillage systems:
- (1)
- Conventional tillage: ploughing with a 3-furrow reversible plough was carried out each year to a depth of 25 cm.
- (2)
- Reduced till in stubble cultivation was carried out annually at autumn (stubble cultivator 2.5 m wide).
- (3)
- Direct sowing each year into the stubble of the pre-crop with no basic land preparation.
2.3. Chemical and Isotopic Analysis
The pea and spring barley crops were harvested at full maturity growth stage (BBCH 90) and samples of the plant materials were ground down to a particle diameter < 0.25 mm. Total N content was determined by the Kjeldahl method. The 15N/14N isotope ratio in the samples of both crops were analyzed on an elemental analyzer Flash EA 1112HT (Thermo Scientific, Waltham, MA, USA) coupled with the mass spectrometer Delta V Advantage (Thermo Scientific) in a continuous flow system with helium.
2.4. Calculations
Biological N reduction was calculated using the following formulas provided by Kalembasa et al. [17] including:
- (1)
- % N derived from the atmosphere% Ndfa = [1 − (at% 15Nexcess in pea */at% 15Nexcess in spring barley *) × 100
- (2)
- Amount of atmospheric N fixed by the pea (kg ha−1)N fixed from atmosphere (kg ha−1) = (% Ndfa × TN)/100where: TN = total amount of N in the pea (kg ha−1).
- (3)
- % N derived from fertilizer% Ndff = (at% 15Nexcess in pea */at% 15Nexcess in fertilizer *) × 100
- (4)
- Amount of N derived from fertilizer (kg ha−1)Ndff (kg ha−1) = (% Ndff × TN)/100
- (5)
- % N derived from the soil% Ndfs = 100 − (% Ndfa + % Ndff).
- (6)
- Coefficient of N-utilization (N-use efficiency) from the fertilizerNUE (%) = (Ndff kg ha−1/D kg ha−1) × 100where: D = dose of N applied in the N fertilizer
- (7)
- Total amount of 15N in the biomass of the pea and spring barley plants (kg ha−1)15N (kg ha−1) = (at% 15Nexcess in plant × TN in plant)/100
- (8)
- % of 15N uptake = (15N kg ha−1 in plant/15N kg ha−1 in fertilizer) × 100at%15Nexcess = at% 15Nexcess in samples (pea, barley or fertilizer) − 0.3663
2.5. Statistical Analysis
The results observed during the field experiment and chemical analyzes were statistically calculated with one-factor ANOVA analysis of variance (Statistica PL. Software Statsoft. Tulsa, OK, USA). Significant differences were calculated using Tukey’s test at a significance level of p < 0.05. In order to show the existing regularities (correlations) between yield and features of plants average for years of research, a Pearson correlation matrix was determined, which was illustrated using a heatmap.
3. Results and Discussion
The average pea seed yield was 4.56 t ha−1 and there was no observed significant difference between two harvest years, although the yield was slightly higher in 2014 (Table 4). The experimental factor (soil tillage system) resulted in a significantly modified pea seed yield. Both simplified soil tillage systems (reduced and direct sowing) resulted in decreased pea seed yield.
Table 4.
Pea biomass yield (t ha−1).
The highest yield (5.19 t ha−1) was found with conventional tillage and the yield was considerably lower in reduced tillage (by 16.4%) and direct sowing (by 19.6%). At the same experimental station in Brody, Małecka-Jankowiak et al. [8] reported that the highest pea yield occurred with reduced tillage, lower yields with conventional tillage and lowest yields with direct sowing. Similar results were presented by Woźniak [18], but Faligowska and Szukała [19] received opposite results. The results reported by Santín-Montanyá et al. [11], which examined the impact of the soil tillage system on pea yield did not show any significant differences.
These differences between studies are probably caused by several factors, such as the soil biological and microbiological communities and the physical properties of the soil [20,21]. Moreover, the amount and distribution of rainfall are likely to have a huge influence on pea seed yield, although in the growing season of 2013, rainfall at our study site was higher than in 2014 yet the distribution was sporadic and likely insufficient during flowering and pea pod development (Table 4). Grabowska and Banaszkiewicz [22] reported a pea yield of 4.4 t ha−1, which was strongly influenced by the weather conditions in central Poland during the vegetative phases, in particular at the start of flowering, and throughout the flowering stage where the precipitation deficit and high temperatures decreased yields by 87%. In our experiment, the mean temperature in May and June was also higher in 2013 than in 2014. Bueckert et al. [23] and Gantner et al. [24] have reported the strong impact of precipitation and temperature on pea yield.
In our experiment, the year did not significantly affect the yield of post-harvest residues (mean value 3.76 t ha−1) and the total biomass yield (8.33 t ha−1), although both analyzed yields were higher in 2014 than in 2013 (Table 4). The highest yield was observed in conventional tillage (4.41 t ha−1) and was significantly lower (by 24%) in direct sowing. Total biomass yield was also greatest in conventional tillage (9.59 t ha−1) and lower in reduced tillage and direct sowing, by 18% and 21.6%, respectively.
Harvest index (HI) is an important metric in legume cultivation, calculated as HI = (yield of seeds/yield of total biomass) × 100. This value highlights the proportion of seeds to post-harvest residues. The average HI value in our study over these two years was 54.7%, and was 54.1%, 55.1%, 55.4% for the conventional and reduced soil tillage systems and direct sowing, respectively. This is important when legumes are cultivated for seeds as the final product. Moreover, legumes with high HI values usually have less influence on the content of N in the soil, as it is removed from the field with the seeds.
Average spring barley yield, cultivated as a reference plant simultaneously with pea, was 6.50, 10.43 and 16.93 ha−1 for the grain, post-harvest residues and total biomass, respectively (Table 5). The year resulted in significant differences between the analyzed spring barley features, with values much higher in 2014 than in 2013. The soil tillage system also resulted in significant differences in the studied features: the highest grain yield was recorded in conventional tillage (6.68 t ha−1) and it was significantly lower (by 6.4%) in reduced tillage, but the difference between conventional tillage and direct sowing (6.57 t ha−1) was not significant. For total biomass, the greatest yield was observed in direct sowing and was significantly lower in reduced tillage, because of the lower yield of post-harvest residues in this system. However, our results contrast with those reported by Małecka et al. [25], where the highest yields of spring barley grain, straw and total biomass were found in the reduced soil tillage system and the lowest in the direct sowing. In our study, the harvest index (HI) for barley on average for years was 38.3%. For soil tillage systems the values were as follows: 39.4% in conventional tillage, 39.4% in reduce system and 36.5% in direct sowing. The average standard deviation calculated for post-harvest residues of pea for soil tillage systems was lower than the barley plants, but on average for the years it was higher in pea plants.
Table 5.
Spring barley biomass yield (t ha−1).
The content of N in the pea seeds and post-harvest residues was significantly different between years; higher in 2013 than in 2014 (Table 6), which was the opposite relationship to seed yield (Table 3). The seeds harvested under the different soil tillage systems conditions contained almost the same N content (mean value 3.15%). Multiplication of this value by 6.25 [26] is equal to the protein content in the seeds (19.7%). Similar protein content in pea seeds has been reported by other authors [8,27].
Table 6.
The content and amount of nitrogen (N) in the pea crop.
The post-harvest residues contained 3.75-fold less N (mean value 0.84%) than the seeds. On average, direct sowing decreased the N content in the post-harvest residues by 0.08% compared to conventional tillage. There was no significant difference between conventional and reduced soil tillage systems.
The amount of total N harvested in the seeds, post-harvest residues and total biomass was slightly higher in 2014 than 2013, but there was no significant difference. The highest amount of N (164 kg ha−1) was noted in the seeds harvested in the conventional soil tillage system and was significantly lower (by 21%) in the direct sowing. As such, total protein yield was 1025 and 806 kg ha−1 in the conventional tillage and direct sowing, respectively. In their study, Małecka et al. [8] reported a lower yield of protein, although the highest protein yield was recorded with the reduced soil tillage system.
The amount of total N in the post-harvest residues was 4.6-fold less than in the seeds. If we assume that the total amount of N in the total pea biomass was 174 kg ha−1 (mean value), then this would suggest that 82.2% of the N was accumulated in seeds and 17.8% in the post-harvest residues (Table 6).
From an agricultural point of view, the amount of N introduced into the soil is very important in crop rotations, as it has an influence on the amount of N applied as a mineral fertilizer. The amount of N in the post-harvest residues differed between the applied soil tillage systems; the highest value (37 kg ha−1) was found in conventional tillage and was significantly lower (by 30%) in direct sowing. The highest amount of total N in the total pea biomass was noted in conventional tillage (202 kg ha−1) and was lower (by 47 kg ha−1) in direct sowing. There was no significant difference between conventional and reduced tillage.
The value of the N harvest index, calculated as NHI = (total N in seeds/total N in biomass) × 100, was 81.1%, 82.0% and 83.2% for the conventional tillage, reduced system and direct sowing, respectively. Lecoeur and Sinclair [28] revealed that changes in linearity of NHI dominate the N uptake by plant over seed N accumulation with the transfer of N from vegetative tissue to the seed during the early stages of seed growth. The analysis of our results also highlighted the importance of N accumulation in grain yield of field pea with average value of NHI 82.1%.
The influence of soil tillage system on N content (%) in the spring barley biomass (grain, post-harvest residues, total biomass) differed between the two years of the experiment (Table 7). Significantly higher values were noted in 2013. Soil tillage system influenced the analyzed features differently. The highest N content (%) and the amount of harvested N were always found in the conventional soil tillage system. The standard deviations calculated for total nitrogen in grain and biomass were lower for pea crops than in barley, which may indicate more stable values.
Table 7.
The content and amount of nitrogen (N) in the spring barley crop.
For the determination of biological N reduction, the most commonly used method is the isotope 15N dilution method, in which 15N is applied in the mineral N fertilizer. In this study, the pea and spring barley plants take up the isotope and the amounts that accumulate in the biomass of both crops are determined. The 15N content in the pea seeds and post-harvest residues was 2.605 and 2.987 at%15Nexcess, respectively. In both cases, the investigated factor did not have a significant influence on the value of this parameter (Table 8).
Table 8.
At%15Nexcess in pea and spring barley crops.
The 15N isotope content in the spring barley grain was greater in 2013 than in 2014 and was influenced by the soil tillage system (Table 8); a higher value was found in direct sowing (4.919 at%15Nexcess) and was significantly lower in the conventional and reduced soil tillage systems, by 1.365 and 0.901 at%15Nexcess, respectively. The 15N isotope content in the spring barley post-harvest residues was also significantly different between years; a higher value was found in 2014 than in 2013. In general, the 15N content in the pea biomass (seeds: 2.605 at%15Nexcess; post-harvest residues: 2.987 at%15Nexcess) was lower than in the spring barley biomass (grain: 4.163 at%15Nexcess; post-harvest residues: 4.121 at%15Nexcess). This was caused by the dilution effect: 15N taken up from the fertilizer versus atmospheric N fixed by the legumes. This has also been reported by other studies that have investigated legumes, such as white lupin [17] and faba bean [29,30].
On the basis of data contained in Table 8, the proportion of N accumulated by the pea crop from the atmosphere, fertilizer, and soil was calculated and is shown in Table 9.
Table 9.
Nitrogen (N) accumulation (%) in the pea crop from different sources. Ndfa denotes the %N derived from the atmosphere, Ndff denotes the %N derived from the fertilizer and Ndfs denotes the %N derived from the soil.
The N accumulated in the seeds (expressed as the mean value from both years of the experiment and across all soil tillage systems) was as follows: 35.2% from the atmosphere, 6.8% from the fertilizer and 57.9% from the soil. The differences were strongly influenced by the soil tillage system with the highest percentage found in direct sowing (50.2%) and was significantly lower (by 32.5%) in the conventional soil tillage system, the same results were found in research of Reiter et al. [31]. Difference in the % Ndfa between the soil tillage systems is likely caused by the mineral forms of nitrogen in soil. The conventional soil tillage system introduces substantial oxygen into the soil, which accelerates the mineralization of soil organic N compounds, releasing mineral forms of N that inhibit the infection process of Rhizobium, as well as the biological N reduction process [32]. Mineral forms of N inhibit the nodulation process and decrease the activity of nitrogenize [33,34,35,36].
There were no differences in the N content in the pea seeds and the post-harvest residues derived from the applied mineral fertilizer (Table 9). A greater percentage of N was derived by the pea crop from the soil than the atmosphere. The highest amount was taken from the soil in conventional tillage (74.6%) and was significantly lower in the reduced system (by 19.1%) and direct sowing (by 31.3%).
In the post-harvested residues, the percentage of N derived from the atmosphere was 26.8% and there was no significant difference between years and tillage system.
The amount of N in the plant derived from the fertilizer was much lower than that derived from the atmosphere and the soil (mean value for whole experiment: 10.9%), and no differences between the year of experiment and the tillage system were observed. The majority of nitrogen content in the pea post-harvest residues was derived from the soil (62.1%); slightly higher in 2013 than in 2014. In addition, the soil tillage systems resulted in slightly different amounts of N derived from the soil: highest in conventional tillage (69.4%) and lowest (55.4%) in direct sowing.
Lower standard deviations values obtained for discussed features in pea may suggest more stable values, in comparison to barley crop.
For legume cultivation, it is crucial to define how much N is fixed from the atmosphere. In our case, N fixed from the atmosphere in total biomass was 56.5 kg ha−1, with 48.4 kg ha−1 accumulated in the harvested seeds (Table 10). The highest amount (64.6 kg ha−1) occurred in direct sowing and was significantly lower (55.1%) in the conventional soil tillage system. Although, the rainfall at the turn of May and June during the flowering of pea in 2013 was higher than in 2014, the temperature was lower (Table 1). This situation could decrease the nitrogen fixation from the atmosphere in 2013.
Table 10.
Nitrogen (N) accumulation (kg ha−1) by the pea crop from different sources. Ndfa denotes the N derived from the atmosphere, Ndff denotes the N derived from the fertilizer and Ndfs denotes the N derived from the soil.
In the post-harvest residues, the amount of N fixed from the atmosphere was very low (only 8.0 kg ha−1) and was not significantly different between soil tillage systems. Carrance et al. [37] reported that about 50% of the N contained in pea seeds is derived from the atmosphere and about 20 kg ha−1 of the N in straw. Enrico et al. [38] reported that 60% of N demand by field peas in Argentina (average from 16 experiments) was met by biologically fixated N.
The 15N isotope method allowed the amount of N in the pea biomass derived from the three sources to be determined. It was also possible to determine the 15N accumulation in each part of the pea biomass. The amount of 15N that accumulated in the seeds was not different between years but only by soil tillage system (Table 11). The highest amount (4.74 kg ha−1) was recorded in the conventional tillage and was significantly lower in the reduced system (28.3%) and direct sowing (33.1%). Mean total 15N accumulated in the pea biomass was 4.69 kg ha−1, with the highest value observed in the conventional system (5.89 kg ha−1), and less in the reduced tillage (4.25 kg ha−1) and direct sowing (3.95 kg ha−1). The total N accumulated in the pea biomass in the conventional tillage we estimated as 52.8%, 38.1% in the reduced system, and 35.4% in the direct sowing (overall mean value: 42.1%).
Table 11.
The accumulation of 15N isotope in the pea biomass in relation to the amount applied as (15NH4)2SO4.
Similar results have been reported in a white lupin experiment [17]. Studies have shown that more than 50% of the applied 15N isotope in mineral fertilizer (15NH4)2SO4 may remain in the soil as organic and mineral compounds of N, be lost by deep infiltration with water or by gases (denitrification process) or be incorporated into the root system of the pea plant [4,39]. If we set the total amount of 15N isotope by the pea crop at 100%, then we estimate that 80.3% accumulated in the seeds and 19.7% in the post-harvest residues. These data confirm that legumes accumulate N mainly in their seeds, which is important information for food production, although from a soil fertility perspective, less N is introduced into the soil to provide a future source of N for subsequent plants in the crop rotation.
The practically functional relations were found between the seed yield and the total biomass in each soil tillage system in pea and barley plants. But in reduced tillage systems, correlations between the total nitrogen content in seeds (%) and seed yield were also strong relations. Such strong functional relations were also found in barley plants in the reduced system between total nitrogen content in post-harvest residues (%) and grain yield and total biomass yield (Figure 1).
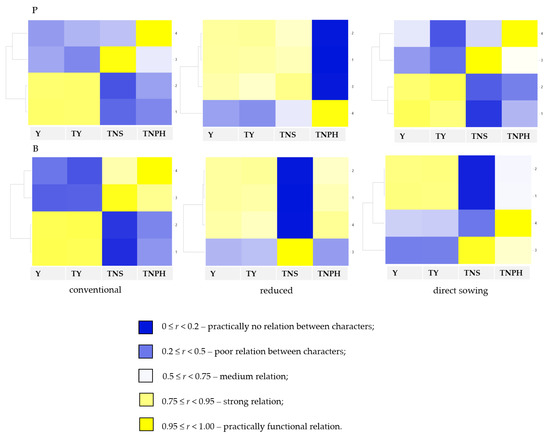
Figure 1.
Correlation coefficients between features analyzed for pea (P) and barley (B) in soil tillage systems. Features compared: Y, seed/grain yield; TY, total biomass yield; TNS, total nitrogen content in seeds (%); TNPH, total nitrogen content in post-harvest residues (%). Interpretation of Pearson’s linear correlation coefficient: 0 ≤ p < 0.2—practically no relation between characters; 0.2 ≤ p < 0.5—poor relation between characters; 0.5 ≤ p < 0.75—medium relation; 0.75 ≤ p < 0.95—strong relation; 0.95 ≤ p < 1.00—practically functional relation.
In a study carried out by Panasiewicz et al. [40], the protein content ranged from 295 g kg−1 in conventional tillage to 314 g kg−1 in no-tillage (direct sowing) and the tillage system did not influence the protein content in narrow-leaved lupin seeds. However, there was a trend of increasing protein content in seeds as the tillage system became more minimized. The Pearson’s linear correlation showed a practical functional relationship between seed yield and protein efficiency.
4. Conclusions
The soil tillage system was found to significantly influence the yield in all parts of the pea plant. The greatest yield was observed in conventional tillage and was significantly lower in direct sowing. The percentage of N derived from the atmosphere was significantly higher in direct sowing compared to conventional tillage. The N that accumulated in the pea biomass was derived from three sources: atmosphere (35.2%), mineral N fertilizer (6.8%) and the soil (57.9%). The modified percentage of N derived from the atmosphere was significantly influenced by the soil tillage system; the lowest value (17.7%) was observed in conventional tillage and the highest in direct sowing (50.2%), what equates to 28.9 and 64.4 kg ha−1, respectively. The amount of 15N applied in the mineral fertilizer (15NH4)2SO4 was 11.14 kg ha−1, a portion of which accumulated in the pea biomass (4.69 kg), which equates to 42.1% recovery. If we set the total amount of 15N isotope by the pea crop at 100%, then we estimate that 80.3% accumulated in the seeds and 19.7% in the post-harvest residues.
Author Contributions
S.K. and A.F. conceived and designed the experiments; S.K., A.F., D.K., K.P., G.S. (Grażyna Szymańska), K.R. and G.S. (Grzegorz Skrzypczak) performed the field experiments and analyzed the data; A.F. and S.K. performed the statistical analysis; S.K., D.K. and A.F. prepared the references; A.F. and S.K. wrote the study; S.K., A.F., D.K., K.P., G.S. (Grażyna Szymańska), K.R. and G.S. (Grzegorz Skrzypczak) revised the manuscript. All authors have read and agreed to the published version of the manuscript.
Funding
This research was funded by Polish Ministry of Agriculture and Rural Development (Project number HOR 3.3/2011–2015).
Acknowledgments
We gratefully thank Jerzy Szukała (Department of Agronomy, Faculty of Agronomy and Bioengineering, Poznań University of Life Sciences) for the opportunity to carry out this experiment within the project Polish Ministry of Agriculture and Rural Development (number HOR 3.3/2011–2015) and for supporting research on biological nitrogen fixation by legumes. Publication was co-financed within the framework of the Polish Ministry of Science and Higher Education’s program: “Regional Initiative Excellence” in the years 2019–2022 (No. 005/RID/2018/19).
Conflicts of Interest
The authors declare no conflict of interest.
References
- Savage, G.P.; Deo, S. The nutritional value of peas (Pisum sativum L.): A literature review. Nutr. Abst. Rev. 1989, 59, 66–83. [Google Scholar]
- Brkić, S.; Milaković, Z.; Kristek, A.; Antunović, M. Pea yield and its quality depending on inoculation, nitrogen and molybdenum fertilization. Plant Soil Environ. 2004, 50, 39–45. [Google Scholar] [CrossRef] [Green Version]
- Ofuya, Z.M.; Akhidue, V. The role of pulses in human nutrition: A Review. J. Appl. Sci. Environ. Manag. 2005, 9, 99–104. [Google Scholar] [CrossRef] [Green Version]
- Mayer, J.; Buegger, F.; Jensen, E.S.; Schloter, M.; Heβ, J. Residual nitrogen contribution from grain legumes to succeeding wheat and rape and related microbial process. Soil Biol. Biochem. 2003, 35, 21–28. [Google Scholar] [CrossRef]
- Knight, J.D. Frequency of field pea in rotations impacts biological nitrogen fixation. Can. J. Plant Sci. 2012, 92, 1005–1011. [Google Scholar] [CrossRef]
- Bénézit, M.; Biarnès, V.; Jeuffroy, M.-H. Impact of climate and diseases on pea yields: What perspectives with climate change? OCL 2017, 24, D103. [Google Scholar] [CrossRef]
- Faligowska, A.; Szukała, J. Wpływ szczepienia nasion i nawożenia azotem na cechy biometryczne roślin strączkowych. Zesz. Probl. Post. Nauk Rol. 2010, 550, 201–209. (In Polish) [Google Scholar]
- Małecka-Jankowiak, I.; Blecharczyk, A.; Swędrzyńska, D.; Sawinska, Z.; Piechota, T. The effect of long-term tillage systems on some soil properties and yield of pea (Pisum sativum L.). Acta Sci. Pol. Agric. 2016, 15, 37–50. [Google Scholar]
- Morris, N.L.; Miller, P.C.H.; Orson, J.H.; Froud-Williams, R.J. The adoption of non-inversion tillage systems in the United Kingdom and the agronomic impact on soil, crops and the environment—A review. Soil Tillage Res. 2010, 108, 1–15. [Google Scholar] [CrossRef]
- Soane, B.D.; Ball, B.C.; Arvidsson, J.; Basch, G.; Moreno, F.; Roger-Estrade, J. No-till in northern, western and south-western Europe: A review of problems and opportunities for crop production and the environment. Soil Tillage Res. 2012, 118, 66–87. [Google Scholar] [CrossRef] [Green Version]
- Santín-Montanyá, M.I.; Zambrana, E.; Fernández-Getino, A.P.; Tenorio, J.L. Dry pea (Pisum sativum L.) yielding and weed infestation response, under different tillage conditions. Crop Protec. 2014, 65, 122–128. [Google Scholar] [CrossRef]
- Gregory, A.S.; Dungait, J.A.J.; Watts, C.W.; Bol, R.; Dixon, E.R.; White, R.P.; Whitmore, A.P. Long-term management changes topsoil and subsoil organic carbon and nitrogen dynamics in a temperate agricultural system. Eur. J Soil Sci. 2016, 67, 421–430. [Google Scholar] [CrossRef] [PubMed] [Green Version]
- Faligowska, A. Plonowanie i Jakość Nasion Łubinu Żółtego Oraz Jego Wpływ Następczy w Warunkach Stosowania Konwencjonalnej Uprawy Roli i Wieloletnich Uproszczeń Uprawowych; Wydawnictwo Uniwersytetu Przyrodniczego w Poznaniu: Poznań, Poland, 2018; Volume 504, p. 112. (In Polish) [Google Scholar]
- Gajda, A.M.; Przewłoka, B.; Gawryjołek, K. Changes in soil quality associated with tillage system applied. Int. Agrophys. 2013, 27, 133–141. [Google Scholar] [CrossRef]
- Gugała, M.; Zarzecka, K. Wpływ metod uprawy roli i sposobów pielęgnacji na zachwaszczenie i plonowanie łubinu wąskolistnego odmiany Sonet. Fragm. Agron. 2012, 29, 16–24. (In Polish) [Google Scholar]
- Soil Survey Staff. A basic system of soil classification for making and interpreting soil surveys. In Soil Taxonomy, 2nd ed.; Handbook 436; U.S. Department of Agriculture, Natural Resources Conservation Service: Washington, DC, USA, 2014. [Google Scholar]
- Kalembasa, S.; Szukała, J.; Faligowska, A.; Kalembasa, D.; Symanowicz, B.; Becher, M.; Gebus-Czupyt, B. Quantification of biologically fixed nitrogen by white lupin (Lupins albus L.) and its subsequent uptake by winter wheat using the 15N isotope dilution method. Agronomy 2020, 10, 1392. [Google Scholar] [CrossRef]
- Woźniak, A. The yielding of pea (Pisum sativum L.) under different tillage conditions. Acta Sci. Pol. 2013, 12, 133–141. [Google Scholar]
- Faligowska, A.; Szukała, J. Wpływ deszczowania, systemów uprawy roli i polimeru na plonowanie i wartość siewną nasion grochu. Fragm. Agron. 2011, 28, 15–22. (In Polish) [Google Scholar]
- Mathew, R.P.; Feng, Y.; Githinji, L.; Ankumah, R.; Balkcom, R.S. Impact of no-tillage and conventional tillage systems on soil microbial communities. Appl. Environ. Soil Sci. 2012, 2012, 548620. [Google Scholar] [CrossRef] [Green Version]
- Dubova, L.; Ruža, A.; Alsina, I. Soil microbiological activity depending on tillage system and crop rotation. Agron. Res. 2016, 14, 1274–1284. [Google Scholar]
- Grabowska, K.; Banaszkiewicz, B. Effect of air temperature and atmospheric precipitation on yielding of sowing pea in central Poland. Acta Agroph. 2009, 13, 113–120. [Google Scholar]
- Bueckert, R.A.; Wagenhoffer, S.; Hnatowich, G.; Warkentin, T. Effect of heat and precipitation on pea yield and reproductive performance in the field. Can. J. Plant Sci. 2015, 95, 629–639. [Google Scholar] [CrossRef]
- Gantner, R.; Stjepanovic, M.; Gantner, V. Precipitation and temperature effects upon grain yield of field pea. 1503-1506. In Proceedings of the 7th ALPS-ADRIA Scientific Workshop, Stara Lesna, Slovakia, 28 April–2 May 2008; p. 36. [Google Scholar]
- Małecka, I.; Blecharczyk, A.; Sawinska, Z.; Piechota, T. Wpływ systemów uprawy roli na produkcję biomasy nadziemnej jęczmienia jarego oraz pobranie makroskładników. Fragm. Agron. 2014, 31, 65–74. (In Polish) [Google Scholar]
- Mariotti, F.; Tomé, D.; Mirand, P.P. Converting nitrogen into protein—beyond 6.25 and Jones’ factors. Crit. Rev. Food Sci. Nutr. 2008, 48, 177–184. [Google Scholar] [CrossRef] [PubMed]
- Siczek, A.; Lipiec, J.; Wielbo, J.; Szarlip, P.; Kidaj, D. Pea growth and symbiotic activity response to Nod factors (lipo-chitooligosaccharides) and soil compaction. Appl. Soil Ecol. 2013, 72, 181–186. [Google Scholar] [CrossRef]
- Lecoeur, J.; Sinclair, T.R. Analysis of nitrogen partitioning in field pea resulting in linear increase in nitrogen harvest index. Field Crop. Res. 2001, 71, 151–158. [Google Scholar] [CrossRef]
- Kalembasa, D.; Szukała, J.; Symanowicz, B.; Kalembasa, S.; Faligowska, A.; Becher, M. Amount of biologically nitrogen fixed by faba bean and its uptake by winter wheat determined by 15N ID method. Arch. Agron. Soil Sci. 2020, 67, 1875–1888. [Google Scholar] [CrossRef]
- Siczek, A.; Kalembasa, S.; Kalembasa, D.; Becher, M.; Symanowicz, B. Influence of Nod factors on the quantity and distribution in faba bean of symbiotically fixed nitrogen as determined by the 15 N isotope dilution method. Crop Sci. 2020, 60, 2720–2731. [Google Scholar] [CrossRef]
- Reiter, K.; Schmidtke, K.; Rauber, R. The influence of long-term tillage systems on symbiotic N2 fixation of pea (Pisum sativum L.) and red clover (Trifolium pratense L.). Plant Soil 2002, 238, 41–55. [Google Scholar] [CrossRef]
- Luciński, R.; Polcyn, W.; Ratajczak, L. Nitrate reduction and nitrogen fixation in symbiotic association Rhizobium-legumes. Acta Biochim. Pol. 2002, 49, 537–546. [Google Scholar] [CrossRef] [Green Version]
- Buttery, B.R.; Gibson, A.H. The effect of nitrate on the time course of nitrogen fixation and growth in Pisum sativum and Vicia faba. Plant Soil 1990, 127, 143–146. [Google Scholar] [CrossRef]
- Clayton, G.W.; Rice, W.A.; Lupwayi, N.Z.; Johnston, A.M.; Lafond, G.P.; Grant, C.A.; Walley, F.L. Inoculant formulation and fertilizer nitrogen effects on field pea: Nodulation, N 2 fixation and nitrogen partitioning. Can. J. Plant Sci. 2004, 84, 79–88. [Google Scholar] [CrossRef]
- Sprent, J.I.; Stephens, J.H.; Rupela, O.P. Environmental effects on nitrogen fixation. In World Crops: Cool Season Food Legumes; Summerfield, R.J., Ed.; Current Plant Science and Biotechnology in Agriculture; Springer: Dordrecht, The Netherlands, 1988; Volume 5, pp. 801–810. [Google Scholar]
- Voisin, A.S.; Salon, C.; Munier-Jolain, N.G.; Ney, B. Effect of mineral nitrogen on nitrogen nutrition and biomass partitioning between the shoot and roots of pea (Pisum sativum L.). Plant Soil 2002, 242, 251–262. [Google Scholar] [CrossRef]
- Carranca, C.; de Varennes, A.; Rolston, D. Biological nitrogen fixation by fababean, pea and chickpea, under field conditions, estimated by the 15N isotope dilution technique. Eur. J. Agron. 1999, 10, 49–56. [Google Scholar] [CrossRef]
- Enrico, J.M.; Piccinetti, C.F.; Barraco, M.R.; Agosti, M.B.; Eclesia, R.P.; Salvagiotti, F. Biological nitrogen fixation in field pea and vetch: Response to inoculation and residual effect on maize in the Pampean region. Eur. J. Agron. 2020, 115, 126016. [Google Scholar] [CrossRef]
- Wichern, F.; Eberhardt, E.; Mayer, J.; Joergensen, R.G.; Müller, M. Nitrogen rhizodeposition in agriculture crops: Methods, estimates and future prospects. Soil Biol. Biochem. 2008, 40, 30–48. [Google Scholar] [CrossRef]
- Panasiewicz, K.; Faligowska, A.; Szymańska, G.; Szukała, J.; Ratajczak, K.; Sulewska, H. The effect of various tillage systems on productivity of narrow-leaved lupin-winter wheat-winter triticale-winter barley rotation. Agronomy 2020, 10, 304. [Google Scholar] [CrossRef] [Green Version]
Publisher’s Note: MDPI stays neutral with regard to jurisdictional claims in published maps and institutional affiliations. |
© 2022 by the authors. Licensee MDPI, Basel, Switzerland. This article is an open access article distributed under the terms and conditions of the Creative Commons Attribution (CC BY) license (https://creativecommons.org/licenses/by/4.0/).