
Determination of the Composition of Bio-Oils from the Pyrolysis of Orange Waste and Orange Pruning and Use of Biochars for the Removal of Sulphur from Waste Cooking Oils

 ,
,  ,
,  and
and 
Abstract
:1. Introduction
- (1)
- Valorising orange tree pruning and sweet orange waste (currently used for the production of boiler pellets and cattle feed, respectively) through the production of biochar and bio-oil by slow pyrolysis.
- (2)
- Characterise the biochars and bio-oils obtained.
- (3)
- Apply the biochars obtained for the removal of sulphur from waste cooking oils.
2. Materials and Methods
2.1. Raw Materials
2.2. Pretreatment of Sweet Oranges
2.3. Pretreatment of Orange Pruning
2.4. Pyrolysis
2.5. Adsorption of Sulphur in Oils by the Produced Biochars
2.6. Products Characterisation
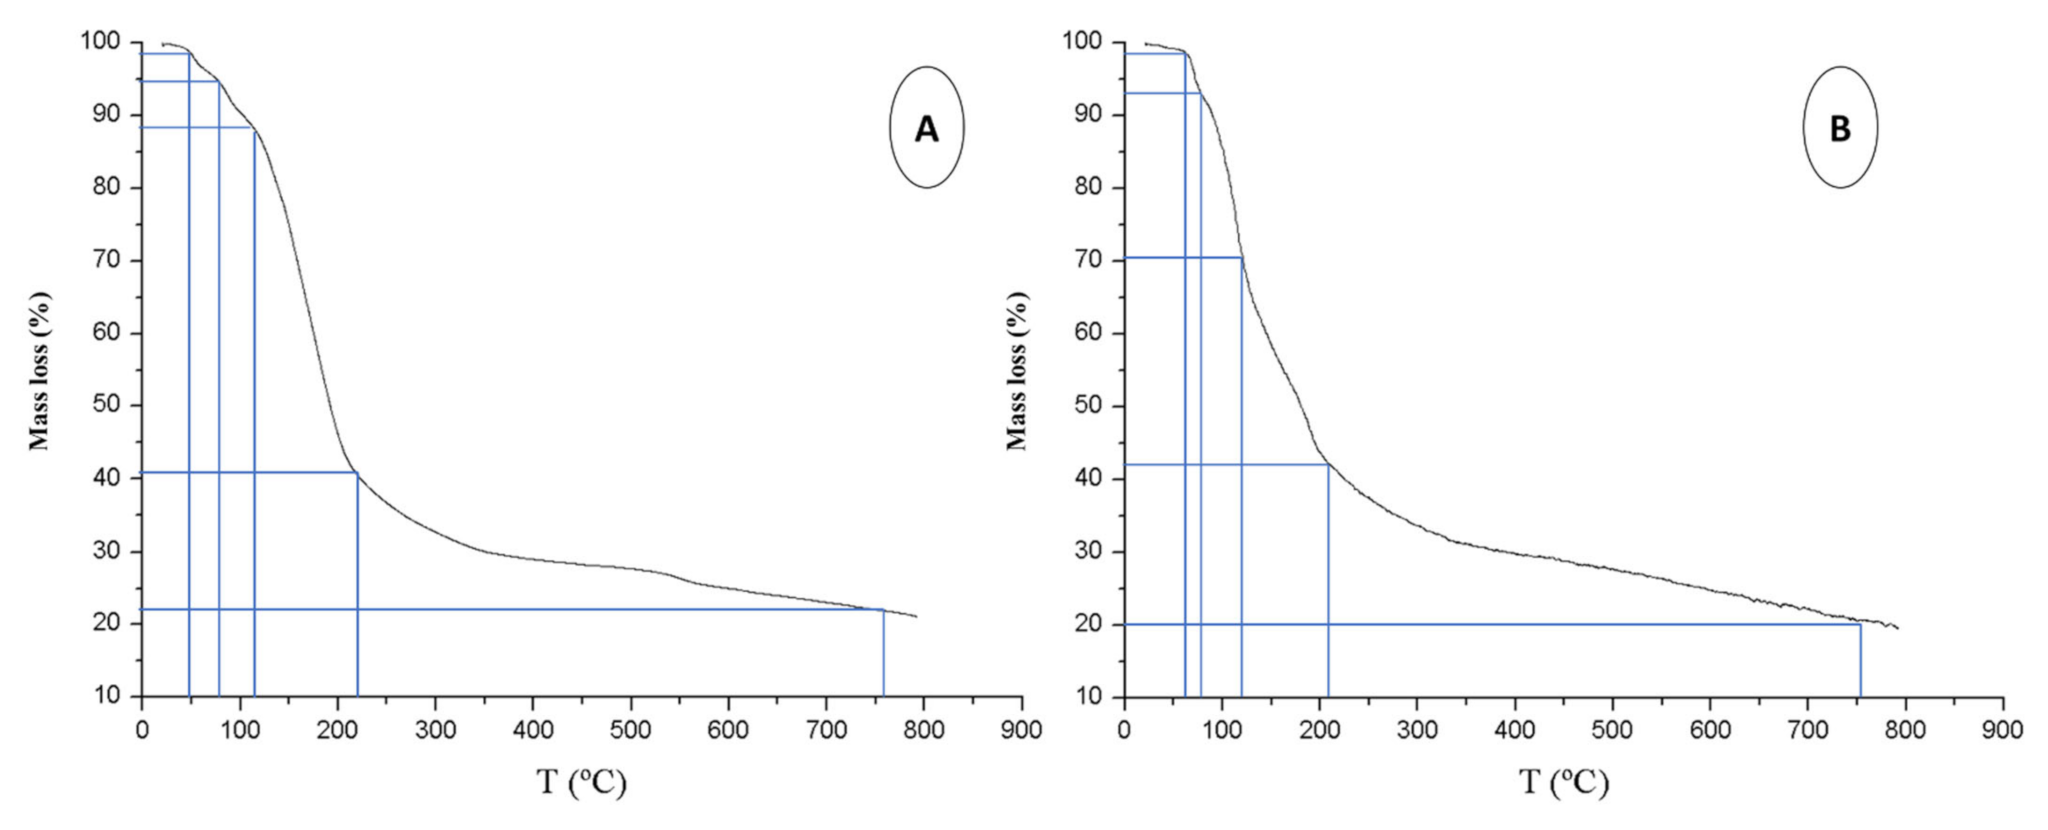
2.6.1. Thermogravimetric Analysis
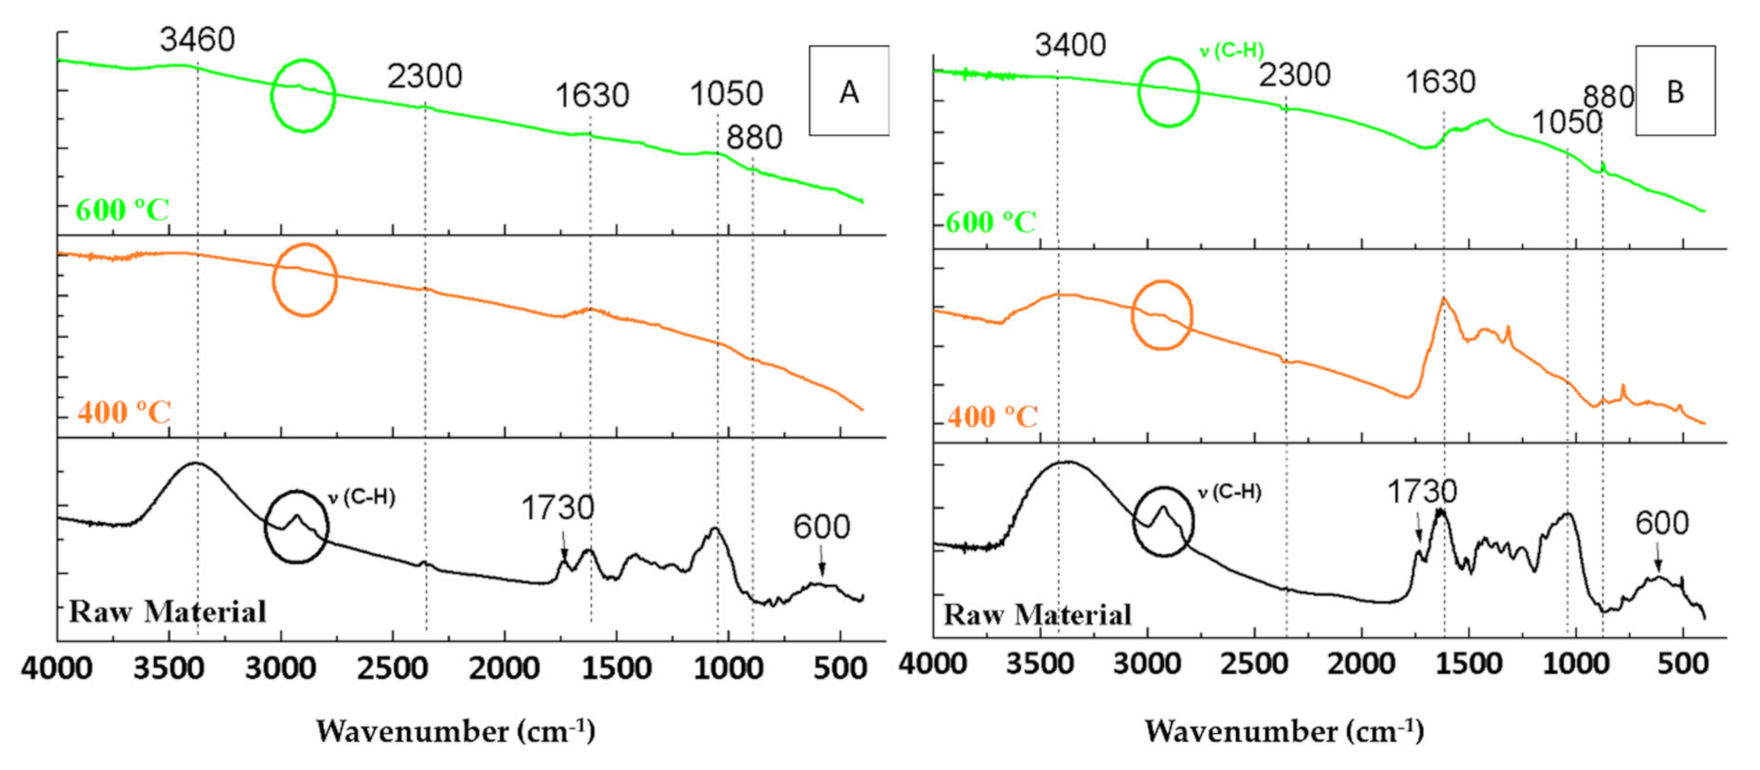
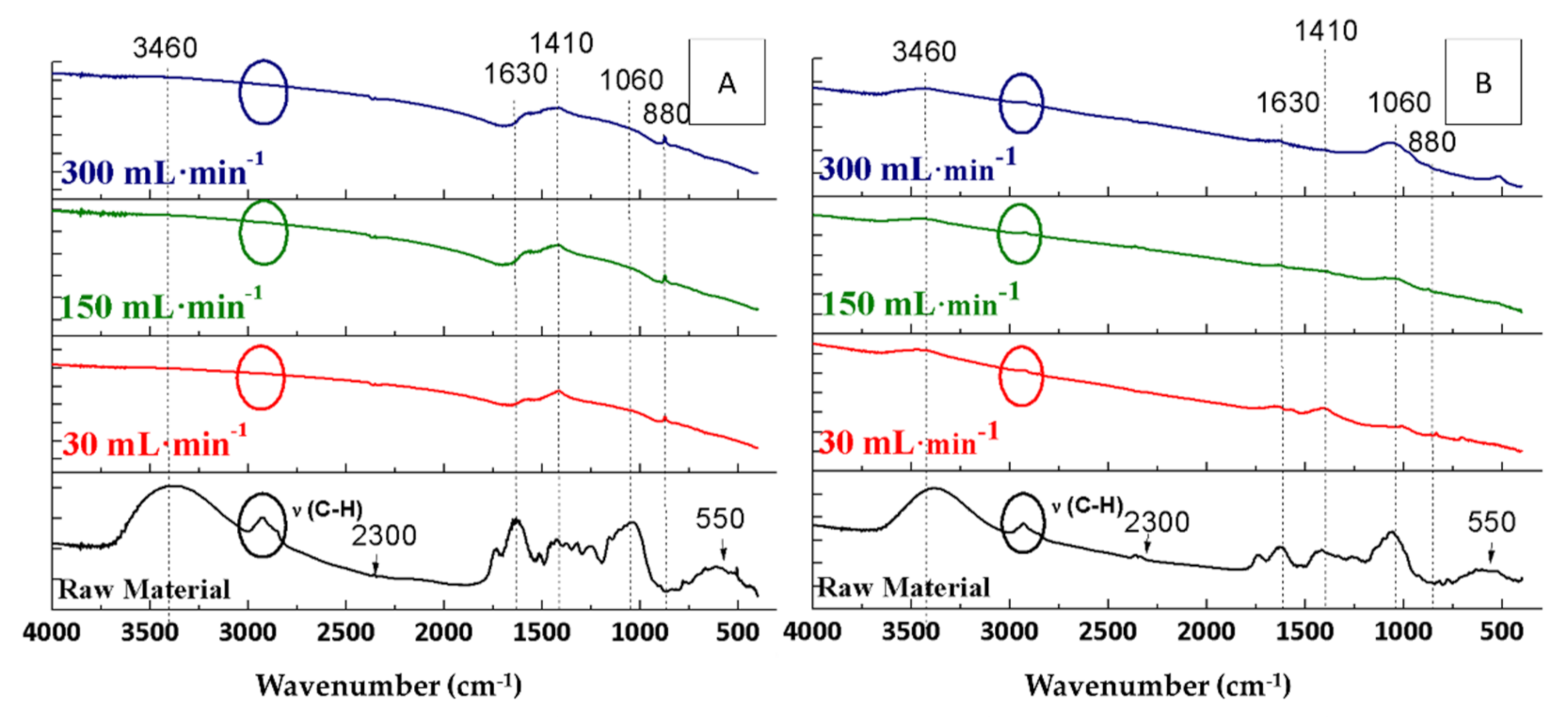
2.6.2. Fourier-Transform Infrared Spectroscopy (FTIR)
2.6.3. Biochar Texture Characterisation
2.6.4. Gas Chromatography–Mass Spectrometry
2.6.5. Determination of Sulphur in Oils
3. Results and Discussion
3.1. Characterisation of the Raw Material
Thermogravimetric Analysis (TGA)
3.2. Product Distribution after Pyrolysis
3.3. Characterisation of Biochars
3.3.1. Temperature Influence
3.3.2. Influence of the Inert Gas Flow Rate
3.3.3. Influence of the Heating Ramp
3.4. Bio-Oil Characterisation
3.4.1. Temperature Influence
3.4.2. Influence of Argon Flow Rate
3.4.3. Influence of the Heating Ramp
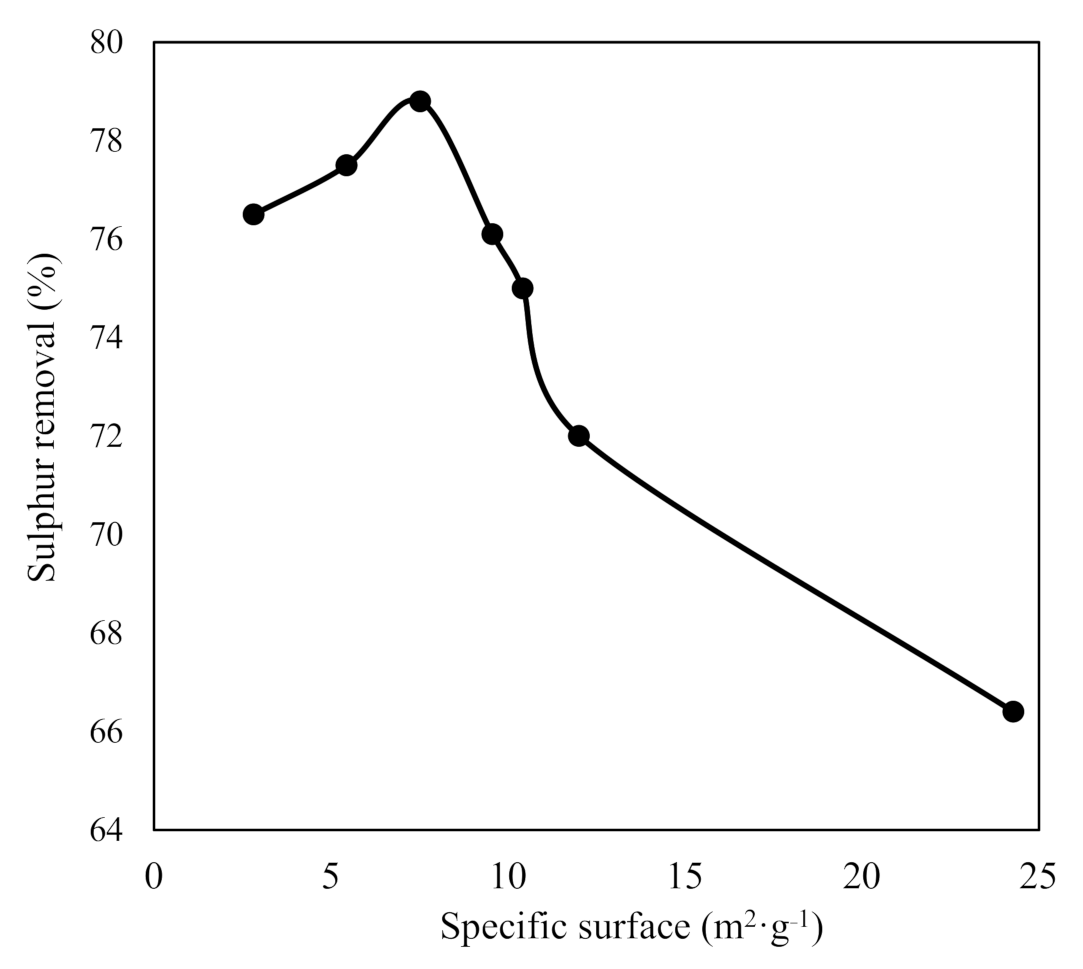
3.5. Sulphur Removal Using Biochars from Pyrolysis of Sweet Orange Waste and Orange Pruning
4. Conclusions
Author Contributions
Funding
Institutional Review Board Statement
Informed Consent Statement
Data Availability Statement
Conflicts of Interest
References
- FAOSTAT. Available online: http://www.fao.org/faostat/es/#data/QC (accessed on 23 May 2020).
- Ministerio de Agricultura, Pesca y Agricultura. Superficies y Producciones Anuales de Cultivos (2017). Available online: https://www.mapa.gob.es/es/estadistica/temas/estadisticas-agrarias/agricultura/superficies-producciones-anuales-cultivos/ (accessed on 28 November 2019).
- García-Martín, J.F.; Olmo, M.; García, J.M. Effect of ozone treatment on postharvest disease and quality of different citrus varieties at laboratory and at industrial facility. Postharvest Biol. Technol. 2018, 137, 77–85. [Google Scholar] [CrossRef] [Green Version]
- Rodríguez, A.; Rosal, A.; Jiménez, L. Biorefinery of agricultural residues by fractionation of their components through hydrothermal and organosolv processes. Afinidad 2009, 545, 14–19. [Google Scholar]
- Wilkins, M.R.; Suryawati, L.; Maness, N.O.; Chrz, D. Ethanol production by Saccharomyces cerevisiae and Kluyveromyces marxianus in the presence of orange-peel oil. World J. Microbiol. Biotechnol. 2007, 23, 1161–1168. [Google Scholar] [CrossRef]
- Rezzadori, K.; Benedetti, S.; Amante, E.R. Proposals for the residues recovery: Orange waste as raw material for new products. Food Bioprod. Processing 2012, 90, 606–614. [Google Scholar] [CrossRef]
- Crawshaw, R. Co-Product Feeds: Animal Feeds from the Food and Drinks Industries; Nottingham University Press: Nottingham, UK, 2001; p. 285. [Google Scholar]
- Guerrero, C.C.; Carrasco de Brito, J.; Lapa, N.; Oliveira, J.F.S. Re-use of industrial orange wastes as organic fertilizers. Bioresour. Technol. 1995, 53, 43–51. [Google Scholar] [CrossRef]
- Elías Castells, X. Reciclaje de Residuos Industriales: Residuos Sólidos Urbanos y Fangos de Depuradora; Ediciones Díaz de Santos, S.A.: Madrid, Spain, 2009; p. 1320. [Google Scholar]
- Restrepo Duque, A.M.; Rodríguez Sandoval, E.; Manjarrés Pinzón, K. Edible orange peels: An approximation to the development of products with added value from agricultural products. Producción + Limpia 2011, 6, 47–57. [Google Scholar]
- Boluda-Aguilar, M.; López-Gómez, A. Production of bioethanol by fermentation of lemon (Citrus limon L.) peel wastes pretreated with steam explosion. Ind. Crops Prod. 2013, 41, 188–197. [Google Scholar] [CrossRef]
- Siles, J.Á.; Martín, M.D.L.Á.; Martín, A.; Raposo, F.; Borja, R. anaerobic digestion of wastewater derived from the pressing of orange peel generated in orange juice production. J. Agric. Food Chem. 2007, 55, 1905–1914. [Google Scholar] [CrossRef]
- Calabrò, P.S.; Fazzino, F.; Sidari, R.; Zema, A. Optimization of orange peel waste ensiling for sustainable anaerobic digestion. Renew. Energy 2020, 154, 849–862. [Google Scholar] [CrossRef]
- Feng, C.H.; García-Martín, J.F.; Broncano Lavado, M.; del López-Barrera, M.; Álvarez-Mateos, P. Evaluation of different solvents on flavonoids extraction efficiency from sweet oranges and ripe and immature Seville oranges. Int. J. Food Sci. Technol. 2020, 55, 3123–3134. [Google Scholar] [CrossRef]
- Volpe, M.; Panno, D.; Volpe, R.; Messineo, A. Upgrade of citrus waste as a biofuel via slow pyrolysis. J. Anal. Appl. Pyrolysis 2015, 115, 66–76. [Google Scholar] [CrossRef]
- Bagnato, G.; Sanna, A.; Paone, E.; Catizzone, E. Recent catalytic advances in hydrotreatment processes of pyrolysis bio-oil. Catalysts 2021, 11, 157. [Google Scholar] [CrossRef]
- Sánchez-Borrego, F.J.; Álvarez-Mateos, P.; García-Martín, J.F. Biodiesel and other value-added products from bio-oil obtained from agrifood waste. Processes 2021, 9, 797. [Google Scholar] [CrossRef]
- García Martín, J.F.; Cuevas, M.; Feng, C.H.; Álvarez Mateos, P.; Torres García, M.; Sánchez, S. Energetic valorisation of olive biomass: Olive-tree pruning, olive stones and pomaces. Processes 2020, 8, 511. [Google Scholar] [CrossRef]
- Association European Biomass Industry Pyrolysis. Available online: https://www.eubia.org/cms/ (accessed on 26 May 2020).
- Basu, P. Biomass Gasification and Pyrolysis, 1st ed.; Academic Press: Cambridge, MA, USA, 2010; p. 376. [Google Scholar]
- Bhattacharjee, N.; Baran Biswas, A. Pyrolysis of orange bagasse: Comparative study and parametric influence on the product yield and their characterization. J. Environ. Chem. Eng. 2019, 7, 102903. [Google Scholar] [CrossRef]
- Bradley, D.; Svebio, B.H.; Ab, H.; Wild, M.; Deutmeyer, M.; Schouwenberg, P.P.; Essent, R.; Hess, R.; Tumuluru, J.S.; Bradburn, K. Low Cost, Long Distance Biomass Supply Chains. In Task 40: Sustainable International Bioenergy Trade; Goh, C.S., Junginger, M., Eds.; IEA Bioenergy: Paris, France, 2013; pp. 1–65. [Google Scholar]
- Encinar, J.M.; Beltran, F.J.; Gonzalez, J.F.; Moreno, M.J. Pyrolysis of maize, sunflower, grape and tobacco residues. Chem. Technol. Biotechnol. 1997, 70, 400–410. [Google Scholar] [CrossRef]
- Wu, L.; Wan, W.; Shang, Z.; Gao, X.; Kobayashi, N.; Luo, G.; Li, Z. Surface modification of phosphoric acid activated carbon by using non-thermal plasma for enhancement of Cu(II) adsorption from aqueous solutions. Sep. Purif. Technol. 2018, 197, 156–169. [Google Scholar] [CrossRef]
- Roy, M.; Mohanty, K. Valorization of de-oiled microalgal biomass as a carbon-based heterogeneous catalyst for a sustainable biodiesel production. Bioresour. Technol. 2021, 337, 125424. [Google Scholar] [CrossRef]
- Sánchez-Borrego, F.J.; Barea de Hoyos-Limón, T.J.; García-Martín, J.F.; Álvarez-Mateos, P. Production of bio-oils and biochars from olive stones: Application of biochars to the esterification of oleic acid. Plants 2021, 11, 70. [Google Scholar] [CrossRef] [PubMed]
- Álvarez-Mateos, P.; García-Martín, J.F.; Guerrero-Vacas, F.J.; Naranjo-Calderón, C.; Barrios-Sánchez, C.C.; Pérez-Camino, M.C. Valorization of a high-acidity residual oil generated in the waste cooking oils recycling industries. Grasas Aceites 2019, 70, e335. [Google Scholar] [CrossRef] [Green Version]
- García Martín, J.F.; Carrión Ruiz, J.; Torres García, M.; Feng, C.H.; Álvarez Mateos, P. Esterification of free fatty acids with glycerol within the biodiesel production framework. Processes 2019, 7, 832. [Google Scholar] [CrossRef] [Green Version]
- García-Martín, J.F.; Alés-Álvarez, F.J.; Torres-García, M.; Feng, C.H.; Álvarez-Mateos, P. Production of oxygenated fuel additives from residual glycerine using biocatalysts obtained from heavy-metal-contaminated Jatropha curcas L. roots. Energies 2019, 12, 740. [Google Scholar] [CrossRef] [Green Version]
- Cárdenas, J.; Orjuela, A.; Sánchez, D.L.; Narváez, P.C.; Katryniok, B.; Clark, J. Pre-treatment of used cooking oils for the production of green chemicals: A review. J. Clean. Prod. 2021, 289, 125129. [Google Scholar] [CrossRef]
- Shan, Y.; Erika, G.; Gray, D.; Yuan, Y.; Simeon, R. Cost-Effective Waste to Biodiesel Production at a Wastewater Treatment Plant; East Bay Municipal Utility District: Oakland, CA, USA, 2019. [Google Scholar]
- Aguiar Trujillo, L.; Márquez-Montesinos, F.; Gonzalo, A.; Sánchez, J.L.; Arauzo, J. Influence of temperature and particle size on the fixed bed pyrolysis of orange peel residues. J. Anal. Appl. Pyrolysis 2008, 83, 124–130. [Google Scholar] [CrossRef]
- Lopez-Velazquez, M.A.; Santes, V.; Balmaseda, J.; Torres-Garcia, E. Pyrolysis of orange waste: A thermo-kinetic study. J. Anal. Appl. Pyrolysis 2013, 99, 170–177. [Google Scholar] [CrossRef]
- Aburto, J.; Moran, M.; Galano, A.; Torres-García, E. Non-isothermal pyrolysis of pectin: A thermochemical and kinetic approach. J. Anal. Appl. Pyrolysis 2015, 112, 94–104. [Google Scholar] [CrossRef]
- Álvarez-Mateos, P.; Alés-Álvarez, F.J.; García-Martín, J.F. Phytoremediation of highly contaminated mining soils by Jatropha curcas L. and production of catalytic carbons from the generated biomass. J. Environ. Manag. 2019, 231, 886–895. [Google Scholar] [CrossRef]
- Yang, H.; Yan, R.; Chen, H.; Lee, D.H.; Zheng, C. Characteristics of hemicellulose, cellulose and lignin pyrolysis. Fuel 2007, 86, 1781–1788. [Google Scholar] [CrossRef]
- Martínez-Cartas, M.L.; Sánchez, S.; Cuevas, M. Thermal characterization and pyrolysis kinetics of six types of tropical timber from Central Africa. Fuel 2022, 307, 121824. [Google Scholar] [CrossRef]
- Miranda, R.; Bustos, D.; Sosa Blanco, C.; Gutiérrez Villarreal, M.H.; Rodriguez Cantú, M.E. Pyrolysis of sweet orange (Citrus sinensis) dry peel. J. Anal. Appl. Pyrolysis 2008, 86, 245–251. [Google Scholar] [CrossRef]
- Monteiro Santos, C.; Dweck, J.; Silva Viotto, R.; Henrique Rosa, A.; de Morais, L.C. Application of orange peel waste in the production of solid biofuels and biosorbents. Bioresour. Technol. 2015, 196, 469–479. [Google Scholar] [CrossRef] [PubMed]
- Abdelaal, A.; Pradhan, S.; Al-Nouss, A.; Tong, Y.; Al-Ansari, T.; McKay, G.; Mackey, H.R. The impact of pyrolysis conditions on orange peel biochar physicochemical properties for sandy soil. Waste Manag. Res. 2021, 39, 995–1004. [Google Scholar] [CrossRef] [PubMed]
- Del Pozo, C.; Rego, F.; Yang, Y.; Puy, N.; Bartrolí, J.; Fàbregas, E.; Bridgwater, A.V. Converting coffee silverskin to value-added products by a slow pyrolysis-based biorefinery process. Fuel Processing Technol. 2021, 214, 106708. [Google Scholar] [CrossRef]
- Charusiri, W.; Vitidsant, T. Biofuel production via the pyrolysis of sugarcane (Saccharum officinarum L.) leaves: Characterization of the optimal conditions. Sustain. Chem. Pharm. 2018, 10, 71–78. [Google Scholar] [CrossRef]
- Lugo, C.; García, E.; Rondón, J.; Briceño, J.; Pérez, P.; Rodríguez, P.; del Castillo, H.; Imbert, F. Study of reactions catalyzed as methane reforming and selective catalytic reduction of nox on perovskites of Type La0.7Sr0.3Ni1-XCoxO3 obtained via SCS. Part II. Rev. Cienc. Ing. 2020, 41, 35–146. [Google Scholar]
- De Almeida, C.F.; de Andrade, R.C.; de Oliveira, G.F.; Suegama, P.H.; de Arruda, E.J.; Texeira, J.A.; de Carvalho, C.T. Study of porosity and surface groups of activated carbons produced from alternative and renewable biomass: Buriti petiole. Orbital 2017, 9, 18–26. [Google Scholar] [CrossRef]
- Kim, J.W.; Lee, S.-H.; Kim, S.-S.; Park, S.H.; Jeon, J.-K.; Park, Y.-K. The pyrolysis of waste mandarin residue using thermogravimetric analysis and a batch reactor. Korean J. Chem. Eng. 2011, 28, 1867–1872. [Google Scholar] [CrossRef]
- Özbay, N.; Apaydın-Varol, E.; Burcu Uzun, B.; Eren Pütünb, A. Characterization of bio-oil obtained from fruit pulp pyrolysis. Energy 2008, 33, 1233–1240. [Google Scholar] [CrossRef]
- Van de Beld, B.; Funke, A.; Lindfors, C.; Sandström, L. Country Reports 2019. In Task 34: Direct Thermochemical Liquefaction; Funke, A., Ed.; IEA Bioenergy: Paris, France, 2019; pp. 1–20. [Google Scholar]
- Lewkowski, J. Synthesis, chemistry and applications of 5-hydroxymethylfurfural and its derivatives. Arkivoc 2001, 1, 17–54. [Google Scholar] [CrossRef] [Green Version]
- Huang, S.; Liang, Q.; Geng, J.; Luo, H.; Wei, Q. Sulfurized biochar prepared by simplified technic with superior adsorption property towards aqueous Hg(II) and adsorption mechanisms. Mater. Chem. Phys. 2019, 238, 121919. [Google Scholar] [CrossRef]


| Raw Material | Initial Mass (g) | T (°C) | Hramp (°C·min−1) | Ar Flow Rate (mL·min−1) |
|---|---|---|---|---|
| OW | 9.00 | 400 | 5 | 150 |
| OW | 9.00 | 400 | 10 | 150 |
| OW | 9.00 | 600 | 10 | 30 |
| OW | 9.00 | 600 | 10 | 150 |
| OW | 9.00 | 600 | 10 | 300 |
| OP | 4.33 | 400 | 5 | 150 |
| OP | 4.33 | 400 | 10 | 150 |
| OP | 4.33 | 600 | 10 | 30 |
| OP | 4.33 | 600 | 10 | 150 |
| OP | 4.33 | 600 | 10 | 300 |
| OP | 4.33 | 600 | 20 | 150 |
| Raw Material | T (°C) | Hramp (°C·min−1) | Ar Flow Rate (mL·min−1) | Biochar (% wt.) | Bio-Oil (% wt.) | Syngas (% wt.) | SBET (m2/g) |
|---|---|---|---|---|---|---|---|
| OW | 400 | 5 | 150 | 37.7 | 57.8 | 4.6 | ≤1 |
| OW | 400 | 10 | 150 | 34.3 | 56.7 | 7.9 | ≤1 |
| OW | 600 | 10 | 30 | 32.1 | 56.6 | 11.2 | ≤1 |
| OW | 600 | 10 | 150 | 31.3 | 58.9 | 9.8 | ≤1 |
| OW | 600 | 10 | 300 | 30.9 | 62.2 | 6.9 | ≤1 |
| OP | 400 | 5 | 150 | 35.1 | 58.2 | 6.7 | 2.8 |
| OP | 400 | 10 | 150 | 35.3 | 57.3 | 7.4 | 5.4 |
| OP | 600 | 10 | 30 | 24.7 | 67.2 | 8.1 | 24.3 |
| OP | 600 | 10 | 150 | 27.9 | 65.6 | 6.5 | 9.6 |
| OP | 600 | 10 | 300 | 29.1 | 57.5 | 13.4 | 12.0 |
| OP | 600 | 20 | 150 | 28.2 | 55.2 | 16.6 | 10.4 |
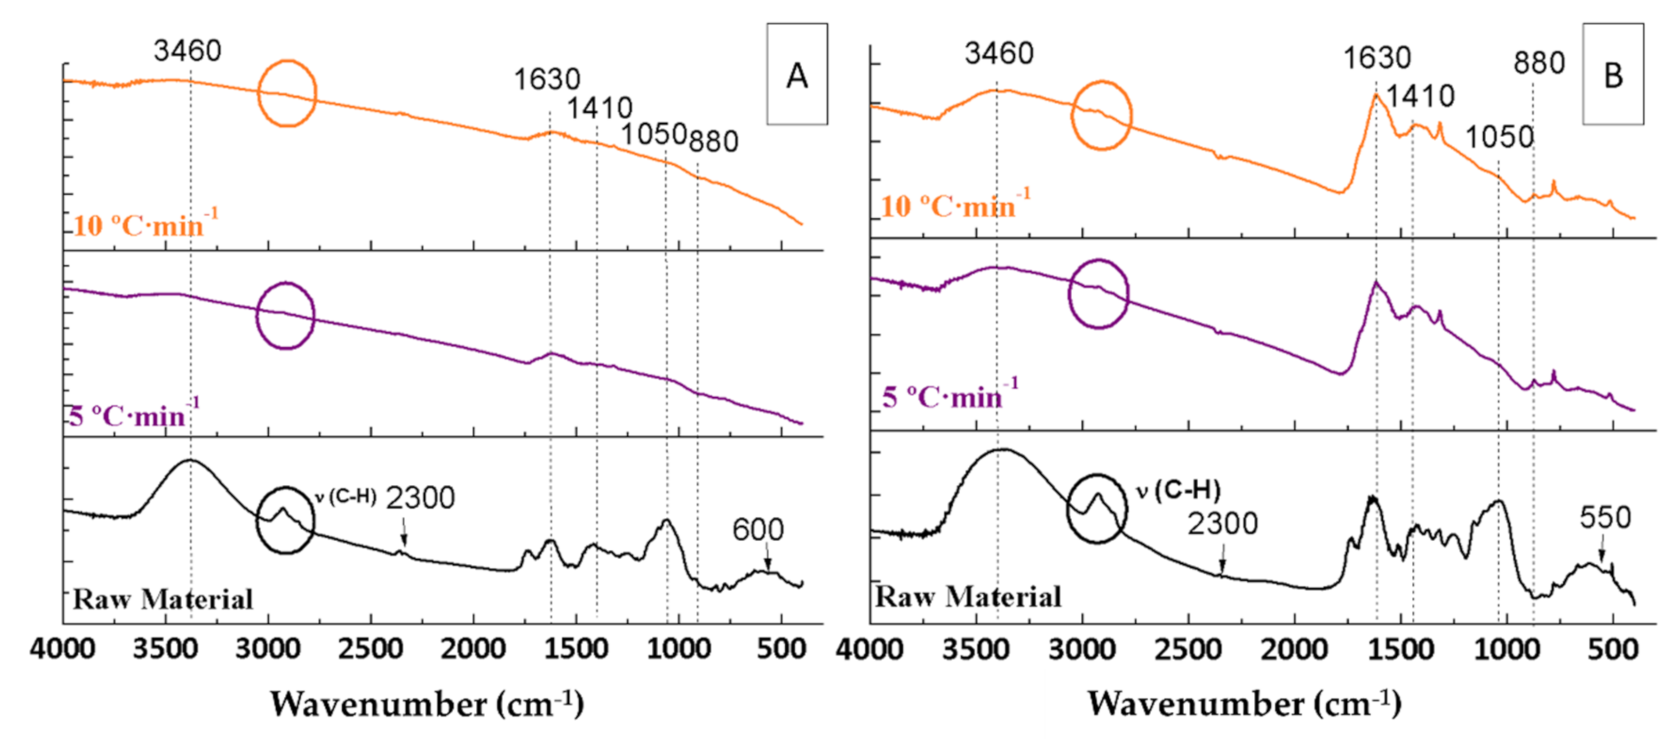
| Group | Vibration | Experimental (cm−1) | Literature (cm−1) | Reference |
|---|---|---|---|---|
| Carboxylic acid and water | ν (O-H) | 3600–3100, 1630 | 3600–3000, 1632 | [35] |
| Alkyl, aliphatic, and aromatic | ν (C-H) | 2925, 2860, 1400 | 2970–2860, 1402 | [35] |
| Ketone and carbonyl | ν (C=O) | 1730–1713, 1560 | 1730–1700, 1560–1510 | [35] |
| Carboxylic acid | ν (O-H) | 1410 | 1440–1400 | [42] |
| Ether | ν (C-O) | 1064–1000 | 1300–1000 | [42] |
| Aromatic hydrogens | ν (C-H) | 880–800 | 700–900 | [44] |
| Calcium | ν (Ca-O) | 550–600 | 550–600 | [43] |
| Compound | Pyrolysis Temperature (°C) | |
|---|---|---|
| 600 | 400 | |
| Area (%) | ||
| Propanoic acid | 2.97 | 3.84 |
| Toluene | 24.63 | 29.43 |
| 2,4-Dimethyl-2-oxazoline-4-methanol | 8.57 | 4.88 |
| Furfural | 2.98 | 8.09 |
| 2-Pentanone, 4-hydroxy-4-methyl- | 3.08 | 5.94 |
| 2-Furanmethanol | 3.17 | 2.70 |
| 2,5-Furandione, dihydro-3-methylene- | 1.63 | - |
| 2-Furancarboxaldehyde, 5-methyl- | 4.07 | 6.19 |
| Phenol | 3.00 | 2.41 |
| Maltol | 1.66 | 1.31 |
| Pyranone | 2.31 | 2.83 |
| 5-Hydroxymethylfurfural | 23.01 | 32.37 |
| 4-Hydroxy-3-methylbenzoic acid, methyl ester | 5.80 | - |
| 1-Methyl-8-propyl-3,6-diazahomoadamantan-9-ol | 2.53 | - |
| 9-Octadecenamide, (Z)- | 2.92 | - |
| Hexadecanoic acid, 2-hydroxy-ethyl ester | 5.18 | - |
| Octadecanoic acid, 2,3-dihydroxypropyl ester | 2.50 | - |
| Compound | Pyrolysis Temperature (°C) | |
|---|---|---|
| 600 | 400 | |
| Area (%) | ||
| Toluene | 2.15 | 2.6 |
| 3-Penten-2-one, 4-methyl- | 1.85 | - |
| 2-Pentanone, 4-hydroxy-4-methyl- | 94.73 | 92.62 |
| 2-Furanmethanol | - | 1.29 |
| Phenol, 2-methoxy- | - | 1.24 |
| Phenol, 2,6-dimethoxy- | 1.27 | 2.25 |
| Compound | Argon Flow Rate (mL·min−1) | ||
|---|---|---|---|
| 300 | 150 | 30 | |
| Area (%) | |||
| Propanoic acid | 2.97 | 2.97 | - |
| Pyrrolidine, 1-methyl- | - | - | 6.12 |
| Toluene | 28.47 | 24.63 | 29.43 |
| 2,4-Dimethyl-2-oxazoline-4-methanol | 6.70 | 8.57 | 5.23 |
| Pyridine, 3-methyl- | - | - | 6.29 |
| Furfural | 8.06 | 2.98 | - |
| 2-Pentanone, 4-hydroxy-4-methyl- | 6.70 | 3.08 | 9.55 |
| 2-Furanmethanol | 2.54 | 3.17 | 5.05 |
| 2,5-Furandione, dihydro-3-methylene- | - | 1.63 | 1.78 |
| 2-Furancarboxaldehyde, 5-methyl- | 5.34 | 4.07 | - |
| Phenol | 1.98 | 3.00 | 4.09 |
| 1,2-Cyclopentanedione, 3-methyl- | - | - | 1.85 |
| Maltol | - | 1.66 | 2.30 |
| Pyranone | 3.51 | 2.30 | 3.86 |
| 5-Hydroxymethylfurfural | 25.89 | 23.01 | 4.61 |
| Hydroquinone | - | - | 4.61 |
| 4-Hydroxy-3-methylbenzoic acid, methyl ester | - | 5.80 | 3.34 |
| 1-Methyl-8-propyl-3,6-diazahomoadamantan-9-ol | - | 2.53 | 2.89 |
| 9-Octadecenamide, (Z)- | - | 2.92 | - |
| Hexadecanoic acid, 2-hydroxy-ethyl ester | 6.27 | 5.18 | 7.33 |
| Octadecanoic acid, 2,3-dihydroxypropyl ester | 1.57 | 2.50 | 3.25 |
| Compound | Argon Flow Rate (mL·min−1) | ||
|---|---|---|---|
| 300 | 150 | 30 | |
| Area (%) | |||
| Pyrrolidine, 1-methyl- | 1.61 | - | 6.91 |
| Toluene | 2.72 | 2.15 | 31.42 |
| 2,4-Dimethyl-2-oxazoline-4-methanol | - | - | 5.90 |
| 3-Penten-2-one, 4-methyl- | - | 1.85 | - |
| Pyridine, 3-methyl- | - | - | 3.39 |
| 2-Pentanone, 4-hydroxy-4-methyl- | 89.03 | 94.73 | 10.77 |
| 2-Furanmethanol | 1.46 | - | 5.70 |
| 2,5-Furandione, dihydro-3-methylene- | - | - | 2.01 |
| Phenol | - | - | 4.62 |
| Phenol, 2-methoxy- | 1.89 | - | - |
| Maltol | - | - | 2.59 |
| Pyranone | - | - | 4.35 |
| 5-Hydroxymethylfurfural | - | - | 5.20 |
| Hydroquinone | - | - | 5.20 |
| Phenol, 2,6-dimethoxy- | 1.89 | - | - |
| Hexadecanoic acid, 2-hydroxy-ethyl ester | - | - | 8.27 |
| Octadecanoic acid, 2,3-dihydroxypropyl ester | - | - | 3.67 |
| Compound | Heating Ramp (°C·min−1) | |
|---|---|---|
| 10 | 5 | |
| Area (%) | ||
| Propanoic acid | 3.84 | 2.69 |
| Toluene | 29.43 | 14.85 |
| 2,4-Dimethyl-2-oxazoline-4-methanol | 4.88 | 1.37 |
| Furfural | 8.09 | 8.23 |
| 2-Pentanone, 4-hydroxy-4-methyl- | 5.94 | 13.02 |
| 2-Furanmethanol | 2.71 | 2.04 |
| 2-Furancarboxaldehyde, 5-methyl- | 6.19 | 6.49 |
| Phenol | 2.41 | 2.76 |
| Maltol | 1.31 | 2.37 |
| Pyranone | 2.83 | 9.02 |
| 5-Hydroxymethylfurfural | 32.37 | 37.16 |
| Compound | Heating Ramp (°C·min−1) | ||
|---|---|---|---|
| 20 | 10 | 5 | |
| Area (%) | |||
| Pyrrolidine, 1-methyl- | - | - | 1.82 |
| Propanoic acid | 1.68 | - | - |
| Toluene | 2.45 | 2.60 | 2.78 |
| 2-Pentanone, 4-hydroxy-4-methyl- | 60.44 | 92.62 | 89.9 |
| 2-Furanmethanol | 2.18 | 1.29 | 1.28 |
| Phenol | 3.63 | - | - |
| 1,2-Cyclopentanedione, 3-methyl- | 3.76 | - | - |
| Phenol, 2-methoxy- | 3.81 | 1.24 | 1.56 |
| Catechol | 5.76 | - | - |
| 1,2-Benzenediol, 3-methoxy- | 3.12 | - | - |
| Phenol, 2,6-dimethoxy- | 7.32 | 2.25 | 2.76 |
| Hexadecanoic acid, 2-hydroxy-ethyl ester | 2.27 | - | - |
| Octadecanoic acid, 2,3-dihydroxypropyl ester | 3.58 | - | - |
| T (°C) | Hramp (°C·min−1) | Ar Flow (mL·min−1) | SBET (m2·g−1) | Sulphur Removal (%) |
|---|---|---|---|---|
| 400 | 5 | 150 | ≤1 | 78.3 ± 0.01 |
| 400 | 10 | 150 | ≤1 | 77.4 ± 0.03 |
| 600 | 10 | 30 | ≤1 | 76.3 ± 0.01 |
| 600 | 10 | 150 | ≤1 | 75.5 ± 0.03 |
| 600 | 10 | 300 | ≤1 | 76.2 ± 0.02 |
| T (°C) | Hramp (°C·min−1) | Ar Flow (mL·min−1) | SBET (m2·g−1) | Sulphur Removal (%) |
|---|---|---|---|---|
| 400 | 5 | 150 | 2.82 | 76.5 ± 0.01 |
| 400 | 10 | 150 | 5.44 | 77.5 ± 0.03 |
| 600 | 10 | 30 | 24.28 | 66.4 ± 0.01 |
| 600 | 10 | 150 | 7.52 | 78.8 ± 0.01 |
| 600 | 10 | 300 | 12.01 | 72.0 ± 0.03 |
| 600 | 20 | 150 | 10.42 | 75.0 ± 0.04 |
Publisher’s Note: MDPI stays neutral with regard to jurisdictional claims in published maps and institutional affiliations. |
© 2022 by the authors. Licensee MDPI, Basel, Switzerland. This article is an open access article distributed under the terms and conditions of the Creative Commons Attribution (CC BY) license (https://creativecommons.org/licenses/by/4.0/).
Share and Cite
Sánchez-Borrego, F.-J.; García-Criado, N.; García-Martín, J.F.; Álvarez-Mateos, P. Determination of the Composition of Bio-Oils from the Pyrolysis of Orange Waste and Orange Pruning and Use of Biochars for the Removal of Sulphur from Waste Cooking Oils. Agronomy 2022, 12, 309. https://doi.org/10.3390/agronomy12020309
Sánchez-Borrego F-J, García-Criado N, García-Martín JF, Álvarez-Mateos P. Determination of the Composition of Bio-Oils from the Pyrolysis of Orange Waste and Orange Pruning and Use of Biochars for the Removal of Sulphur from Waste Cooking Oils. Agronomy. 2022; 12(2):309. https://doi.org/10.3390/agronomy12020309
Chicago/Turabian StyleSánchez-Borrego, Francisco-José, Noelia García-Criado, Juan F. García-Martín, and Paloma Álvarez-Mateos. 2022. "Determination of the Composition of Bio-Oils from the Pyrolysis of Orange Waste and Orange Pruning and Use of Biochars for the Removal of Sulphur from Waste Cooking Oils" Agronomy 12, no. 2: 309. https://doi.org/10.3390/agronomy12020309
APA StyleSánchez-Borrego, F.-J., García-Criado, N., García-Martín, J. F., & Álvarez-Mateos, P. (2022). Determination of the Composition of Bio-Oils from the Pyrolysis of Orange Waste and Orange Pruning and Use of Biochars for the Removal of Sulphur from Waste Cooking Oils. Agronomy, 12(2), 309. https://doi.org/10.3390/agronomy12020309