Article

Assessment of the Impact of Soil Contamination with Cadmium and Mercury on Leaf Nitrogen Content and Miscanthus Yield Applying Proximal Spectroscopy

1
Department of General Agronomy, Division of Agroecology, Faculty of Agriculture, University of Zagreb, 10000 Zagreb, Croatia
2
Department of Agricultural Engineering, Division of Agricultural Engineering and Technology, Faculty of Agriculture, University of Zagreb, 10000 Zagreb, Croatia
3
Graduate Study in Agroecology, Department of General Agronomy, Faculty of Agriculture, University of Zagreb, 10000 Zagreb, Croatia
*
Author to whom correspondence should be addressed.
Agronomy 2022, 12(2), 255; https://doi.org/10.3390/agronomy12020255
Submission received: 30 December 2021 / Revised: 13 January 2022 / Accepted: 18 January 2022 / Published: 20 January 2022

Abstract

:
The research objective was to use proximal spectroscopy in visible and near infrared (VNIR) spectra to determine the total leaf nitrogen (TN) content and the above-ground biomass of Miscanthus × giganteus (MxG) grown in the open-roof greenhouse experiment on soil contaminated with cadmium and mercury (100 mg Cd/kg soil; 20 mg Hg/kg soil), in dependence of different soil amendments in four treatments (I-soil without amendment; II-sludge; III-mycorrhizae; IV-MxG ash). Leaf reflectance was acquired using a field spectroradiometer (350–1050 nm) at the end of the vegetation period between 2018 and 2019 (n = 24). TN content was determined using the dry combustion method, while biomass was weighted immediately after the harvest. In terms of the treatment effect, sludge showed the greatest contribution in TN content. Regarding the biomass quantity, MxG ash revealed the best results as soil amendment. Applying the partial least squares regression, complete correlation and low root mean squared error (RMSE) were obtained between predicted and measured values for the validation dataset of TN content (R2 = 0.87, RMSE = 0.139%), while a strong correlation was calculated for biomass (R2 = 0.53, RMSE = 0.833 t/ha). As an additional tool with analytical methods, proximal spectroscopy is suitable to integrate the optical and physiological properties of MxG, and to assess nutrient stress in crop grown on contaminated soils.

1. Introduction

Many soils are known to be contaminated with heavy metals due to industrialization [1]. It is not possible to grow food crops on such soils, but this is not the case with energy crops produced for biomass, and one of the more favorable crops for this purpose is miscanthus (Miscanthus × giganteus—MxG), a perennial plant adaptable to different climatic and pedological conditions, resistant to diseases and pests, and low fertilization requirements [2,3]. MxG belongs to the group of excluders [4,5,6], or plant species whose concentration of heavy metals in the aboveground parts manifests below critical values. Zgorelec et al. [6] consider MxG as one of the most researched bioenergetic plants for remediation due to its morphological and physiological characteristics, and emphasize its potential for phytoremediation. The same authors state that MxG is a good candidate for the phytostabilization of Hg and Cd due to low metal accumulation in the above-ground biomass, which could be beneficial for production on soils moderately contaminated with Cd and Hg.
When exposing a plant to higher concentrations of heavy metals, Krämer et al. [7] list adverse effects such as transpiration disorder, oxidative and nutritional stress, photosynthesis inhibition, and carbohydrate metabolism disorder. The negative effect of cadmium is manifested in the form of reduced nitrate absorption and transported from roots to shoots [8]. The intake of cadmium in the plant is influenced by the content of soil organic matter and the pH value of the soil [9]. In an acid soil reaction, the plant absorbs cadmium more easily. Fernando and Oliveira [4] state that with increasing cadmium concentration in the soil, there is an increase in cadmium accumulation in miscanthus shoots and a decrease in the plant height and dry mass of shoots affecting nitrogen uptake from the soil. Excess cadmium can also cause chlorosis, which is a major symptom of cadmium toxicity along with developmental delay [1,10,11]. As for the influence of mercury in the soil-plant chain, it binds very easily to organic matter [12]. Toxic levels of Hg2+ can cause visible plant damage and various physiological disorders [13,14]. The most common symptoms of mercury contamination are inhibition of photosynthesis and potassium intake, retardation of seedling and root growth, yield reduction, impairment of plant transport systems and water uptake, and leaf chlorosis [15,16,17].
For this reason, plants have developed various mechanisms to control the entry and transport of metals within their organs. Thus, various protein molecules have been created to control the transport of metals, perform detoxification, establish tolerance to metals (chelators), and influence the trade and delivery of metal ions [18,19]. According to Zgorelec et al. [6], perennial plants with high above-ground biomass yield potential are suitable for cultivation on contaminated soils, during which various soil amendments can be used such as mycorrhiza, waste sludge, and ash. These amendments are used to increase biomass yield, but also have other functions such as increasing soil organic matter, plant absorption potential, and metal immobilization in soil [6]. Due to its composition, waste sludge, as well as ash, raises soil pH [20,21], immobilizing heavy metals in the soil and reducing their availability, while mycorrhiza transforms heavy metals. Waste sludge is considered a very good improver due to the content of micro and macronutrients, and especially due to the ability to improve soil structure, aerate the soil, and retain moisture in the soil [20]. The same authors state that the organic matter of sludge decomposes in the soil into inorganic components that are very easily incorporated into humus and clay particles, becoming readily available to plants. Moreover, biosolids generally improve microbial community composition and enzyme activities, indicating improved soil health [22]. Ash, as a by-product of industry, is considered a soil conditioner that aerates the soil, neutralizes soil acidity, and improves the structure of heavy clay soils. In addition, its composition (potassium and phosphorus) helps to increase crop yields. Biochar can ameliorate soil pollution of a variety of pollutants. It reduces the availability of toxic metals and organic pollutants, reduces soil N losses, increases crop yields or biomass productivity as a fertilizer, and contributes to the remediation of contaminated soils [21,23]. Mycorrhiza is a mutually beneficial relationship between the roots of plants and the mycelium of mycorrhizal fungi in which the fungus facilitates the plant’s uptake of water and nutrients, and the plant provides the mycorrhizal fungus with nutrients produced by photosynthesis [24]. As stated by Ali et al. [25], fungal endophytes produce beneficial secondary metabolites that strengthen the defense systems of crops and alleviate various environmental stresses, such as toxicity caused by heavy metals.
The development of diagnostic tools based on remote sensing methods can be useful for the improvement of crop yields and the systematic supply of energy crops biomass [26]. In the context of precision agriculture, proximal and aerial remote sensing can be applied as a non-destructive method for monitoring the quality and quantity of miscanthus in terms of the assessment of nitrogen status in above-ground crop biomass and yield forecast during the growing season [27]. Plant tissue has a unique spectral imprint that changes under the influence of phenological changes and environmental factors [28,29]. The optical properties of leaves in the 350–1050 nm range contain information about the concentrations of plant pigments and the leaf cellular structure [30], and, thus, about the nitrogen content in the leaf. Within this range, there are wavelengths of 450 nm and 670 nm whose energy is strongly absorbed by chlorophyll. The green part of the spectrum (530–590) and the red edge (about 700 nm) are the most sensitive to changes in chlorophyll content [31], and in the NIR region of the spectrum (700–1300 nm), reflectance and transmittance are generally high. NIR methods have been shown to be very suitable due to their rapid determination of biomass composition, including leaf water content, dry matter, and protein content [32,33]. By measuring the reflection of plant tissue in the visible and near-infrared (VNIR) regions of the electromagnetic spectrum, it is possible to determine physiological and biochemical processes in the cell, such as the decrease of green quantity and photosynthesis or the decline of nutrient absorption and transportation in a crop grown on soils contaminated with heavy metals, even before the appearance changes [29].
Using chemometric methods, it is possible to integrate the optical and physiological properties of the plant tissue of MxG in the assessment of nitrogen content and composition [34]. The results of these methods vary depending on the scale of the survey, the complexity of the calibration model, the spectral regions of the survey, and the type of vegetation [31]. Thanks to the development of hyperspectral sensors, information on the state of plants can be evaluated from the reflection of a large number of wavelengths, up to 700 wavelengths in the case of this study (350–1050 nm). Various empirical approaches and multivariate statistical methods have been developed to obtain agronomic data based on hyperspectral data, such as simple linear regression (SLR), principal component analysis (PCA), partial least squares regression (PLSR), multiple linear regression (MLR), and artificial neural network (ANN) [35]. Feng et al. [36] used PLSR and least-squares support vector machine to estimate Cd concentrations in Mischantus sacchariflorus from VNIR spectral reflectance and determined a complete correlation for the prediction set (R2 = 0.91). Classification methods (ANN, PCA, discriminant analysis) were also used to distinguish Mischantus species based on VNIR spectroscopy [37].
The research objective was to use proximal VNIR spectroscopy to determine leaf N content and the above-ground biomass yield of Miscanthus grown in the open-roof greenhouse experiment on soil contaminated with cadmium and mercury in dependence of different soil amendments. The specific goals were (a) to determine the influence of soil contamination with cadmium and mercury on TN content in MxG leaf, above-ground biomass yield and leaf reflection; (b) to discriminate between experiment treatments based on hyperspectral leaf reflection; and (c) to develop a calibration model to estimate leaf TN content and the yield of aboveground MxG biomass based on leaf reflection using a linear algorithm.

2. Materials and Methods

2.1. Experimental Design

The experiment was set up in an open-roof greenhouse on 5 August 2018, and took place in two vegetation years: 2018/2019 and 2019/2020. Soil moisture was kept at the level of the field water capacity. Climatic conditions for the three years of the study period (2018, 2019, and 2020) included annual precipitation (853.6 mm, 1000.5 mm, and 950.4 mm, respectively) and mean annual air temperature (13 °C, 13 °C, and 12.6 °C, respectively) (data from the Croatian Meteorological and Hydrological Service—station Maksimir, Zagreb, Croatia).
Miscanthus × giganteus seedlings were planted in plastic pots (experimental pots—EP) with a size of ϕ 27 cm and a soil substrate weight of 18 kg according to a completely randomized design in four treatments and three replicates (Table 1). The basic part of each treatment was highly contaminated soil with cadmium and mercury (L2). Different soil amendments were used in varying proportions (I-soil without amendment; II-sludge; III-mycorrhizae; IV-MxG ash) (description in Section 2.3). A small amount of homogenized soil contaminated with cadmium and mercury was added to the clean soil and everything was homogenized and mixed. Soil in each EP contained 100 mg Cd/kg soil and 20 mg Hg/kg soil in the form of CdO(s) with 99% purity and HgCl2(s) with 99.5% purity, respectively.

2.2. Soil Properties

The pure soil from agricultural experimental field used as a substrate in EP was characterized as silty-loam texture (sieving and sedimentation method were used [38]) (Table 2). According to the results of soil chemical analysis, the soil used was slightly acidic (1 M KCl in 1:2.5 (m/v) [39]) and rich in humus (wet combustion method with sulfochromic oxidation [40]). The soil was rich in total nitrogen (classification according to Woltmann) (dry combustion (Dumas) method [41]). The elements C, N, and S were analyzed by dry combustion method on the Vario Macro CHNS analyzer (Elementar, Langenselbold, Germany, 2006). The supply of plant available phosphorous and potassium to the soil was very low (classification according to Baumgarten) (AL method; extraction with ammonium lactate acetic acid at a ratio of 1:20 (m/v) [42]). The CEC value was 18.9 cmol(+) kg−1 (barium chloride method in the ratio of 1:40 (m/v) [43]).

2.3. Soil Amendments

Waste sludge from the Agroproteinka biogas plant fermenter was used as the second treatment. The sludge was analyzed as bacteriologically correct. It was in the form of a liquid with 97% natural humidity. Three hundred and forty grams of sludge per EP was used, i.e., 1020 g in 3 pots, which corresponds to the prescribed amount of 1.66 t/ha according to the regulation on sludge management from wastewater treatment plants when sludge is used in agriculture [44]. Mycorrhizal inoculum (live mycorrhizal mycelium—MYKOFLOR®, Konskowola, Poland and AgroHydroGel®—AGROIDEA, Krakow, Poland) was used as the third treatment. Mycorrhiza is in the form of a water solution as a gel. It can be introduced directly into the soil and is immediately able to form a symbiosis with the plant root. Agrohydrogel is biodegradable and retains its properties in the soil for 5 years. One kg of agrogel can store up to 300 L of water, of which 95% can leave to the plant. In the experiment, 5 mL of mycorrhiza on an EP or plant was used, and 15 mL of mycorrhiza on 3 plants, respectively. The fourth treatment used was bottom ash, derived from direct combustion of MxG biomass. The goal was to achieve a soil to ash ratio of 75:25. Therefore, 13.5 kg of soil and 4.5 kg of MxG ash were used for a total amount of 18 kg of substrate per EP.

2.4. Biomass Sampling and Analysis

The first above-ground biomass harvest took place on 15 March 2019, while the second was carried out on 12 March 2020. Stem and leaves biomass was weighted directly after the harvest and expressed as t/ha. The water content in plant tissue was determined on a mass basis (gravimetric method [45]). Total leaf N [41], C [46], and S [47] content (%) were analyzed by dry combustion method on Vario Macro CHNS analyzer (Elementar, Langenselbold, Germany, 2006).

2.5. VNIR Spectroscopy

Spectral data were obtained by a non-destructive measurement of electromagnetic radiation reflection from the surface of Miscanthus leaves, while the following agronomic variables were used to develop the calibration model: total nitrogen content in the leaf (TN%) and aboveground biomass yield. On the same samples of plant material, standard laboratory analyzes of the total N content in the leaf dry matter were performed, and immediately after harvest, the yield of above-ground biomass was determined. Proximal in situ reflectance measurements were acquired at the end of vegetation period on 6 November 2018 and 25 October 2019 (n = 24). For non-destructive measurements of leaf hyperspectral reflection in an open greenhouse, a portable spectroradiometer FieldSpec® 3 (ASD Inc., Boulder, CO, USA, 2007) was used, which simultaneously records data for 700 wavelengths within a range of 350–1050 nm, a spectral resolution of 3 nm, and sampling interval 1.4 nm. Reflectance measurements were performed on leaves from each EP, i.e., from all treatments, representing a sub-sample of each individual EP—3 spots per plant leaf. The reflectance spectra for a single sample was the average of ten consecutive measurements. The resulting spectral signal noise was reduced by averaging the spectrum over a given wavelength range. White reference (Spectralon®, 98.2% average reflection, NIST, Labsphere, North Sutton, NH, USA) measurements were taken before initial leaf readings and repeated approximately every 15 min. Samples were scanned using hand-held fiber-optic probe and artificial light according to cloudy weather conditions. The spectral reflection of the sample is expressed as a reflection factor.

2.6. Statistical Analysis

A two-way ANOVA was applied to test the effects of treatment, vegetation year, and treatment × vegetation year interaction, based on Miscanthus leaf TN content and aboveground biomass. If significant differences were observed at a p < 0.05, a Fisher LSD post hoc test was applied (Statistica 12, [48]). For qualitative analysis of leaf reflection, spectral data were processed using ViewSpec Pro 6.2.0. software [49]. The pre-processing method included normalizing to minimize the variations due to illumination intensity changes and distance between the leaf and fiber optic probe. Reflectance spectra were transformed to first derivative using Savitzky-Golay filter (2nd-order polynomial; number of smoothing points: 3). The first derivative was used to reduce the effects of the multiple scattering of radiation due to sample geometry and surface roughness, and to calculate the rate of change of reflectance with wavelength. The data were centered and normalized to a unit standard deviation.
The spectral data of 24 samples of miscanthus leaves were calibrated for leaf TN content and biomass yield, using partial least squares regression (PLSR) with full cross-validation, with each observation serving as a test set to confirm the predictive model (Unscrambler 9.7, [50]). The prediction models were validated to estimate accuracy and predictive power based on the coefficient of determination (R2) and root mean square error (RMSE) (95% confidence limits).

3. Results and Discussion

3.1. Variations of Crop Variables

Table 3 shows mean values, standard deviation (STD), and relative standard deviation (RSD) for the proportions of nitrogen, carbon, sulfur, and moisture in the aboveground biomass of Miscanthus. A high RSD (102.13% and 95.65%) was obtained for samples where values differed greatly within replicate, e.g., in 2018 the moisture for sample II-3 was 7.7%, and in sample II-1 it was 14.8%. According to the data presented, greater variability in plant variables was recorded in the first vegetation year in the II-sludge treatment compared to the other treatments indicating differential feedback of young crop to nutrient rich waste sludge under stressed soil conditions. In 2019, data on crop N, S, and moisture content were more scattered in treatment I (contaminated soil without amendment), likely due more pronounced stress from heavy metals in the soil during the second growing year.
Table 4 shows the analysis of variance for leaf TN content and amount of aboveground biomass for two vegetation years. A statistically significant effect of treatment on TN content in Miscanthus leaf was found at the level of p < 0.01 within two vegetation seasons. The difference between years was also statistically significant at the level of p < 0.001. The interaction of treatment × year showed no statistical significance. In the case of biomass, a statistically significant difference between vegetation years was found at the level of p < 0.01. The treatment × year interaction, as well as the difference in treatments was not statistically significant.
Figure 1 shows N content in above-ground biomass as a function of treatment for two vegetation years with post-hoc test results. It can be seen that higher nitrogen content was found in plants at all treatments in 2019 compared to the year before (TN: 0.5–0.7% and 1.1–1.5%, respectively). The difference is between the treatment with sludge and the other three treatments: soil without amendment, mycorrhiza, and MxG ash, statistically different in 2019. The last three treatments are not statistically different. The most efficient treatment in both years was II-sludge (sludge: high pH-8.5 and N-0.7%), as it increased TN content in the MxG leaf compared to other treatments. Waste sludge proved to be a more significant treatment than others due to the very good chemical composition of macronutrients: calcium (384 mg/kg), phosphorus (80.0 mg/100 g), potassium (65.83 mg/100 g), nitrogen (0.72%), and high pH = 8.5. Since calcium in soil increases pH [51], and metals are weakly mobile in neutral to alkaline soil pH, the MxG treated with sludge was under less influence of heavy metals due to their reduced availability in increasing pH environment. Therefore, it made the best progress. According to Alasmary et al. [22], organic P amendment (biosolids) increased Miscanthus biomass yield and made Pb less bioaccessible even with continual P removal through crop growth. MxG ash proved to be the least effective treatment in terms of the amount of TN taken up in the leaf. Since ash contains very small amounts of nitrogen (about 0.09%) [52], it is not surprising that it is not very efficient in nitrogen uptake and its content in the leaf. Soil without amendment as one of the treatments showed better effect on TN in the Miscanthus leaf compared to MxG ash. Mycorrhiza proved to be a very good amendment in the first year of cultivation when it proved to be a treatment that significantly supported the nitrogen storage of the plant. The positive effect of mycorrhiza is not surprising, given that mycorrhiza has been proved to increase the concentration of phosphorus and potassium (macronutrients) in leaves, reduce Cd mobility, and have a positive effect on physiological status and biomass [25,53]. Miscanthus is known to have high nitrogen utilization efficiencies compared to other crops [54,55,56]. However, the higher nitrogen content in the leaf can also be attributed to the crop age factor, because the seedling is certainly not able to provide the same amount of biomass and thus nitrogen as the one-year-old plant which has already developed and adapted to the conditions. Miscanthus can be grown on areas contaminated with Cd and Hg, but only for the purpose of soil remediation, because in the long term, biomass cultivation is not economically feasible due to reduced productivity under the influence of heavy metals [4]. Soil contamination with heavy metals can limit the translocation process of nutrients to the rhizomes of miscanthus before harvest, and may compromise the resprout of shoots in the following vegetation period [57].
Regarding MxG biomass, the difference in biomass yield between vegetation years is clearly visible, which was significant according to the overall ANOVA (Figure 1, Table 4). As expected, given the morphological system of growth and development of MxG, higher yields were achieved in the second year regardless of the treatment applied. The largest increase in above-ground biomass within two years was recorded in the treatment of III-mycorrhiza. The amount of biomass in the second vegetation year for the three treatments (II-sludge, III-mycorrhiza, IV-MxG ash) was similar and amounted to 5.36–5.45 t/ha. In the first vegetation year, the treatment IV-MxG ash proved to be the most effective for MxG biomass, followed by II-sludge and I-soil without amendment, while the treatment of III-mycorrhiza proved to be the least effective. Regarding the mycorrhiza treatment, the probable reason for difference in biomass was a time needed for mycorrhizal fungi to develop and release substances that immobilize heavy metals and to stimulate their phytostabilization. We assume that the growth of Miscanthus and uptake of macro and micronutrients were inhibited by Cd and Hg in the soil during the first vegetation year. In the second year, metal toxicity in the crop was decreased by chelation in the fungal hyphae, as explained by Dhalaria et al. [58]. Moreover, as reported by Bano and Ashfaq [59], the mycelial development of certain mycorrhizal associations could be adversely affected by the presence of heavy metals in the soil. In the second vegetation year, biomass yield was very similar for treatments II-sludge, III-mycorrhiza, and IV-MxG ash, while I-soil without amendment stood out as a treatment that was less effective compared to the others. It is important to emphasize that the IV-MxG ash treatment showed the least difference between the two vegetation years. However, in both years, the Miscanthus treated with this soil amendment showed the highest yield. The reason for this could be the previously mentioned composition of the ash. According to Petrlić [21], wood ash acts by reducing the crop uptake of cadmium. It can be assumed that MxG ash has the same effect—it reduces Cd absorption by plant due to increase of soil pH above 7. Ash is a stable product used as fertilizer and/or soil amendment [60] due to its good composition of macronutrients and the ability to increase soil pH value above 7 [52]. The same author states an increase in physiologically available phosphorus and potassium in the soil under the influence of ash. Therefore, the nutrient content of the plant is higher, and so is the biomass. In the context of the research presented in this paper, it is very important to emphasize that in all EP Miscanthus was grown in Cd and Hg contaminated soil. Therefore, the reduced productivity is not surprising [57].

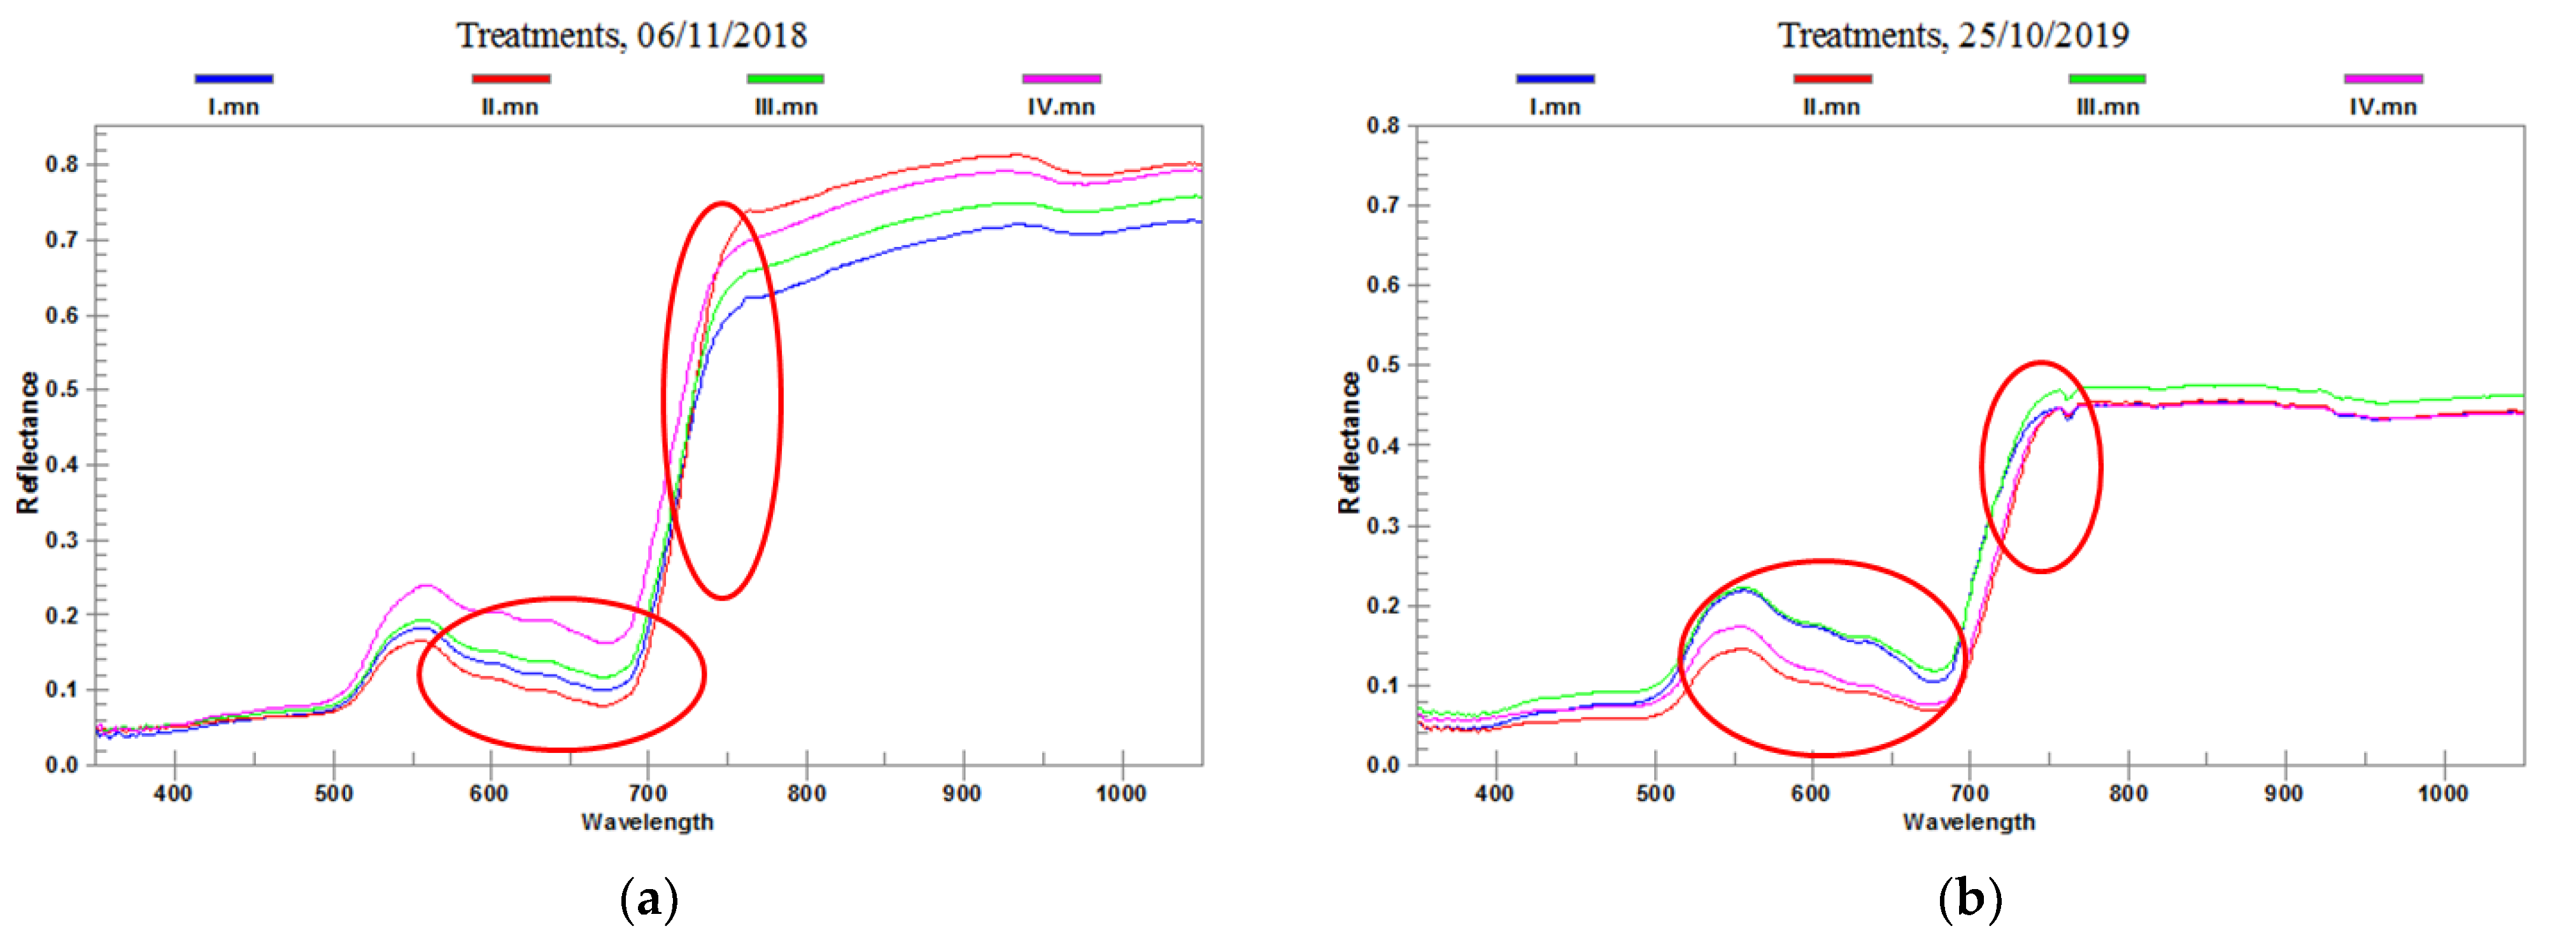
3.2. Qualitative Evaluation of Leaf Spectra

Leaf reflectance in 2018 was higher compared to the reflectance in 2019 (Figure 2). The reason for this is the earlier physiological stress, i.e., the onset of the phase of ripening and leaves senescence, which can be attributed to the higher concentration of introduced metals in the second vegetation year (less Chl in leaves). Leaf senescence, i.e., physiological stress, which results in a lower amount of chlorophyll in the leaf, is mostly evident in the measured leaf reflectance in 2018 in the IV-MxG ash treatment, while in 2019 it is evident in Miscanthus under the treatment I-soil without amendment, followed by III-mycorrhizae. Treatment II-sludge showed the best impact on MxG due to the highest absorption in red region indicating more Chl in plant tissue. The largest spectral differences between the treatments were from green to red in the visible part of the spectrum (550–700 nm) and in the red edge area (700–750 nm) in both vegetation years, which represents a strong increase in red reflection, red edge shift to shorter wavelengths, and decreased NIR reflection in plants under stress (lower TN content and leaf senescence). Proximal sensing revealed a change in the spectral pattern of the leaf, which indicated a state of stress, in this case due to the presence of heavy metals, cadmium, and mercury in the soil.

3.3. Multivariate Analysis—PLSR

Figure 3 shows the results of the PLSR model predicting leaf TN content for the cumulative period of 2018 and 2019 (n = 24). The first derivative of reflectance was used for the model to obtain a more accurate representation of the data, resulting in higher R2 values compared to the original raw data. That is, the derivatives reduced the influence of radiation scattering due to the geometry and surface roughness of the sample, and their use resulted in the clear positions of the absorption features in the recorded spectrum. The score plot provided information about the patterns in the samples (a). The first two components summarized the largest variation in the spectral data (PC1: 69% and PC2: 9%). The upper right graph (b) shows the importance of specific wavelengths, i.e., wavelength ranges for the prediction of TN content. The scale on the x-axis shows wavelengths ranging from 350 to 1050 nm, while the scale on the y-axis represents the regression coefficient (with B0 = 1.158). The higher the regression coefficient, the greater the importance of the corresponding part of the spectrum for the prediction of TN content. Dark blue indicates statistically significant wavelengths, while light blue represents wavelengths that are not statistically significant. There are statistically significant wavelengths in the wavelength range of the visible part of the spectrum (570–610 nm) and (640–670 nm) in the red edge range (700–730 nm). Negative statistically significant correlations are found in the visible part of the spectrum (500–540 nm), in the red edge region at 760 nm, and in the near-infrared region at 810 nm. According to Haboudane et al. [61], light reflected from vegetation in the VIS region of the spectrum (350–750 nm) is predominantly influenced by chlorophyll pigments in leaf tissue. Also, Moron et al. [62] consider VNIR reflectance spectroscopy to be a suitable method for assessing the nitrogen status of wheat. For this reason, it is possible to use such prediction models to determine TN content in the Miscanthus leaf, which also leads to earlier detection of crop stress. In the lower right graph (d), a comparison of predicted and measured values for TN content in Miscanthus leaf is shown. Prediction plot indicates grouping of data for treatments I-soil without amendment, III-mycorrhiza, IV-MxG ash, and the deviation from that grouping for treatment II-sludge. This is supported by the fact that the mean values of this treatment are significantly higher than the values of other treatments. According to the calculated R2 values for calibration and validation, which were very high (R2 = 0.97 and 0.87, respectively) and very low RMSE = 0.06 and 0.14 for the TN content, respectively, it can be concluded that the model is very good and useful for quality control, quantification or screening of samples, and can be used in crop condition monitoring. The PLSR method demonstrated a very strong to complete correlation and a very low root mean square error between predicted and measured values. According to research of Ferrio et al. [63], Atzberger et al. [64], and Šestak et al. [35] for winter wheat and the results for Miscanthus obtained in this paper, the PLSR calibration model successfully estimates the nitrogen content by integrating physiological characteristics from the reflection of a large number of wavelengths. Allison et al. [65] demonstrated in energy crops that cross-validated PLSR models can predict the nitrogen content in a test data set with high accuracy (R2 = 0.93; RMSE = 0.09).
The PLSR model for predicting the yield of above-ground biomass of Miscanthus for 2018 and 2019 is presented on Figure 4. PC1 captured 96% and PC2 3% of the variability in leaf reflectance, while the dependent variable y (biomass yield) was not well explained by the first two PCs (only 22% for PC1 and 13% for PC2) (a). Residual validation variance expressed how much variation in the biomass data remains to be explained once the current spectral PCs have been taken into account (c). Statistically significant wavelengths that showed a correlation for yield are found in the visible part of the spectrum at 520–550 nm and 630–670 nm, in the red edge at 720 nm, and in the near infrared part of the spectrum at 810–840 nm (b). A negative significant correlation is found in the visible part of the spectrum in the range of 460–500 nm and 570–610 nm, in the red edge of 690–710 nm and 750–770 nm, and in the near infrared range of 1030–1050 nm. The degree of change in the biomass variable for each 1-unit change in reflectance was expressed as B0 = 5.94, indicating unsatisfactory prediction. The scattering of the prediction results indicates deviations from the calibration (d). Similar results were recorded by Jin et al. [33] for water content in leaves of 624 Miscanthus samples, with a correlation of 0.91. In comparison, Jensen et al. [66] reported the high correlations between measured and predicted validation and calibration values when estimating winter wheat yield (r = 0.97). The RMSE value for the validation data set of the cumulative research period was 0.83 t/ha and R2 was 0.52. Ahamed et al. [67] reported that 64.4% of the variability in Miscanthus biomass yield was explained by NDVI data, indicating high predictive potential based on real-time remote sensing data and field data. Given the relatively high value of RMSE with a strong correlation, it can be concluded that aboveground biomass cannot be predicted accurately enough, because in this case the predicted values deviate from the reference due to a too small sample set for biomass estimation. The reason for this is a small surface area tested (EP) and the close proximal measurement. Appropriate vegetation indices (VIs) related to leaf area index and biomass would probably reveal better accuracy. According to Kubiak et al. [26], the main advantages of proximal remote sensing are high spectral and spatial resolution of the data and accuracy, no atmospheric effects, real-time assessment of the acquired data, precise selection, and measurement of the sample position. However, this approach would be problematic for large areas, because the cost of covering a larger area is high, the acquisition takes a long time, and provides only point-to-point information. However, there is a perspective of this method as a reference in a larger study area using aerial imagery from which VIs are generated, especially NDVI which correlates well with biomass.

4. Conclusions

This paper investigated the influence of heavy metals in soil contaminated with cadmium and mercury, in combination with various soil amendments on nitrogen content in miscanthus leaf and above-ground biomass using VNIR spectroscopy. Changes in leaf reflectance indicate physiological stress caused by the presence of heavy metals in soil. Leaf reflectance in 2018 was higher compared to the reflectance in 2019. The reason for this is the earlier physiological stress, i.e., the beginning of the phase of ripening and leaves senescence, which can be attributed to the higher concentration of introduced metals in the second vegetation year (less Chl in the leaves). The largest spectral differences between treatments were from green to red in the visible part of the spectrum (550–700 nm) and in the red edge area (700–750 nm) in both vegetation years, which represents a strong increase in red reflectance, red edge shift to shorter wavelengths, and decreased NIR reflectance in stressed plants. ANOVA revealed significant differences in TN and biomass between two vegetation years, and in leaf TN (%) depending on treatment. In the case of TN, the most efficient treatment was II-sludge, while IV-MxG ash proved to be the least effective treatment. MxG ash revealed best results as soil amendment for increasing biomass quantity. According to the PLSR results, proximal VNIR spectroscopy is found to be an applicable tool to integrate the optical and physiological properties of MxG plant tissue, and to assess nutrient stress in crop grown on contaminated soils, which has effect on leaf pigments concentration, leaf cell structure and, thus, directly on N content. As for the remote estimation of biomass quantity, measurements should be implemented at least at the field spatial scale.

Author Contributions

Conceptualization, Ž.Z., N.B., I.Š. and I.F.; methodology, Ž.Z., N.B. and I.Š.; software, I.Š.; validation, I.Š., A.P., Ž.Z. and N.B.; formal analysis, A.P. and I.H.; investigation, I.Š. and I.F.; resources, Ž.Z., N.B. and I.Š.; writing—original draft preparation, I.Š.; writing—review and editing, I.Š., Ž.Z., N.B., A.P. and I.H.; visualization, I.Š. and I.F.; supervision, I.Š., Ž.Z. and N.B.; project administration, Ž.Z. and N.B.; funding acquisition, Ž.Z. and N.B. All authors have read and agreed to the published version of the manuscript.

Funding

This research received no external funding.

Acknowledgments

The publication was supported by the Open Access Publication Fund of the University of Zagreb Faculty of Agriculture.

Conflicts of Interest

The authors declare no conflict of interest. The funders had no role in the design of the study; in the collection, analyses, or interpretation of data; in the writing of the manuscript, or in the decision to publish the results.

References

  1. Adriano, D.C. Trace Elements in Terrestrial Environments: Biogeochemistry, Bioavailability and Risks of Metals, 2nd ed.; Springer: New York, NY, USA, 2001. [Google Scholar]
  2. Jones, M.B.; Walsh, M. Miscanthus for Energy and Fibre, 1st ed.; Routledge: London, UK, 2000. [Google Scholar]
  3. Bilandžija, N. Perspektiva i potencijal korištena kulture Miscanthus × giganteus u Republici Hrvatskoj. Inženjerstvo Okoliša 2014, 1, 81–87. [Google Scholar]
  4. Fernando, A.; Oliveira, J.S. Effects on growth, productivity and biomass quality of Miscanthus × giganteus of soils contaminated with heavy metals. In Proceedings of the 2nd World Conference on Biomass for Energy, Industry and Climate Protection, Rome, Italy, 10–14 May 2004. [Google Scholar]
  5. Pavel, P.B.; Puschenreiter, M.; Wenzel, W.W.; Diacu, E.; Barbu, C.H. Aided phytostabilization using Miscanthus sinensis × giganteus on heavy metal-contaminated soils. Sci. Total. Environ. 2014, 479, 125–131. [Google Scholar] [CrossRef] [PubMed]
  6. Zgorelec, Ž.; Bilandžija, N.; Knez, K.; Galić, M.; Žužul, S. Cadmium and Mercury phytostabilization from soil using Miscanthus × giganteus. Sci. Rep. 2020, 10, 6685. [Google Scholar] [CrossRef] [Green Version]
  7. Krämer, U.; Clemens, S. Molecular biology of metal homeostasis and detoxification. In Topics in Current Genetics, 1st ed.; Tamäs, M., Martinoia, E., Eds.; Springer: Berlin/Heidelberg, Germany, 2006; Volume 14, pp. 216–271. [Google Scholar]
  8. Hernandez, L.E.; Carpena-Ruiz, R.; Garate, A. Alterations in the mineral nutrition of pea seedlings exposed to cadmium. J. Plant Nutr. 1996, 19, 1581–1598. [Google Scholar] [CrossRef]
  9. Kirkham, M.B. Cadmium in plants on polluted soils: Effects of soil factors, hyperaccumulation, and amendments. Geoderma 2006, 137, 19–32. [Google Scholar] [CrossRef]
  10. Arduini, I.; Masoni, A.; Mariotti, M.; Ercoli, L. Low cadmium application increase miscanthus growth and cadmium translocation. Environ. Exp. Bot. 2004, 52, 89–100. [Google Scholar] [CrossRef]
  11. Guo, H.; Hong, C.; Chen, X.; Xu, Y.; Liu, Y.; Jiang, D.; Zheng, B. Different growth and physiological responses to cadmium of the three Miscanthus species. PLoS ONE 2016, 11, e0153475. [Google Scholar] [CrossRef] [Green Version]
  12. Krömer, E.; Friedrich, G.; Wallner, P. Mercury and mercury compounds in surface air, soil gases, soils and rocks. J. Geochem. Explor. 1981, 15, 51–62. [Google Scholar] [CrossRef]
  13. Zhou, Z.S.; Guang, S.Q.; Guo, K.; Metha, S.K.; Zhang, P.C.; Yang, Z.M. Metabolic adaptations to mercury-induced oxidative stress in roots of Medicago sativa L. J. Inorg. Biochem. 2007, 101, 1–9. [Google Scholar] [CrossRef]
  14. Nagajyoti, P.C.; Lee, K.D.; Sreekanth, T.V.M. Heavy metals, occurrence and toxicity for plants: A review. Environ. Chem Lett. 2010, 8, 199–216. [Google Scholar] [CrossRef]
  15. Beauford, W.; Barber, J.; Barringer, A.R. Uptake and Distribution of Mercury within Higher Plants. Physiol. Plant 1977, 39, 261–265. [Google Scholar] [CrossRef]
  16. Zhang, W.H.; Tyerman, S.D. Inhibition of water channels by HgCl2 in intact wheat root cells. Plant Physiol. 1999, 120, 849–857. [Google Scholar] [CrossRef] [Green Version]
  17. Kabata–Pendias, A.; Mukherjee, B. Trace Elements from Soil to Human; Springer: Berlin/Heidelberg, Germany, 2007; pp. 5–6. [Google Scholar]
  18. Clemens, S. Molecular mechanisms of plant metal tolerance and homeostasis. Planta 2001, 212, 475–486. [Google Scholar] [CrossRef] [PubMed]
  19. Sharma, S.K.; Goloubinoff, P.; Christen, P. Heavy metal ions are potent inhibitors of protein folding. Biochem. Biophys. Res. Commun. 2008, 372, 341–345. [Google Scholar] [CrossRef] [PubMed]
  20. Vouk, D.; Malus, D.; Tedeschi, S. Sludge generated at municipal waste water treatment plants. J. Croat. Assoc. Civ. Eng.-Građevinar 2011, 63, 341–349. (In Croatian) [Google Scholar]
  21. Petrlić, Ž. Prednosti i Nedostaci Korištenja Pepela kao Kalcizacijskog Sredstva. Undergraduate Thesis, Josip Juraj Strossmayer University of Osijek, Faculty of Agrobiotechical Sciences Osijek, Osijek, Croatia, 2020. (In Croatian). [Google Scholar]
  22. Alasmary, Z.; Hettiarachchi, G.; Roozeboom, K.L.; Davis, L.C.; Erickson, L.E.; Pidlisnyuk, V.; Stefanovska, T.; Trögl, J. Phytostabilization of a contaminated military site using Miscanthus and soil amendments. J. Environ. Qual. 2021, 50, 1220–1232. [Google Scholar] [CrossRef]
  23. Shaaban, M.; Van Zwieten, L.; Bashir, S.; Younas, A.; Núñez-Delgado, A.; Chhajro, M.A.; Kubar, K.A.; Ali, U.; Rana, M.S.; Mehmood, M.A.; et al. A concise review of biochar application to agricultural soils to improve soil conditions and fight pollution. J. Environ. Manag. 2018, 228, 429–440. [Google Scholar] [CrossRef]
  24. Sušac, I. The Significance of Endo Mycorrhizal Fungi in Plant Nutrition. Undergraduate Thesis, Josip Juraj Strossmayer University of Osijek, Faculty of Agrobiotechical Sciences Osijek, Osijek, Croatia, 2017. (In Croatian). [Google Scholar]
  25. Ali, A.; Bilal, S.; Khan, A.L.; Mabood, F.; Al-Harrasi, A.; Lee, I.-J. Endophytic Aureobasidium pullulans BSS6 assisted developments in phytoremediation potentials of Cucumis sativus under Cd and Pb stress. J. Plant Interact. 2019, 14, 303–313. [Google Scholar] [CrossRef] [Green Version]
  26. Kubiak, K.; Rotchimmel, K.; Stereńczak, K.; Damszel, M.; Sierota, Z. Remote sensing semi-automatic measurements approach for monitoring bioenergetic crops of Miscanthus spp. Pomiary Autom. Robot. 2019, 23, 77–85. [Google Scholar] [CrossRef]
  27. Richter, G.M.; Agostini, F.; Barker, A.; Costomiris, D.; Qi, A. Assessing on farm productivity of Miscanthus crops by combining soil mapping, yield modelling and remote sensing. Biomass Bioenergy 2016, 85, 252–261. [Google Scholar] [CrossRef] [Green Version]
  28. Lillesand, T.M.; Kiefer, R.W.; Chipman, J.W. Remote Sensing and Image Interpretation, 5th ed.; John Wiley & Sons: New York, NY, USA, 2004. [Google Scholar]
  29. Liu, F.; He, Y.; Zhang, Q.; Wang, W.; Shen, T. Crop Information Sensing Technology. In Agricultural Internet of Things. Agriculture Automation and Control, 1st ed.; He, Y., Nie, P., Zhang, Q., Liu, F., Eds.; Springer: Cham, Switzerland, 2021. [Google Scholar] [CrossRef]
  30. McCoy, R.M. Field Methods in Remote Sensing; The Guilford Press: New York, NY, USA, 2005. [Google Scholar]
  31. Hatfield, J.L.; Gitelson, A.A.; Schepers, J.S.; Walthall, C.L. Application of Spectral Remote Sensing for Agronomic Decisions. Agron. J. 2008, 100, S-117–S-131. [Google Scholar] [CrossRef] [Green Version]
  32. Jin, X.; Chen, X.; Shi, C.; Li, M.L.; Guan, Y.; Yu, C.Y.; Yamada, T.; Sacks, E.J.; Peng, J. Determination of hemicellulose, cellulose and lignin content using visible and near infrared spectroscopy in Miscanthus sinensis. Bioresour. Technol. 2017, 241, 603–609. [Google Scholar] [CrossRef] [PubMed]
  33. Jin, X.; Shi, C.; Yu, C.Y.; Yamada, T.; Sacks, E.J. Determination of leaf water content by visible and near-infrared spectrometry and multivariate calibration in Miscanthus. Front. Plant Sci. 2017, 8, 721. [Google Scholar] [CrossRef] [Green Version]
  34. Mohamadi, H.; Sepehr, B. Correlation of NDVI calculated with GreenSeeker and VNIR spectroscopy. In Proceedings of the 6th Iranian Biennial Chemometrics Seminar, University of Mazandaran, Babolsar, Iran, 26–27 October 2017. [Google Scholar]
  35. Šestak, I.; Mesić, M.; Zgorelec, Ž.; Perčin, A. Diffuse reflectance spectroscopy for field scale assessment of winter wheat yield. Environ. Earth Sci. 2018, 77, 506. [Google Scholar] [CrossRef]
  36. Feng, X.; Chen, H.; Chen, Y.; Zhang, C.; Liu, X.; Weng, H.; Xiao, S.; Nie, P.; He, Y. Rapid detection of cadmium and its distribution in Miscanthus sacchariflorus based on visible and near-infrared hyperspectral imaging. Sci. Total Environ. 2019, 659, 1021–1031. [Google Scholar] [CrossRef]
  37. Jin, X.; Chen, X.; Xiao, L.; Shi, C.; Chen, L.; Yu, B.; Yi, Z.; Hye, Y.J.; Heo, K.; Yeon, Y.C.; et al. Application of visible and near-infrared spectroscopy to classification of Miscanthus species. PLoS ONE 2017, 12, e0171360. [Google Scholar] [CrossRef] [Green Version]
  38. HRN ISO 11277:2009; Soil Quality-Determination of Particle Size Distribution in Mineral Soil Material—Method by Sieving and Sedimentation. International Organization for Standardization: Geneva, Switzerland, 2009.
  39. Modified HRN ISO 10390:2004; Soil Quality-Determination of pH. International Organization for Standardization: Geneva, Switzerland, 2005.
  40. Modified HRN ISO 14235:2004; Soil Quality-Determination of Organic Carbon by Sulfochromic Oxidation. International Organization for Standardization: Geneva, Switzerland, 2004.
  41. HRN ISO 13878:2004; Soil Quality-Determination of Total Nitrogen Content by Dry Combustion (“Elemental Analysis”). International Organization for Standardization: Geneva, Switzerland, 2004.
  42. Škorić, A. Plant Available Potassium and Phosphorus in Soil-AL Method-Extraction with Ammonium Lactate Acetic Acid in 1:20 (m/v) Ratio. In Handbook for Soil Research; Faculty of Agricultural Sciences: Zagreb, Croatia, 1982. [Google Scholar]
  43. HRN ISO 11260:2004; Soil Quality-Determination of Effective Cation Exchange Capacity and Base Saturation Level Using Barium Chloride Solution. International Organization for Standardization: Geneva, Switzerland, 2004.
  44. Ministry of Environmental Protection, Spatial Planning and Construction. Regulation on Sludge Management from Wastewater Treatment Plants when Sludge is Used in Agriculture; Official Gazette NN 38/2008; 1307; Narodne Novine: Zagreb, Croatia, 2008; Available online: https://narodne-novine.nn.hr/clanci/sluzbeni/2008_04_38_1307.html (accessed on 8 May 2018). (In Croatian)
  45. HRN ISO 11465:2004; Soil Quality-Determination of Dry Matter and Water Content on a Mass Basis-Gravimetric Method. International Organization for Standardization: Geneva, Switzerland, 2004.
  46. HRN ISO 10694:2004; Soil Quality-Determination of Organic and Total Carbon after Dry Combustion (Elementary Analysis). International Organization for Standardization: Geneva, Switzerland, 2004.
  47. HRN ISO 15178:2005; Soil Quality-Determination of Total Sulfur by Dry Combustion. International Organization for Standardization: Geneva, Switzerland, 2005.
  48. StatSoft Inc. STATISTICA Data Analysis Software System; (Release 12); StatSoft Inc.: Tulsa, OK, USA, 2014. [Google Scholar]
  49. Analytical Spectral Devices Inc. ViewSpec Pro; (Release 6.2.0); Analytical Spectral Devices Inc.: Boulder, CO, USA, 2009. [Google Scholar]
  50. CAMO Analytics UNSCRAMBLER; (Release 9.7); CAMO Analytics: Oslo, Norway, 2007.
  51. Lončarić, Z. Calcifying agents. In Soil Calcification in the Border Area; Lončarić, Z., Ed.; Josip Juraj Strossmayer University of Osijek, Faculty of Agrobiotechical Sciences Osijek: Osijek, Croatia, 2015; pp. 28–40. [Google Scholar]
  52. Vujec, L. Chemical changes in the soil and radish yield due to the application of biomass ash. Master’s Thesis, University of Zagreb, Faculty of Agriculture, Zagreb, Croatia, 2018. Available online: https://urn.nsk.hr/urn:nbn:hr:204:143168 (accessed on 4 October 2021). (In Croatian).
  53. Pogrzeba, M.; Rusinowski, S.; Sitko, K.; Krzyzak, J.; Skalska, A.; Małkowski, E.; Ciszek, D.; Werle, S.; McCalmont, J.P.; Mos, M.; et al. Relationships between soil parameters and physiological status of Miscanthus × giganteus cultivated on soil contaminated with trace elements under NPK fertilization vs. microbial inoculation. Environ. Pollut. 2017, 225, 163–174. [Google Scholar] [CrossRef]
  54. Beale, C.V.; Long, S.P. Seasonal dynamics of nutrient accumulation and partitioning in the perennial C-4-grasses Miscanthus × giganteus and Spartina cynosuroides. Biomass Bioenergy 1997, 12, 419–428. [Google Scholar] [CrossRef]
  55. Lewandowski, I.; Schmidt, U. Nitrogen, energy and land use efficiencies of miscanthus, reed canary grass and triticale as determined by the boundary line approach. Agric. Ecosyst. Environ. 2006, 112, 335–346. [Google Scholar] [CrossRef] [Green Version]
  56. Cadoux, S.; Riche, A.B.; Yates, N.E.; Machet, J.M. Nutrient requirements of Miscanthus × giganteus: Conclusions from a review of published studies. Biomass Bioenergy 2012, 38, 14–22. [Google Scholar] [CrossRef]
  57. Barbosa, B.; Costa, J.; Fernando, A.L. Production of Energy Crops in Heavy Metals Contaminated Land: Opportunities and Risks. In Land Allocation for Biomass Crops; Li, R., Monti, A., Eds.; Springer: Cham, Switzerland, 2018; pp. 83–102. [Google Scholar] [CrossRef]
  58. Dhalaria, R.; Kumar, D.; Kumar, H.; Nepovimova, E.; Kuča, K.; Torequl Islam, M.; Verma, R. Arbuscular Mycorrhizal Fungi as Potential Agents in Ameliorating Heavy Metal Stress in Plants. Agronomy 2020, 10, 815. [Google Scholar] [CrossRef]
  59. Bano, S.A.; Ashfaq, D. Role of mycorrhiza to reduce heavy metal stress. Nat. Sci. 2013, 5, 16–20. [Google Scholar] [CrossRef] [Green Version]
  60. Shackley, S.; Sohi, S.P. An Assessment of the Benefits and Issues Associated with the Application of Biochar to Soil: A Report Commissioned by the UK Department for Environment, Food and Rural Affairs and Department of Energy and Climate Change; DECC: London, UK, 2010; p. 132. Available online: https://www.research.ed.ac.uk/files/17910544/3rd_revised_SP0576_report.pdf (accessed on 4 October 2021).
  61. Haboudane, D.; Miller, J.R.; Tremblay, N.; Zarco-Tejada, P.J.; Dextraze, L. Integrated narrow-band vegetation indices for prediction of crop chlorophyll content for application to precision agriculture. Remote Sens. Environ. 2002, 81, 416–426. [Google Scholar] [CrossRef]
  62. Moron, A.; Garcia, A.; Sawchik, J.; Cozzolino, D. Preliminary study on the use of near-infrared reflectance spectroscopy to assess nitrogen content of undried wheat plants. J. Sci. Food Agric. 2007, 87, 147–152. [Google Scholar] [CrossRef]
  63. Ferrio, J.P.; Villegas, D.; Zarco, J.; Aparicio, N.; Araus, J.L.; Royo, C. Assessment of durum wheat yield using visible and near-infrared reflectance spectra of canopies. Field Crops Res. 2005, 94, 126–148. [Google Scholar] [CrossRef]
  64. Atzberger, C.; Guérif, M.; Baret, F.; Werner, W. Comparative analysis of three chemometric techniques for the spectroradiometric assessment of canopy chlorophyll content in winter wheat. Comput. Electron. Agric. 2010, 73, 165–173. [Google Scholar] [CrossRef]
  65. Allison, G.G.; Morris, C.; Hodgson, E.; Jones, J.; Kubacki, M.; Barraclough, T.; Yates, N.; Shield, I.; Bridgwater, A.V.; Donnison, I.S. Measurement of key compositional parameters in two species of energy grass by Fourier transform infrared spectroscopy. Bioresour. Technol. 2009, 100, 6428–6433. [Google Scholar] [CrossRef]
  66. Jensen, T.; Apan, A.; Young, F.; Zeller, L. Detecting the attributes of a wheat crop using digital imagery acquired from a low-altitude platform. Comput. Electron. Agric. 2007, 59, 66–77. [Google Scholar] [CrossRef] [Green Version]
  67. Ahamed, T.; Tian, L.; Jiang, Y.S.; Zhao, B.; Liu, H.; Ting, K.C. Tower remote sensing system for monitoring energy crops; image acquisition and geometric corrections. Biosyst. Eng. 2012, 112, 93–107. [Google Scholar] [CrossRef]
Figure 1. The results of ANOVA for: (a) MxG leaf nitrogen content; (b) above-ground biomass, with soil treatments and vegetation years as factors. Different letters represent significant (p < 0.05) differences between treatments (lower-case letters) and vegetation year (upper-case letters). Abbreviations: I-soil without amendment; II-sludge; III-mycorrhizae; IV-MxG ash.
Agronomy 12 00255 g001
Figure 2. Differences in average leaf reflectance according to experiment treatments in vegetation years 2018 (a) and 2019 (b). Abbreviations: I-soil without amendment; II-sludge; III-mycorrhizae; IV-MxG ash.
Agronomy 12 00255 g002
Figure 3. Results of full cross-validation PLSR prediction model for MxG leaf TN content (%) for cumulative investigation period based on 1st derivative of leaf reflectance (n = 24): (a) PCA score plot; (b) regression coefficient plot; (c) residual validation variance; (d) prediction plot. calibration validation. Abbreviations: I-soil without amendment; II-sludge; III-mycorrhizae; IV-MxG ash; 1-vegetation year 2018; 2-vegetation year 2019.
Agronomy 12 00255 g003
Figure 4. Results of full cross-validation PLSR prediction model for aboveground MxG biomass (t/ha) for cumulative investigation period based on 1st derivative of leaf reflectance (n = 24): (a) PCA score plot; (b) regression coefficient plot; (c) residual validation variance; (d) prediction plot. calibration validation. Abbreviations: I-soil without amendment; II-sludge; III-mycorrhizae; IV-MxG ash; 1-vegetation year 2018; 2-vegetation year 2019.
Agronomy 12 00255 g004
Table 1. Different soil amendments added to soil with a high level of contamination (L2)—100 mg Cd/kg soil and 20 mg Hg/kg soil.
TreatmentR.No. 1MarkSoil AmendmentsDescription
I. L2 + soil without amendment3I-1
I-2
I-3
18 kg soil/EP 2
(100 mg/kg Cd i 20 mg/kg Hg)
Highly contaminated soil with cadmium and mercury + pure soil from the agricultural experimental field Maksimir
II. L2 + sludge3II-1
II-2
II-3
18 kg soil
340 g waste sludge/EP 2
(liquid, 97% natural moisture)
Highly contaminated soil with cadmium and mercury + waste sludge from the fermenter of biogas plant Agroproteinka
III. L2 + mycorrhizae3III-1
III-2
III-3
18 kg soil
5 mL mycorrhizae/EP 2 or 15 mL/3 plants
Highly contaminated soil with cadmium and mercury + mycorrhizae
IV. L2 + MxG ash3IV-1
IV-2
IV-3
13.5 kg soil
soil/ash ratio 75/25
Highly contaminated soil with cadmium and mercury + MxG ash
1 repetition number; 2 experimental pot.
Table 2. Soil chemical and physical properties.
pHKClHumusP2O5K2OTNTCTSCECTexture, %
-%mg/100 g Soilmg/100 g Soil%%%cmol(+)/kgCoarse SandFine SandCoarse SiltFine SiltClay
6.233.84.47.80.232.480.04918.94.410.038.037.79.9
Table 3. Results of descriptive statistics for the content of nitrogen, carbon, sulfur and moisture in the aboveground biomass of miscanthus.
TreatmentStatistical ParameterVegetation Year 2018Vegetation Year 2019
N (%)C (%)S (%)Moisture (%)N (%)C (%)S (%)Moisture (%)
I-soil without amendmentMean0.5448.650.1112.931.1746.340.208.91
STD 10.010.280.0012.340.200.970.032.31
RSD% 26.541.774.3354.4252.876.3358.0377.80
II-sludgeMean0.6949.070.1110.741.4448.090.178.41
STD0.150.390.0033.650.113.810.010.71
RSD% 65.442.408.41102.1323.2223.7727.3825.42
III-mycorrhizaeMean0.6248.370.117.941.1246.070.1711.68
STD0.100.250.0022.530.031.070.0021.92
RSD% 48.081.606.9995.659.726.993.8349.52
IV-MxG ashMean0.4747.160.119.911.0843.540.186.31
STD0.090.300.0030.430.161.390.010.20
RSD% 57.641.968.2913.2347.029.6131.309.64
1 standard deviation; 2 relative standard deviation.
Table 4. Two-way ANOVA results for MxG leaf total nitrogen content and aboveground biomass.
ANOVA ResultsTN, %Biomass, t/ha
p-Value
Treatment**n.s.
Year*****
Treatment × yearn.s.n.s.
Significant differences at p < 0.01 **; p < 0.001 ***; n.s. not significant at a p < 0.05.
Publisher’s Note: MDPI stays neutral with regard to jurisdictional claims in published maps and institutional affiliations.

