


Study on Spray Deposition and Drift Characteristics of UAV Agricultural Sprayer for Application of Insecticide in Redgram Crop (Cajanus cajan L. Millsp.)

 ,
,  , and
, and
Abstract
:1. Introduction
2. Materials and Methods
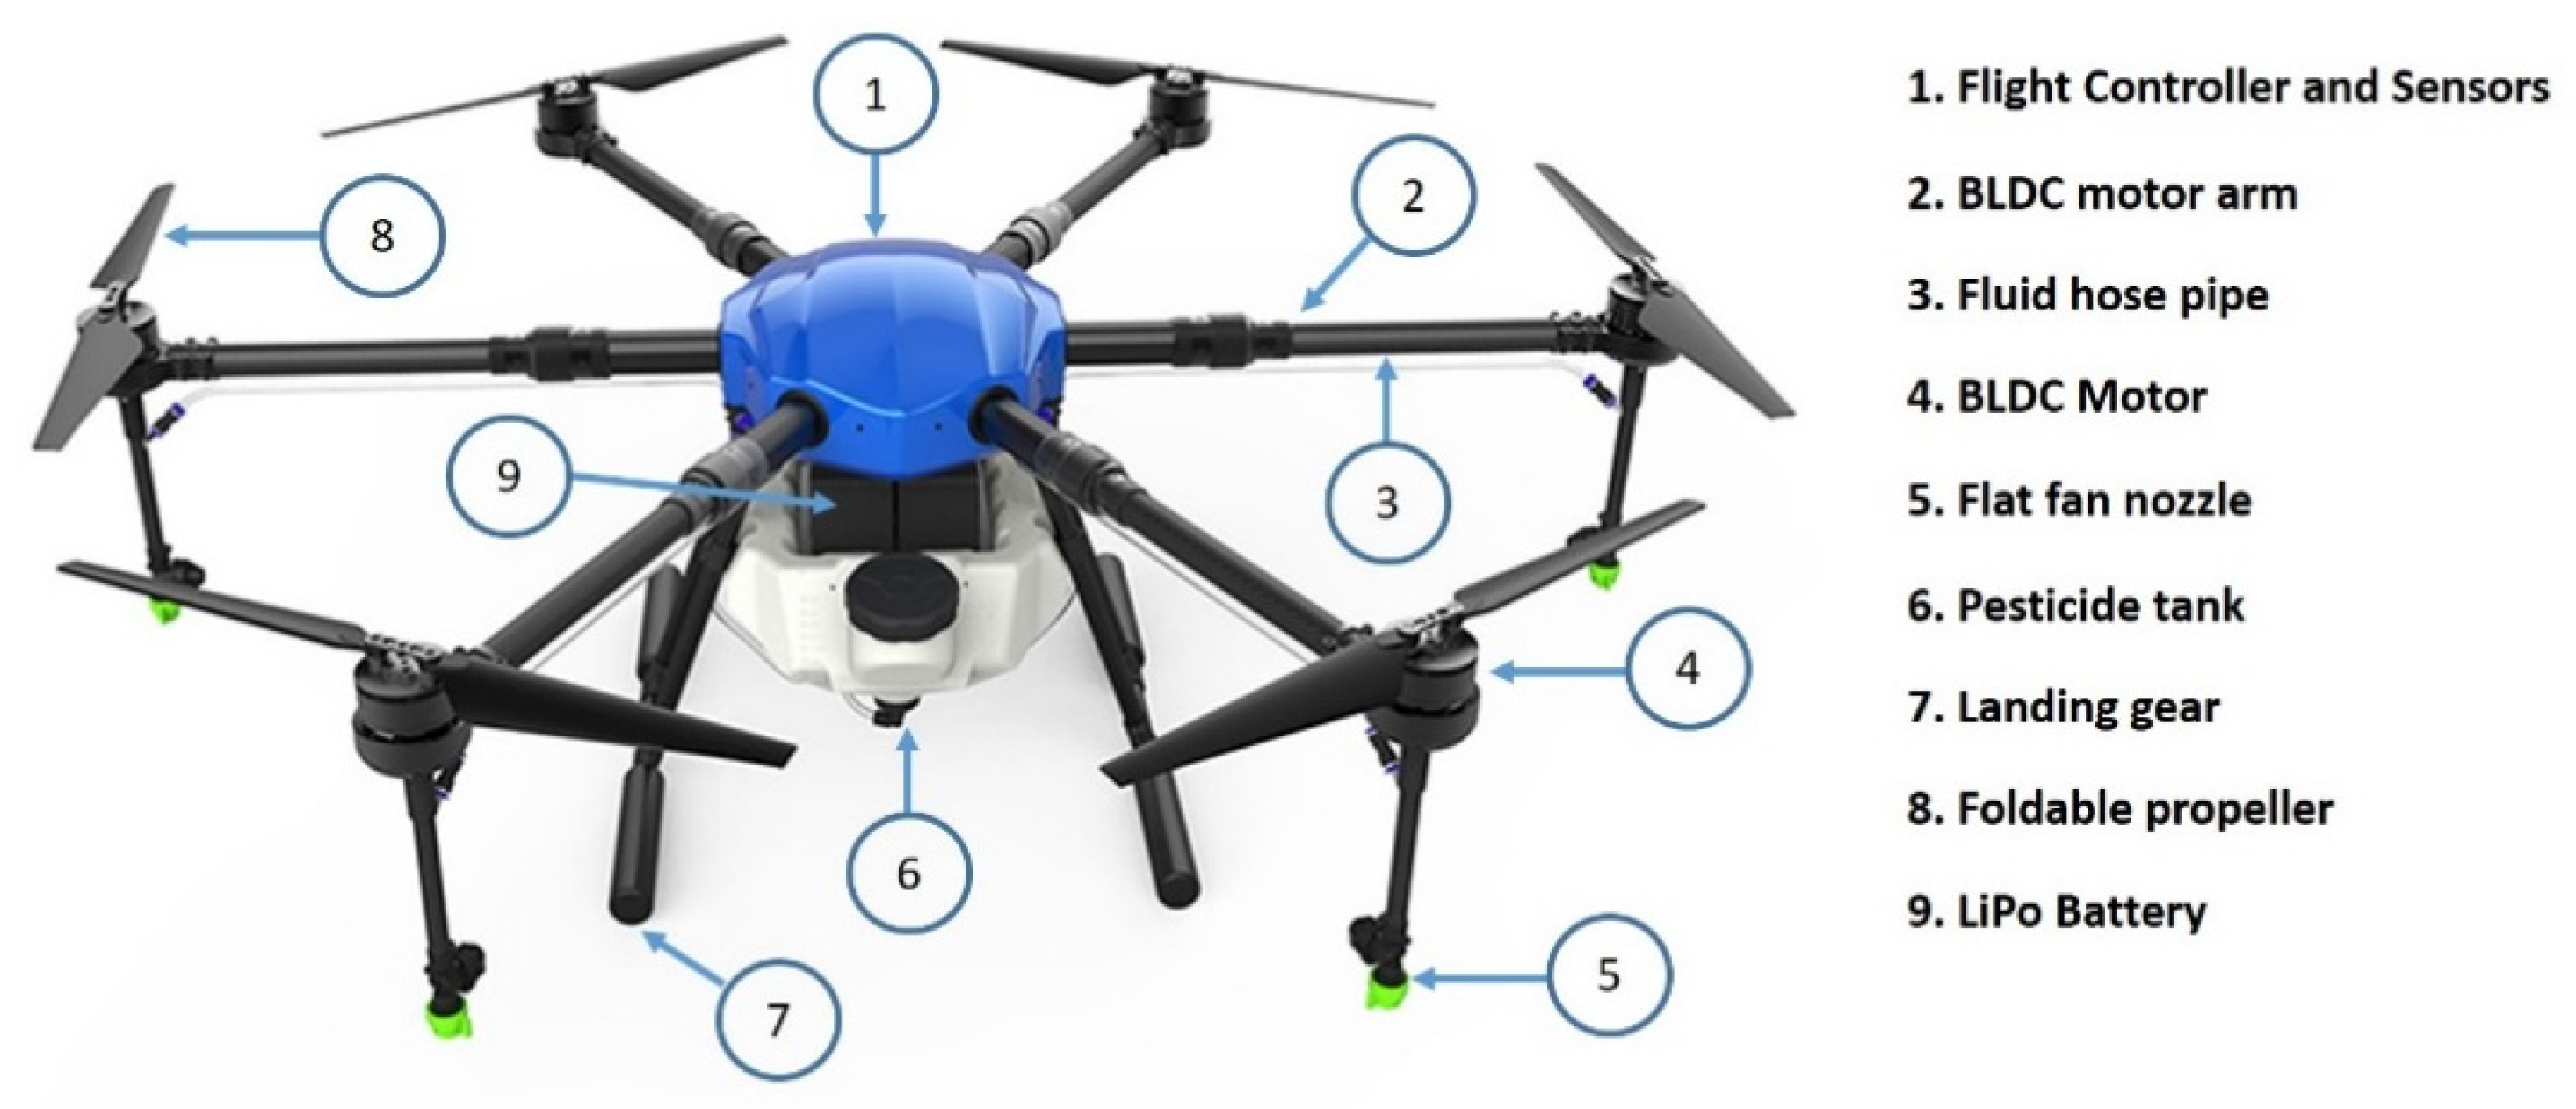
2.1. Equipment
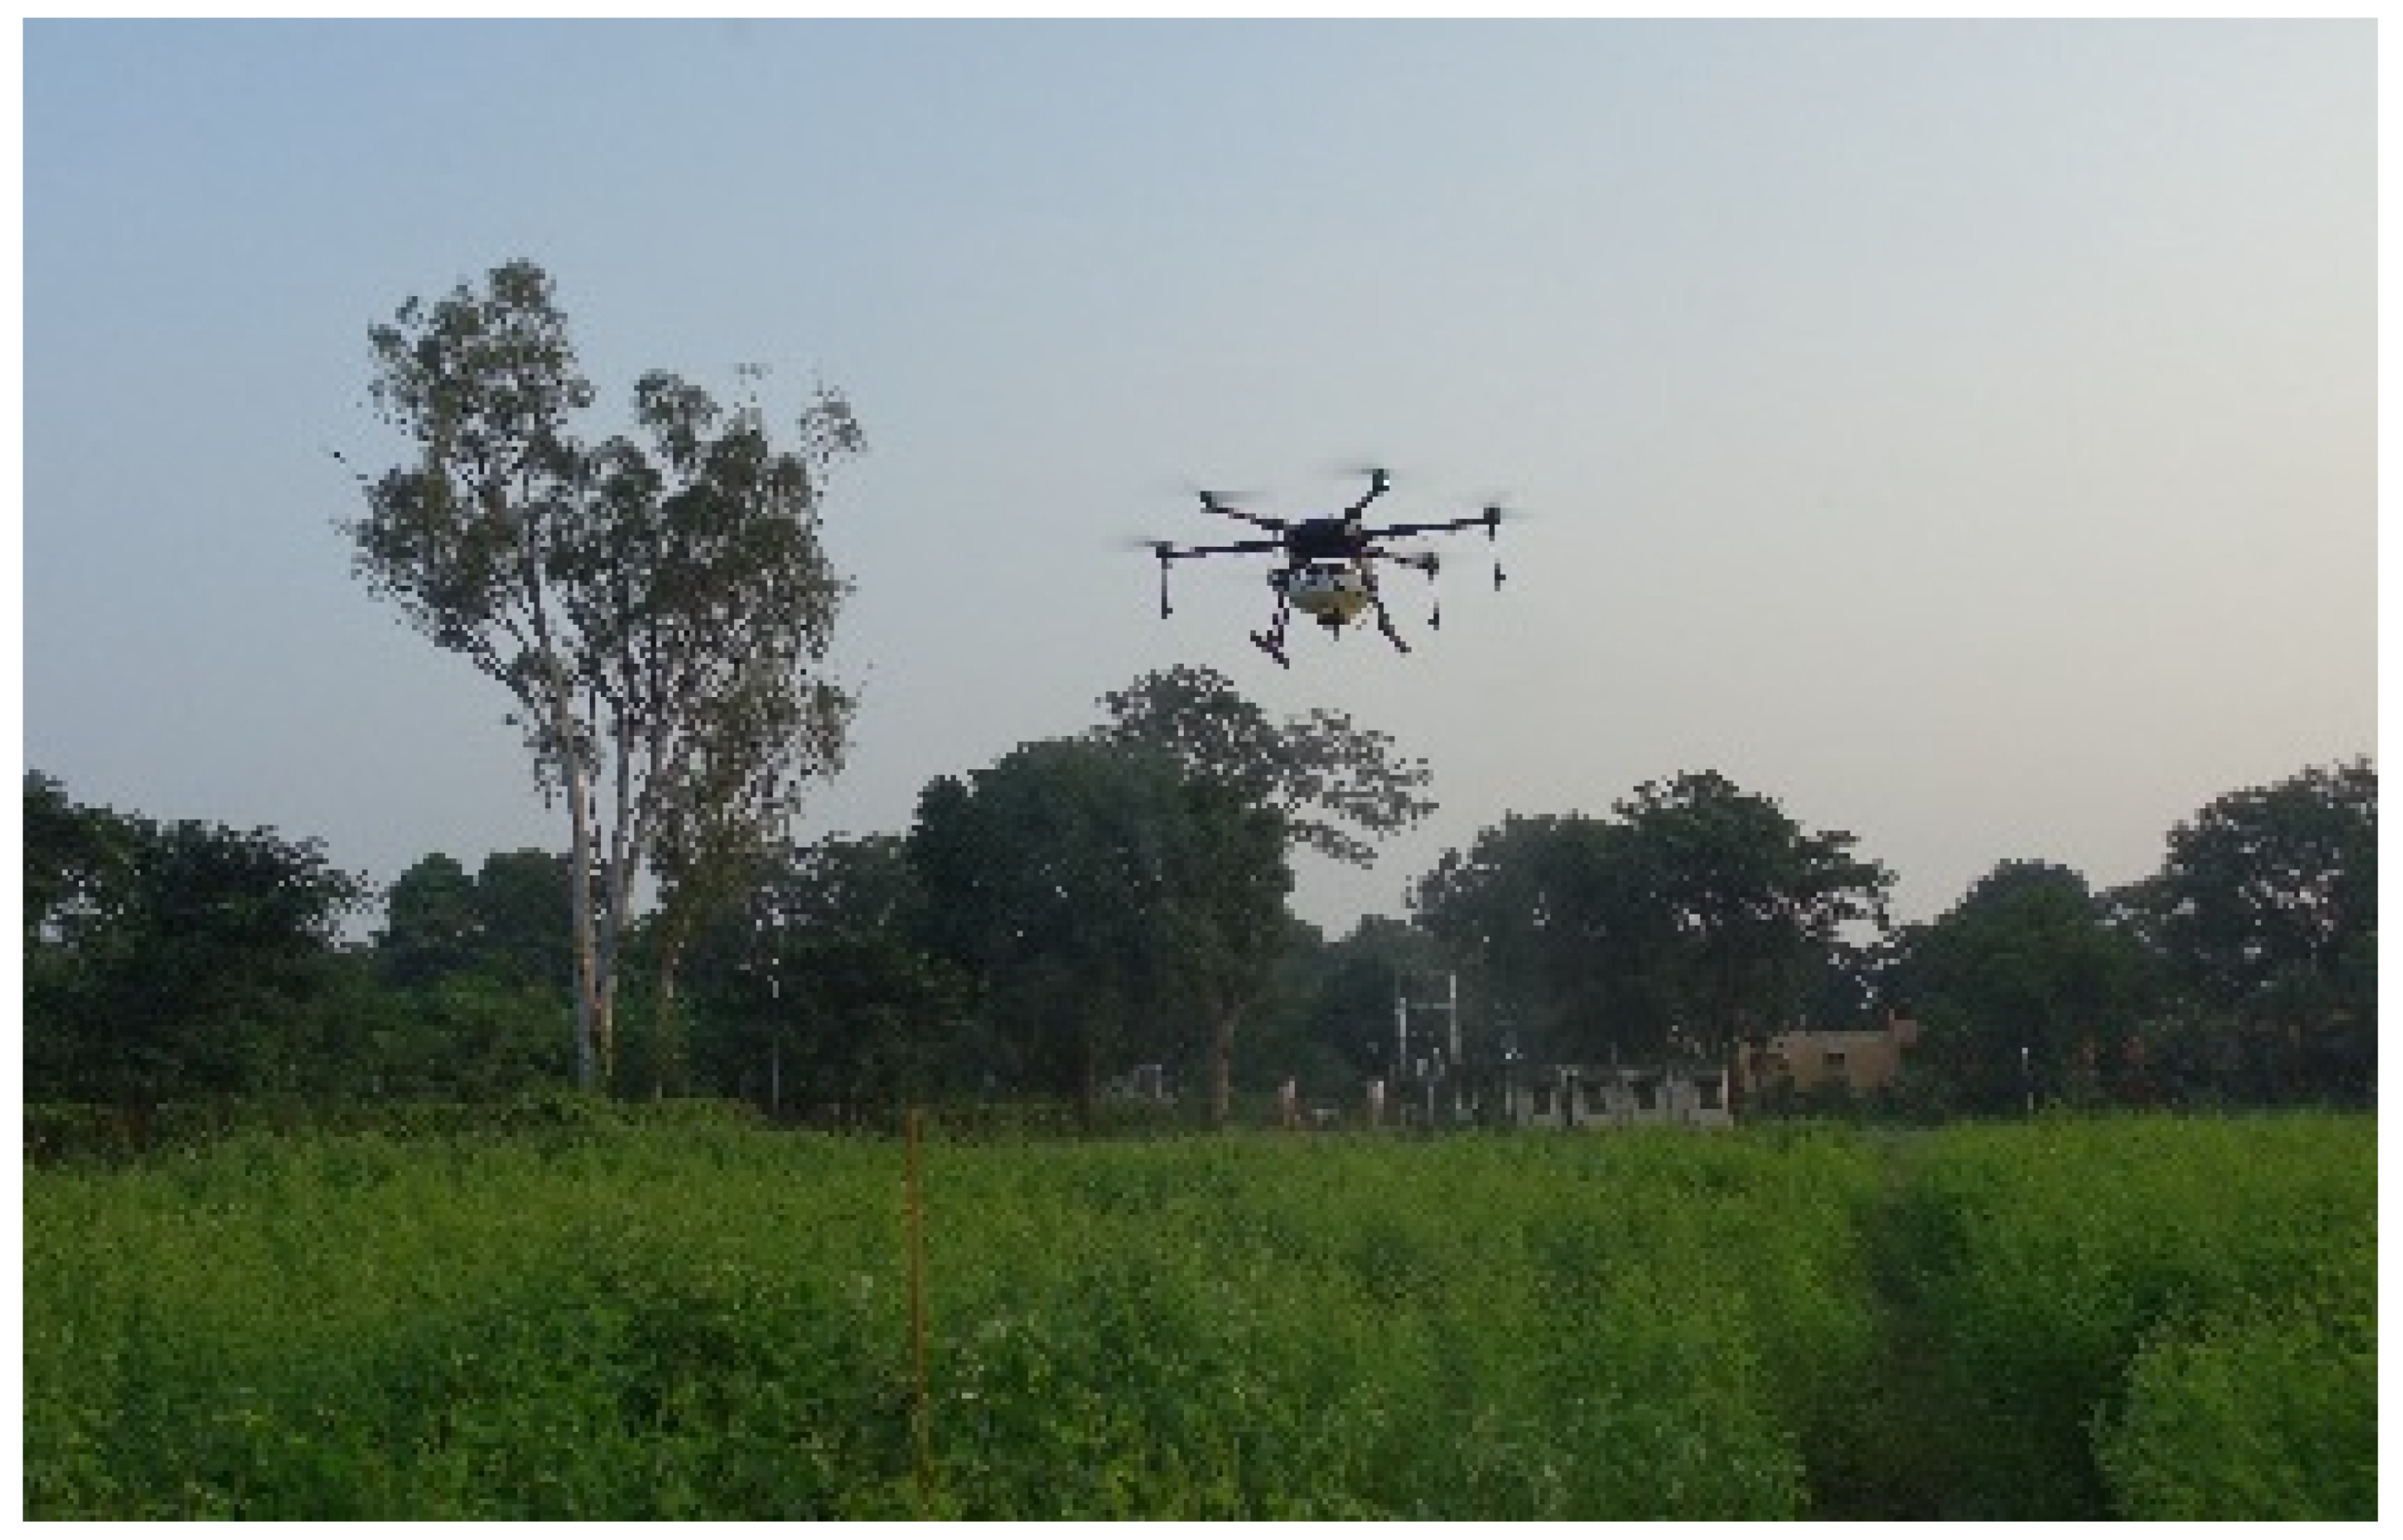
2.2. Field Plot
2.3. Spray sampling Scheme
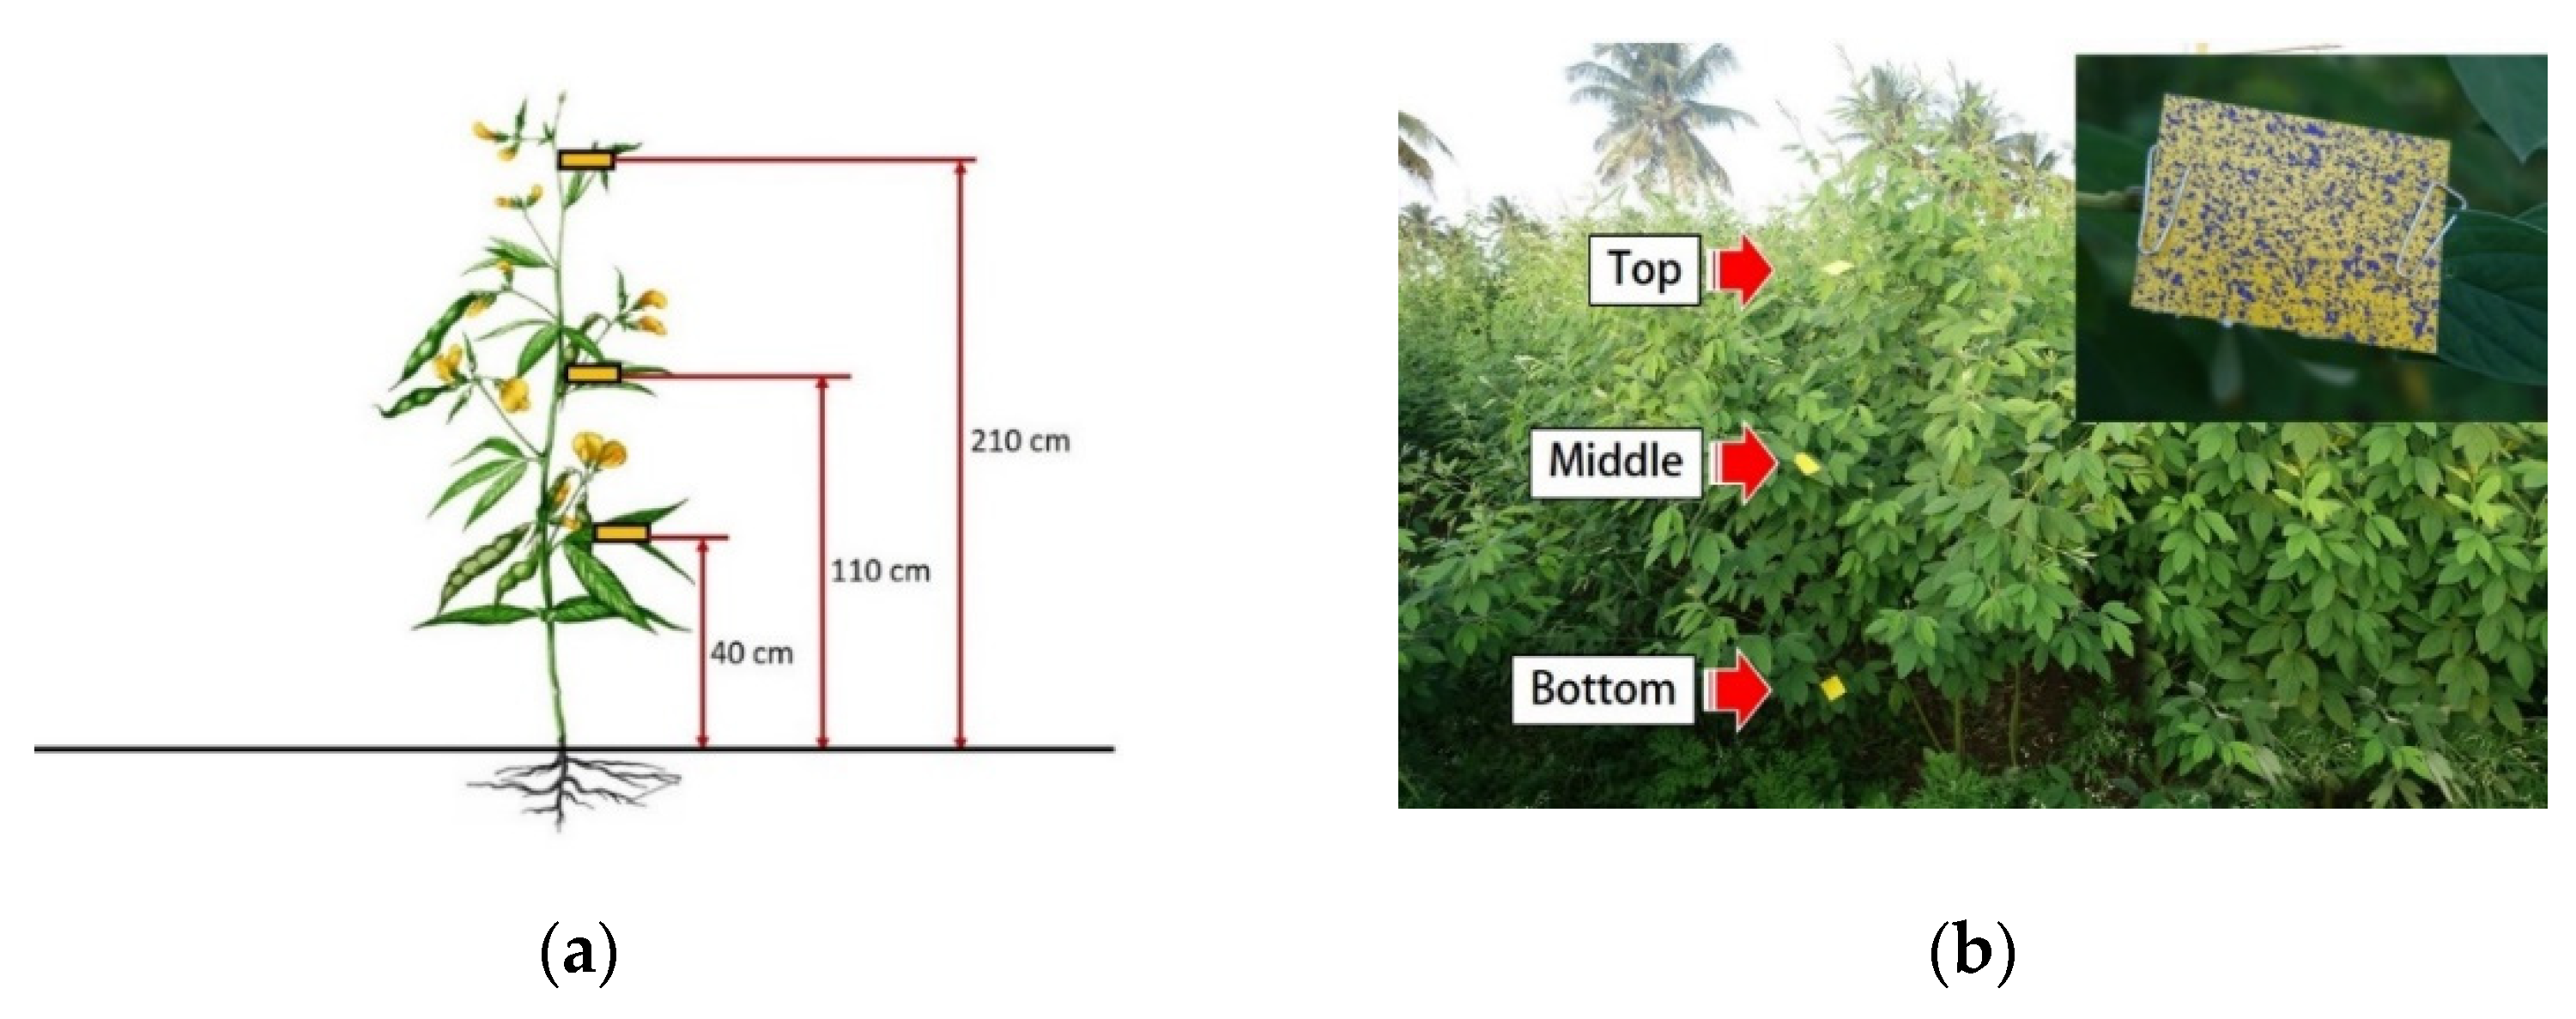
2.3.1. Sampling of Spray Deposition
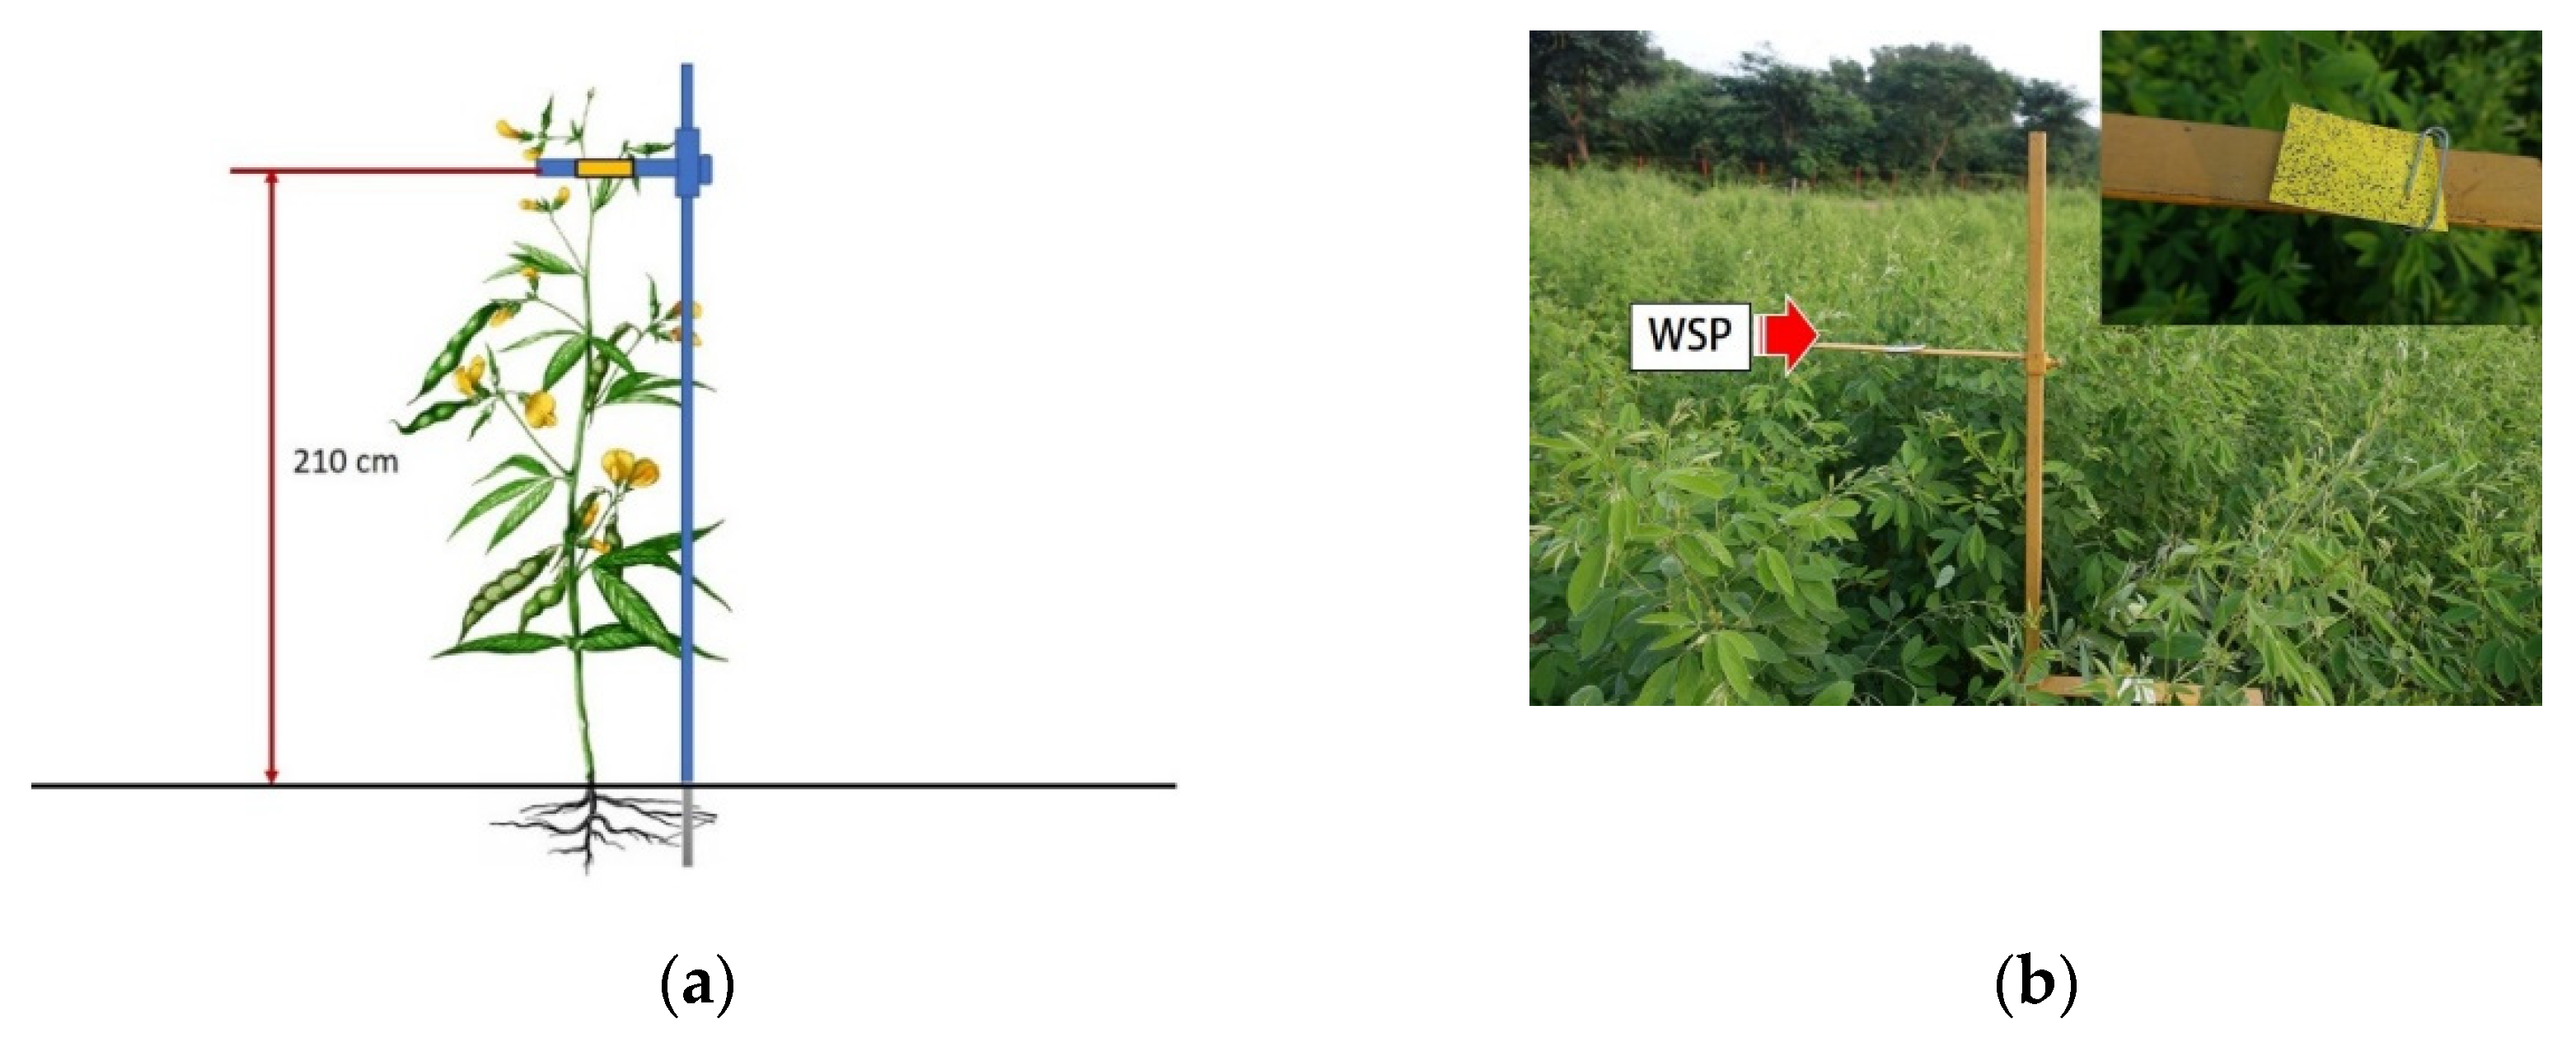
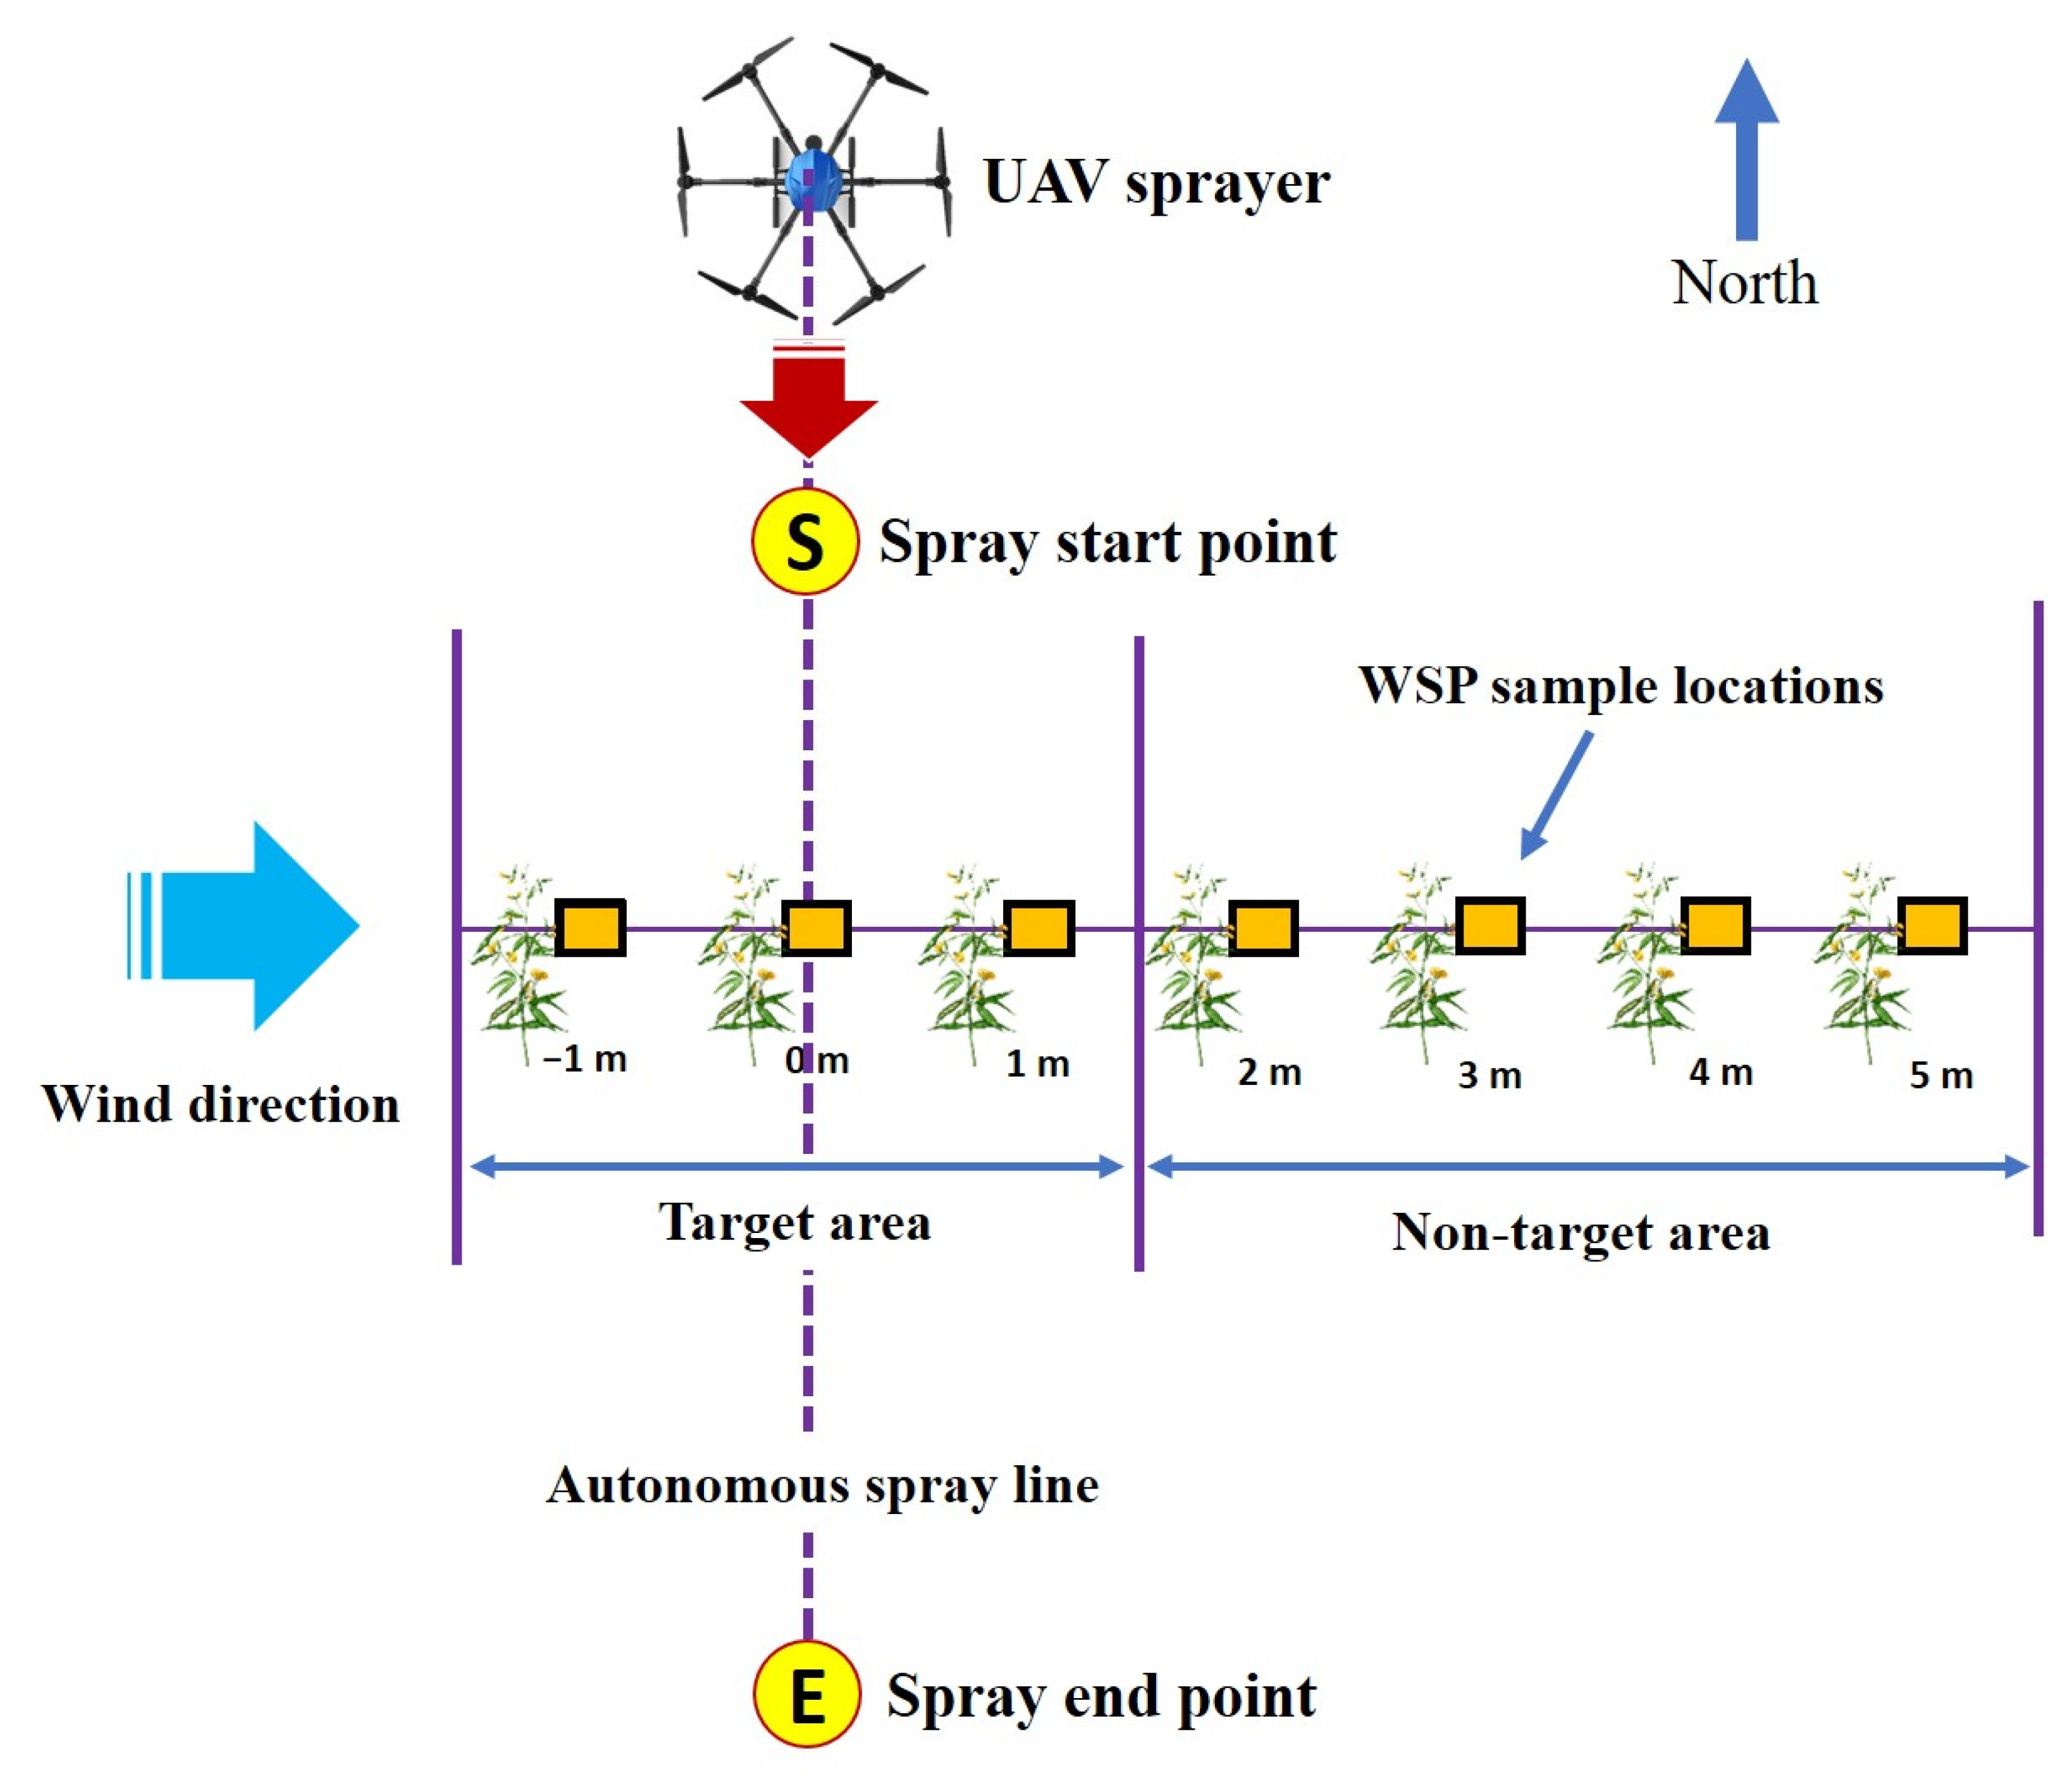
2.3.2. Sampling of Spray Drift
2.4. Selection and Feeding of UAV Spray Operational Parameters
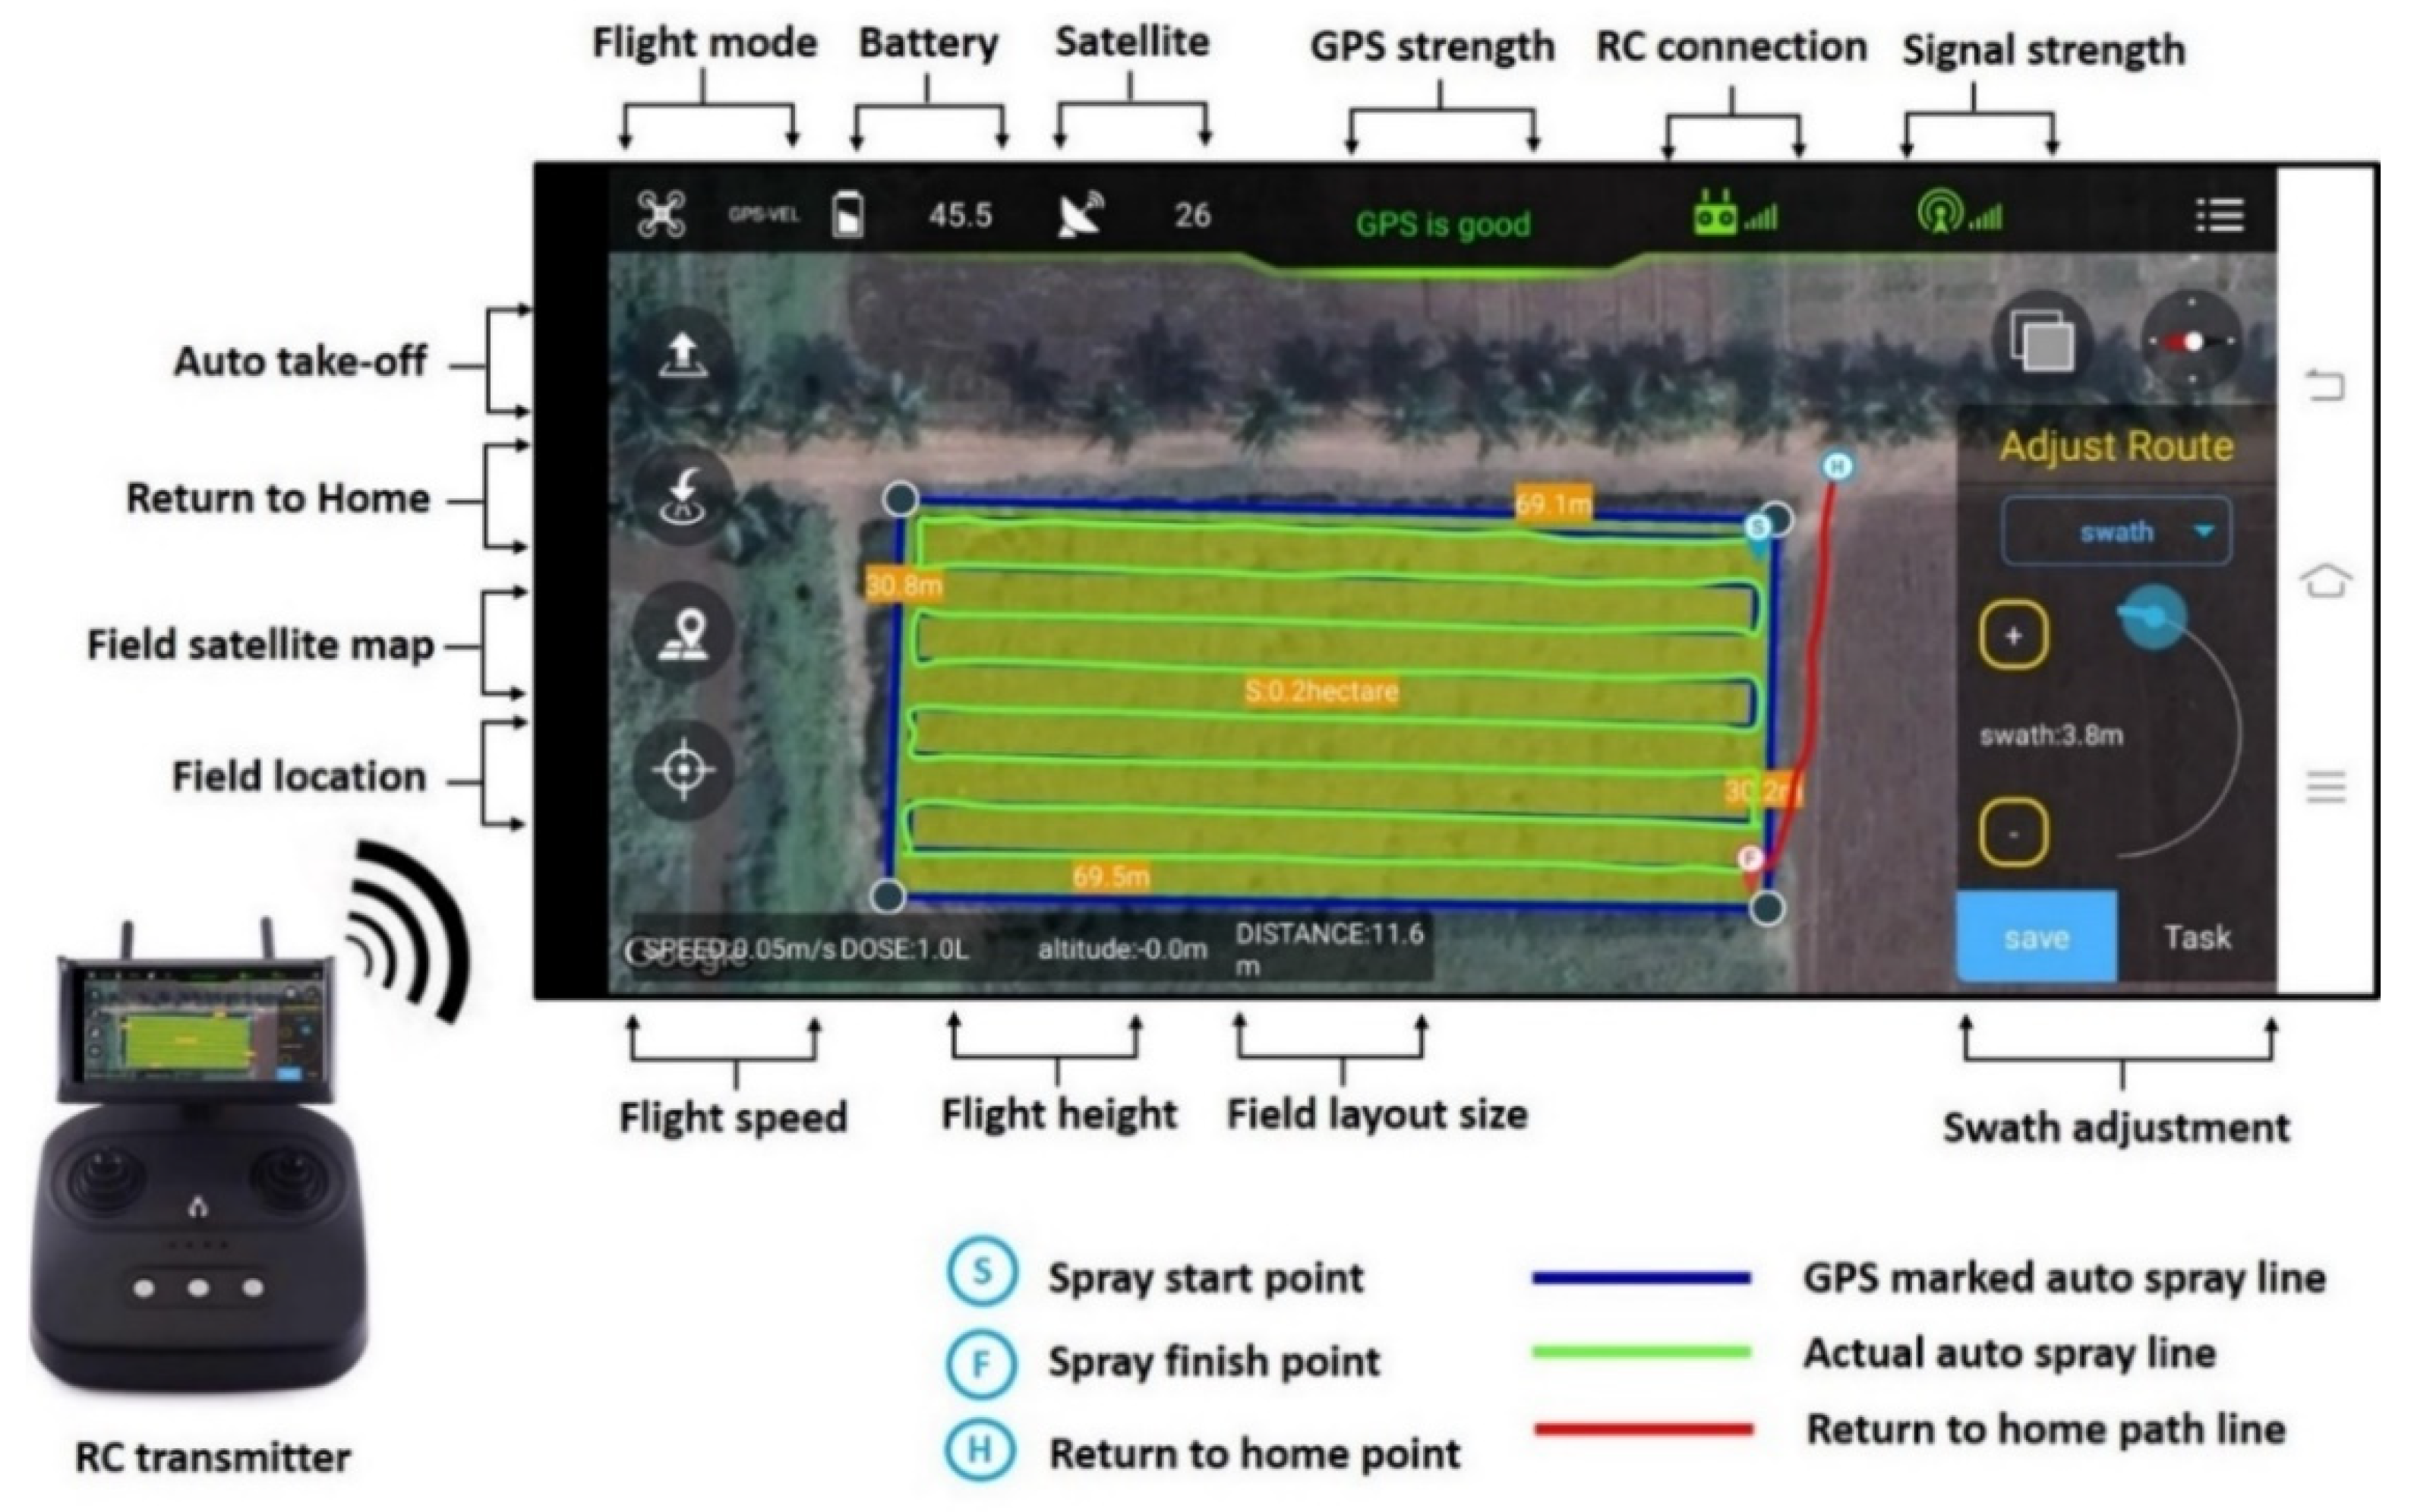
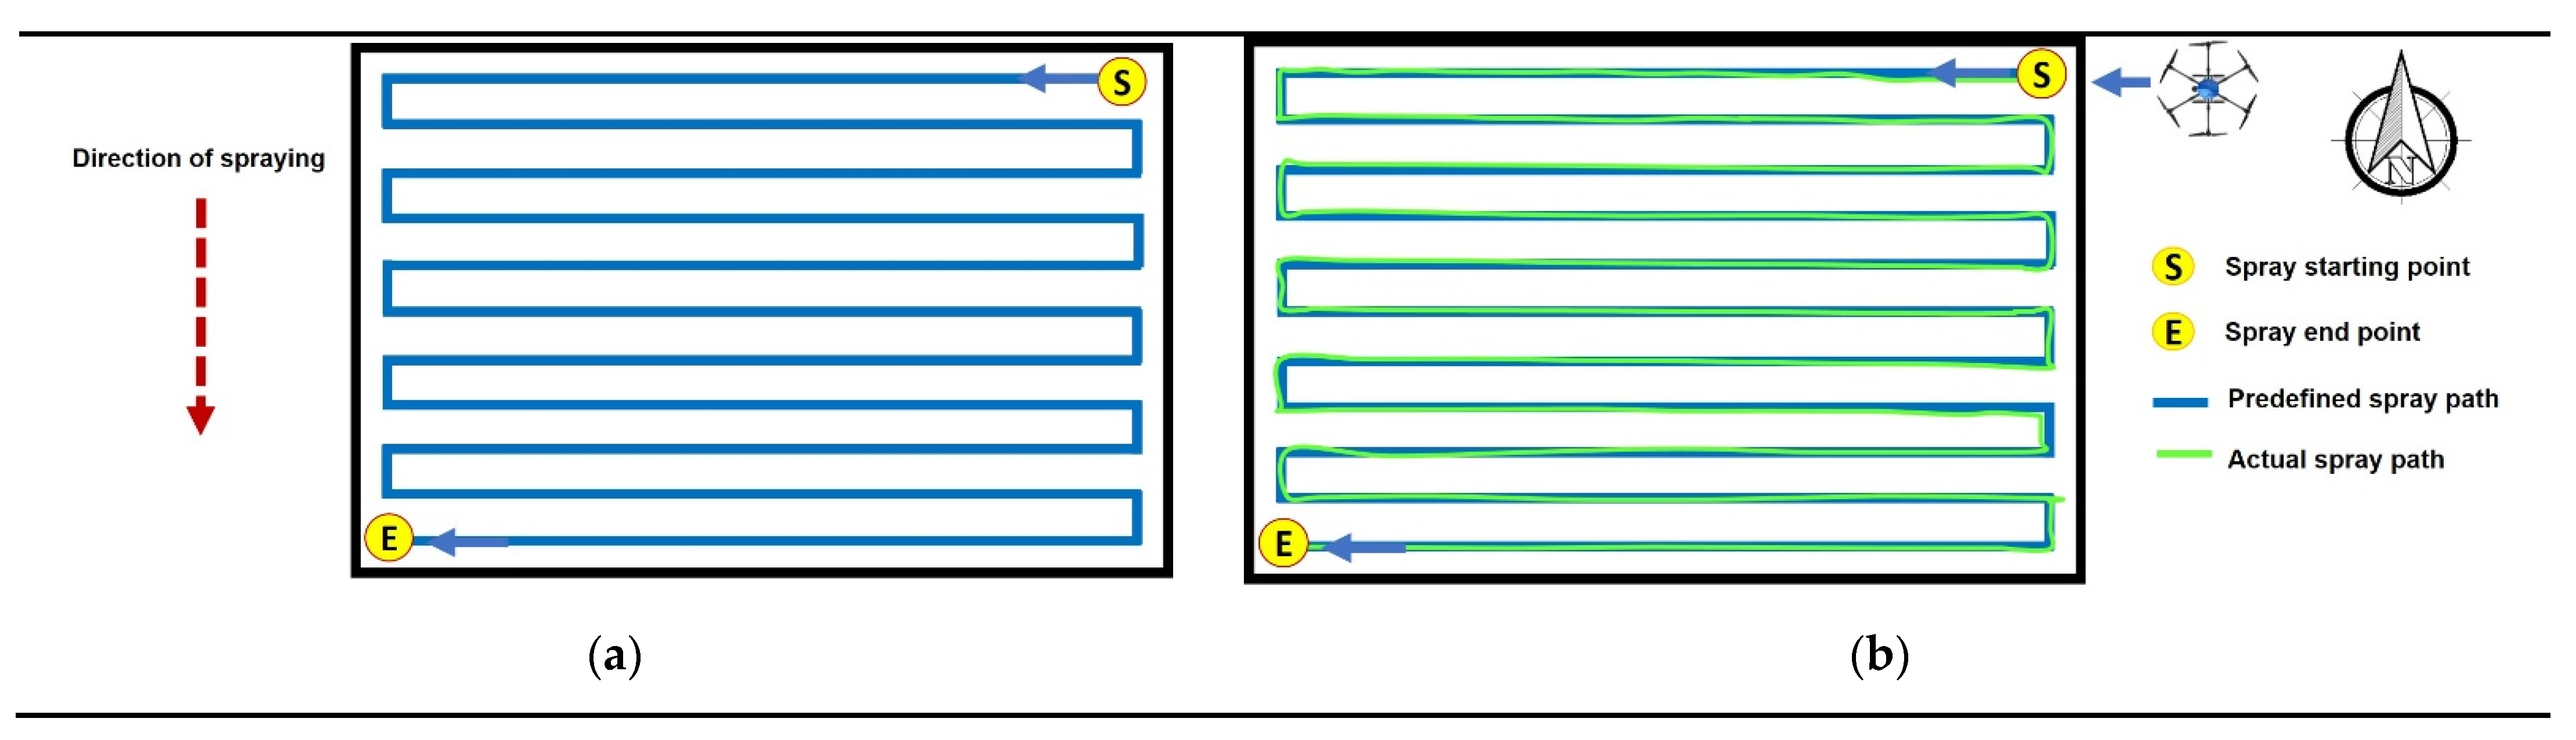
2.4.1. Autonomous Spraying System
2.4.2. Recording of Meteorological Parameters
2.5. Collection of WSP and Spraying Effectiveness Analysis
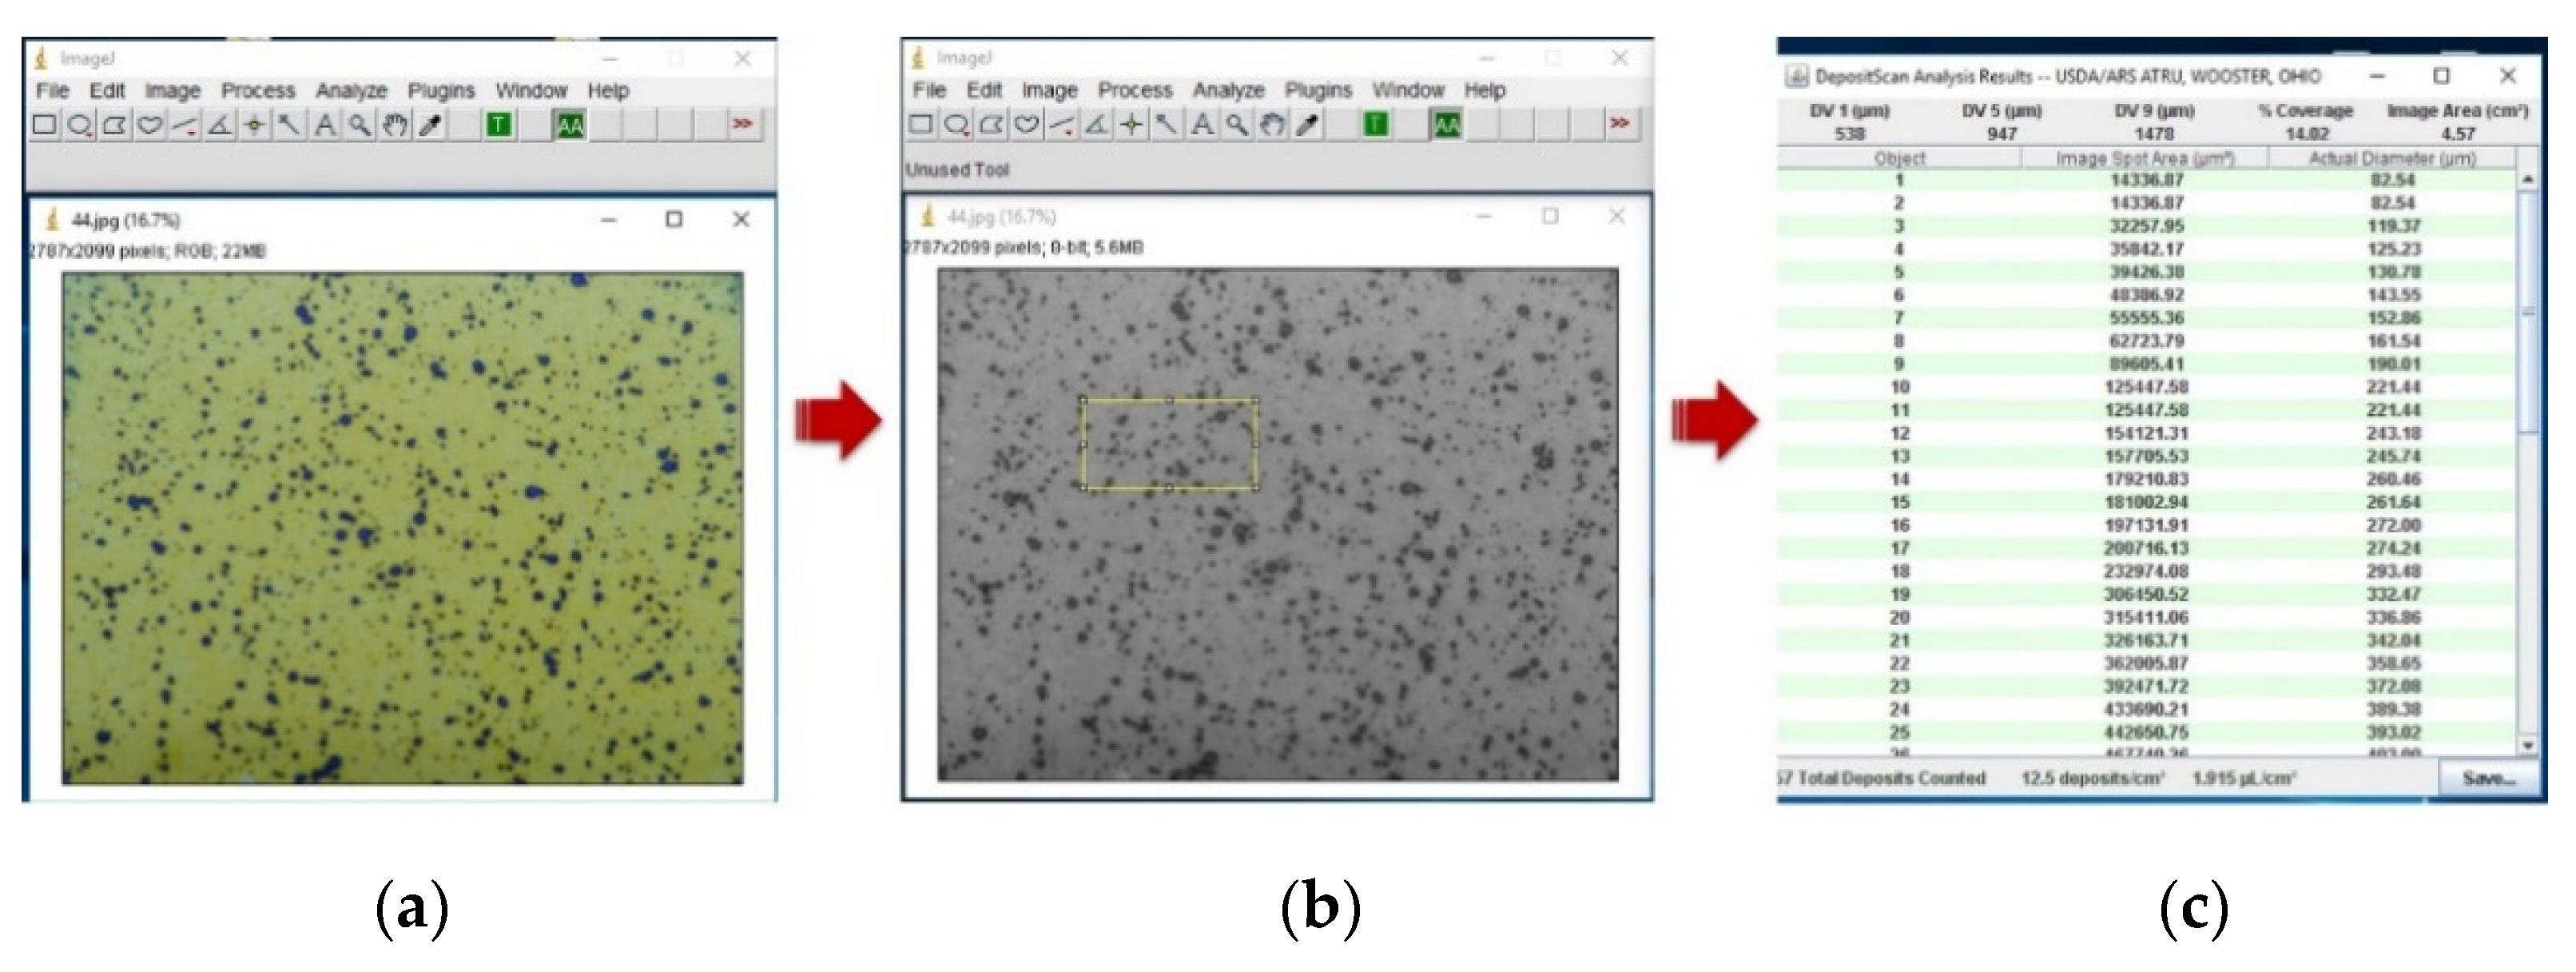
2.5.1. Deposit Scan Software
2.5.2. Droplet Penetrability (%)
2.5.3. Effective Spray Width
2.5.4. Application Rate
3. Results and Discussion
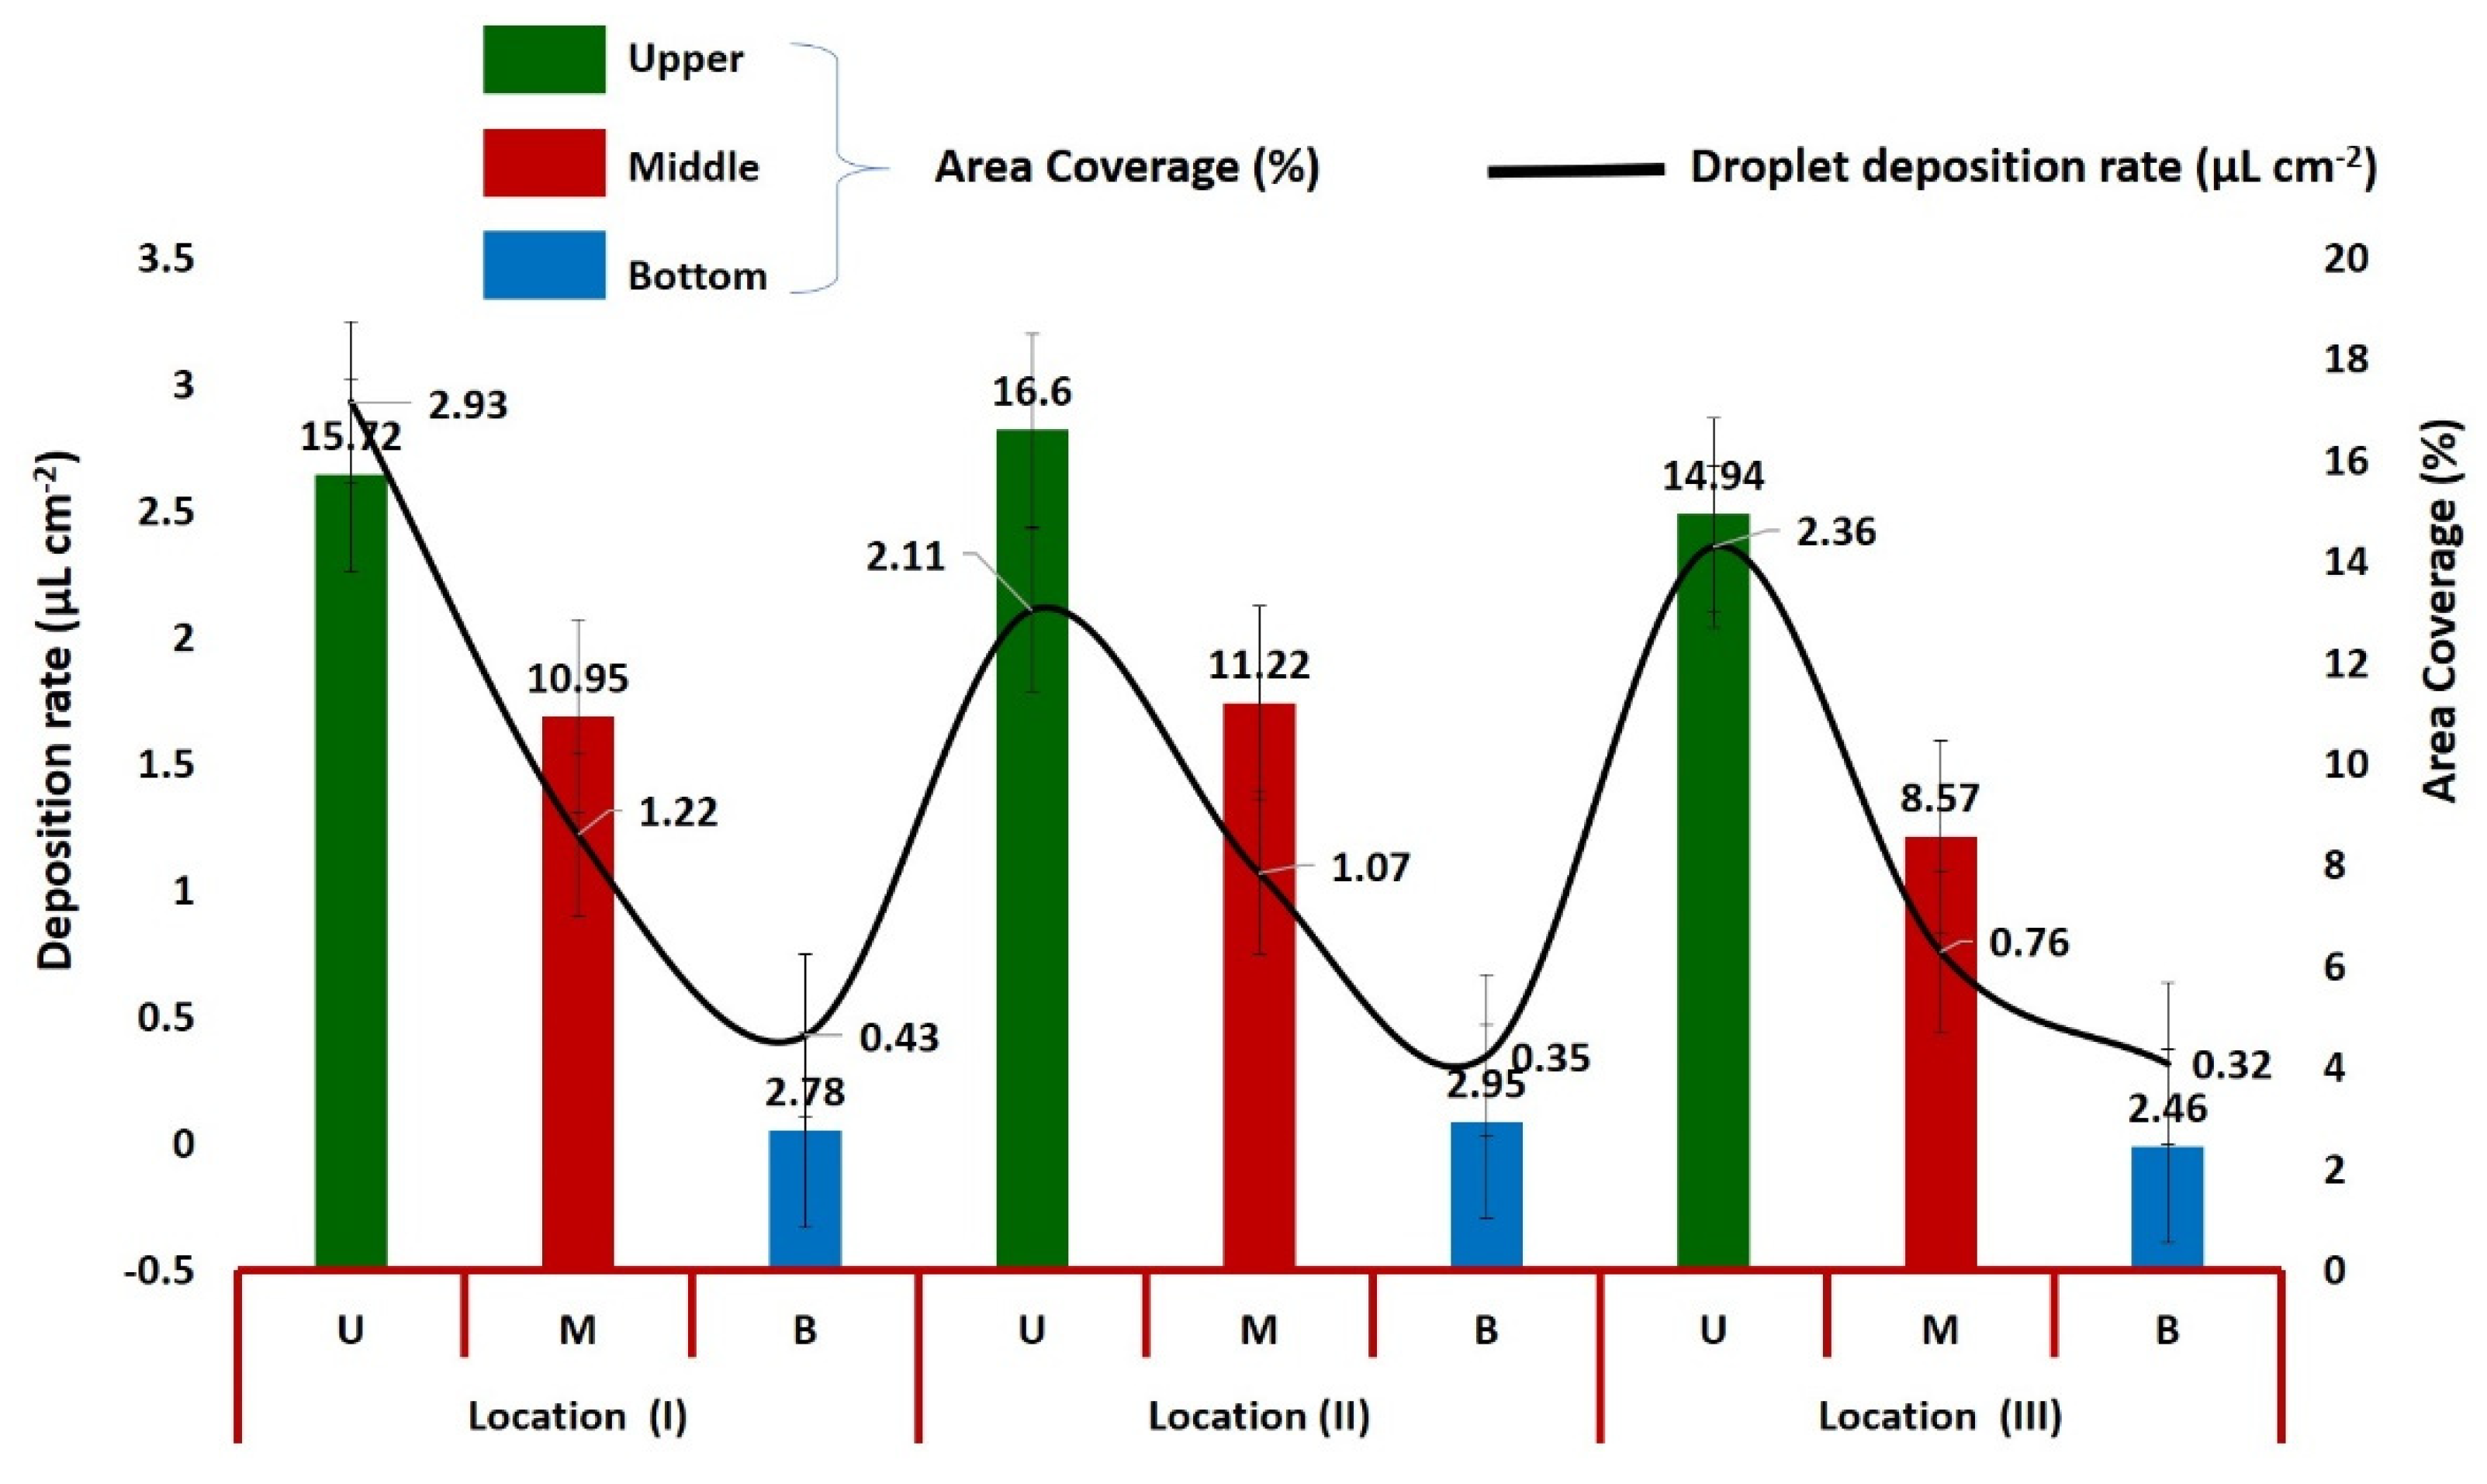
3.1. Distribution and Analysis of Spray Droplet Deposition Characteristics
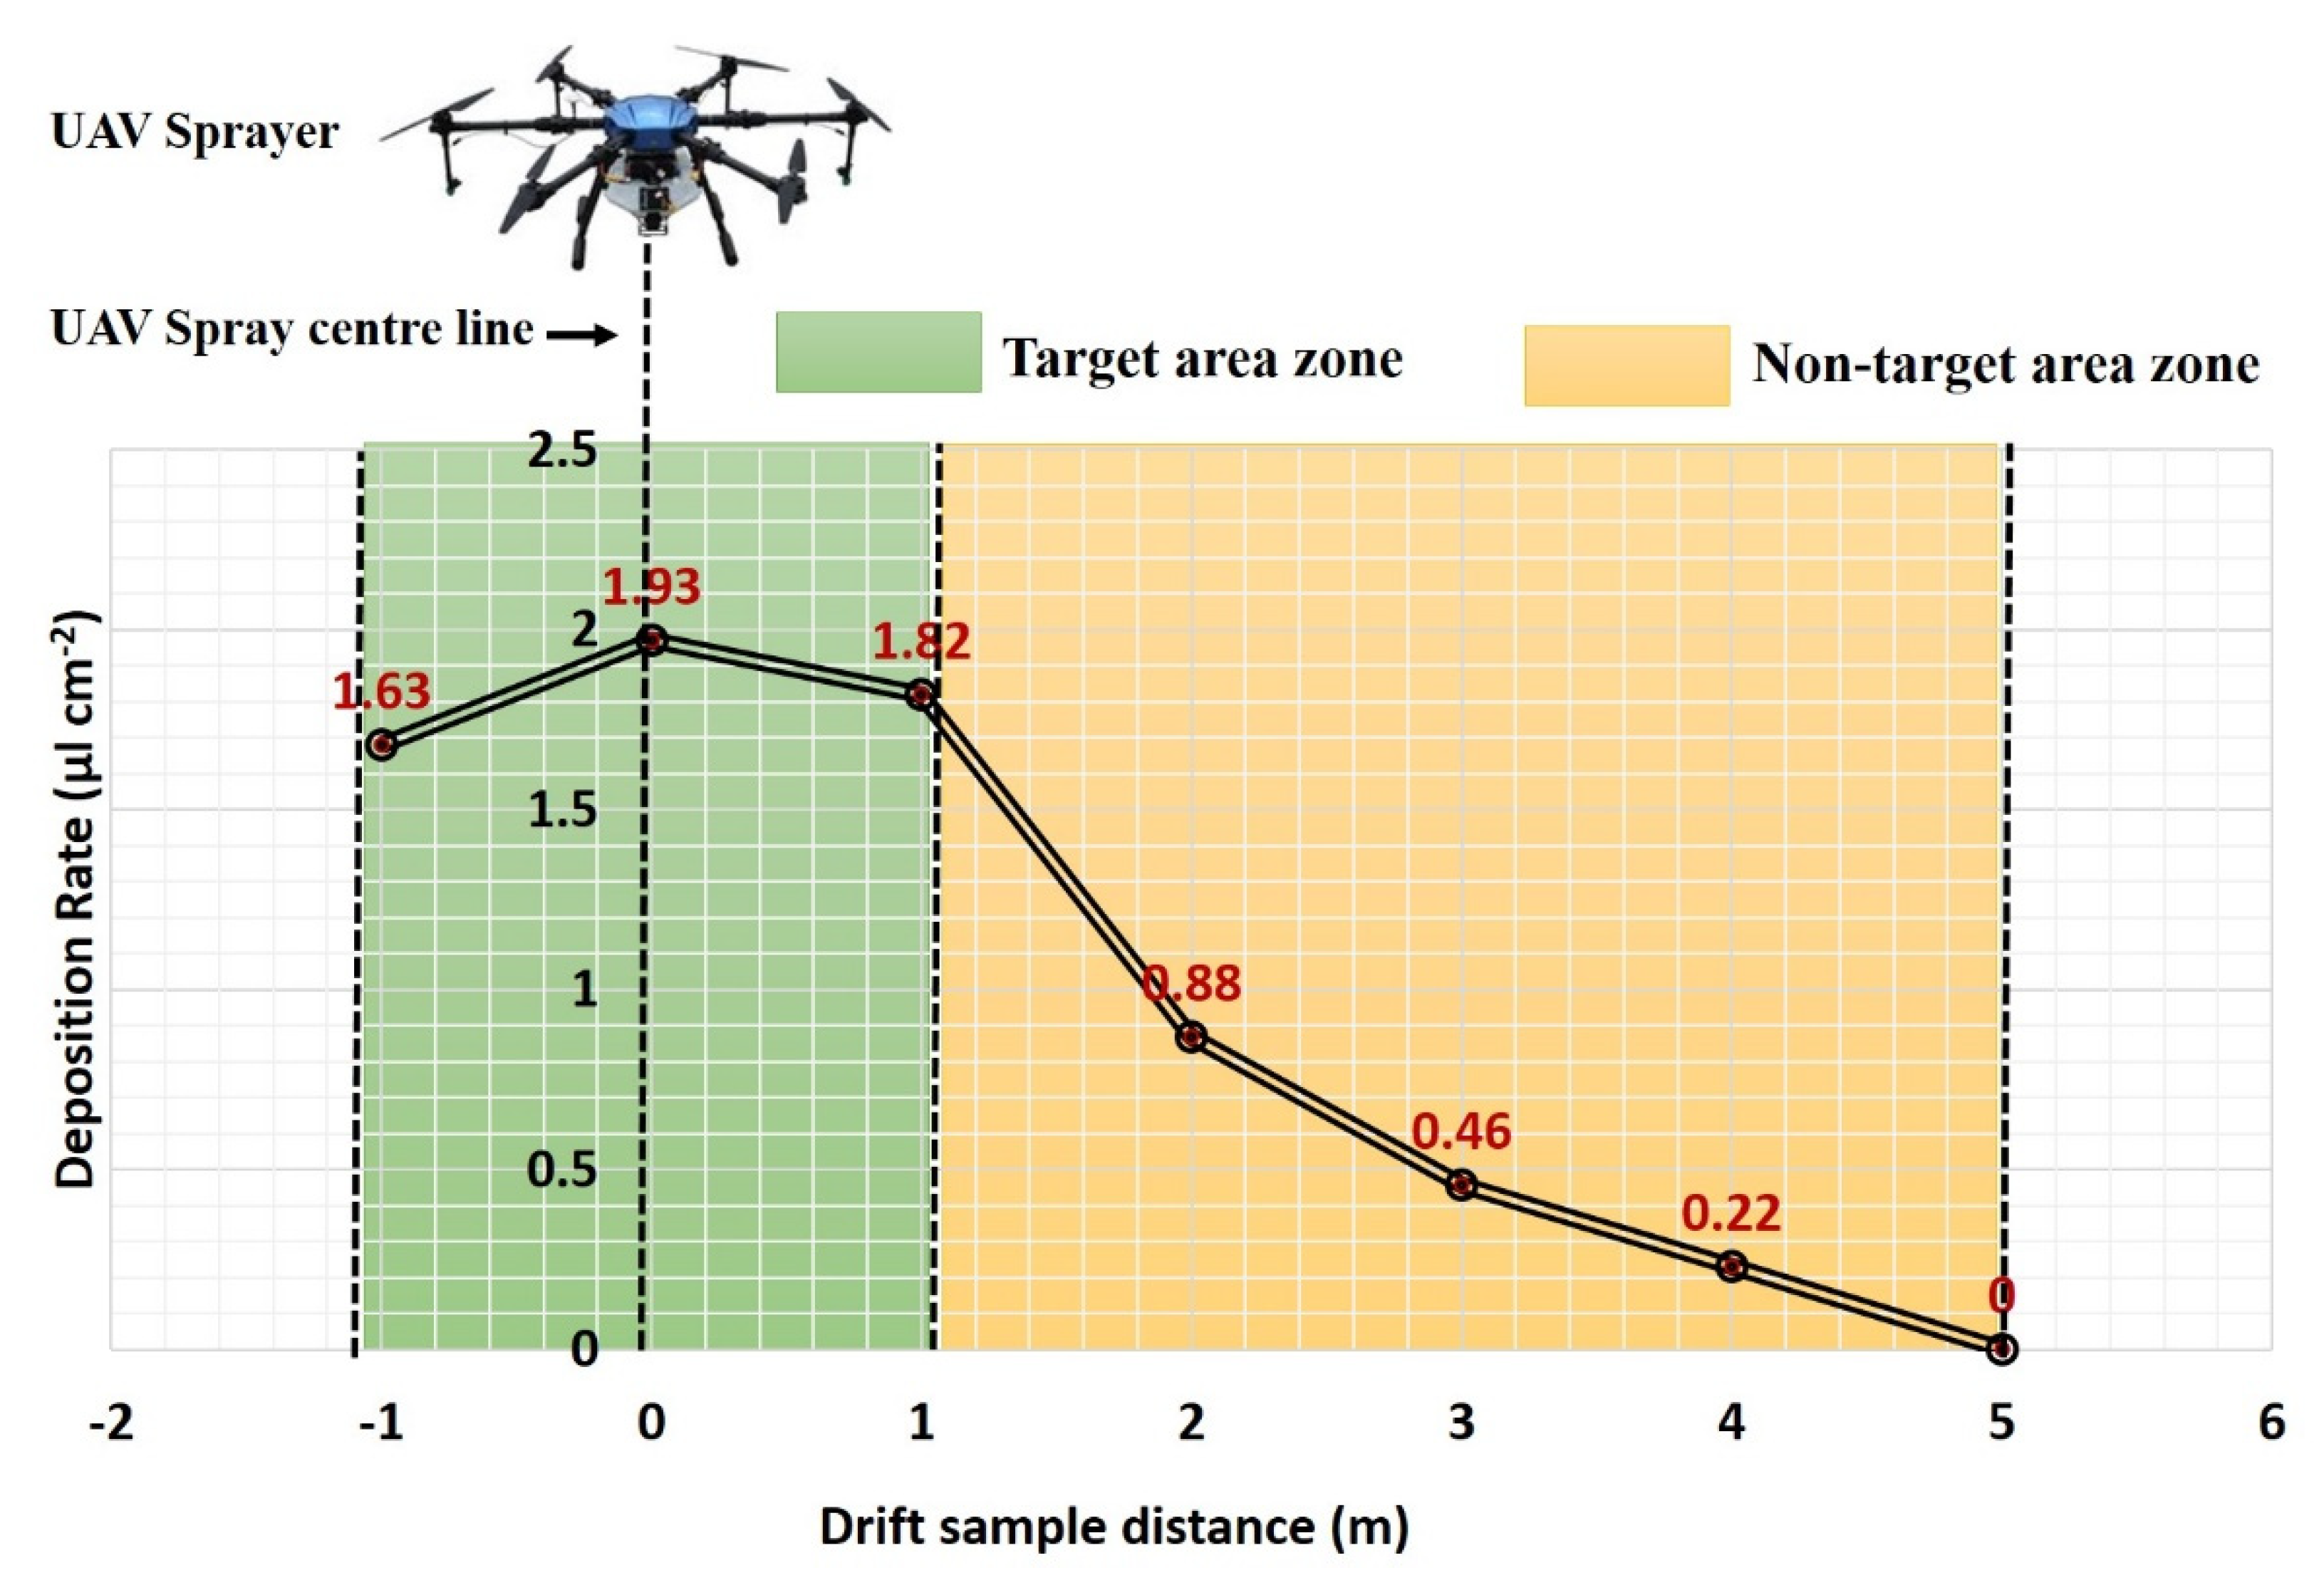
3.2. Effective Spray width and Application Rate of Chemical Usage
4. Conclusions
Author Contributions
Funding
Institutional Review Board Statement
Informed Consent Statement
Data Availability Statement
Acknowledgments
Conflicts of Interest
References
- Wang, G.; Han, Y.; Li, X.; Andaloro, J.; Chen, P.; Hoffmann, W.C.; Han, X.; Chen, S.; Lan, Y. Field evaluation of spray drift and environmental impact using an agricultural unmanned aerial vehicle (UAV) sprayer. Sci. Total Environ. 2020, 737, 139793. [Google Scholar] [CrossRef]
- Huang, H.; Deng, J.; Lan, Y.; Yang, A.; Deng, X.; Zhang, L. A fully convolutional network for weed mapping of unmanned aerial vehicle (UAV) imagery. PLoS ONE 2018, 13, e0196302. [Google Scholar] [CrossRef] [Green Version]
- Yao, W.; Wang, X.; Lan, Y.; Jin, J. Effect of UAV prewetting application during the flowering period of cotton on pesticide droplet deposition. Front. Agric. Sci. Eng. 2018, 5, 455–461. [Google Scholar] [CrossRef] [Green Version]
- Xiongkui, H.; Bonds, J.; Herbst, A.; Langenakens, J. Recent development of unmanned aerial vehicle for plant protection in East Asia. Int. J. Agric. Biol. Eng. 2017, 10, 18–30. [Google Scholar]
- Kirk, I.W. Aerial spray drift from different formulations of glyphosate. Trans. ASAE 2000, 43, 555. [Google Scholar] [CrossRef]
- Ru, Y.; Zhou, H.; Jia, Z.; Wu, X.; Fan, Q. Design and application of electrostatic spraying system. J. Nanjing For. Univ. (Nat. Sci. Ed.) 2011, 35, 91–94. [Google Scholar]
- Huang, Y.; Hoffmann, W.C.; Lan, Y.; Wu, W.; Fritz, B.K. Development of a spray system for an unmanned aerial vehicle platform. Trans. ASABE 2009, 25, 803–809. [Google Scholar] [CrossRef]
- Bozdogan, N.Y. Assessment of buffer zone for aquatic organisms in pesticide application. Int. J. Agric. Biol. Eng. 2016, 9, 227–234. [Google Scholar]
- Yang, S.H.; Zheng, Y.J.; Liu, X.X. Research status and trends of downwash airflow of spray UAVs in agriculture. Int J Precis Agric Aviat 2019, 2, 1–8. [Google Scholar] [CrossRef] [Green Version]
- Yang, S. Spray Droplet Deposition and Distribution Inside Crop Canopy and Control Efficiency Applied by Unmanned Aerial Vehicle. Ph.D. Thesis, Chinese Academy of Agricultural Sciences, Beijing, China, 2014; pp. 1–44, (In Chinese with English Abstract). [Google Scholar]
- Qing, T.; Ruirui, Z.; Liping, C.; Min, X.; Tongchuan, Y.; Bin, Z. Droplets movement and deposition of an eight-rotor agricultural UAV in downwash flow field. Int. J. Agric. Biol. Eng. 2017, 10, 47–56. [Google Scholar] [CrossRef]
- Wang, J.; Lan, Y.; Zhang, H.; Zhang, Y.; Wen, S.; Yao, W.; Deng, J. Drift and deposition of pesticide applied by UAV on pineapple plants under different meteorological conditions. Int. J. Agric. Biol. Eng. 2018, 11, 5–12. [Google Scholar] [CrossRef] [Green Version]
- He, X.; Zeng, A.; He, J. Effect of wind velocity from orchard sprayer on droplet deposit and distribution. Nongye Gongcheng Xuebao (Trans. Chin. Soc. Agric. Eng.) 2002, 18, 75–77. [Google Scholar]
- Liu, X.J.; Zhou, H.P.; Zheng, J.Q. Research advances of the technologies for spray drift control of pesticide application. Trans. CSAE 2005, 21, 186–190. [Google Scholar]
- Wang, X.; He, X.; Song, J.; Wang, Z.; Wang, C.; Wang, S.; Wu, R.; Meng, Y. Drift potential of UAV with adjuvants in aerial applications. Int. J. Agric. Biol. Eng. 2018, 11, 54–58. [Google Scholar] [CrossRef] [Green Version]
- Smith, D.B.; Bode, L.E.; Gerard, P.D. Predicting ground boom spray drift. Trans. ASAE 2000, 43, 547. [Google Scholar] [CrossRef]
- Fritz, B.K. Meteorological effects on deposition and drift of aerially applied sprays. Trans. ASABE 2006, 49, 1295–1301. [Google Scholar] [CrossRef]
- Zhang, J.; He, X.; Song, J.; Zeng, A.; Liu, Y.; Li, X. Influence of spraying parameters of unmanned aircraft on droplets deposition. Nongye Jixie Xuebao=Trans. Chin. Soc. Agric. Mach. 2012, 43, 94–96. [Google Scholar]
- An, J.; Xiang, W.; Han, Z.; Xiao, K.; Wang, Z.; Wang, X.; Li, Y. Validation of the Institute of Atmospheric Physics emergency response model with the meteorological towers measurements and SF6 diffusion and pool fire experiments. Atmos. Environ. 2013, 81, 60–67. [Google Scholar] [CrossRef]
- Gao, Y.Y. Study on distribution of pesticide droplets in gramineous crop canopy and control effect sprayed by unmanned aerial vehicle. Northeast Agric. Univ. Harbin, China 2013. [Google Scholar]
- Li, J.; Lan, Y.; Shi, Y. Research progress on airflow characteristics and field pesticide application system of rotary-wing UAV. Trans. Chin. Soc. Agric. Eng. 2018, 34, 104–118. [Google Scholar]
- Zhang, H.; Zheng, J.; Zhou, H.; Dorr, G.J. Droplet deposition distribution and off-target drift during pesticide spraying operation. Nongye Jixie Xuebao/Trans. Chin. Soc. Agric. Mach. 2017, 48, 114–122. [Google Scholar]
- He, Y.; Wu, J.J.; Fang, H.; Zheng, Q.S.; Xiao, S.P.; Cen, H.Y. Research on deposition effect of droplets based on plant protection unmanned aerial vehicle: A review. J. Zhejiang Univ. (Agric. Life Sci.) 2018, 44, 392–398. (In Chinese) [Google Scholar]
- Shengde, C.; Lan, Y.; Jiyu, L.; Zhiyan, Z.; Aimin, L.; Yuedong, M. Effect of wind field below unmanned helicopter on droplet deposition distribution of aerial spraying. Int. J. Agric. Biol. Eng. 2017, 10, 67–77. [Google Scholar]
- Chen, S.; Lan, Y.; Zhou, Z.; Ouyang, F.; Wang, G.; Huang, X.; Cheng, S. Effect of droplet size parameters on droplet deposition and drift of aerial spraying by using plant protection UAV. Agronomy 2020, 10, 195. [Google Scholar] [CrossRef] [Green Version]
- Hoffmann, W.C.; Hewitt, A.J. Comparison of three imaging systems for water-sensitive papers. Appl. Eng. Agric. 2005, 21, 961–964. [Google Scholar] [CrossRef]
- Liu, Q.; Chen, S.; Wang, G.; Lan, Y. Drift Evaluation of a Quadrotor Unmanned Aerial Vehicle (UAV) Sprayer: Effect of Liquid Pressure and Wind Speed on Drift Potential Based on Wind Tunnel Test. Appl. Sci. 2021, 11, 7258. [Google Scholar] [CrossRef]
- Berner, B.; Chojnacki, J. Use of drones in crop protection. In Proceedings of the IX International Scientific Symposium “Farm Machinery and Processes Management in Sustainable Agriculture”, Lublin, Poland, 22–24 November 2017. [Google Scholar]
- Fritz, B.K.; Kirk, I.W.; Hoffmann, W.C.; Martin, D.E.; Hofman, V.L.; Hollingsworth, C.; McMullen, M.; Halley, S. Aerial application methods for increasing spray deposition on wheat heads. Appl. Eng. Agric. 2006, 22, 357–364. [Google Scholar] [CrossRef]
- Lou, Z.; Xin, F.; Han, X.; Lan, Y.; Duan, T.; Fu, W. Effect of unmanned aerial vehicle flight height on droplet distribution, drift and control of cotton aphids and spider mites. Agronomy 2018, 8, 187. [Google Scholar] [CrossRef] [Green Version]
- Dixon, D.; Boon, S.; Silins, U. Watershed-scale controls on snow accumulation in a small montane watershed, southwestern Alberta, Canada. Hydrol. Process. 2014, 28, 1294–1306. [Google Scholar] [CrossRef]
- Salcedo, R.; Garcera, C.; Granell, R.; Molto, E.; Chueca, P. Description of the airflow produced by an air-assisted sprayer during pesticide applications to citrus. Span. J. Agric. Res. 2015, 13, e0208. [Google Scholar] [CrossRef] [Green Version]
- Ling, W.; Du, C.; Mengchao, Z.; Yu, W.; Ze, Y.; Shumao, W. CFD simulation of low-attitude droplets deposition characteristics for UAV based on multi-feature fusion. IFAC-Pap. 2018, 51, 648–653. [Google Scholar] [CrossRef]
- Li, J.; Shi, Y.; Lan, Y.; Guo, S. Vertical distribution and vortex structure of rotor wind field under the influence of rice canopy. Comput. Electron. Agric. 2019, 159, 140–146. [Google Scholar] [CrossRef]
- Xinyu, X.; Kang, T.; Weicai, Q.; Yubin, L.; Huihui, Z. Drift and deposition of ultra-low altitude and low volume application in paddy field. Int. J. Agric. Biol. Eng. 2014, 7, 23–28. [Google Scholar]
- Yang, F.; Xue, X.; Cai, C.; Sun, Z.; Zhou, Q. Numerical simulation and analysis on spray drift movement of multirotor plant protection unmanned aerial vehicle. Energies 2018, 11, 2399. [Google Scholar] [CrossRef] [Green Version]
- Bergeron, V. Designing intelligent fluids for controlling spray applications. Comptes Rendus Phys. 2003, 4, 211–219. [Google Scholar] [CrossRef]
- Choi, D.S.; Ma, K.C.; Kim, H.J.; Lee, J.H.; Oh, S.A.; Kim, S.G. Control standards of three major insect pests of Chinese cabbage (Brassica campestris) using drones for pesticide application. Korean J. Appl. Entomol. 2018, 57, 347–354. [Google Scholar]
- Lan, Y.; Qian, S.; Chen, S.; Zhao, Y.; Deng, X.; Wang, G.; Qiu, X. Influence of the Downwash Wind Field of Plant Protection UAV on Droplet Deposition Distribution Characteristics at Different Flight Heights. Agronomy 2021, 11, 2399. [Google Scholar] [CrossRef]
- Teske, M.E.; Bird, S.L.; Esterly, D.M.; Curbishley, T.B.; Ray, S.L.; Perry, S.G. AgDrift®: A model for estimating near-field spray drift from aerial applications. Environ. Toxicol. Chem. Int. J. 2002, 21, 659–671. [Google Scholar] [CrossRef]
- Bilanin, A.J.; Teske, M.E.; Barry, J.W.; Ekblad, R.B. AGDISP: The aircraft spray dispersion model, code development and experimental validation. Trans. ASAE 1989, 32, 327–0334. [Google Scholar] [CrossRef]
- Bache, D.H.; Sayer, W.J.D. Transport of aerial spray, I. A model of aerial dispersion. Agric. Meteorol. 1975, 15, 257–271. [Google Scholar] [CrossRef]
- Miller, P.C.H.; Ellis, M.B. A review of spray generation, delivery to the target and how adjuvants influence the process. Plant Prot. Q. 1997, 12, 33–38. [Google Scholar]
- Guo, S.; Li, J.; Yao, W.; Zhan, Y.; Li, Y.; Shi, Y. Distribution characteristics on droplet deposition of wind field vortex formed by multi-rotor UAV. PLoS ONE 2019, 14, 22–24. [Google Scholar] [CrossRef] [Green Version]
- Martin, D.; Singh, V.; Latheef, M.A.; Bagavathiannan, M. Spray deposition on weeds (Palmer amaranth and Morningglory) from a remotely piloted aerial application system and backpack sprayer. Drones 2020, 4, 59. [Google Scholar] [CrossRef]
- Wen, S.; Zhang, Q.; Yin, X.; Lan, Y.; Zhang, J.; Ge, Y. Design of plant protection UAV variable spray system based on neural networks. Sensors 2019, 19, 1112. [Google Scholar] [CrossRef]
- S386; ASABE Standards. Spray Nozzle Classification by Droplet Spectra—Forages. ASABE: St. Joseph, MI, USA, 2004.
- Zhu, H.; Salyani, M.; Fox, R.D. A portable scanning system for evaluation of spray deposit distribution. Comput. Electron. Agric. 2011, 76, 38–43. [Google Scholar] [CrossRef]
- Whitney, R.W.; Gardisser, D.R. DropletScan Operators Manual; WRK of Oklahoma and WRK of Arkansas: Stillwater, OK, USA, 2003. [Google Scholar]
- Martin, D.E. A fluorescent imaging technique for quantifying spray deposits on plant leaves. At. Sprays 2014, 24, 367–373. [Google Scholar] [CrossRef] [Green Version]
- Zhang, X.Q.; Song, X.P.; Liang, Y.J.; Qin, Z.Q.; Zhang, B.Q.; Wei, J.J.; Li, Y.R.; Wu, J.M. Effects of spray parameters of drone on the droplet deposition in sugarcane canopy. Sugar Tech 2020, 22, 583–588. [Google Scholar] [CrossRef]
- S386.2; ASABE Standards. Calibration and Distribution Pattern Testing of Agricultural Aerial Application Equipment. ASABE: St. Joseph, MI, USA, 2018.
- Yang, Z.; Qi, L.; Wu, Y. Influence of UAV rotor down-wash airflow for droplet penetration. In 2018 ASABE Annual International Meeting; American Society of Agricultural and Biological Engineers: St. Joseph, MI, USA, 2018; p. 1. [Google Scholar]
- Fengbo, Y.; Xinyu, X.; Ling, Z.; Zhu, S. Numerical simulation and experimental verification on downwash air flow of six-rotor agricultural unmanned aerial vehicle in hover. Int. J. Agric. Biol. Eng. 2017, 10, 41–53. [Google Scholar] [CrossRef] [Green Version]
- Wen, S.; Han, J.; Ning, Z.; Lan, Y.; Yin, X.; Zhang, J.; Ge, Y. Numerical analysis and validation of spray distributions disturbed by quad-rotor drone wake at different flight speeds. Comput. Electron. Agric. 2019, 166, 105036. [Google Scholar] [CrossRef]
- Zheng, Y.; Yang, S.; Liu, X.; Wang, J.; Norton, T.; Chen, J.; Tan, Y. The computational fluid dynamic modeling of downwash flow field for a six-rotor UAV. Front. Agric. Sci. Eng. 2018, 5, 159–167. [Google Scholar] [CrossRef] [Green Version]
- Yang, S.; Liu, X.; Chen, B.; Li, S.; Zheng, Y. CFD models and verification of the downwash airflow of an eight-rotor UAV. In 2019 ASABE Annual International Meeting; American Society of Agricultural and Biological Engineers: St. Joseph, MI, USA, 2019; p. 1. [Google Scholar]
- Bird, S.L.; Esterly, D.M.; Perry, S.G. Off-Target Deposition of Pesticides from Agricultural Aerial Spray Applications; American Society of Agronomy, Crop Science Society of America, Soil Science Society of America: Madison, WI, USA, 1996; Volume 25, pp. 1095–1104. [Google Scholar]
- Nuyttens, D.; De Schampheleire, M.; Baetens, K.; Sonck, B. The influence of operator-controlled variables on spray drift from field crop sprayers. Trans. ASABE 2007, 50, 1129–1140. [Google Scholar] [CrossRef]
- Ferguson, J.C.; Chechetto, R.G.; Hewitt, A.J.; Chauhan, B.S.; Adkins, S.W.; Kruger, G.R.; O’Donnell, C.C. Assessing the deposition and canopy penetration of nozzles with different spray qualities in an oat (Avena sativa L.) canopy. Crop Prot. 2016, 81, 14–19. [Google Scholar] [CrossRef]
- Hoffmann, W.C.; Hewitt, A.J.; Barber JA, S.; Kirk, I.W.; Brown, J.R. Field Swath and Drift Analyses Techniques; Paper Number: AA03-007; U.S. Department of Agriculture: Washington, DC, USA, 2003.


| Main Parameter | Norms and Numerical Value |
|---|---|
| Type | Hexacopter |
| Item model | E610P |
| Unfold fuselage size, (L × W × H), mm | 2000 × 1800 × 670 |
| Folding size, (L × W × H), mm | 950 × 850 × 670 |
| Power source | 12S 160,000 mAh LiPo Battery |
| Payload capacity, L | 10 |
| Self-weight, kg | 6.9 |
| Take-off weight, kg | 26 |
| Flight height, m | 1–20 |
| Forward travel speed, ms−1 | 0–8 |
| Type of spray nozzle | Flat fan shape (2020A-132 series) |
| Number of nozzles | 4 |
| Discharge rate, l m−1 | 0–3.2 |
| Swath width of spray, m | 3–5 |
| Liquid pressure, kg cm−2 | 3.4 |
| Remote controller distance, km | 1.5 |
| No-load flight time, min | 25 |
| Charging time, min | 90 |
| Crop Parameters | |
|---|---|
| Crop | Redgram |
| Variety | Co8 |
| Plot size (L × W), mm | 70 × 40 |
| Height of crop, m | 1.9 to 2.3 |
| Stage of crop | >110 DAS |
| Row to row spacing, m | 0.70 to 0.74 |
| Plant-to-plant spacing, m | 0.15 to 0.21 |
| Operational Parameters | Norms and Numerical Values |
|---|---|
| Forward speed, ms−1 | 3 |
| Height of spray, m | 1.6 |
| Swatch width of spray, m | 3.8 |
| Discharge rate, l m−1 | 3.2 |
| Liquid pressure, kg cm−2 | 3.4 |
| Date | 8 December 2021 | |
|---|---|---|
| Time | 08:30 a.m. to 09:45 a.m. | |
| Location | Redgram research field (N11.01, E76.92), TNAU, Coimbatore, Tamil Nadu state, India | |
| Environmental parameters | Air temperature, ° C | 22.4 to 26.6° |
| Relative humidity, % | 56.2 to 61.1 | |
| Wind velocity, ms−1 | 0.92 to 1.24 | |
| 1.93 to 2.47 (drift experiment) | ||
| Rainfall, mm | 0 | |
| WSP Position | Location of WSP | Spray Droplet Size (µm) | Droplet Density (No’s cm−2) | ||
|---|---|---|---|---|---|
| Dv0.1 | Dv0.5 | Dv0.9 | |||
| Upper | U1 | 200 ± 9.45 | 423 ± 5.03 | 508 ± 5.69 | 47 ± 4.04 |
| U2 | 223 ± 5.29 | 472 ± 2.65 | 622 ± 3.00 | 53 ± 3.61 | |
| U3 | 236 ± 4.36 | 492 ± 5.57 | 724 ± 6.51 | 52 ± 8.74 | |
| Middle | M1 | 239 ± 2.65 | 424 ± 2.08 | 537 ± 6.11 | 42 ± 2.52 |
| M2 | 241 ± 6.24 | 484 ± 3.00 | 686 ± 4.16 | 43 ± 8.50 | |
| M3 | 134 ± 3.06 | 304 ± 3.06 | 656 ± 4.58 | 38 ± 2.52 | |
| Bottom | B1 | 219 ± 4.00 | 372 ± 4.51 | 754 ± 3.51 | 22 ± 4.36 |
| B2 | 213 ± 3.61 | 355 ± 4.00 | 635 ± 4.04 | 17 ± 3.51 | |
| B3 | 282 ± 9.54 | 394 ± 4.58 | 742 ± 3.61 | 19 ± 4.51 | |
| Sample Zone | Drift Sample Distance (m) | Droplet Density (No’s cm−2) |
|---|---|---|
| Target area | −1.0 | 46 ± 3.61 |
| 0.0 | 54 ± 2.08 | |
| 1.0 | 45 ± 3.21 | |
| Non-target area | 2.0 | 23 ± 1.53 |
| 3.0 | 11 ± 2.08 | |
| 4.0 | 6 ± 1.53 | |
| 5.0 | 0.00 |
Publisher’s Note: MDPI stays neutral with regard to jurisdictional claims in published maps and institutional affiliations. |
© 2022 by the authors. Licensee MDPI, Basel, Switzerland. This article is an open access article distributed under the terms and conditions of the Creative Commons Attribution (CC BY) license (https://creativecommons.org/licenses/by/4.0/).
Share and Cite
Dengeru, Y.; Ramasamy, K.; Allimuthu, S.; Balakrishnan, S.; Kumar, A.P.M.; Kannan, B.; Karuppasami, K.M. Study on Spray Deposition and Drift Characteristics of UAV Agricultural Sprayer for Application of Insecticide in Redgram Crop (Cajanus cajan L. Millsp.). Agronomy 2022, 12, 3196. https://doi.org/10.3390/agronomy12123196
Dengeru Y, Ramasamy K, Allimuthu S, Balakrishnan S, Kumar APM, Kannan B, Karuppasami KM. Study on Spray Deposition and Drift Characteristics of UAV Agricultural Sprayer for Application of Insecticide in Redgram Crop (Cajanus cajan L. Millsp.). Agronomy. 2022; 12(12):3196. https://doi.org/10.3390/agronomy12123196
Chicago/Turabian StyleDengeru, Yallappa, Kavitha Ramasamy, Surendrakumar Allimuthu, Suthakar Balakrishnan, Ayyasamy Paramasivam Mohan Kumar, Balaji Kannan, and Kalarani Muthusami Karuppasami. 2022. "Study on Spray Deposition and Drift Characteristics of UAV Agricultural Sprayer for Application of Insecticide in Redgram Crop (Cajanus cajan L. Millsp.)" Agronomy 12, no. 12: 3196. https://doi.org/10.3390/agronomy12123196
APA StyleDengeru, Y., Ramasamy, K., Allimuthu, S., Balakrishnan, S., Kumar, A. P. M., Kannan, B., & Karuppasami, K. M. (2022). Study on Spray Deposition and Drift Characteristics of UAV Agricultural Sprayer for Application of Insecticide in Redgram Crop (Cajanus cajan L. Millsp.). Agronomy, 12(12), 3196. https://doi.org/10.3390/agronomy12123196