Article

Physiological Response of Pea (Pisum sativum L.) Plants to Foliar Application of Biostimulants

Department of Crop Production, University of Rzeszow, A. Zelwerowicza 4 Str., 35-601 Rzeszow, Poland
Agronomy 2022, 12(12), 3189; https://doi.org/10.3390/agronomy12123189
Submission received: 16 November 2022 / Revised: 10 December 2022 / Accepted: 14 December 2022 / Published: 15 December 2022

Abstract

:
The use of biostimulants in crop production can be an economically viable option for farmers and enable them to meet the increasing quality standards of agricultural products and consumer expectations for sustainability and environmental protection. The aim of this study was to determine the effect of foliar application of biostimulants on the course of physiological processes in pea (Pisum sativum L.) plants. Field studies with conventional fertilizers/biostimulants of plant origin (N1) and an ecological biostimulant of animal origin (N2) in the cultivation of eight pea varieties were carried out in the years 2015–2017 in south-eastern Poland. With favorable weather conditions during the flowering and pod setting period, as a result of N1 and N2 fertilization, in the BBCH 65 and BBCH 79 phases, there was a significant increase in the relative Chl content, Chl fluorescence parameters (Fv/Fm, Fv/F0, PI) and gas exchange (Pn, E, gs), measured in pea bracts. The relative content of Chl and the course of physiological processes in the plant were more favorably affected by N1 fertilization. Our data also confirm the beneficial effect of N2 application, but weaker than N1, which was determined by the strong negative reaction of plants to N2 fertilization in 2016, with rainfall shortages in the flowering and pod development phases. The experiment showed that in favorable weather conditions the applied foliar preparations have a positive effect on the physiological processes occurring in the plant, but in drought conditions they do not significantly mitigate its negative effects.

1. Introduction

In modern agriculture, in addition to conventional foliar fertilizers containing macro- and micronutrients, biostimulants are increasingly used. Recently, in accordance with EU Regulation 2019/1009 [1], biostimulants have been included in fertilizers, divided into microbial and non-microbial. It is a diverse group of compounds that can be obtained based on various raw materials, including humic substances (HS), complex organic materials, chemical elements, peptides and amino acids, inorganic salts, seaweed extracts, chitin and chitosan derivatives, antitranspirants, amino acids and other N-containing substances) or microorganisms that have a positive effect on plant growth, yield and chemical composition, and also increase plant tolerance to stress. To date, six distinct categories of biostimulants have been identified, including microbial modifiers, humic substances such as humic and fulvic acids, protein hydrolysates and amino acids, biopolymers, inorganic compounds and seaweed extracts, all of which are commercially available and widely used in agriculture [2,3]. The most important biostimulants include: vegetable or animal protein hydrolysates and other N-containing compounds, humic substances, seaweed extracts, biopolymers, compounds of microbial origin, phosphites and silicon (Si). They are increasingly used to regulate/modify physiological processes in plants and thus stimulate growth, relieve stress caused by biotic and abiotic factors, and increase yields. The use of biostimulators allows for an increase in biomass production and has a positive effect on the content of nutrients in tissues [3,4,5,6,7,8,9,10,11,12].
Among various functions, biostimulants affect plant growth and N metabolism, especially due to their content of hormones and other signaling molecules [2]. Mechanisms related to the protective effect of biostimulators vary depending on the compound and/or the crop and mainly concern the stimulation of physiological processes and morphological features of plants. They have a positive effect on the activity and gene expression of enzymes functioning in the primary and secondary metabolism of plants. In plants treated with biostimulators, a significant increase in the length and density of root hairs is often observed, which promotes increased nutrient uptake by plants due to increased absorption surface [2,13], improved seed germination and higher yield of plants, increased cation exchange, reduced leaching, detoxification of heavy metals, stimulation of mechanisms involved in stomatal conduction and transpiration, and stimulation of plant immune systems against stressors [13]. Most of these effects can be attributed to the auxin-like effect of biostimulants, as well as improved N uptake and metabolism, regulation of the K/Na ratio, and accumulation of proline, which as an osmoprotectant protects plants from salinity stress [14]. Biostimulant compounds can also have a positive effect on soil biology and the restoration of degraded ecosystems [15]. Szparaga et al. [16] on the example of soybean, Kocira et al. [17] on the example of beans and Sulewska et al. [18], on the example of peas, showed that plant growth, their biometric features, as well as seed yield and quality depend not only on the type of biostimulant, but also its concentration, number of applications and weather conditions.
The use of biostimulators can be an effective and sustainable supplement to the plant’s demand for nutrients as a substitute for mineral fertilizers and mitigate environmental problems associated with excessive mineral fertilization [19,20]. In a situation where the agricultural industry is experiencing an unprecedented increase in the prices of fertilizers [21], the use of biostimulants can contribute to reducing the consumption of agricultural inputs and lowering production costs. Biostimulators are also recommended in the organic farming system [22]. However, there is still a lack of research fully explaining the mechanisms of action of biostimulants, how plants react to such biological substances and how they affect physiological processes [23]. Moreover, for best results, biostimulants require individualized application strategies at specific times and in optimal doses, depending on the crop and variety [24].
The appearance of stress factors during the growing season causes physiological changes in plants. To prevent water loss and delay photosynthesis, plants close their stomata, which leads to inhibition of metabolic processes. A noninvasive method of assessing the state of PSII is the measurement of chlorophyll fluorescence, which is considered a very sensitive method of assessing the physiological state of plants and an indicator of plant response to various environmental stresses [12,25,26]. Another effective method of determining the response of plants to stress is the measurement of gas exchange [12,27], one of the most important physiological processes in the plant, as nearly 90% of the accumulated biomass depends on the intensity of the photosynthesis process [28,29].
The pea (Pisum sativum L.) belongs to the Fabaceae family. It is a popular protein-rich legume that is used as animal feed and human food [30]. Pea seeds are a protein material that can be an alternative to post-extraction soybean meal used in feed [31,32,33]. In Poland, pea is one of the most important thick-seed legume plants due to its suitability for various directions of cultivation and the possibility of multi-directional use (edible for dry seeds, for fodder: for dry seeds and green mass) and high yield potential. Owing to the symbiosis with Rhizobium bacteria, peas can fix atmospheric nitrogen, which can help reduce production costs by reducing the amount of mineral nitrogen fertilizers used [34].
Taking into account numerous literature reports on foliar fertilization and its impact on various crops, the research hypothesis assumed that foliar fertilization with preparations classified to the broadly defined group of biostimulators can stimulate the course of physiological processes in the pea plant. The aim of the study was to determine the effect of foliar fertilization with biostimulators of plant and animal origin on the course of physiological processes in plants of selected varieties of pea (Pisum sativum L.).

2. Materials and Methods

2.1. Experimental Site

The field experiment was conducted at the Experimental Station of Podkarpacki Agricultural Advisory Centre in Boguchwała (southeastern Poland, 49°59′ N, 21°57′ E), from 2015 to 2017.
According to the FAO/WRB classification [35], the soil was Haplic Cambisol (Eutric) formed from loess. Prior to the experiment, soil properties of the top 0–30 cm soil layer were pHH2O 6.73, pHHCl 5.7, 1.09 g kg−1 soil organic carbon. Soil contents of available forms of P2O5 and K2O were very high, Mg was low (2015 and 2017) or medium (2016), B was low, and Mn, Zn, Fe were medium.
The weather conditions were given in accordance with the records of the meteorological station at the Podkarpackie Agricultural Advisory Center in Boguchwała (Figure 1). In 2015, 2016 and 2017, the sum of precipitation during the pea growing season (April–August) was lower by 45.1% (170.6 mm), 22.4% (84.5 mm) and 9.6%, respectively (36.3 mm), and the average air temperature higher by 1.3, 0.7 and 0.5 °C, respectively, compared to the long-term average. Hydrothermal conditions during the pea growing season, described using the hydrothermal coefficient (K), indicate a high variability of the weather course in years as well as in individual months. Extremely dry and very dry hydrothermal conditions occurred in June and August 2015 and June 2016, while March 2015 and 2016 were considered very wet and extremely wet.

2.2. Experimental Design and Crop Management

The experimental design was a randomized block design considered of twenty-four combinations in four replications. The plot area was 16.5 m2. Mineral soil fertilization was carried out pre-sowing at doses (kg·ha−1): N-5, P-26, K-75.
Eight varieties of field peas (white-flowered, narrow-leafed) were included in the experiment: Akord, Batuta, Cysterski, Aesop, Lasso, Mecenas, Mentor, Tarchalska, which were foliar fertilized with conventional fertilizers/biostimulants of plant origin (N1) and ecological biostimulator of animal origin (N2). In the N1 variant, the following were used: biostimulators complexed with humic acids BioFol Plex (BBCH 51–55, 2.0 L·ha−1) and Biofol Mag (BBCH 61–65, 1.0 L·ha−1), fertilizers complexed with humic acids MultiFol Mag (BBCH 51–55, 1.5 L·ha−1) and fertilizer GranuFol CuMan (BBCH 51–55, 0.52 kg·ha−1) (BIOSTYMA Sp. z o.o, Września, Poland), however in N2 variant: organic fertilizer NaturalCrop®SL-enzymatic L-amino acid concentrate, with a high concentration of biologically active polypeptides, peptides and amino acids (BBCH 51–55, 1.0 L·ha−1 and BBCH 51–55, 1.0 L·ha−1) (Natural Crop Poland Sp. z o.o., Warszawa, Poland). Detailed composition, doses and dates of application of foliar preparations are given in the work of Szpunar-Krok et al. [37]. The effects of the foliar preparations were related to controls where the plants were sprayed with the same amount of pure water. Spraying was carried out using a GARLAND FUM 12B battery backpack sprayer (Lechler LU 120–03 sprayer, Lechler GmbH, Metzingen, Germany; working pressure 0.30 MPa, spray liquid consumption 300 dm3∙ha−1).
In all years of the study, the pea cultivars tested were sown between 23 March and 6 April, at a sowing density of 100 seeds∙m−2 with a row spacing of 20 cm, to a depth of 4–6 cm, and winter wheat was the forecrop. The plants were harvested between 26 July and 5 August.

2.3. Physiological Measurements

Physiological measurements were performed twice, in BBCH 65 phases (Full flowering: 50% of flowers open) and BBCH 79 (pods have reached typical size (green ripe); peas fully formed), on the first fully developed pea bract. The following measurements were made:
-
relative chlorophyll (Chl) content (CCI unit)—on 20 randomly selected bracts in each plot, using a Chlorophyll Content Meter CCM-200plus (Opti-Sciences, Hudson, NH, USA),
-
chlorophyll (Chl) fluorescence (Fv/Fm—maximum efficiency of PSII, Fv/F0-the maximum quantum yield of primary photochemistry, PI—performance index) on 8 randomly selected pea bracts on each plot, on the adaxial bract lamina after 30 min of adaptation to darkness [24], using a continuous excitation Handy Pocket PEA fluorimeter equipped with leaf-clips (Pocket PEA, Hansatech Instruments, King’s Lynn, Norfolk, UK); a PEA plus (1.10) program was then used to export Chl fluorescence signals,
-
gas exchange (Pn—intensity of photosynthesis net, E—transpiration rate, gs—stomatal conductance, Ci—intracellular CO2 concentration), on 4 randomly selected plants in each plot, using the Portable Photosynthesis Measurement System LCpro-SD (ADC BioScientific Ltd., Hoddesdon, UK). In the determination process, the light intensity was 1500 mol m−2 s−1. The LCpro-SD plant leaf photosynthesis chamber has a flow rate accuracy of ±2% of its range.

2.4. Statistical Analysis

The results were statistically analyzed according to the TIBCO Statistica 13.3.0 (TIBCO Software Inc., Palo Alto, CA, USA) program. In order to check the normality of the distribution at α = 0.05, the Shapiro–Wilk test was performed. The homogeneity of variance was also checked. A three-way analysis of variance (ANOVA) was performed to determine the effects of year, fertilization and cultivar, as well as all interactions on the relative Chl content and selected parameters of Ch fluorescence and gas exchange. Then, a two-way ANOVA test with repeated measurements was used (with time evaluation as a factor). The least significant difference was calculated with the Tukey test at α ≤ 0.05. Mean values and standard deviations were calculated for all observed features.

3. Results

3.1. Relative Chlorophyll (Chl) Content

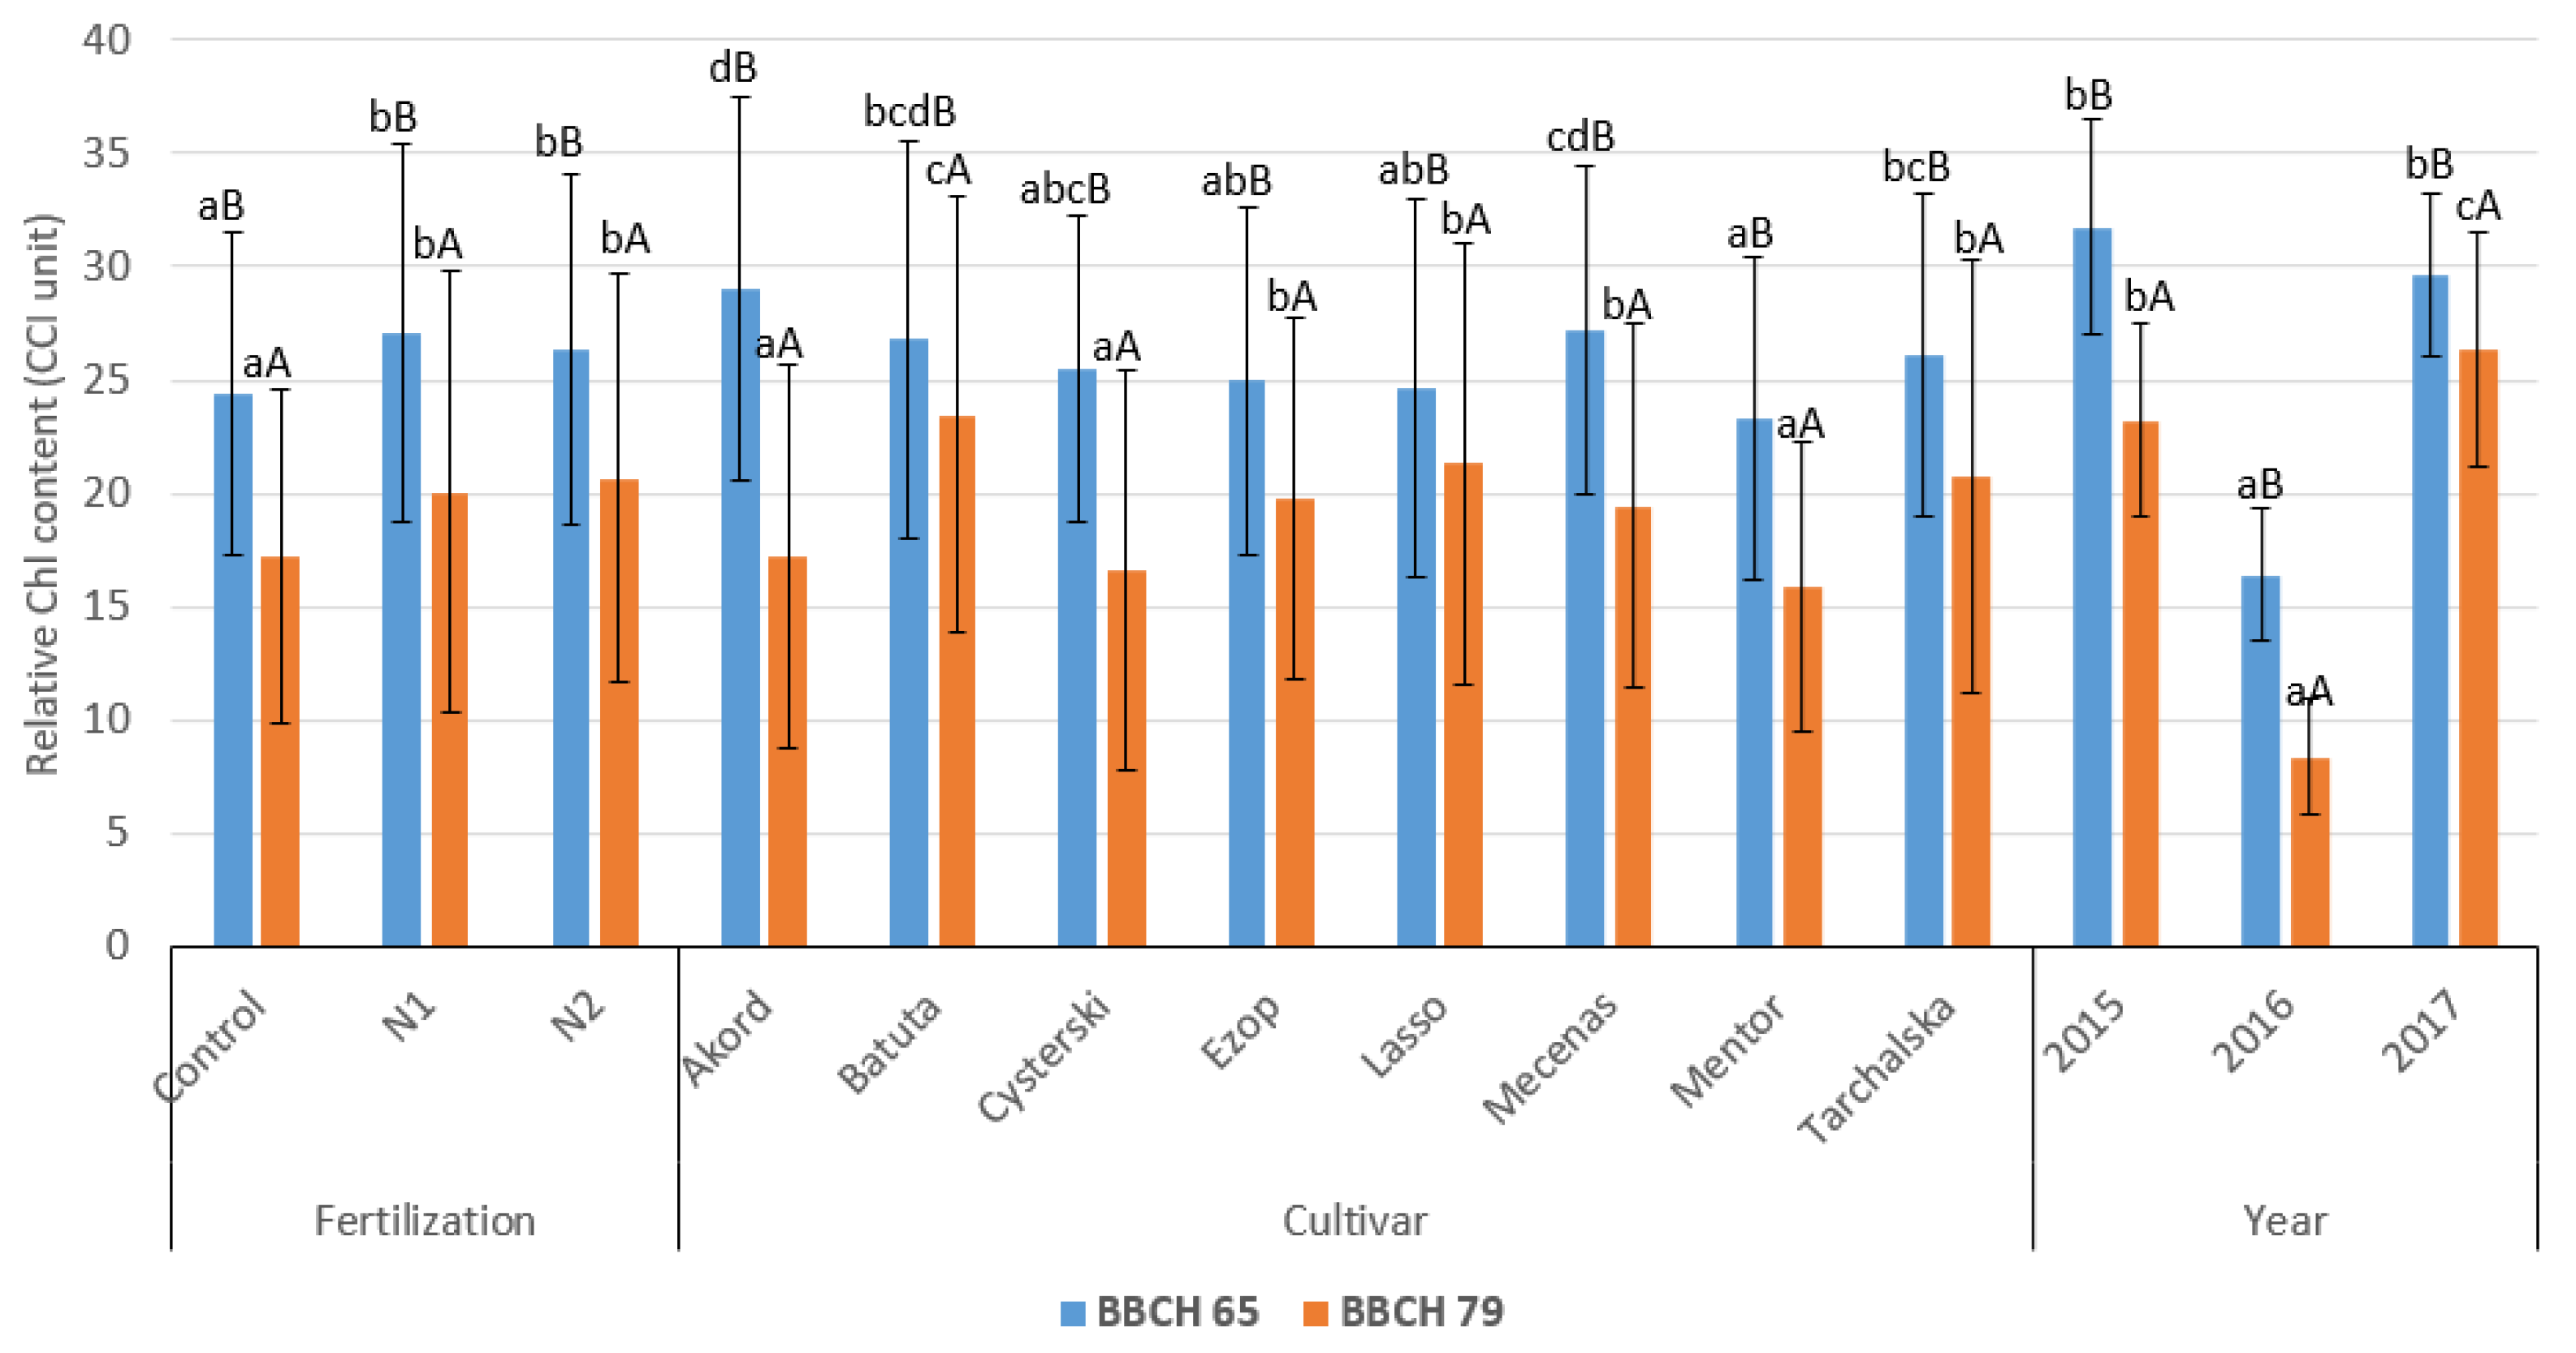
The three-way ANOVAs showed that foliar fertilization, cultivar and weather patterns in the study years at both BBCH 65 and BBCH 79 stages had a significant effect on the relative Chl content of the pea bract (Table 1). In addition, the Chl content was significantly different among the interaction of years and fertilizer, and in the BBCH 79 phase also the interaction years and cultivar. In both development phases, after application of foliar fertilization with N1 and N2, an increase in the relative content of Chl in the bract was observed in field pea in relation to the control, in the BBCH 65 phase by 9.6 and 2.2%, respectively, and in the BBCH 79 phase by 13.9%, and 16.4%, respectively. The reduction of Chl content along with the progress of vegetation was observed in each fertilization variant, as well as in all tested cultivars. In the BBCH 65 phase, the highest relative Chl content was found in the Akord variety, and in the BBCH 79 phase, the Batuta variety. In both development phases, the lowest relative content of Chl in the bract was found in 2016, characterized by rainfall deficiency in May and June. In 2016 in phase BBCH 65, the content of this pigment in the pea bract was significantly lower compared to 2015 and 2017 by 48.4 and 44.6%, respectively, and in phase BBCH 79 by 63.8 and 68.2%, respectively. In phase BBCH 79 in 2015, the relative content of chlorophyll in the bract was also significantly lower compared to 2017 (by 12.1%).
Changes in the relative Chl content under the influence of the interaction of foliar fertilization and years of research are shown in Figure 2. The highest relative content of Chl in the BBCH 65 phase was obtained in 2015 as a result of N1 and N2 fertilization, significantly higher compared to the control by 12.6 and 10.4%, respectively. Also, in 2017 N1 fertilization had a positive effect on the content of this dye, increasing its content by 10% compared to the control. A positive effect of N2 fertilization was also observed, but weaker than in the N1 variant. In turn, in phase BBCH 79, significantly the highest relative content of Chl was found in peas fertilized with N1 and N2 in 2017, respectively by 19.4 and 17.3% higher than in the control. Weaker than in 2017, but beneficial effect of foliar fertilization was also observed in 2015. In both development phases in 2016, characterized by rainfall deficiency in May and June, no significant effect of foliar fertilization on the Chl content was demonstrated.

3.2. Chlorophyll (Chl) Fluorescence

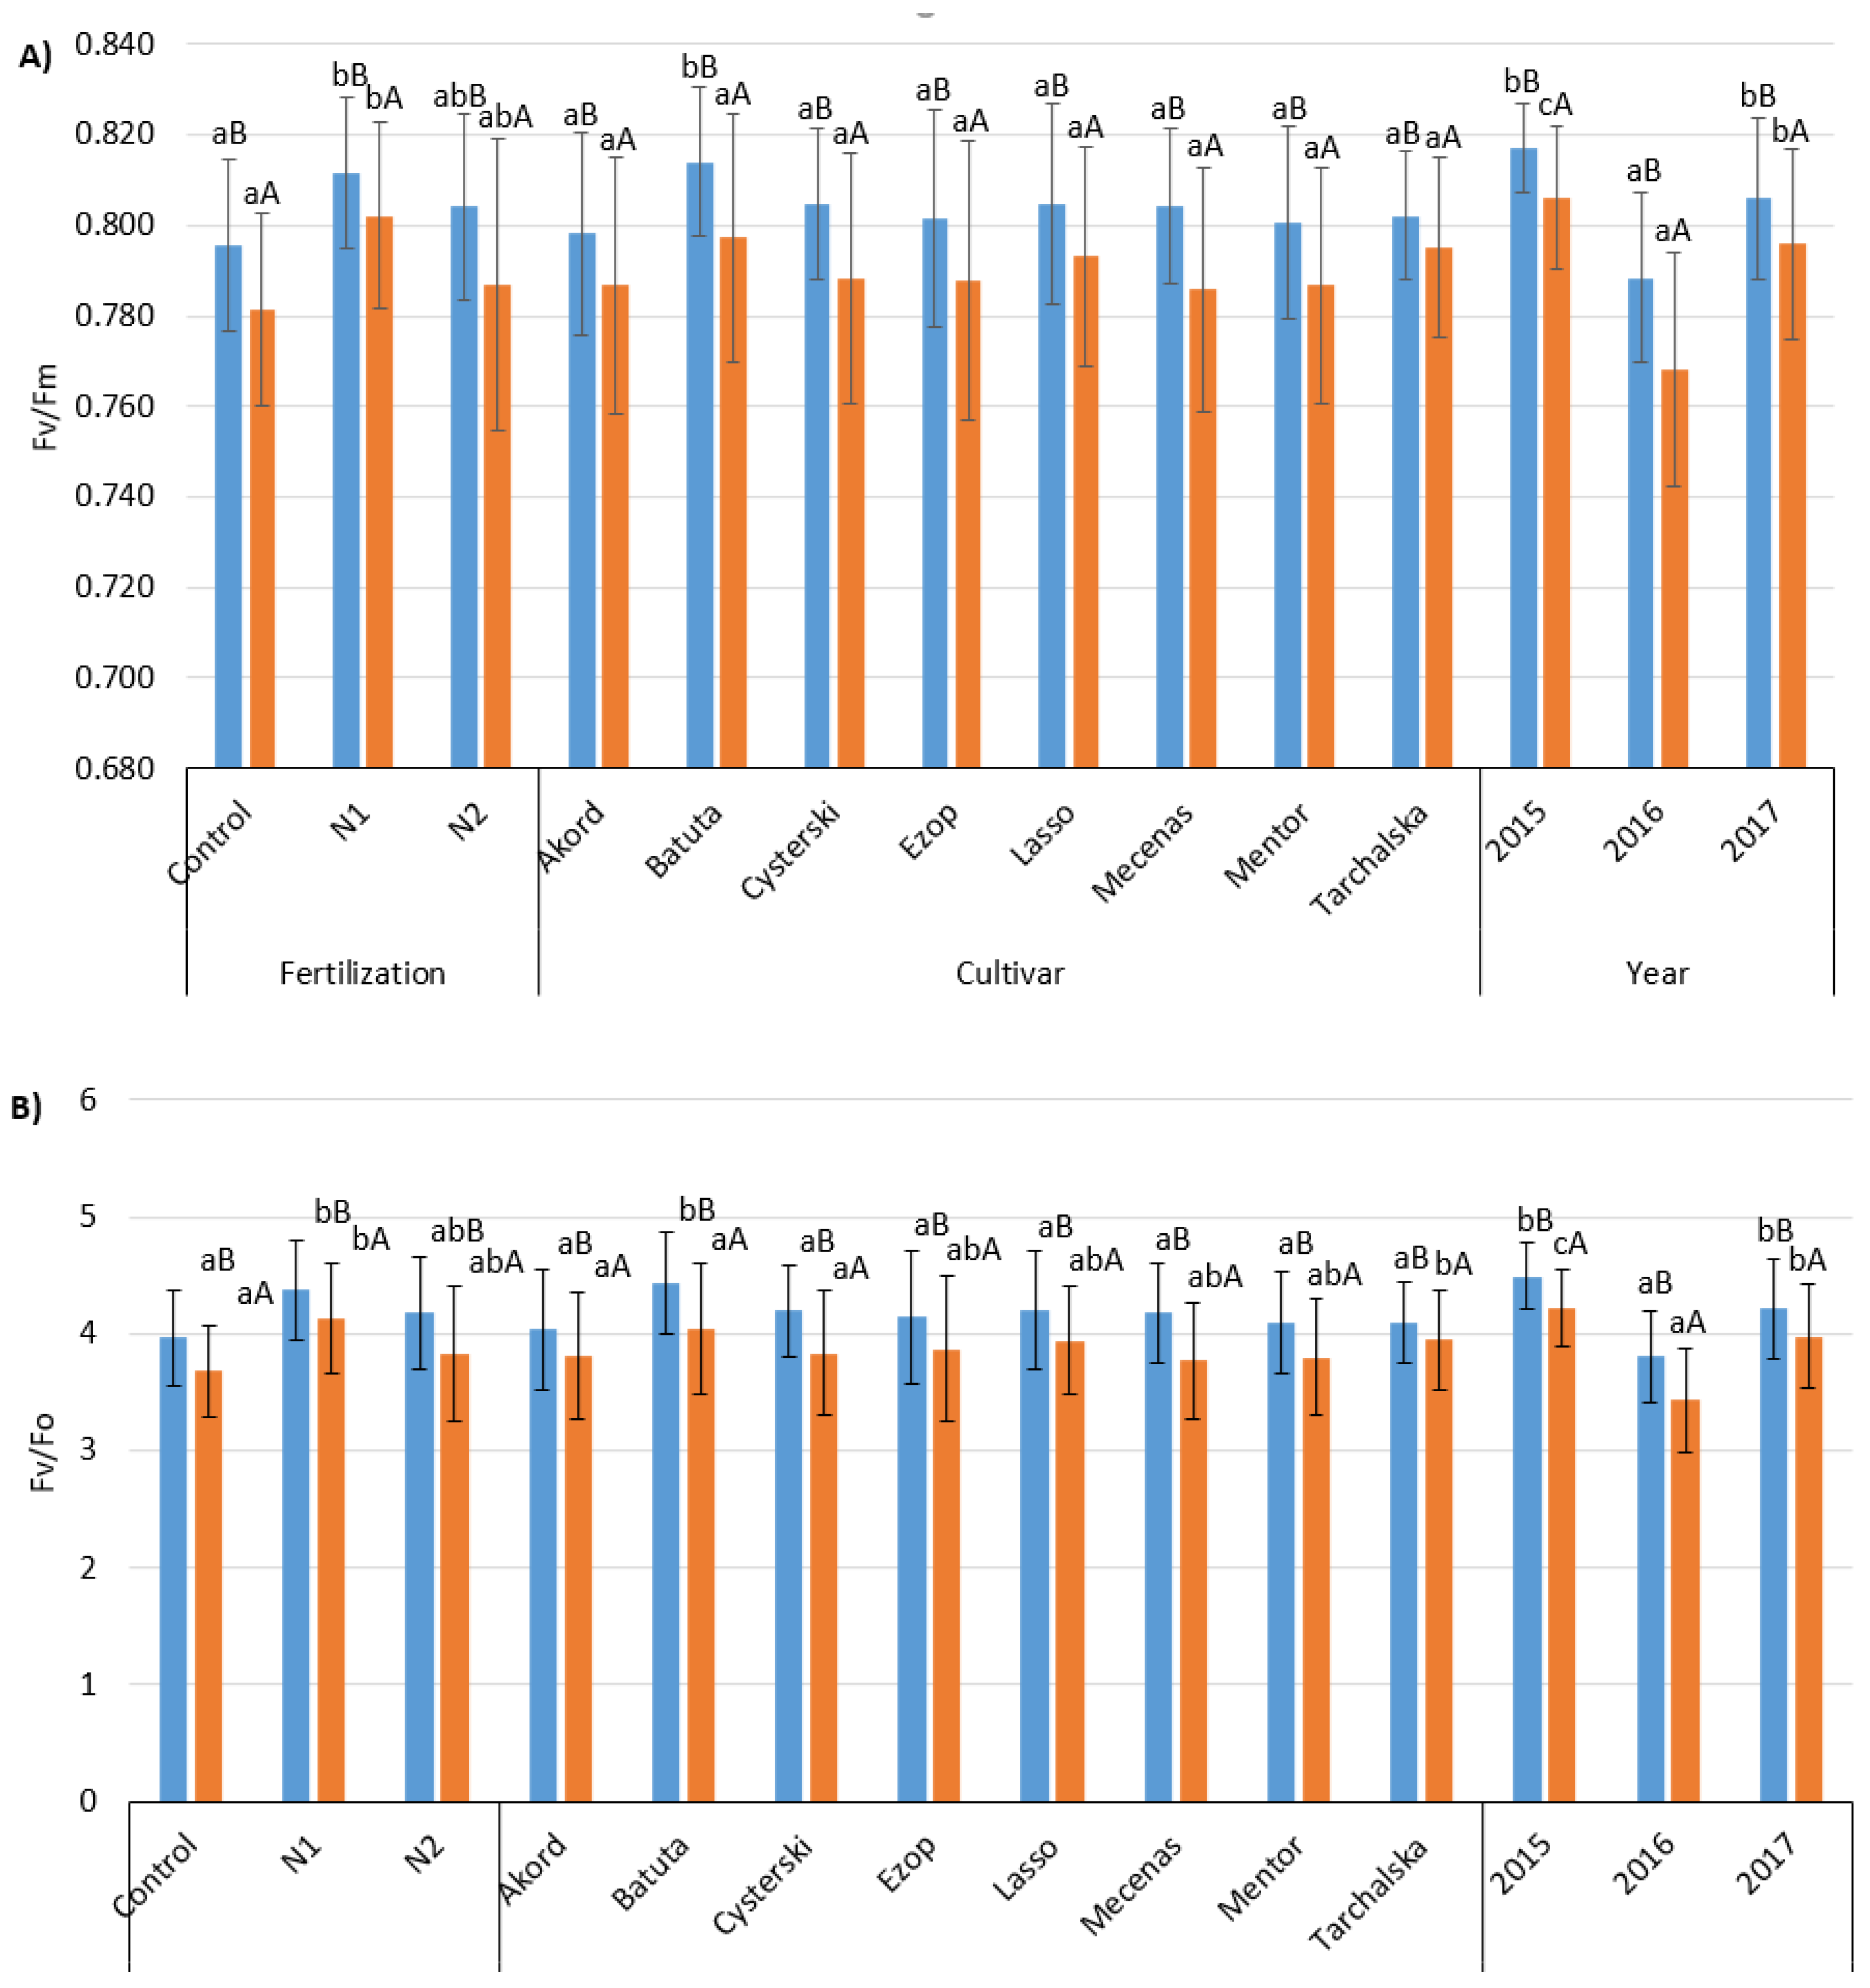
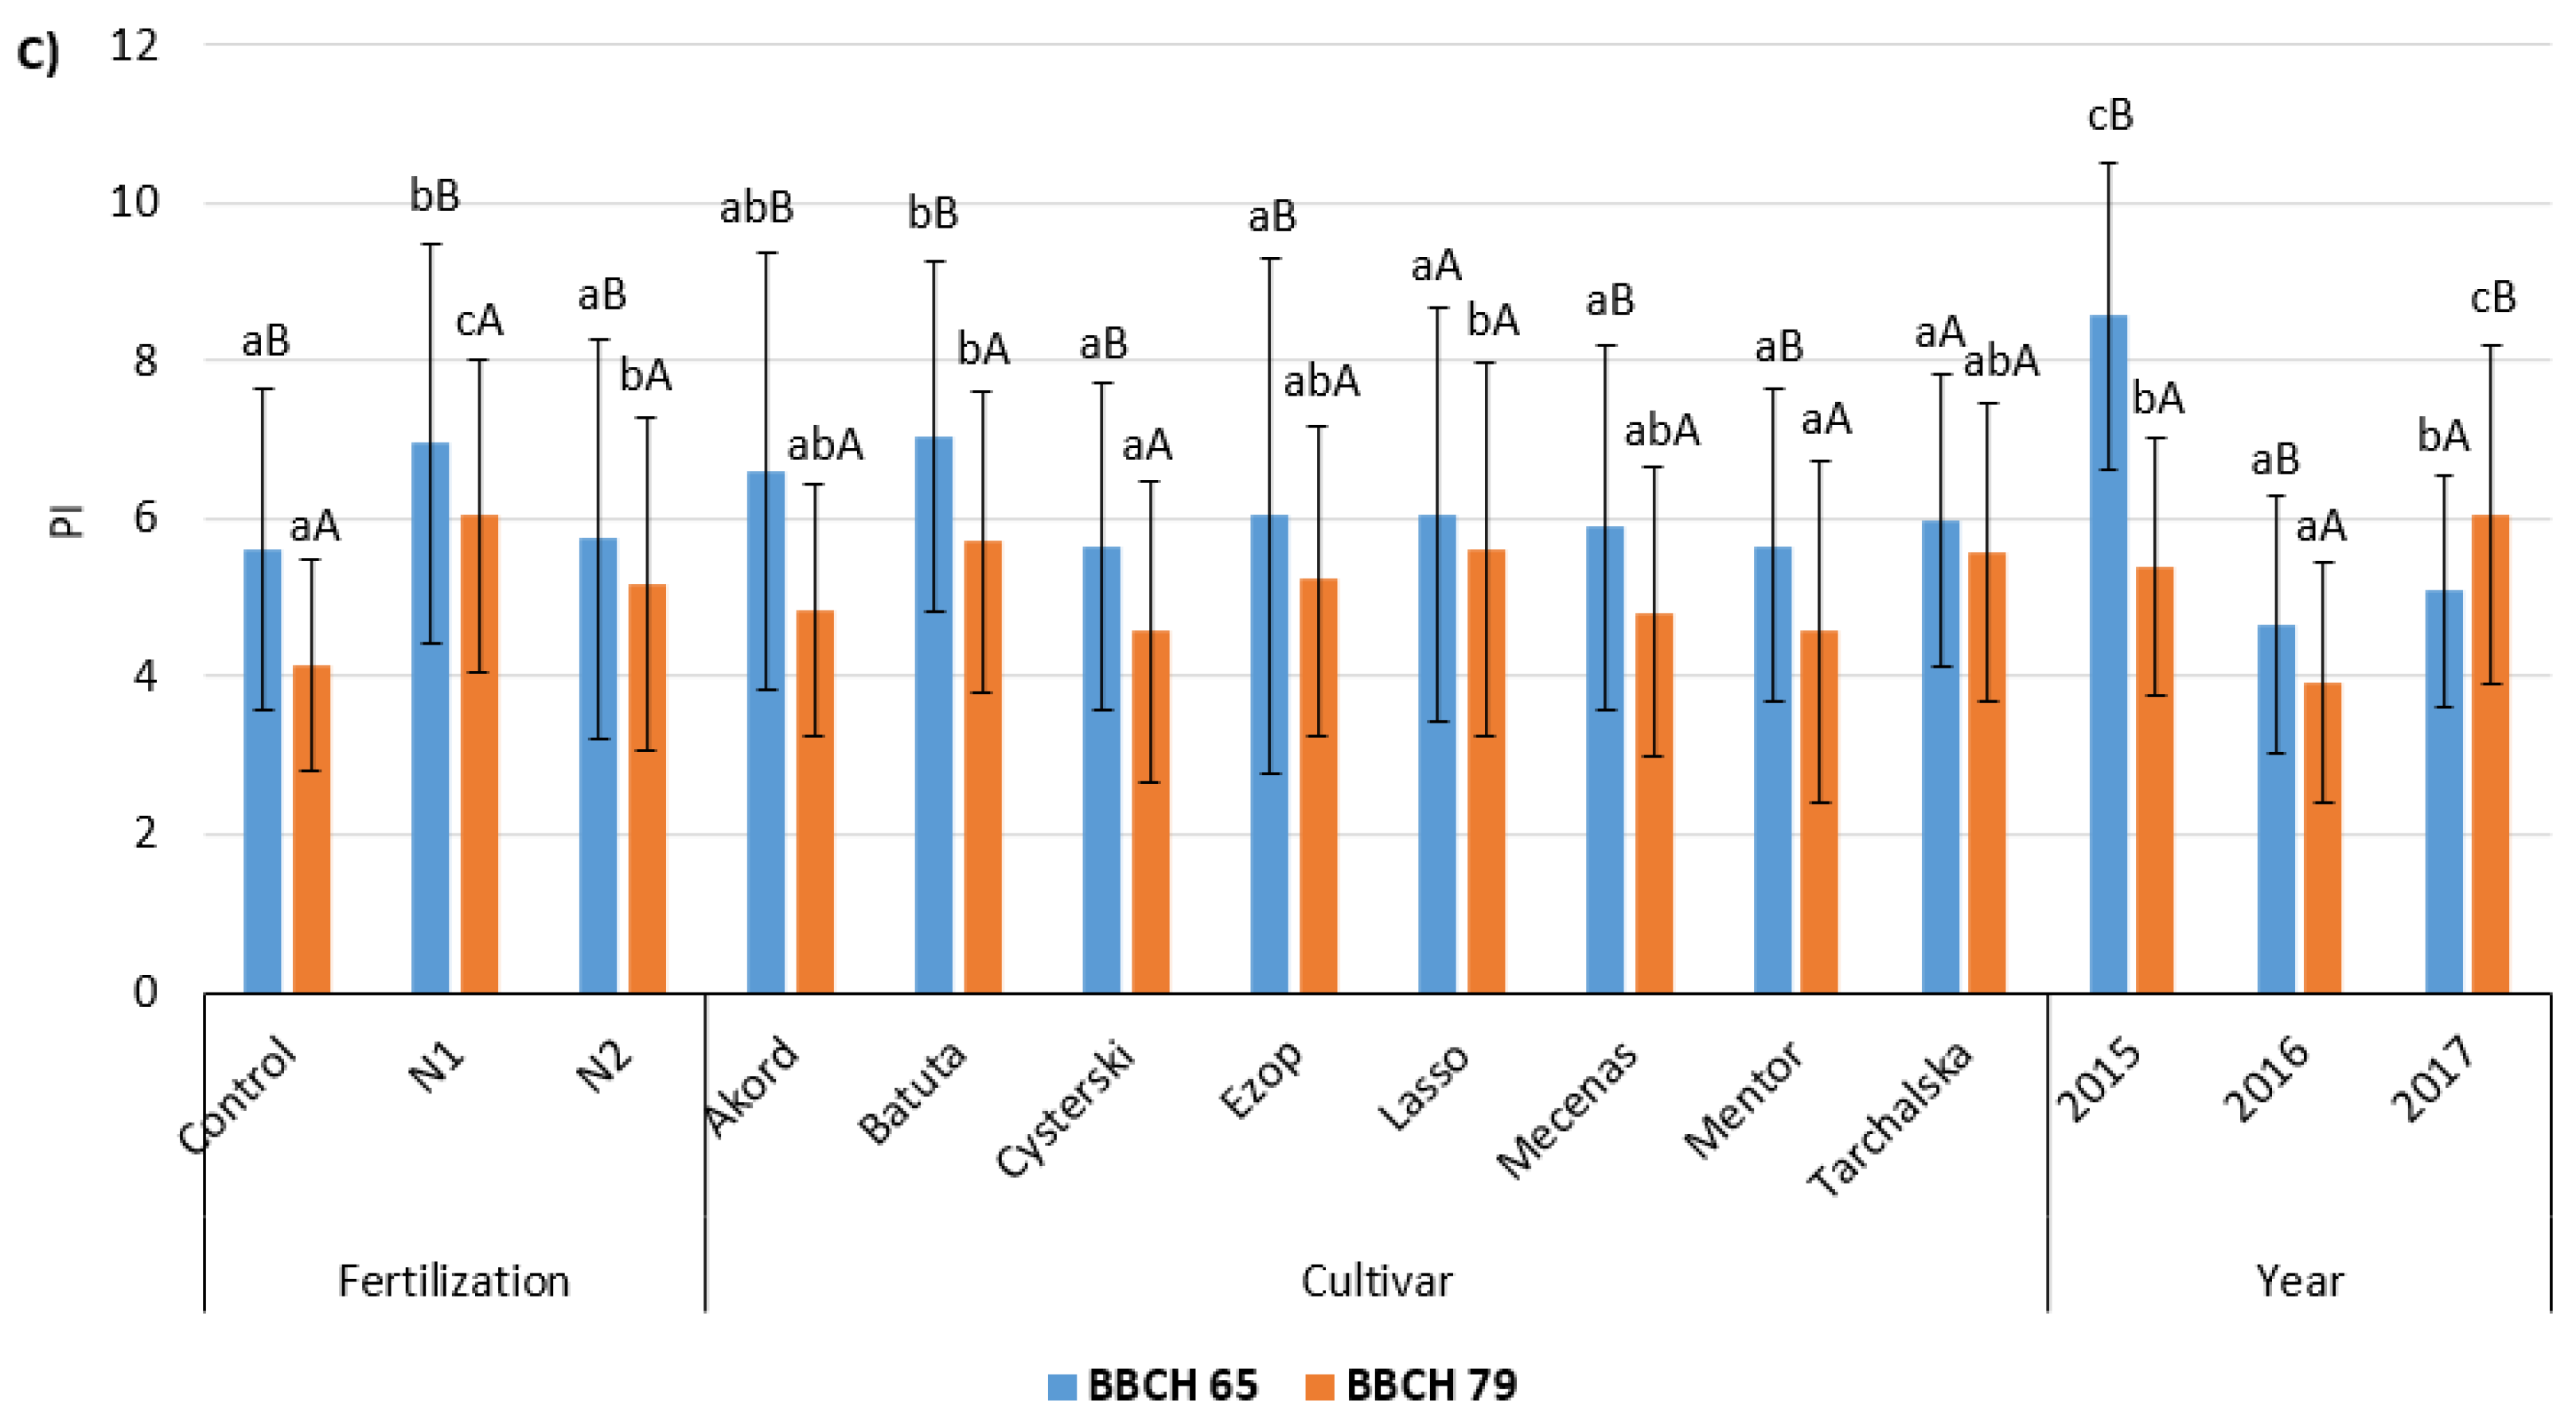
In both development phases of pea plants, significantly the highest maximum photochemical efficiency of PSII (Fv/Fm), peak efficiency of water decomposition reaction (Fv/F0) and PSII efficiency (PI) were obtained in variant N1 (Table 2). The value of the parameter Fv/Fm in the BBCH 65 and BBCH 79 phases was significantly higher compared to the control by 2.0 and 2.6%, respectively, Fv/F0 by 9.4 and 10.9%, and PI by 19.1 and 31.5%, respectively. Statistical analysis also confirms the beneficial effect of N2 fertilization on the size of the Chl fluorescence parameters discussed, but weaker than in the N1 variant. Among the tested cultivars, in phase BBCH 65, the Batuta cultivar had significantly the highest values of Fv/Fm, Fv/F0 and PI. In the BBCH 79 phase, the highest value of the Fv/F0 ratio was obtained in the Tarchalska and Lasso, Ezop, Mentor and Mecenas cultivars, and the PI parameter in the Batuta and Lasso cultivars, but no significant differences in the Fv/Fm values were found.
Significant interaction between fertilization and cultivar was shown only for PI in phase BBCH 65. The highest PI values were then obtained in the N1 variant in Lasso, Batuta and Akord varieties.
The highest values of Fv/Fm and Fv/F0 in the BBCH 65 and BBCH 79 phases and PI in the BBCH 65 phase were found in 2015, while the lowest values of the tested parameters were obtained in 2016.
The values of the analyzed parameters of chlorophyll fluorescence were shaped by the interaction of foliar fertilization and years of research (Figure 3A–C). In 2015 and 2017, in phase BBCH 65 and BBCH 79, the application of N1 fertilization resulted in a significant increase in the Fv/Fm and Fv/F0 parameters compared to the control, and the effect of this fertilization was stronger than in the N2 variant. In 2016, in phase BBCH 65 in the N1 variant, significantly higher values of the Fv/Fm and Fv/F0 parameters were obtained compared to the control and N2 fertilization, and significantly higher in phase BBCH 79 in relation to N2. The highest PI values were obtained under the influence of N1 and N2 fertilization in 2015 in phase BBCH 65, and in 2017 in phase BBCH 79. In 2016, in both development phases, a beneficial effect was recorded only in the case of N1 fertilization, while in variant N2, the values of this parameter were significantly lower than in variant N1 and did not differ in relation to the control.

3.3. Gas Exchange

The use of foliar fertilization in the BBCH 65 and BBCH 79 phases resulted in a significant increase in the intensity of net photosynthesis (Pn), transpiration (E) and stomatal conductance (gs) in relation to the control, and the values of these parameters obtained under the influence of N1 fertilization were also significantly higher compared to N2 fertilization (Table 3). Only in phase BBCH 79, the value of E in peas in the N2 variant did not differ significantly compared to the control. Foliar fertilization resulted in a significant increase in the value of the Ci parameter in relation to the control only in phase BBCH 79.
Significant differentiation of cultivars due to the intensity of gas exchange in the bract was shown only in phase BBCH 79. The highest value of Pn in this stage of development was characteristic for the Tarchalska cultivar, E-for the Tarchalska and Ezop cultivars, gs-for the Tarchalska and Batuta cultivars, and Ci-for the Batuta cultivar.
The course of the gas exchange process in peas was significantly affected by weather conditions. In phase BBCH 65, significantly the highest values of Pn and E were obtained in 2015. Noteworthy is the particularly high value of the parameter Pn, higher compared to 2016 and 2017 by 60.8 and 58.4% respectively. The values of parameter E in 2015 and 2017 did not differ significantly and were higher than in the control. In both development phases, the highest values of parameters gs and Ci were obtained in 2017. In both development phases, significantly the lowest values of the analyzed gas exchange indices in the pea bract were obtained in 2016, with the exception of Ci, whose value in 2016 in the BBCH 79 phase was significantly higher than in 2015 and did not differ significantly compared to 2017.
Interaction of fertilization and cultivar for E and Ci was shown only in phase BBCH 79, and no such interaction for Pn and gs. Significantly, the highest value of parameter E was obtained in variant N1, by 34.4% higher than in the control. In general, the highest values of the Ci parameter were obtained in cultivars fertilized with N2.
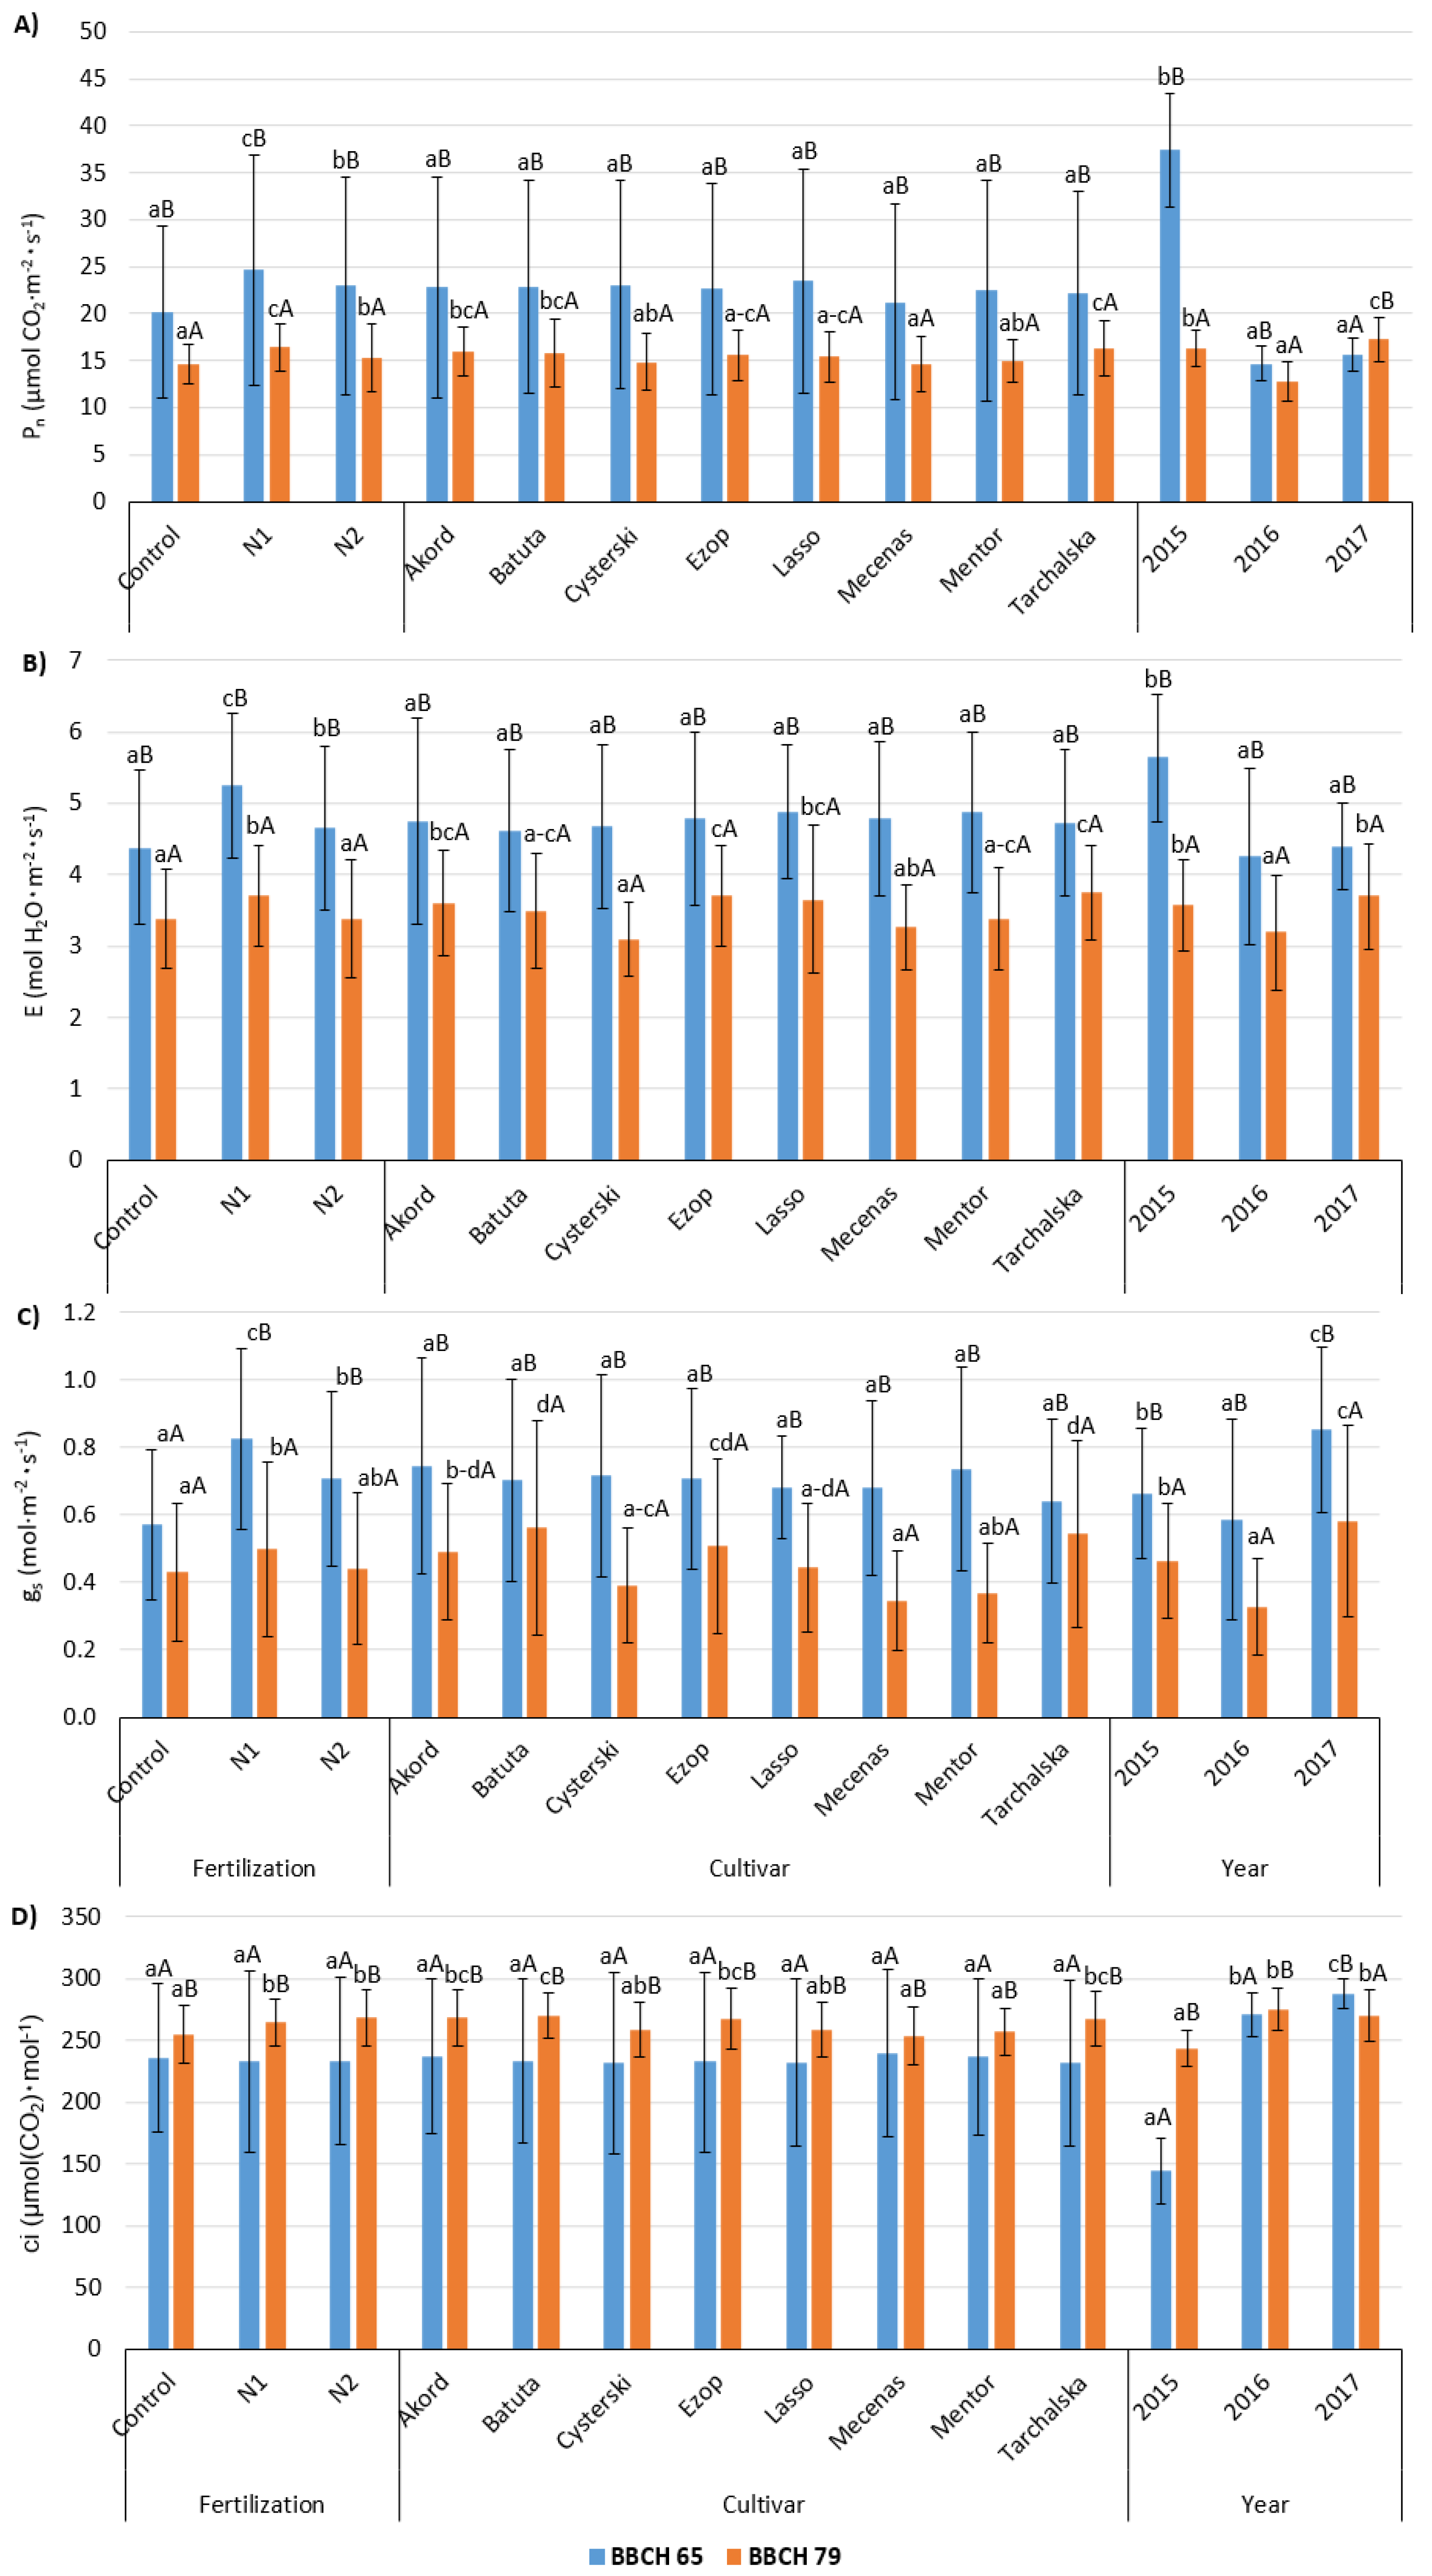
The values of gas exchange parameters in the pea bract were also modified by the interaction of foliar fertilization and the course of the weather in the years of the study (Figure 4A–D).
Significantly, the highest values of the Pn parameter in the BBCH 65 phase were obtained in 2015 (Figure 4A). Foliar fertilization with N1 and N2 resulted in a significant increase in Pn compared to the control by 21.5 and 16.1%, respectively. Significantly the lowest Pn values in the pea bract were obtained in 2016 and in 2017 on the control and in variant N2 (from 2.2 to 2.7 times lower than in 2015). In 2015 and 2016, in the BBCH 79 phase, there was a significant decrease in the value of Pn in relation to phase BBCH 65, while in 2017, an inverse relationship was noted. In phase BBCH 79, significantly the highest Pn values occurred in 2017 in variants N1 and N2, and in 2015 in variant N1, while the lowest Pn values were obtained in 2016 as a result of N2 fertilization.
In phase BBCH 65, significantly the highest E values were obtained in all fertilization variants in 2015 and as a result of N1 fertilization in 2016, and the lowest in the control in 2016 (Figure 4B). In phase BBCH 79, foliar fertilization had no significant effect on the formation of E. Only in 2016 in the N2 variant, was a significant decrease in the value of this parameter observed compared to the control and N1 fertilization, by 18.7 and 24.9%, respectively.
In all years of the study, foliar fertilization caused an increase in the gs value in phase BBCH 65 (Figure 4C). Its highest values were obtained in 2017 under the influence of N2 and N1 fertilization and in 2016 in the N1 variant. In phase BBCH 79, foliar fertilization resulted in an increase in the gs value compared to the control in 2015 and 2017, while in 2016 the opposite relationship was observed. Higher values of Pn and E were generally accompanied by the lowest values of Ci (Figure 4D).

4. Discussion

In field crops, plants are constantly exposed to a variety of environmental stressors, including salinity, drought, cold, heat, heavy metals, gaseous pollutants, pathogens and more, all of which negatively impact growth, metabolism and ultimately affect yield. In caring for the environment, there is currently a lot of interest in the possibilities of using new, safe and environmentally-friendly methods to mitigate plant stress [10,38] and prevent crop damage caused by insects [39,40].
The occurrence of drought stress reduces plant growth parameters and the content of chlorophyll a and b, while increasing the content of carotenoids, soluble sugars, free amino acids, proline, total phenols and flavonoids [38,41]. Foliar fertilization can play an active role in improving plant metabolism [42] and be an effective method of improving plant resistance to stress such as salinity, water deficiency/excess, high/low temperature and strong pressure of diseases and pests [43]. In the experiment, the photosynthetic activity measured in the pea bract was determined more by the weather conditions in the years of research and the development phase than by foliar fertilization and cultivar. In 2015 and 2017, during the foliar fertilization treatments, the plants were not subjected to drought stress, because in May the weather conditions according to the Sielianinov hydrothermal index were considered wet, and the soil was well moistened. In such meteorological conditions, N1 and N2 fertilization stimulated plant growth and development. In both fertilization variants, in 2015 and 2017, an increase in the relative Chl content, Chl fluorescence parameters (Fv/Fm, Fv/F0 and PI) and gas exchange (Pn, gs) was found compared to unfertilized plants. A similar effect of the N1 and N2 fertilization variants on the course of physiological processes in the plant was found. Furthermore, Sulewska et al. [18] observed an increase in the content of Chl and Fv/Fm in pea under the influence of foliar application of fertilizers/biostimulators, and similarly to their own research, the reaction of plants to specific preparations depended on the weather conditions. In the case of stress, none of the eight fertilizers/biostimulants studied by Sulewska et al. [18] did not contribute to a significant increase in pea seed yield. A typical response of plants to water restriction is to close their stomata, thereby reducing water loss through transpiration. On the other hand, stomatal closure caused by drought stress reduces CO2 absorption and thus reduces the efficiency of Pn [44]. In our own research, under the conditions of precipitation deficiency in 2016 in phase BBCH 65 and BBCH 79, the lowest values of the relative Chl content, Chl fluorescence parameters (Fv/Fm, Fv/F0 and PI) and the gas exchange parameter gs were obtained, measured in the bract. Changes in the maximum photochemical efficiency of PSII (Fv/Fm) indicate disturbances in electron transport, efficiency of the oxygen evolution complex (Fv/F0), and thus damage to PSII [29]. On the basis of the conducted experiment, it seems that the gas exchange parameters are a less sensitive indicator of the response of pea plants to drought stress than the parameters of chlorophyll fluorescence Fv/Fm, Fv/F0 and PI, because the Chl fluorescence parameters indicated the reaction of plants to this stress faster than Pn and E gas exchange.
Thus, the opinion of Kocira et al. [5] and Niu et al. [45] that the use of foliar fertilizers is an effective method of increasing plant yields in our research is confirmed only in years with favorable weather conditions, while in years when plants are subject to drought stress, foliar fertilization, including biostimulators and chelated fertilizers, does not show the expected results. The biostimulators used in the experiment did not alleviate the stress of the drought that occurred in May and June 2016, when the plants were flowering and forming pods. Perhaps the stronger negative reaction of pea plants under drought stress conditions to N2 than N1 fertilization was due to the origin of the amino acids included in their composition. The biostimulants used in variant N1 contained amino acids of plant origin, while in variant N2, amino acids were of animal origin. Source literature presents studies [14,46,47] indicating that foliar application of animal protein hydrolysates may cause phytotoxicity and inhibit plant growth. A different opinion is presented by Colla et al. [48] claiming that biostimulants based on protein hydrolysates, including protein hydrolysates of animal origin, improve crop performance by stimulating C, N and plant hormone metabolism. In this experiment, the beneficial effect of using a biostimulant based on animal protein (N2) in the form of foliar spraying was demonstrated, but only in 2015 and 2017, when weather conditions were favorable for field peas during the application of these fertilizers, especially in terms of the amount of precipitation. In 2015 and 2017, the effect of the biostimulator containing peptides and L-amino acids (N2) on the relative Chl content and physiological processes in the plant of the tested pea cultivars was comparable to fertilization with conventional fertilizers/biostimulants of plant origin (N1). The positive effect of amino acids on plants Sadak et al. [49] explain that they provide plant cells with an immediately available source of N, which can generally be taken up by cells faster than inorganic N. In their opinion, the stimulating effect of amino acids may be related to the observed increase in photosynthetic pigments, as well as the number of leaves, and as a consequence, the efficiency of the photosynthetic apparatus increases, which was also observed in our own research. The beneficial effect of protein hydrolysates is also explained by the fact that they can activate signaling cascades in the plant, including inducing defense mechanisms against oxidative stress [50,51,52], and such a cascade of events is typically hormone dependent [51]. Some other components of protein hydrolysates, such as free amino acids, may support biostimulating activity, and the provision of GLY and PRO may promote osmolyte accumulation [44].
The response to foliar fertilization, including biostimulants, is often variable and not recurrent, which was confirmed in these studies. There is also insufficient knowledge about many factors related to the penetration of the solution applied to the leaves [53]. Most of the above-ground plant surfaces are covered with a lipid-rich cuticle, which is a barrier to the two-way transport of substances between the plant and the surrounding environment [54]. Foliar-applied substances penetrate the leaf surface by diffusion [55]. In the dissolved state, foliar applications can penetrate the leaf surface through the cuticle and stomata [56], and the importance of these pathways depends on the physicochemical properties of the solute and the plant surface. Burkhardt et al. [57] indicate a clear promoting effect of stomata on uptake of dissolved substances by leaves. Li et al. [58] in the example of sunflower, tomato and soybean showed that changes in foliar absorption of Zn, Mn and Fe are related to the thickness of the cuticle and epidermal cell wall, rather than stomatal density or cuticle composition. The cuticle can provide an effective barrier against the penetration of solutes such as mineral fertilizers as opposed to lipophilic solutes such as many pesticides [59].
Fernández and Eichert [53] in a review article emphasize that environmental conditions during plant growth have a direct impact on the leaf surface in terms of thickness or the amount and composition of cuticle waxes. In drought conditions, only small amounts of water are absorbed by the outer part of the cuticle, and with increasing air humidity or after wetting the leaf surface by precipitation or spraying with agrochemicals, the cuticle may absorb more water. They also point out that stress conditions change the functioning of stomata and physiological processes in plants, which affects the rate of absorption of chemicals applied to the leaves. Schönher [60] also points to the beneficial effect of ambient humidity on the mobility of the substance applied as a foliar application. It can therefore be assumed that the drought that occurred at the time of fertilizer application in 2016 limited the penetration of dissolved substances into the leaf due to the closing of the respiratory stomata, while the lack of drought stress in 2015 and 2017 at the time of spraying favored the penetration of these substances into the leaf. Thus, the suggestion of Fernández et al. [61] that a potential reduction in stomatal opening may reduce the likelihood of stomatal solute uptake. Perhaps, in the conditions of drought in 2016, the leaf surface was able to penetrate the free amino acids of animal protein hydrolysates, especially those of small size, such as GLY and PRO, which, in the opinion of Colla et al. [62] can cause stunting of plant growth.
In general, N1 fertilization had a more favorable effect on the relative content of Chl and the course of physiological processes in the plants of the eight pea cultivars studied. Statistical analysis also confirms the beneficial effect of N2 application on the course of physiological processes in the plant, but weaker than N1, which was determined by the strong negative reaction of plants to N2 fertilization in 2016, with rainfall shortages in the flowering and pod development phases.

5. Conclusions

Biostimulants can perform numerous agronomic functions, such as stimulating plant growth and development, improving the efficiency of the use of nutrients, thus also enabling the reduction of the use of synthetic fertilizers, increasing the resistance of plants to abiotic and biotic stresses and the quality of crops. It was found that biostimulants play an active role in improving the metabolism of pea plants, however, the reaction of plants to their foliar application is often variable, non-recurrent and strongly dependent on the weather conditions. It has been shown that in favorable weather conditions, the preparations used have a positive effect on the physiological processes occurring in the plant, but do not significantly mitigate the negative effects caused by drought stress. In the absence of drought-induced plant stress, under the influence of foliar fertilization with N1 and N2, in the BBCH 65 and BBCH 79 phases, there was a significant increase in pea relative to unfertilized plants, relative Chl content, Chl fluorescence (Fv/Fm, Fv/F0, PI) and gas exchange parameters (Pn, E, gs and Ci-only in BBCH 79).
Based on these studies, foliar fertilization of peas with biostimulants, especially of plant origin (N1), and the use of animal protein hydrolysate (N2) in years when the plants are not at risk for drought, can be recommended for agricultural practice.

Funding

This research received no external funding.

Data Availability Statement

The datasets used and/or analyzed in the current study are available from the author upon reasonable request.

Conflicts of Interest

The author declares no conflict of interest.

References

  1. Regulation (EU) 2019/1009 of the European Parliament and of the Council of 5 June 2019 Laying Down Rules on the Making Available on the Market of EU Fertilising Products and Amending Regulations (EC) No 1069/2009 and (EC) No 1107/2009 and Repealing Regulation (EC) No 2003/2003 (Text with EEA Relevance). Available online: https://eur-lex.europa.eu/legal-content/EN/TXT/?uri=celex%3A32019R1009 (accessed on 28 October 2022).
  2. Nardi, S.; Pizzeghello, D.; Schiavon, M.; Ertani, A. Plant biostimulants: Physiological responses induced by protein hydrolyzed-based products and humic substances in plant metabolism. Sci. Agric. 2016, 73, 18–23. [Google Scholar] [CrossRef] [Green Version]
  3. Du Jardin, P. Plant biostimulants: Definition, concept, main categories and regulation. Sci. Hortic. 2015, 196, 3–14. [Google Scholar] [CrossRef] [Green Version]
  4. Yakhin, O.I.; Lubyanov, A.A.; Yakhin, I.A.; Brown, P.H. Biostimulants in plant science: A global perspective. Front. Plant Sci. 2017, 7, 2049. [Google Scholar] [CrossRef] [PubMed] [Green Version]
  5. Kocira, A.; Świeca, M.; Kocira, S.; Złotek, U.; Jakubczyk, A. Enhancement of yield, nutritional and nutraceutical properties of two common bean cultivars following the application of seaweed extract (Ecklonia maxima). Saudi J. Biol. Sci. 2018, 25, 563–571. [Google Scholar] [CrossRef] [Green Version]
  6. Caruso, G.; De Pascale, S.; Cozzolino, E.; Cuciniello, A.; Cenvinzo, V.; Bonini, P.; Colla, G.; Rouphael, Y. Yield and nutritional quality of Vesuvian Piennolo tomato PDO as affected by farming system and biostimulant application. Agronomy 2019, 9, 505. [Google Scholar] [CrossRef] [Green Version]
  7. Caruso, G.; De Pascale, S.; Cozzolino, E.; Giordano, M.; El-Nakhel, C.; Cuciniello, A.; Cenvinzo, V.; Colla, G.; Rouphael, Y. Protein hydrolysate or plant extract-based biostimulants enhanced yield and quality performances of greenhouse perennial wall rocket grown in different seasons. Plants 2019, 8, 208. [Google Scholar] [CrossRef] [Green Version]
  8. Elżbieta Wszelaczyńska, E.; Szczepanek, M.; Pobereżny, J.; Kazula, M.J. Effect of biostimulant application and long-term storage on the nutritional value of carrot. Hortic. Bras. 2019, 37, 451–457. [Google Scholar] [CrossRef] [Green Version]
  9. Pobereżny, J.; Szczepanek, M.; Wszelaczyńska, E.; Prus, P. The quality of carrot after field biostimulant application and after storage. Sustainability 2020, 12, 1386. [Google Scholar] [CrossRef] [Green Version]
  10. Osman, M.S.; Badawy, A.A.; Osman, A.I.; Abdel Latef, A.A.H. Ameliorative impact of an extract of the halophyte Arthrocnemum macrostachyum on growth and biochemical parameters of soybean under salinity stress. J. Plant Growth Regul. 2021, 40, 1245–1256. [Google Scholar] [CrossRef]
  11. Badawy, A.A.; Alotaibi, M.O.; Abdelaziz, A.M.; Osman, M.S.; Khalil, A.M.A.; Saleh, A.M.; Mohammed, A.E.; Hashem, A.H. Enhancement of seawater stress tolerance in barley by the endophytic fungus Aspergillus ochraceus. Metabolites 2021, 11, 428. [Google Scholar] [CrossRef]
  12. Shahrajabian, M.H.; Chaski, C.; Polyzos, N.; Petropoulos, S.A. Biostimulants application: A low input cropping management tool for sustainable farming of vegetables. Biomolecules 2021, 11, 698. [Google Scholar] [CrossRef] [PubMed]
  13. Szpunar-Krok, E.; Jańczak-Pieniążek, M.; Skrobacz, K.; Bobrecka-Jamro, D.; Balawejder, M. Response of potato (Solanum tuberosum L.) plants to spraying by hydrogen peroxide. Sustainability 2020, 12, 2469. [Google Scholar] [CrossRef] [Green Version]
  14. Cerdán, M.; Sánchez-Sánchez, A.; Jordá, J.D.; Juárez, M.; Sánchez-Andreu, J. Effect of commercial amino acids on iron nutrition of tomato plants grown under lime-induced iron deficiency. J. Plant. Nutr. Soil Sci. 2013, 176, 859–866. [Google Scholar] [CrossRef]
  15. Karapouloutidou, S.; Gasparatos, D. Effects of biostimulant and organic amendment on soil properties and nutrient status of Lactuca sativa in a calcareous saline-sodic soil. Agriculture 2019, 9, 164. [Google Scholar] [CrossRef] [Green Version]
  16. Szparaga, A.; Kocira, S.; Kocira, A.; Czerwińska, E.; Świeca, M.; Lorencowicz, E.; Kornas, R.; Koszel, M.; Oniszczuk, T. Modification of growth, yield, and the nutraceutical and antioxidative potential of soybean through the use of synthetic biostimulants. Front. Plant Sci. 2018, 9, 1401. [Google Scholar] [CrossRef]
  17. Kocira, A.; Lamorska, J.; Kornas, R.; Nowosad, N.; Tomaszewska, M.; Leszczyńska, D.; Kozłowicz, K.; Tabor, S. Changes in biochemistry and yield in response to biostimulants applied in bean (Phaseolus vulgaris L.). Agronomy 2020, 10, 189. [Google Scholar] [CrossRef] [Green Version]
  18. Sulewska, H.; Niewiadomska, A.; Ratajczak, K.; Budka, A.; Panasiewicz, K.; Faligowska, A.; Wolna-Maruwka, A.; Dryjański, L. Changes in Pisum sativum L. Plants and in Soil as a Result of Application of Selected Foliar Fertilizers and Biostimulators. Agronomy 2020, 10, 1558. [Google Scholar] [CrossRef]
  19. Halpern, M.; Bar-Tal, A.; Ofek, M.; Minz, D.; Muller, T.; Yermiyahu, U. The use of biostimulants for enhancing nutrient uptake. Adv. Agron. 2015, 130, 141–174. [Google Scholar] [CrossRef]
  20. Pereira, C.; Dias, M.I.; Petropoulos, S.A.; Plexida, S.; Chrysargyris, A.; Tzortzakis, N.; Ferreira, I.C.F.R. The effects of biostimulants, biofertilizers and water-stress on nutritional value and chemical composition of two spinach genotypes (Spinacia oleracea L.). Molecules 2019, 24, 4494. [Google Scholar] [CrossRef] [Green Version]
  21. Schnitkey, G.; Paulson, N.; Swanson, K.; Colussi, J.; Jim, B. Nitrogen Fertiliser Prices and Supply in Light of the Ukraine-Russia 709 Conflict. Department of Agricultural and Consumer Economics, University of Illinois at Urbana-Champaign, farmdoc Dly, 5 April 2022. Available online: https://farmdocdaily.illinois.edu/2022/04/nitrogen-fertilizer-prices-and-supply-in-light-of-the-ukraine-russia-conflict.html (accessed on 28 October 2022).
  22. Bertrand, C.; Gonzalez-Coloma, A.; Prigent-Combaret, C. Chapter Four—Plant metabolomics to the benefit of crop protection and growth stimulation. Adv. Bot. Res. 2021, 98, 107–132. [Google Scholar] [CrossRef]
  23. Kumar, H.D.; Aloke, P. Role of Biostimulant Formulations in Crop Production: An Overview. Int. J. Appl. Res. Vet. M. 2020, 8, 38–46. Available online: https://www.researchgate.net/profile/Aloke-Purkait/publication/342095340_Role_of_biostimulant_formulations_in_crop_production_An_overview/links/5ee1c473458515814a5458a5/Role-of-biostimulant-formulations-in-crop-production-An-overview.pdf (accessed on 28 October 2022).
  24. Zhang, X.; Ervin, E.H.; Schmidt, R.E. Physiological effects of liquid applications of a seaweed extract and a humic acid on creeping bentgrass. J. Am. Soc. Hortic. Sci. 2003, 128, 492–496. [Google Scholar] [CrossRef] [Green Version]
  25. Mauromicale, G.; Ierna, A.; Marchese, M. Chlorophyll fluorescence and chlorophyll content in field-grown potato as affected by nitrogen supply, genotype, and plant age. Photosynthetica 2006, 44, 76–82. [Google Scholar] [CrossRef]
  26. Kalaji, M.H.; Jajoo, A.; Oukarroum, A.; Brestic, M.; Zivcak, M.; Samborska, I.A.; Cetner, M.D.; Łukasik, I.; Goltsev, V.; Ladle, R.J. Chlorophyll a fluorescence as a tool to monitor physiological status of plants under abiotic stress conditions. Acta Physiol. Plant. 2016, 38, 102. [Google Scholar] [CrossRef] [Green Version]
  27. Bojarszczuk, J. The influence of soil tillage system on changes in gas exchange parameters of Pisum sativum L. Agronomy 2021, 11, 1000. [Google Scholar] [CrossRef]
  28. Lawlor, D. Photosynthesis, productivity and environment. J. Exp. Bot. 1995, 46, 1449–1461. Available online: https://www.jstor.org/stable/23694991 (accessed on 10 November 2022). [CrossRef]
  29. Kalaji, M.H.; Łoboda, T. Fluorescencja Chlorofilu w Badaniach Stanu Fizjologicznego Roślin/Chlorophyll Fluorescence in the Study of the Physiological State of Plants, 2nd ed.; SGGW: Warsaw, Poland, 2010; p. 116. (In Polish) [Google Scholar]
  30. Ghaley, B.B.; Hauggaard-Nielsen, H.; Høgh-Jensen, H.; Jensen, E.S. Intercropping of wheat and pea as influenced by nitrogen fertilization. Nutr. Cycl. Agroecosys 2005, 73, 201–212. [Google Scholar] [CrossRef]
  31. Van Krimpen, M.M.; Leenstra, F.; Maurer, V.; Bestman, M. How to fulfill EU requirements to feed organic laying hens 100% organic ingredients. J. Appl. Poult. Res. 2016, 25, 129–138. [Google Scholar] [CrossRef]
  32. Halmemies-Beauchet-Filleau, A.; Rinne, M.; Lamminen, M.; Mapato, C.; Ampapon, T.; Wanapat, M.; Vanhatalo, A. Review: Alternative and novel feeds for ruminants: Nutritive value, product quality and environmental aspects. Animal 2018, 12 (Suppl. 2), 295–309. [Google Scholar] [CrossRef] [Green Version]
  33. Witten, S.; Grashorn, M.; Aulrich, K. Precaecal digestibility of crude protein and amino acids of a field bean (Vicia faba L.) and a field pea (Pisum sativum L.) variety for broilers. Anim. Feed Sci. Technol. 2018, 243, 35–40. [Google Scholar] [CrossRef]
  34. Faligowska, A.; Kalembasa, S.; Kalembasa, D.; Panasiewicz, K.; Szymańska, G.; Ratajczak, K.; Skrzypczak, G. The Nitrogen Fixation and Yielding of Pea in Different Soil Tillage Systems. Agronomy 2022, 12, 352. [Google Scholar] [CrossRef]
  35. FAO. World Reference Base for Soil Resources 2014. Update 2015. International Soil Classification System for Naming Soils and Creating Legends for Soil Maps. Available online: http://www.fao.org/fileadmin/templates/nr/images/resources/pdf_documents/wrb2007_red.pdf (accessed on 29 December 2021).
  36. Skowera, B.; Puła, J. Extreme pluviothermal conditions in the spring period in Poland in 1971–2000. Acta Agrophys. 2004, 3, 171–177. (In Polish) [Google Scholar]
  37. Szpunar-Krok, E.; Kuźniar, P.; Pawlak, R.; Migut, D. The effect of foliar fertilization on the resistance of pea (Pisum sativum L.) seeds to mechanical damage. Agronomy 2021, 11, 189. [Google Scholar] [CrossRef]
  38. Hussein, H.A.A.; Alshammari, S.O.; Kenawy, S.K.M.; Elkady, F.M.; Badawy, A.A. Grain-priming with L-arginine improves the growth performance of wheat (Triticum aestivum L.) plants under drought stress. Plants 2022, 11, 1219. [Google Scholar] [CrossRef]
  39. Badawy, A.A.; Abdelfattah, N.A.H.; Salem, S.S.; Awad, M.F.; Fouda, A. Efficacy assessment of biosynthesized copper oxide nanoparticles (CuO-NPs) on stored grain insects and their impacts on morphological and physiological traits of wheat (Triticum aestivum L.). Plant. Biol. 2021, 10, 233. [Google Scholar] [CrossRef] [PubMed]
  40. Amin, M.A.; Ismail, M.A.; Badawy, A.A.; Awad, M.A.; Hamza, M.F.; Awad, M.F.; Fouda, A. The potency of fungal-fabricated selenium nanoparticles to improve the growth performance of Helianthus annuus L. and control of cutworm Agrotis ipsilon. Catalysts 2021, 11, 1551. [Google Scholar] [CrossRef]
  41. Omer, A.M.; Osman, M.S.; Badawy, A.A. Inoculation with Azospirillum brasilense and/or Pseudomonas geniculata reinforces flax (Linum usitatissimum) growth by improving physiological activities under saline soil conditions. Bot. Stud. 2022, 63, 15. [Google Scholar] [CrossRef]
  42. Fernández, V.; Brown, P.H. From plant surface to plant metabolism: The uncertain fate of foliar-applied nutrients. Front. Plant Sci. 2013, 4, 289. [Google Scholar] [CrossRef] [PubMed] [Green Version]
  43. Artyszak, A. Effect of silicon fertilization on crop yield quantity and quality—A literature review in Europe. Plants 2018, 7, 54. [Google Scholar] [CrossRef] [PubMed] [Green Version]
  44. Paul, K.; Sorrentino, M.; Lucini, L.; Rouphael, Y.; Cardarelli, M.; Bonini, P.; Miras Moreno, M.B.; Reynaud, H.; Canaguier, R.; Trtílek, M.; et al. A combined phenotypic and metabolomic approach for elucidating the biostimulant action of a plant-derived protein hydrolysate on tomato grown under limited water availability. Front. Plant Sci. 2019, 10, 493. [Google Scholar] [CrossRef]
  45. Niu, J.; Liu, C.; Huang, M.; Liu, K.; Yan, D. Effects of foliar fertilization: A review of current status and future perspectives. J. Soil Sci. Plant. Nutr. 2021, 21, 104–118. [Google Scholar] [CrossRef]
  46. Ruiz, J.M.; Castilla, N.; Romero, L. Nitrogen metabolism in pepper plants applied with different bioregulators. J. Agric. Food Chem. 2000, 48, 2925–2929. [Google Scholar] [CrossRef] [PubMed]
  47. Lisiecka, J.; Knaflewski, M.; Spizewski, T.; Fraszczak, B.; Kaluzewicz, A.; Krzesinski, W. The effect of animal protein hydrolysate on quantity and quality of strawberry daughter plants cv.‘Elsanta’. Acta Sci. Pol. Hortorum Cultus. 2011, 10, 31–40. Available online: https://czasopisma.up.lublin.pl/index.php/asphc/article/view/3173 (accessed on 10 November 2022).
  48. Colla, G.; Hoagland, L.; Ruzzi, M.; Cardarelli, M.; Bonini, P.; Canaguier, R.; Rouphael, Y. Biostimulant action of protein hydrolysates: Unraveling their effects on plant physiology and microbiome. Front. Plant Sci. 2017, 8, 2202. [Google Scholar] [CrossRef] [Green Version]
  49. Sadak, S.H.M.; Abdelhamid, M.T.; Schmidhalter, U. Effect of foliar application of aminoacids on plant yield and physiological parameters in bean plants irrigated with seawater. Acta Biol. Colomb. 2015, 20, 141–152. [Google Scholar] [CrossRef]
  50. Ertani, A.; Cavani, L.; Pizzeghello, D.; Brandellero, E.; Altissimo, A.; Ciavatta, C. Biostimulant activities of two protein hydrolysates on the growth and nitrogen metabolism in maize seedlings. J. Plant. Nutr. Soil Sci. 2009, 172, 237–244. [Google Scholar] [CrossRef]
  51. Lucini, L.; Rouphael, Y.; Cardarelli, M.; Bonini, P.; Baffi, C.; Colla, G. A vegetal biopolymer-based biostimulant promoted root growth in melon while triggering brassinosteroids and stress-related compounds. Front. Plant Sci. 2018, 9, 472. [Google Scholar] [CrossRef] [Green Version]
  52. Desoky, E.-S.M.; Elrys, A.S.; Mansour, E.; Eid, R.S.M.; Selem, E.; Rady, M.M.; Ali, E.F.; Mersal, G.A.M.; Semida, W.M. Application of biostimulants promotes growth and productivity by fortifying the antioxidant machinery and suppressing oxidative stress in faba bean under various abiotic stresses. Sci. Hortic. 2021, 288, 110340. [Google Scholar] [CrossRef]
  53. Fernández, V.; Eichert, T. Uptake of hydrophilic solutes through plant leaves: Current state of knowledge and perspectives of foliar fertilization. Crit. Rev. Plant Sci. 2009, 28, 36–68. [Google Scholar] [CrossRef] [Green Version]
  54. Fernández, V.; Bahamonde, H.A.; Peguero-Pina, J.J.; Gil-Pelegrín, E.; Sancho-Knapik, D.; Gil, L.; Goldbach, H.E.; Eichert, T. Physico-chemical properties of plant cuticles and their functional and ecological significance. J. Exp. Bot. 2017, 68, 5293–5306. [Google Scholar] [CrossRef]
  55. Eichert, T.; Fernández, V. Uptake and release of mineral elements by leaves and other aerial plant parts. In Marschner’s Mineral Nutrition of Higher Plants, 3rd ed.; Marschner, P., Ed.; Elsevier: Oxford, UK, 2012; pp. 71–84. [Google Scholar]
  56. Eichert, T.; Burkhardt, J. Quantification of stomatal uptake of ionic solutes using a new model system. J. Exp. Bot. 2001, 52, 771–781. [Google Scholar] [CrossRef] [PubMed] [Green Version]
  57. Burkhardt, J.; Basi, S.; Pariyar, S.; Hunsche, M. Stomatal penetration by aqueous solutions–an update involving leaf surface particles. New Phytol. 2012, 196, 774–787. [Google Scholar] [CrossRef] [PubMed]
  58. Li, C.; Wang, P.; Menzies, N.W.; Lombi, E.; Kopittke, P.M. Effects of changes in leaf properties mediated by methyl jasmonate (MeJA) on foliar absorption of Zn, Mn and Fe. Ann. Bot. 2017, 120, 405–415. [Google Scholar] [CrossRef]
  59. Khayet, M.; Fernández, V. Estimation of the solubility parameters of model plant surfaces and agrochemicals: A valuable tool for understanding plant surface interactions. Theor. Biol. Med. Model. 2012, 9, 45. [Google Scholar] [CrossRef] [Green Version]
  60. Schönher, J. Calcium chloride penetrates plant cuticles via aqueous pores. Planta 2000, 212, 112–118. [Google Scholar] [CrossRef] [PubMed]
  61. Fernández, V.; Eichert, T.; Del Río, V.; López-Casado, G.; Heredia-Guerrero, J.A.; Abadía, A.; Heredia, A.; Abadía, J. Leaf structural changes associated with iron deficiency chlorosis in field-grown pear and peach: Physiological implications. Plant Soil. 2008, 311, 161–172. [Google Scholar] [CrossRef] [Green Version]
  62. Colla, G.; Rouphael, Y.; Canaguier, R.; Svecova, E.; Cardarelli, M. Biostimulant action of a plant-derived protein hydrolysate produced through enzymatic hydrolysis. Front. Plant Sci. 2014, 5, 448. [Google Scholar] [CrossRef]
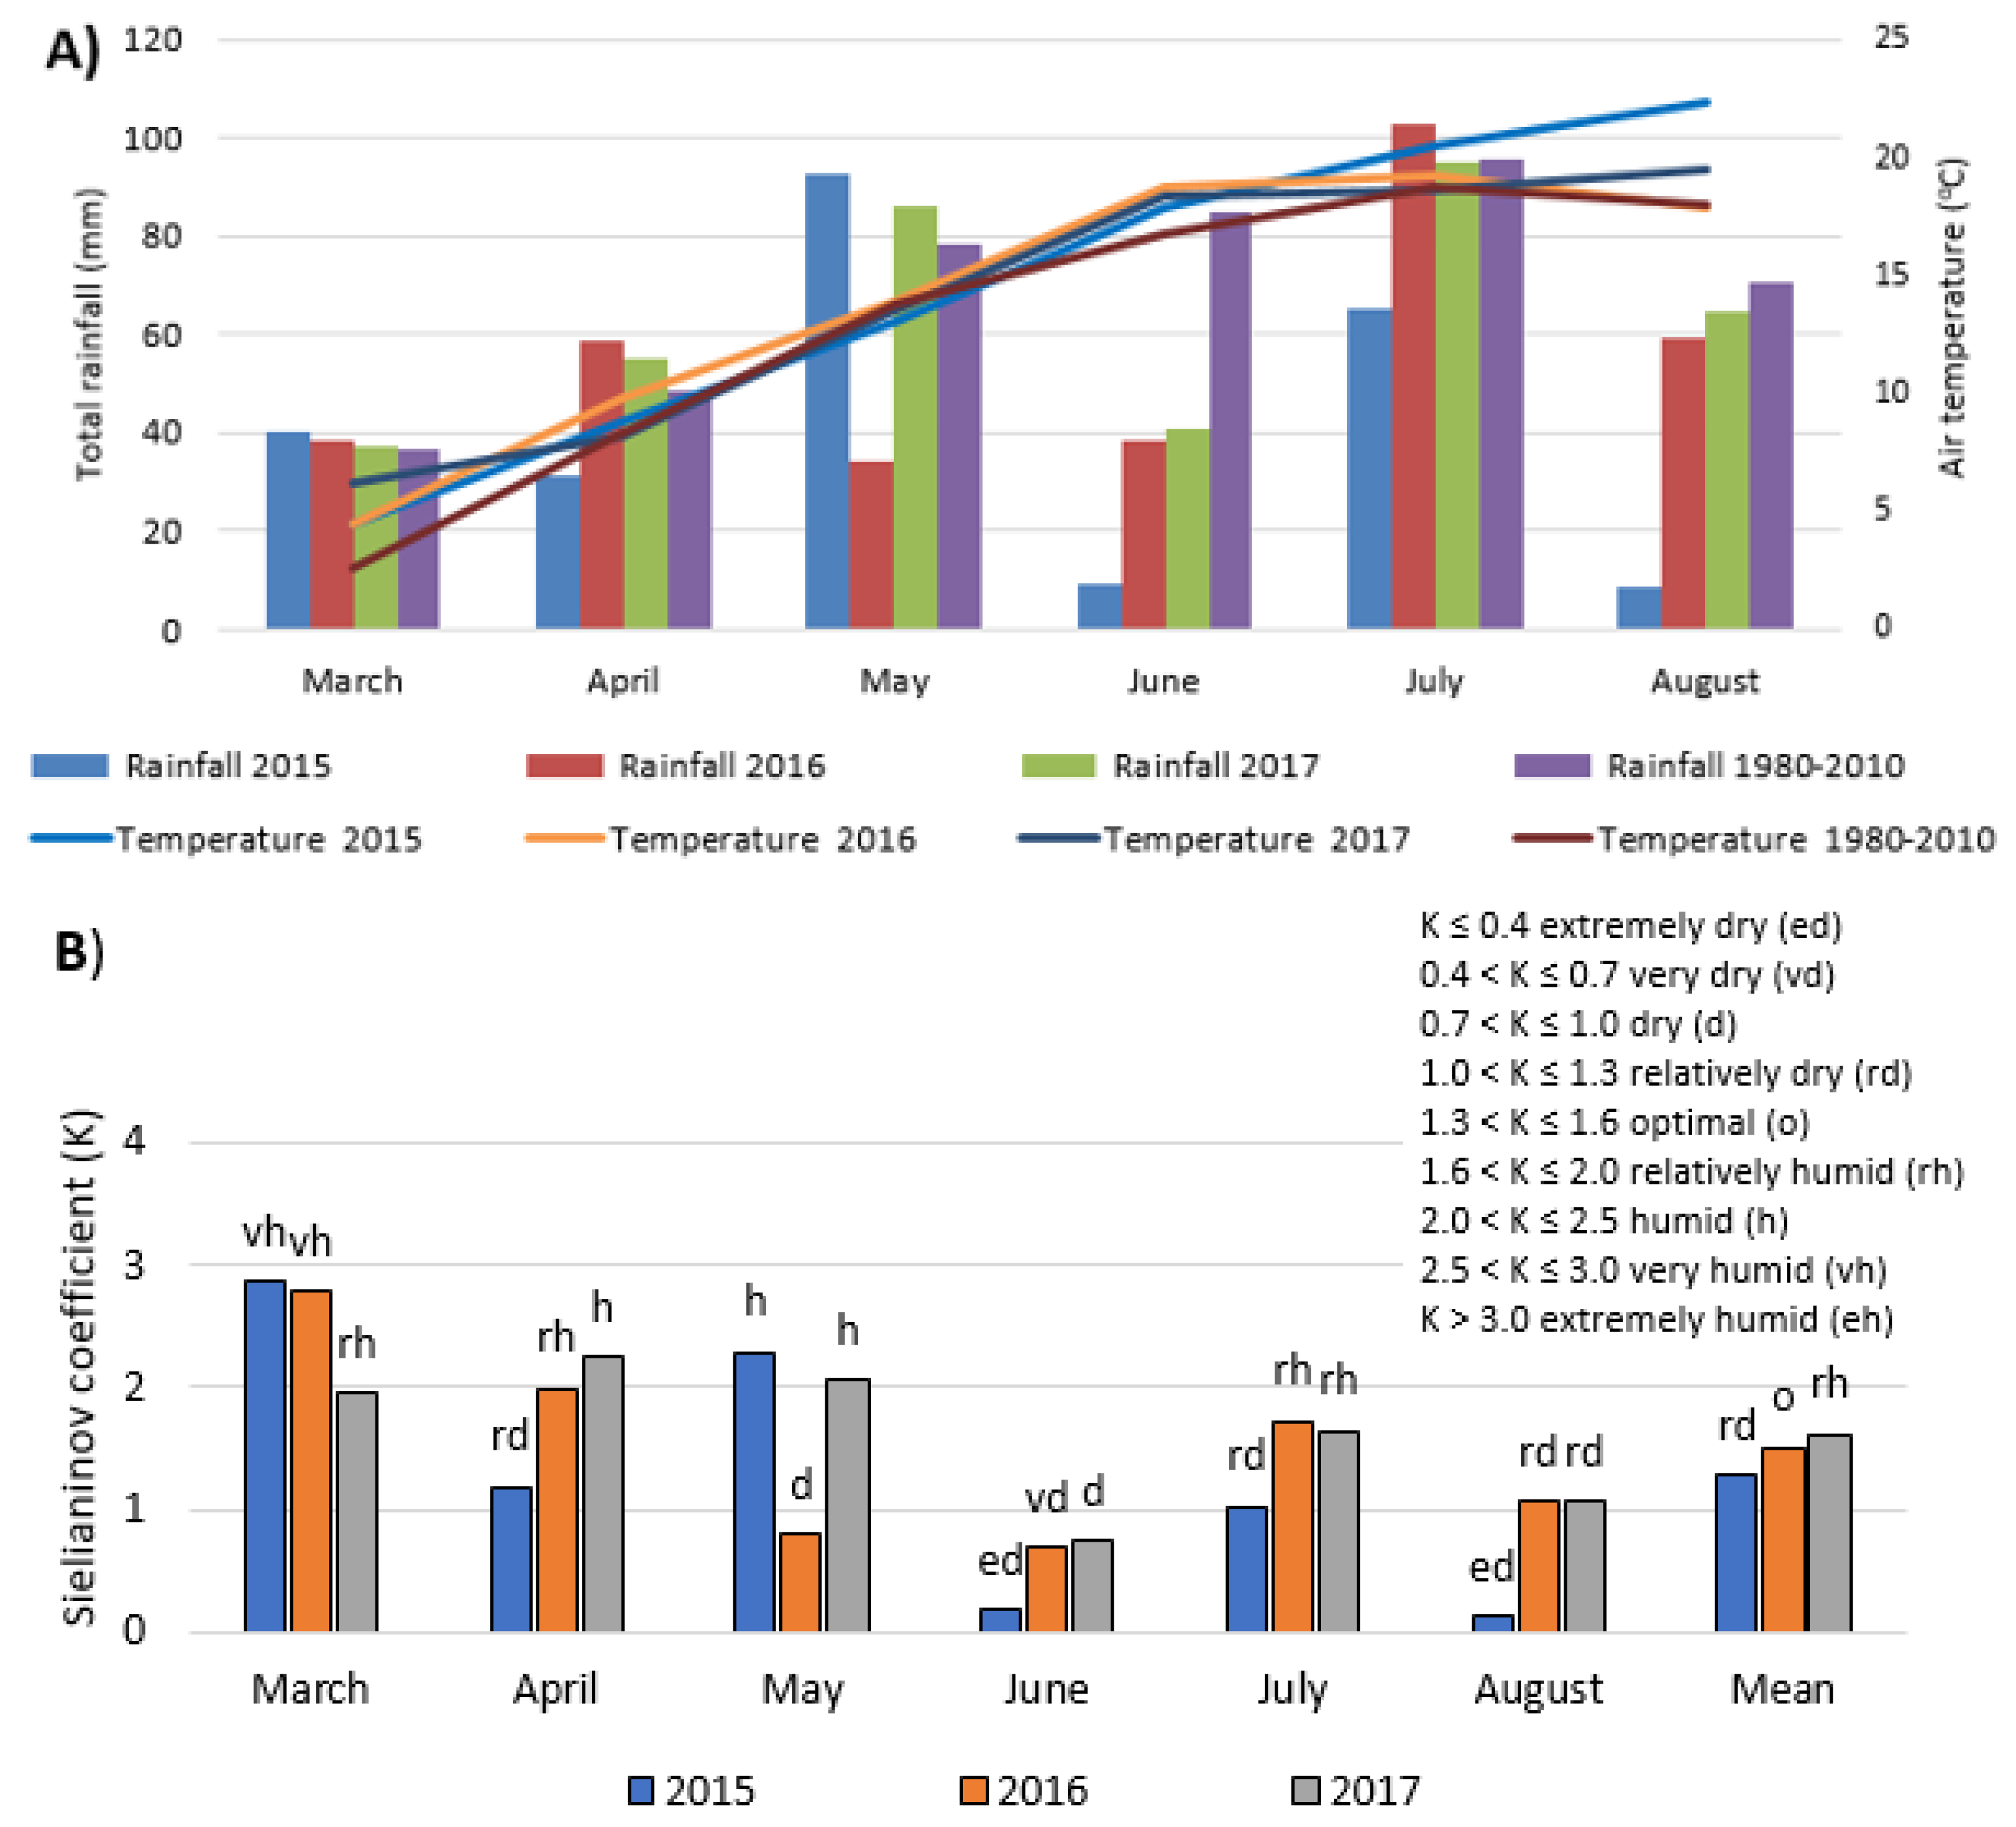
Figure 1. Meteorological conditions during pea growing season. (A) Monthly mean air temperature and total rainfall in 2015, 2016, 2017 and mean for 1980–2010 (data from the meteorological station of the Podkarpackie Agricultural Advisory Center, south-eastern Poland); (B) Hydrothermal conditions according to the Sielianinov coefficient (K) [36].
Agronomy 12 03189 g001
Figure 2. Relative Chl content in pea bracts under the interaction of years and foliar fertilization. N1—fertilizers/biostimulators of plant origin, N2—biostimulants of animal origin. Error bars are standard deviations of the means. Different letters above the columns indicate significant difference between treatments: small letters for fertilization and capital letters for measurement terms (ANOVA, Tukey test) at p < 0.05.
Agronomy 12 03189 g002
Figure 3. Effect of interaction of foliar fertilization and years in shaping Chl fluorescence parameters measured in pea bracts: (A) Fv/Fm, (B) Fv/F0, (C) PI. N1—fertilizers/biostimulators of plant origin, N2—biostimulants of animal origin. Error bars are standard deviations of the means. Different letters above the columns indicate significant difference between treatments: small letters for fertilization and capital letters for measurement terms (ANOVA, Tukey test) at p < 0.05.
Agronomy 12 03189 g003aAgronomy 12 03189 g003b
Figure 4. Effect of interaction of foliar fertilization and years in shaping gas exchange parameters in pea bracts: (A) intensity of photosynthesis net (Pn); (B) transpiration rate (E); (C) stomatal conductance (gs); (D) intercellular CO2 concentration (Ci). N1−fertilizers/biostimulators of plant origin, N2−biostimulants of animal origin. Error bars are standard deviations of the means. Different letters above the columns indicate significant difference between treatments: small for fertilization and capital for measurement terms (ANOVA, Tukey test) at p < 0.05.
Agronomy 12 03189 g004
Table 1. The relative Chl content (CCI unit) in the pea bract at the two growth stages (BBCH 65 and BBCH 97) depending on fertilization (F; Control, N1, N2), cultivar (eight cultivars) and research years (2015–2017).
Source of VariationRelative Chl Content (CCI Unit)
BBCH 65BBCH 79
Foliar fertilizationControl24.4 ± 7.11 aB17.3 ± 7.36 aA
N127.0 ± 8.33 bB20.1 ± 9.75 bA
N226.4 ± 7.73 bB20.7 ± 9.00 bA
CultivarAkord29.0 ± 8.47 dB17.3 ± 8.47 aA
Batuta26.8 ± 8.76 b–dB23.5 ± 9.62 cA
Cysterski25.5 ± 6.76 a–cB16.7 ± 8.83 aA
Ezop25.0 ± 7.66 a–cB19.8 ± 7.95 bA
Lasso24.6 ± 8.34 abB21.3 ± 9.70 bA
Mecenas27.2 ± 7.21 cdB19.5 ± 8.03 bA
Mentor23.3 ± 7.14 aB15.9 ± 6.40 aA
Tarchalska26.1 ± 7.10 bcB20.8 ± 9.50 bA
Year201531.8 ± 4.71 bB23.2 ± 4.23 bA
201616.4 ± 2.95 aB8.4 ± 2.60 aA
201729.6 ± 3.62 bB26.4 ± 5.14 cA
Mean25.9 ± 7.79 B19.3 ± 8.86 A
Significance
Sampling year (Y)******
Cultivar (C)******
Fertilization (F)******
Y × CNS***
Y × F****
C × FNSNS
Y × C × FNSNS
Note: N1—fertilizers/biostimulators of plant origin, N2—biostimulants of animal origin. Data are expressed as means ± SD. Within each column, values followed by the same letter are not significantly different. Different letters above the columns indicate significant difference between treatments. Capital for measurement terms and small for fertilization (two-factor ANOVA. Tukey test) at p < 0.05. * p < 0.05; *** p < 0.001; NS—not significant.
Table 2. Chl a fluorescence parameters in pea bracts at two growth stages (BBCH 65 and BBCH 97) according to fertilization (F; Control, N1, N2), cultivar (C; eight cultivars) and years of study (Y; 2015–2017).
FactorsCultivarFv/FmFv/F0PI
BBCH 65BBCH 79BBCH 65BBCH 79BBCH 65BBCH 79
Foliar fertilizationControl0.796 ± 0.019 aB0.781 ± 0.021 aA3.96 ± 0.41 aB3.68 ± 0.40 aA5.62 ± 2.02 aB4.14 ± 1.33 aA
N10.812 ± 0.017 bB0.802 ± 0.021 bA4.37 ± 0.42 bB4.13 ± 0.47 bA6.95 ± 2.52 bB6.04 ± 1.97 cA
N20.804 ± 0.021 abB0.787 ± 0.032 abA4.18 ± 0.48 abB3.83 ± 0.58 abA5.76 ± 2.53 aB5.17 ± 2.11 bA
CultivarAkord0.798 ± 0.022 aB0.787 ± 0.028 A4.04 ± 0.52 aB3.81 ± 0.55 aA6.59 ± 2.76 abB4.85 ± 1.60 abA
Batuta0.814 ± 0.016bB0.797 ± 0.028 A4.43 ± 0.43 bB4.04 ± 0.56 aA7.04 ± 2.21 bB5.70 ± 1.90 bA
Cysterski0.805 ± 0.017 aB0.788 ± 0.028 A4.19 ± 0.39 aB3.83 ± 0.53 aA5.64 ± 2.07 aB4.58 ± 1.90 aA
Ezop0.802 ± 0.024 aB0.788 ± 0.031 A4.14 ± 0.57 aB3.87 ± 0.62 abA6.04 ± 3.25 aB5.23 ± 1.96 abA
Lasso0.805 ± 0.022 aB0.793 ± 0.024 A4.20 ± 0.51 aB3.94 ± 0.46 abA6.05 ± 2.62 aA5.62 ± 2.36 bA
Mecenas0.804 ± 0.017 aB0.786 ± 0.027 A4.18 ± 0.43 aB3.77 ± 0.50 abA5.89 ± 2.32 aB4.82 ± 1.82 abA
Mentor0.801 ± 0.021 aB0.787 ± 0.026 A4.10 ± 0.44 aB3.80 ± 0.50 abA5.66 ± 1.97 aB4.58 ± 2.17 aA
Tarchalska0.802 ± 0.014 aB0.795 ± 0.020 A4.09 ± 0.34 aB3.95 ± 0.43 bA5.97 ± 1.86 aA5.56 ± 1.89 abA
Year20150.817 ± 0.010 bB0.806 ± 0.016 cA4.49 ± 0.29 bB4.22 ± 0.32 cA8.57 ± 1.95 cB5.38 ± 1.64 bA
20160.788 ± 0.019 aB0.768 ± 0.026 aA3.81 ± 0.39 aB3.44 ± 0.44 aA4.66 ± 1.64 aB3.91 ± 1.52 aA
20170.806 ± 0.018 bB0.796 ± 0.021 bA4.22 ± 0.43 bB3.98 ± 0.44 bA5.10 ± 1.47 bA6.05 ± 2.13 cB
Mean0.804 ± 0.020 B0.790 ± 0.027 A4.17 ± 0.47 B3.88 ± 0.52 A6.11 ± 2.44 B5.12 ± 1.99 A
Significance
Sampling year (Y)******************
Cultivar (C)***NS***********
Fertilization (F)****************
Y × C***NS********NS
Y × F******************
C × FNSNSNSNSNSNS
Y × C × FNSNSNSNSNSNS
Note: Fv/Fm—maximum photochemical efficiency of PSII; Fv/F0—peak efficiency of water decomposition reaction; PI—PSII efficiency; N1—fertilizers/biostimulators of plant origin, N2—biostimulants of animal origin. Data are expressed as means ± SD. Within each column, values followed by the same letter are not significantly different. Different letters above the columns indicate significant difference between treatments: small for fertilization and capital for measurement terms (ANOVA, Tukey test) at p < 0.05; ** p < 0.01, *** p < 0.001; NS—not significant.
Table 3. The intensity of photosynthesis net (Pn), transpiration rate (E), stomatal conductance (gs), and intercellular CO2 concentration (Ci) in pea bracts at two growth stages (BBCH 65 and BBCH 97) according to fertilization (F; Control, N1, N2), cultivar (C; eight cultivars) and years of study (Y; 2015–2017).
FactorCultivarPn
(µmol CO2·m−2·s−1)
E
(mol H2O·m−2·s−1)
gs
(mol·m−2·s−1)
Ci
(µmol (CO2)·mol−1)
BBCH 65BBCH 79BBCH 65BBCH 79BBCH 65BBCH 79BBCH 65BBCH 79
Foliar fertilizationControl20.2 ± 9.2 aB14.7 ± 2.09 aA4.38 ± 1.08 aB3.39 ± 0.70 aA0.570 ± 0.222 aA0.429 ± 0.205 aA236 ± 60.0 A255 ± 23.7 aB
N124.6 ± 12.3 cB16.4 ± 2.50 cA5.25 ± 1.01 cB3.71 ± 0.71 bA0.826 ± 0.268 cB0.497 ± 0.260 bA233 ± 73.3 A264 ± 18.6 bB
N223.0 ± 11.5 bB15.3 ± 3.59 bA4.66 ± 1.15 bB3.38 ± 0.83 aA0.707 ± 0.260 bB0.441 ± 0.225 abA234 ± 68.0 A269 ± 22.9 bB
CultivarAkord22.8 ± 11.8 B16.0 ± 2.54 bcA4.75 ± 1.44 B3.60 ± 0.7 bcA0.744 ± 0.320 B0.490 ± 0.201 b–dA237 ± 2.7 A268 ± 22.9 bcB
Batuta22.9 ± 11.4 B15.9 ± 3.61 bcA4.62 ± 1.14 B3.49 ± 0.81 a–cA0.703 ± 0.300 B0.560 ± 0.318 dA234 ± 66.7 A270 ± 18.6 cB
Cysterski23.1 ± 11.1 B14.8 ± 3.02 abA4.68 ± 1.15 B3.09 ± 0.52 aA0.717 ± 0.299 B0.391 ± 0.171 a–cA232 ± 73.1 A259 ± 22.1 abB
Ezop22.7 ± 11.2 B15.6 ± 2.67 a–cA4.78 ± 1.20 B3.70 ± 0.70 cA0.707 ± 0.268 B0.508 ± 0.258 cdA233 ± 72.9 A267 ± 24.6 bcB
Lasso23.5 ± 11.9 B15.4 ± 2.75 a–cA4.88 ± 0.93 B3.65 ± 1.04 bcA0.681 ± 0.154 B0.443 ± 0.189 a–dA232 ± 68.2 A259 ± 22.5 abB
Mecenas21.2 ± 10.4 B14.7 ± 2.95 aA4.79 ± 1.08 B3.26 ± 0.59 abA0.679 ± 0.257 B0.345 ± 0.149 aA239 ± 67.8 A254 ± 23.4 aB
Mentor22.5 ± 11.8 B15.0 ± 2.27 abA4.88 ± 1.12 B3.39 ± 0.72 a–cA0.735 ± 0.517 B0.367 ± 0.146 abA236 ± 63.5 A257 ± 19.4 aB
Tarchalska22.2 ± 10.9 B16.3 ± 2.96 cA4.73 ± 1.02 B3.74 ± 0.67 cA0.642 ± 0.242 B0.543 ± 0.277 dA231 ± 67.4 A268 ± 22.0 bcB
Year201537.5 ± 6.1 bB16.3 ± 1.94 bA5.64 ± 0.89 bB3.58 ± 0.64 bA0.664 ± 0.193 bB0.462 ± 0.170 bA144 ± 26.9 aA243 ± 14.6 aB
201614.7 ± 1.9 aB12.8 ± 2.10 aA4.26 ± 1.24 aB3.19 ± 0.81 aA0.587 ± 0.507 aB0.326 ± 0.144 aA271 ± 17.5 bA275 ± 17.1 bB
201715.6 ± 1.7 aA17.3 ± 2.35 cB4.39 ± 0.61 aB3.70 ± 0.74 bA0.852 ± 0.244 cB0.580 ± 0.284 cA288 ± 11.7 cB270 ± 20.9 bA
Mean22.6 ± 11.2 B15.5 ± 2.89 A4.76 ± 1.13 B3.49 ± 0.76 A0.701 ± 0.271 B0.456 ± 0.232 A234 ± 7.1 A263 ± 22.5 B
Significance
Sampling year (Y)************************
Cultivar (C)NS***NS***NS***NS***
Fertilization (F)*****************NS***
Y × CNS********NS***NS**
Y × F************************
C × FNSNSNS***NSNSNS**
Y × C × FNSNS******NSNS***
Note: N1—fertilizers/biostimulators of plant origin, N2—biostimulants of animal origin. Data are expressed as means ± SD. Within each column, values followed by the same letter are not significantly different. Different letters above the columns indicate significant difference between treatments: small for fertilization and capital for measurement terms (ANOVA, Tukey test) at p < 0.05. ** p < 0.01, *** p < 0.001; NS—not significant.
Publisher’s Note: MDPI stays neutral with regard to jurisdictional claims in published maps and institutional affiliations.