Article

Evaluation and Identification of Stable Chickpea Lines for Yield-Contributing Traits from an Association Mapping Panel

1
Genetics Division, Indian Agricultural Research Institute (IARI), Pusa Campus, New Delhi 110012, India
2
National Institute of Plant Genomic Research (NIPGR), Jawaharlal Nehru University Campus, Aruna Asaf Ali Marg, New Delhi 110067, India
3
Genomic Breeding Lead, Khalifa Center for Genetic Engineering and Biotechnology (KCGEB), UAE University, Al Ain 15551, United Arab Emirates
4
State Agricultural Biotechnology Centre, Centre for Crop and Food Innovation, Food Futures Institute, Murdoch University, Murdoch 6150, Australia
5
Department of Plant Breeding and Genetics, Agricultural University, Kota, Rajasthan 313601, India
*
Author to whom correspondence should be addressed.
Agronomy 2022, 12(12), 3115; https://doi.org/10.3390/agronomy12123115
Submission received: 17 September 2022 / Revised: 30 November 2022 / Accepted: 7 December 2022 / Published: 8 December 2022
(This article belongs to the Special Issue Utilizing Genetic Resources for Agronomic Traits Improvement)

Abstract

:
An association mapping panel consisting of 380 genotypes of chickpea was evaluated for three different years, including 2014–2015, 2015–2016 and 2016–2017, for yield-contributing parameters, including the seed number and seed weight. The AMMI analysis presented mainly concentrated on the seed weight and seed number, which are the two most important yield-contributing traits. The genotypes contributed 93.08% of the total variance, while the interaction effect was comparatively low, with 4.1% for the two traits. AMMI biplot analysis identified IG5986, IG5982, ILC6025 and ICCV14307 as desirable genotypes for the seed weight and IG5893, ILC6891 and IG5856 for the seed number. Identifying stable genotypes would help in strategic planning for yield improvement through component trait breeding.

1. Introduction

The extent of protein calorie deficiency has rampant effects on the infants and young children of developing and underdeveloped countries. It is also further aggravated by various pathological and physiological abnormalities due to a lack of sufficient protein and calories in the diet [1]. Near about 170 million people, mostly school going children’s and lactating mothers in developing countries of Asia and Africa are severely impacted by hidden hunger or malnutrition [2]. As an economic consequence of hidden hunger every year there are losses of up to 11% of gross domestic product (GDP) in African and Asian countries [3].
Legumes are special food crops with high protein value and are, therefore, considered as an indispensable food source to fill in the protein gap globally. Among pulse crops, chickpea is one of the oldest tamed pulse crops about 7450 years back in the regions of Middle East [4]. It is considered as the world’s most important legumes, covering a global area of 13.98 Mha and with overall production of 13.7 Mt, it comes second only after dry beans in the world’s food legume production [5]. India tops in chickpea production globally, with yearly production of 9.8 Mt, representing 70% of the total world chickpea production from an estimated area of 9.9 Mha [5]. Chickpea offers high nutritional value for humans; it has rich protein value, which ranged from 20-30% in seeds. The dietary fibre, and constitutes approximately 40% carbohydrates and chickpea has up to 3-6% oil content in seed [6]. Further chickpea is also containing significant proportion of essential micronutrients such as, potassium, calcium, iron, zinc, phosphorus, and manganese making it one of the best composed dry legumes for human health and consumption [7]. Despite global lead in chickpea production as per the current projections of demand and supply, India needs to strengthen its domestic production to curtail increasing imports which is about 186,000 tonnes (USD 74 million) to become self-reliant of chickpea. To achieve that, identification of stable, high yielding and adaptive genotypes in is a necessity.
To achieve this, it is necessary to develop stable genotypes widely adapted to diverse climatic conditions and varying environments. To identify stable genotypes, the knowledge of GEI (genotype–environment interaction) is required, for which AMMI (additive main effects and multiplicative interaction), developed by Gauch, 1988 [8], is the most used method. AMMI analysis provides powerful information on the stability of a genotype in a general environment or in a particular environment, enabling mega-environment delineation. It employs biplots for the comprehension and study of the data. The seed weight and seed number are two important component traits of chickpea that are known to have the highest positive influence on the seed yield per plant [9,10,11]. The effect of seed size on the yield and yield components is significant for most of the traits, and the seed weight is an important yield determinant [12,13,14,15,16]. A positive correlation between seed size, seed yield and seed weight has also been confirmed, where larger-seeded chickpea has a higher seed yield [17]. Therefore, the component traits, including the seed weight and seed number, were used as the basis for identifying stable genotypes in the current study.

2. Materials and Methods

2.1. Plant Material

The planting material consisted of panel consisted landraces from the WANA region (West Asia and North Africa), training population and released varieties. Total three hundred and eighty genotypes were included in the study. These included 367 kabuli and 13 desi chickpea types (Table S1). The genotypes used were obtained from ICARDA (genomic population), ICAR-IARI and ICRISAT.
The materials were grown at ICAR, the Indian Agricultural Research Institute Research farm, New Delhi (280°382′ N, 770°802′ E), and laid out in the field in an augmented block design (ABD) with 30 cm spacing between the rows and 10 cm spacing between plants. The trial was undertaken and data were recorded for 3 consecutive years, including 2014–2015, 2015–2016 and 2016–2017 during the cropping season from October to April (Table 1). All the experiments were conducted in three replications with all standard chickpea agronomic practices.

2.2. Statistical Analysis

Genstat software (v.18.1, England & Wales) was used to analyse the data. ANOVA was used for seed weight and seed number to determine their statistical significance. Cumulative analysis for the 3 years of data was conducted after testing for the error variance of homogeneity. The AMMI model was used for stability analysis, as suggested by Zobel et al. [18], Gauch [19] and Purchase [20]. AMMI analysis is preferred, as it gives an estimate of the total G × E interaction effect of each genotype and further categorizes it into interaction components due to individual environments.

3. Results

A pooled ANOVA for seed weight and seed number across the years was performed, where different years were taken as random effects and genotypes were considered as fixed effects. The result shows high significance (p < 0.01) for seed weight and seed number for genotype (G), environmental (E) and interaction (GEI) effects, thus indicating the roles of all three types of effects, which is merely not random or due to chance (Table 2). The maximum variation was accounted for by genotypic effect due to seed weight and seed number, contributing 93.08% for both, respectively, followed by G × E effects, with 4.1% for the two traits. The minimum variation was accounted for by the environmental influence, with 0.37% for both traits.

3.1. AMMI Analysis

To deduce the appropriateness of the data in AMMI analysis, the genotype environment signal (GEs) was calculated [21]. Subtracting GEn (GE noise) from GEI was done to obtain GEs. For estimating GEN, the error mean sums of squares and degrees of freedom (df) for GE is prerequisite. Thus, in the very first stage included evaluation of GEN by multiplying the error mean sum of squares by the degrees of freedom for GE (2.6 × 758 = 1970.8 for both seed weight and seed number). Further, GEs was computed (10132 − 1970.8 = 8162.2 for both seed weight and seed number). When the SS due to GEN is nearly equivalent to the SS due to the GEI obtained in the ANOVA, it is claimed that GEI is buried in the noise and is hence a signal with low quality. However, SS owing to GEN was well below than GEI sum of squares in this investigation. As a result, the interaction virtually had a high signal to noise ratio. This highlighted the study’s ability to benefit from the AMMI analysis.

3.2. Ascertaining High-Yielding and Stable Genotypes

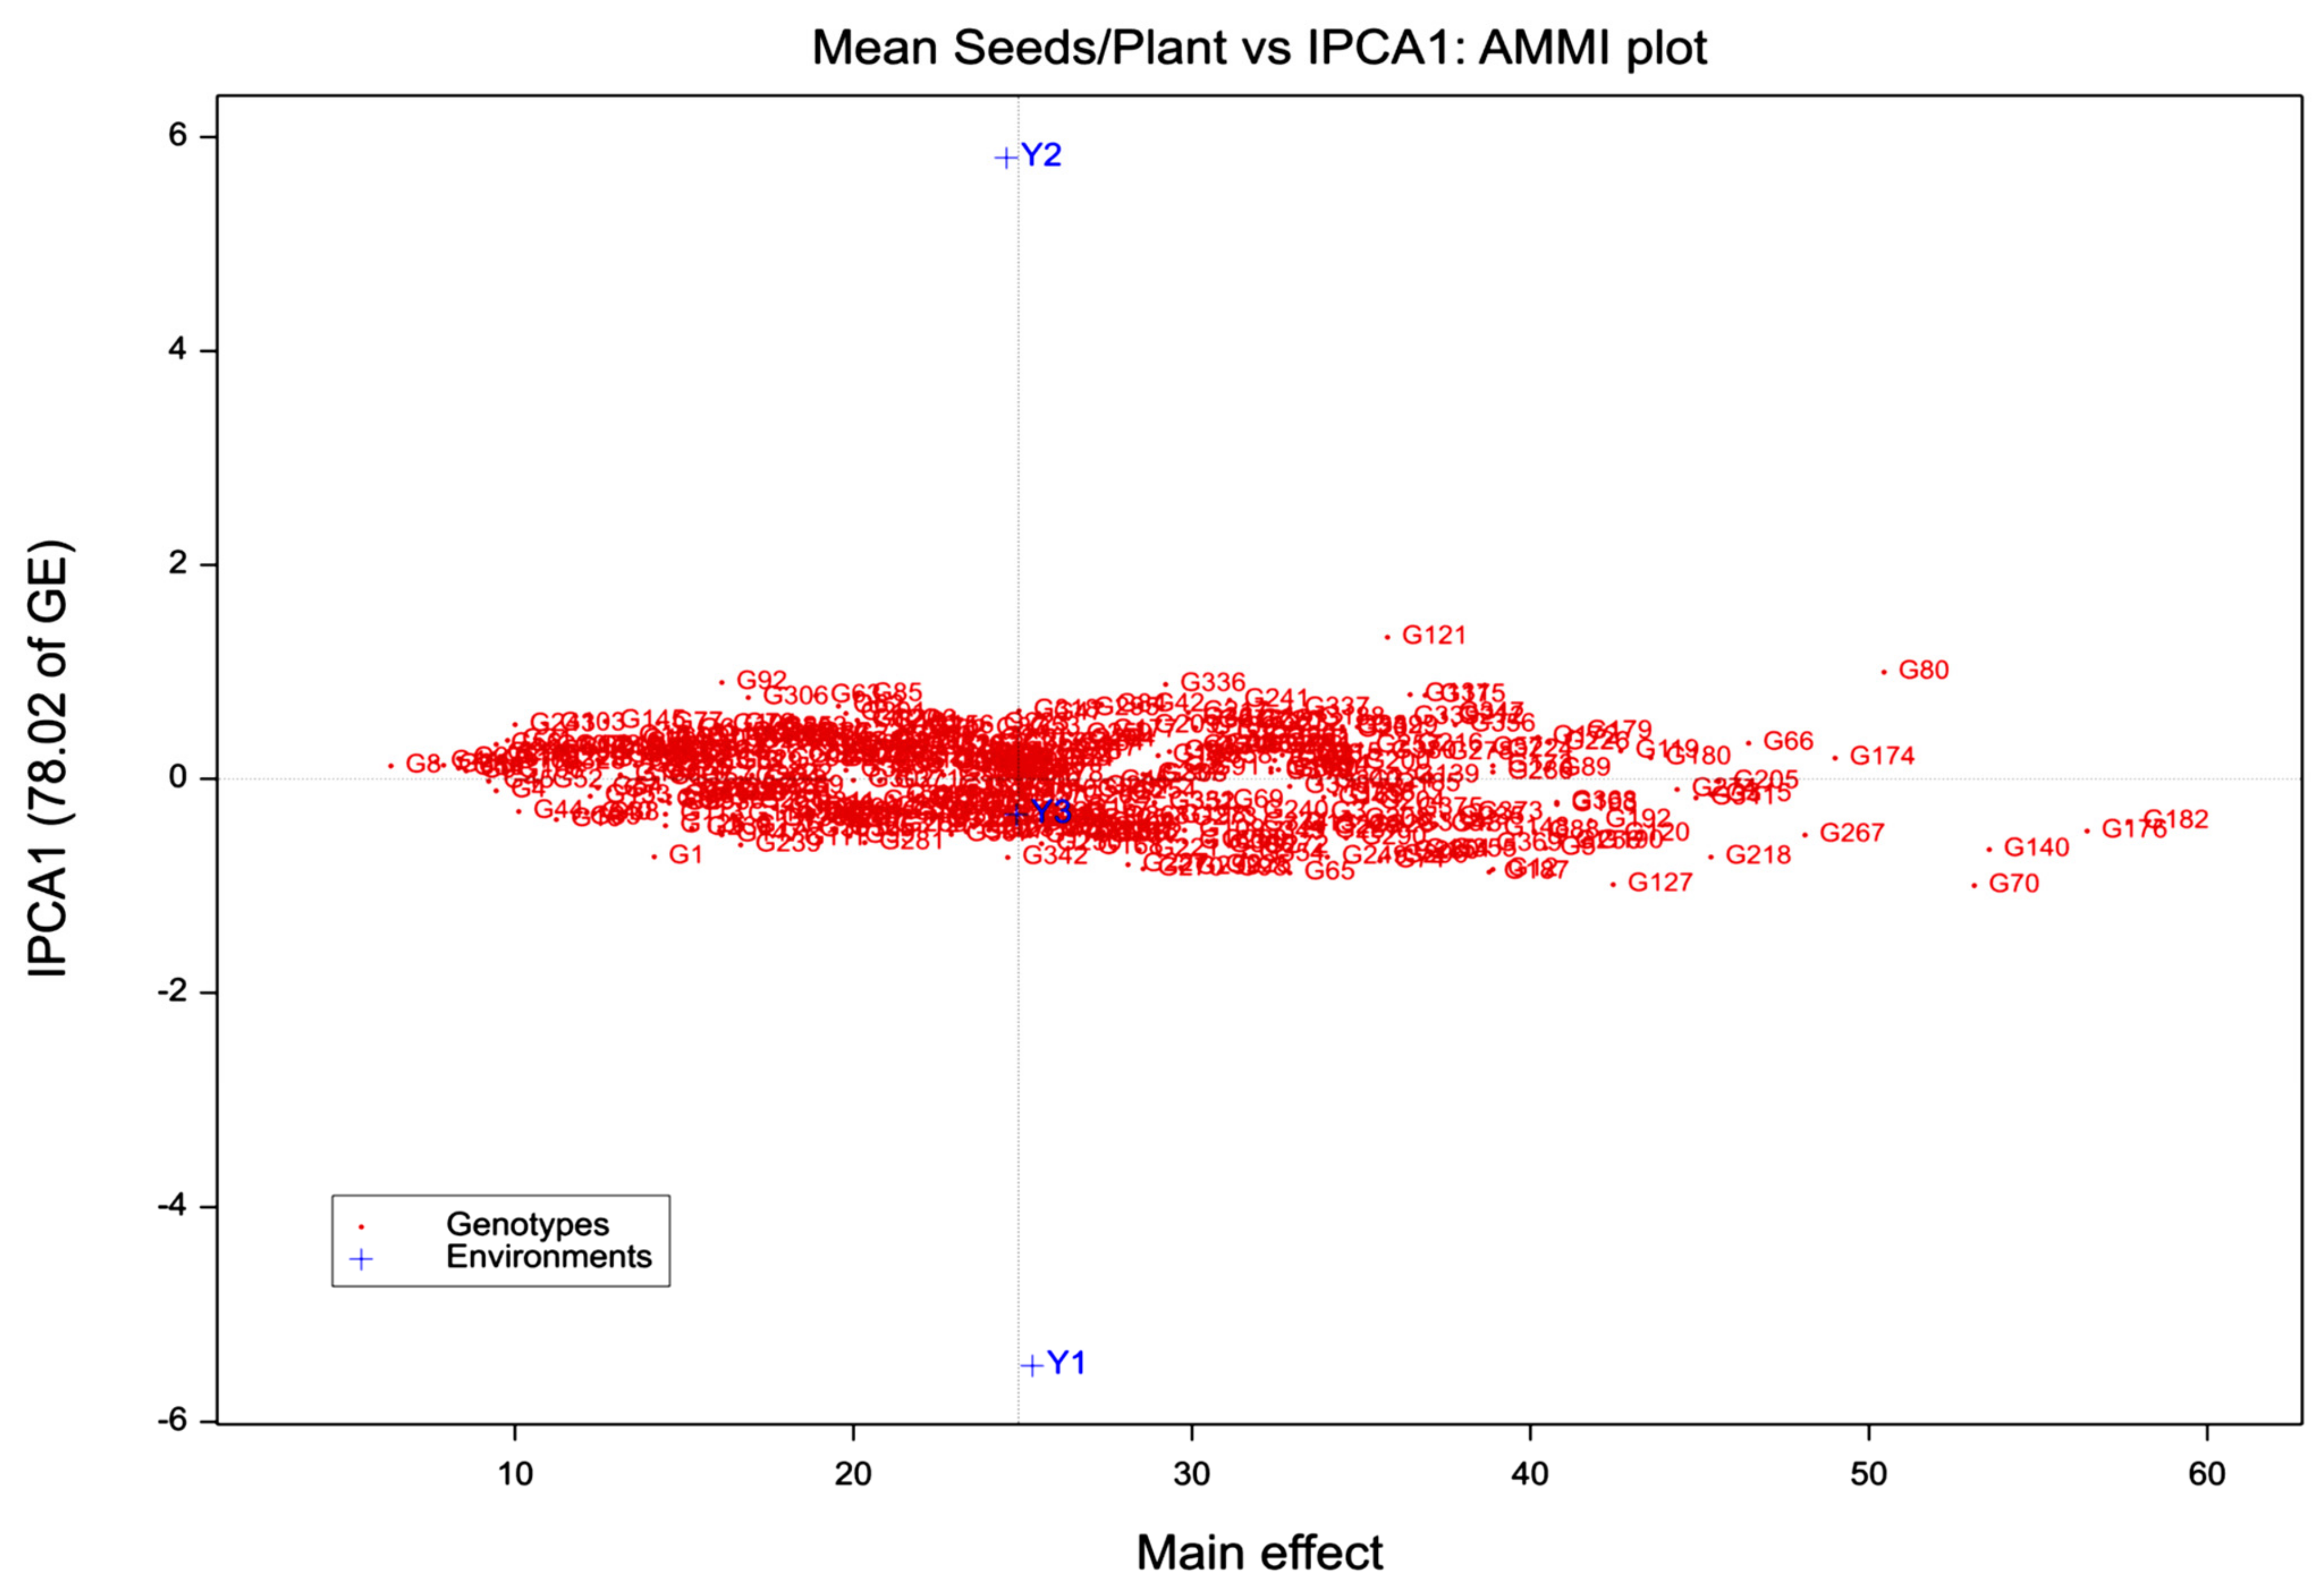
To understand the main effects and interactions for seed weight and seed number, an AMMI biplot was constructed (Figure 1 and Figure 2). AMMI biplot is a plot between the mean and the IPCA1 of GEI. The biplot reveals that when the main effects’ IPCA scores near to zero, there is little to no interaction between the genotype and the environment. Conversely, when a genotype and environment have the same sign on the IPCA axis, there is positive interaction; if there is a difference, there is negative interaction. In Figure 1, G369 was identified as the most stable genotype for seed weight, with the IPC1 score nearing zero (−0.009) and the mean seed weight being 37.33 g/100 seeds.
For the seed number per plant, the genotype with the highest mean seed number was G182 (57.67), but it was less stable (IPCA1 score of −0.78). The most stable genotype was G57, with an IPCA1 score close to zero (−0.03) and mean seed number of 38.44. Further, the most unstable genotype was identified to be G301, with a mean seed number of 27.11. Genotypes G80 and G140 showed good stability (scores of −0.28 and −0.37, respectively) with a high seed number (50.44 and 53.56, respectively).

3.3. AMM2 Biplot

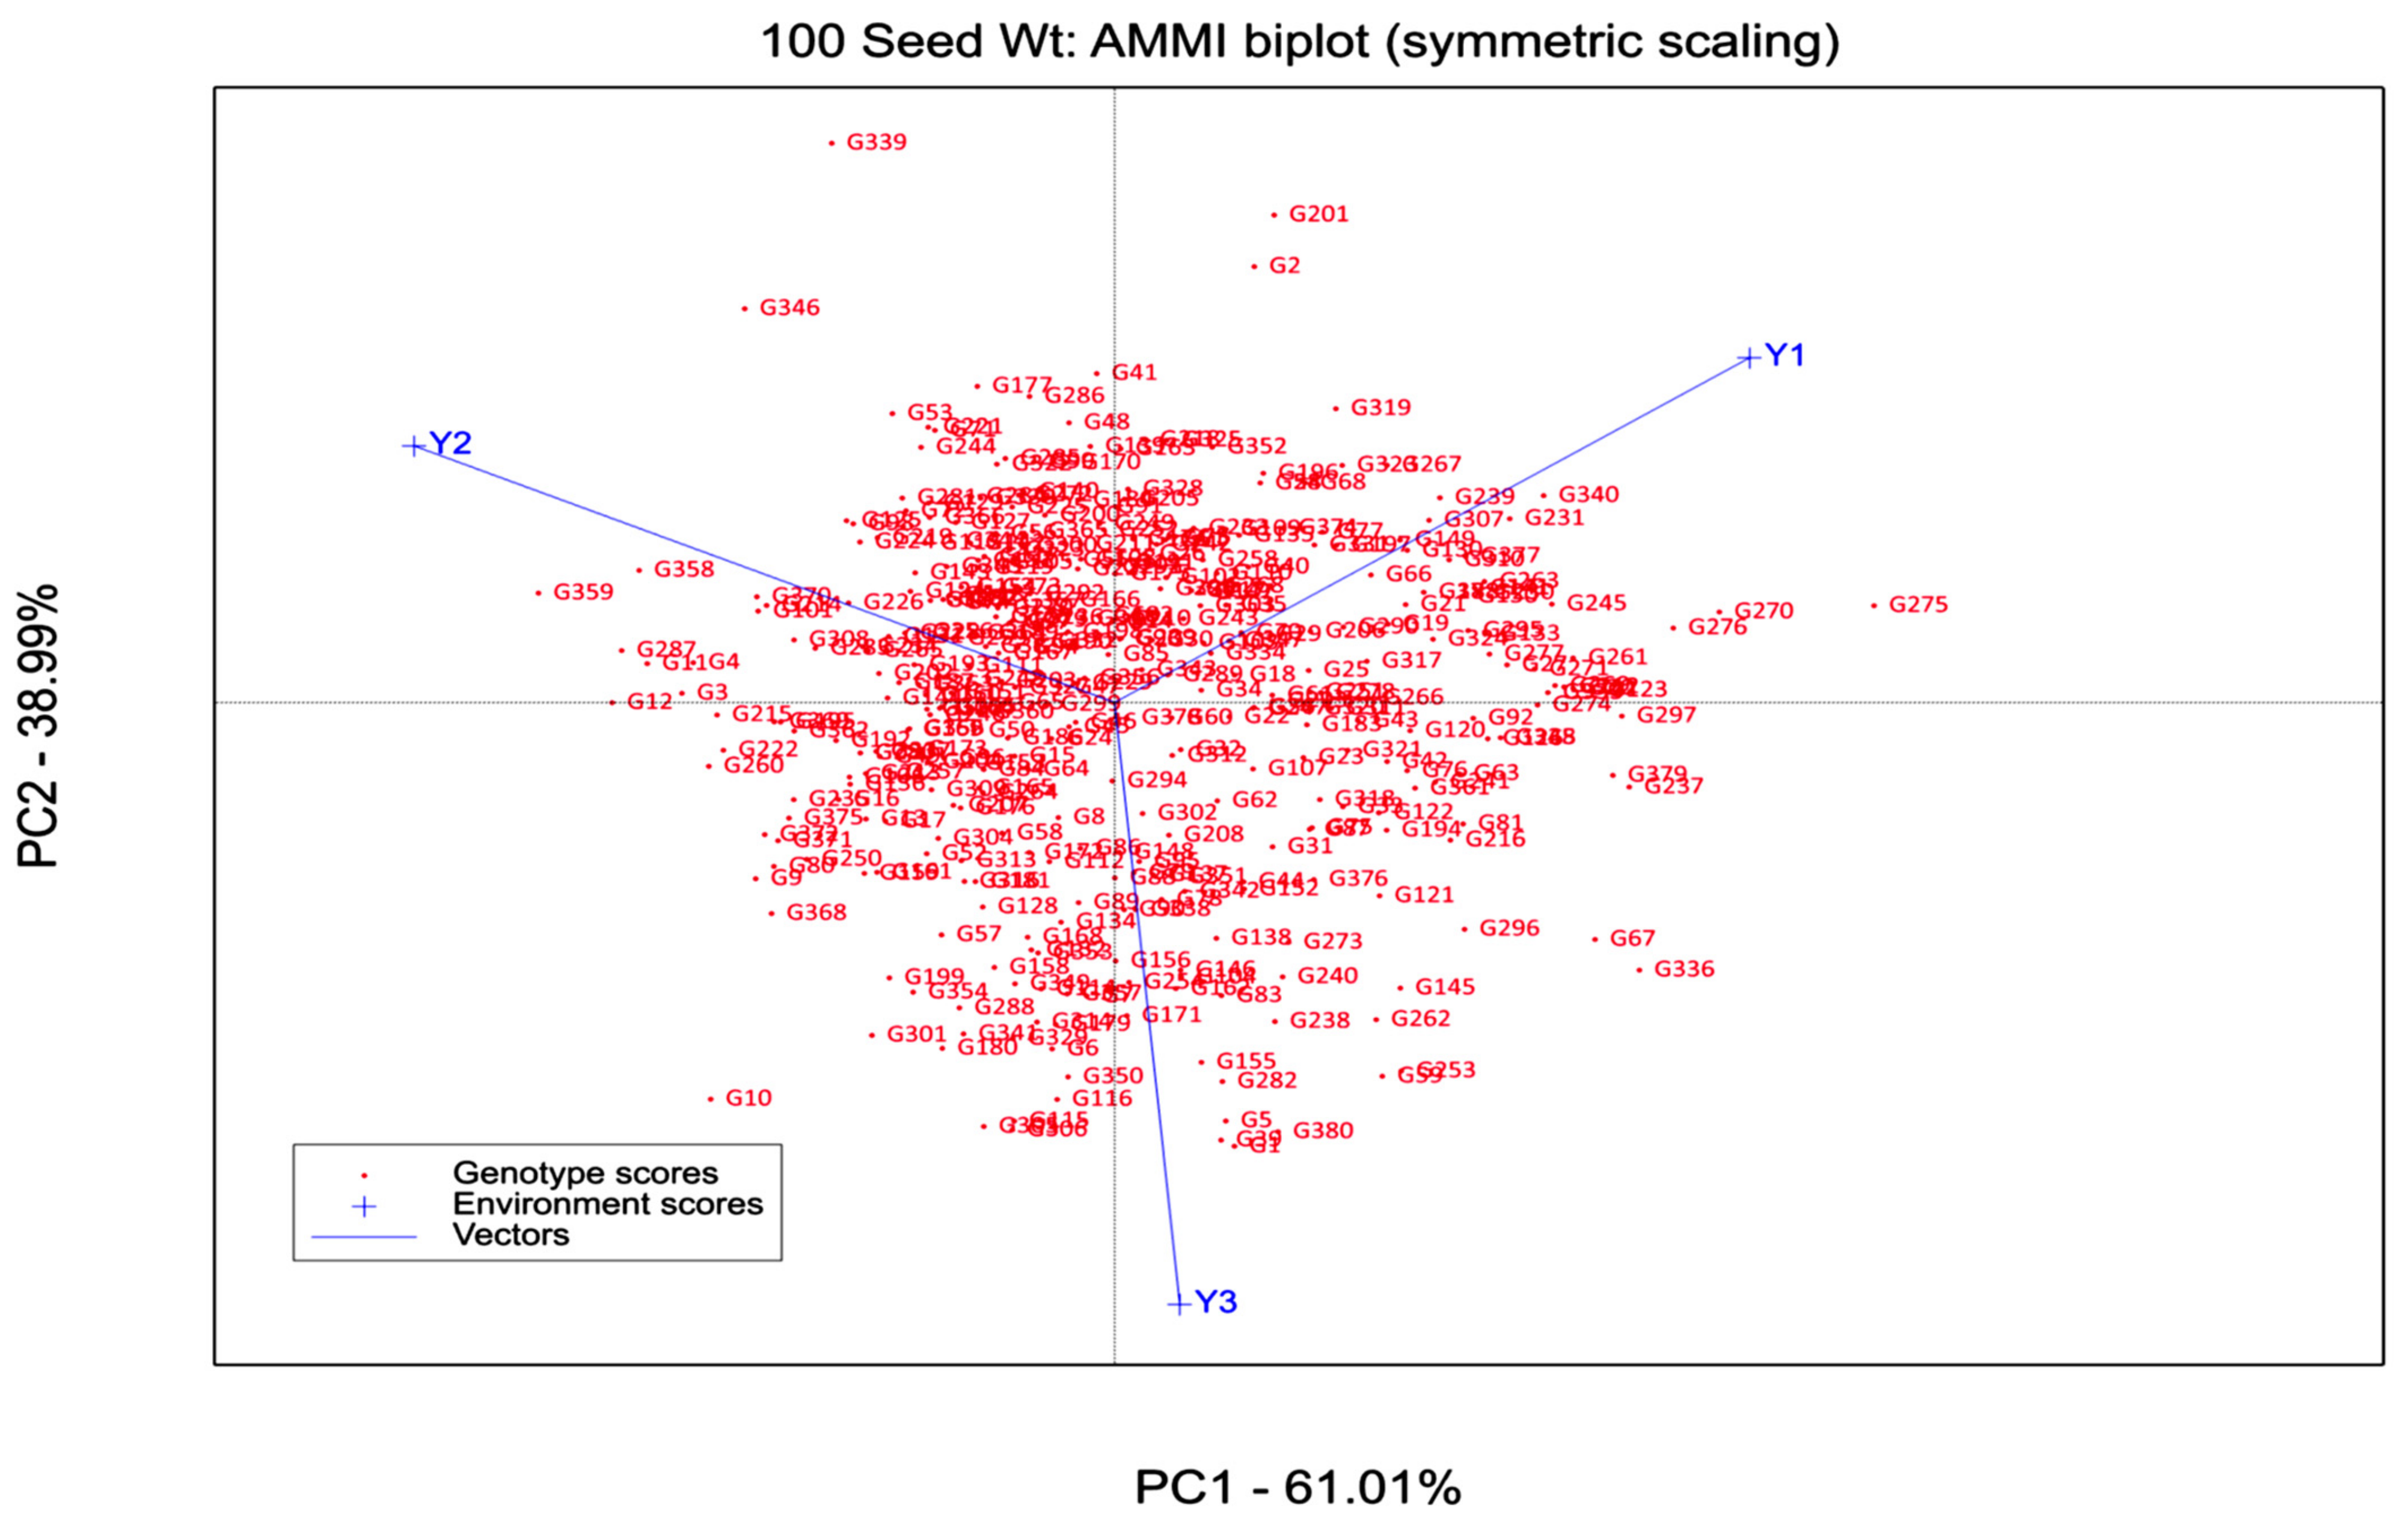
This biplot, which contrasts IPCA1 and IPCA2, illustrates how strongly each genotype interacts with the environment. In the biplot, for seed weight, IPC1 accounted for 61.01% of the interaction and IPC2 accounted for 38.99%. Further, for seed number, the first component, IPC1 explained 78.02% of the genotype and environment interaction and IPC2 described 21.98%. For both traits, the first two interaction components explained 100% of the G × E variation, leaving no residue or noise (Table 3).
The scattered genotypes near the origin indicate minimum interaction of these genotypes with the environment. The distances from the origin indicate the amount of interaction that occurred between genotypes and environments or vice versa [22]. From the biplot, G378, G34, G22, G85, G289, G312, and G32 were scattered close to the origin indicating minimal interactions with the environment for seed weight (Figure 3 and Figure 4). Genotypes that were scattered far away from the origin including G275, G201, and G2, showed prominent G × E interactions; thus, there were less stable. For seed number, higher sensitivity to the environment was shown by genotypes G70 and G267.

4. Discussion

The AMMI analysis of variance showed that the genotype, environment and interaction effects were significant (p < 0.01), indicating differences in the genotype’s behaviour in the environments. This justifies understanding genotype behaviour in order to justify the magnitude and extent of their interactions with the environments [19]. The phenotypic stability in this study was estimated by the significance of the GE interaction [23,24]. Selection for yield stability across environments defined by location year combinations would aid in dealing with genotype–year or genotype–location–year interactions [25]. Many earlier reports of AMMI analysis studies in rice utilized these models to get gain a deeper insight into the environmental factors in conjugation with G × E interactions. They also provided the possibility of predicting the performance of different varieties in environments where they have not been tested, and of improving the precision of the estimation of genotype and environment effects [26,27,28]. Studies in wheat by Nachit et al. [29], also concluded that, multilocation testing results in significant genotype–environment (GE) interactions, lowering true yield estimation accuracy. Thus, AMMI analysis effectively eliminated the random variation and truly measured the genotypic estimates, which were more precise than unadjusted means and crucial for estimating the true genotypic value. Similar results were also reported for evaluating genotypes and analysing G × E for plant yield in wheat by Rad et al. [30].
Similarly, for the identification of micronutrient-enriched and highly stable pearl millet genotypes along with higher yields both AMMI and GGE biplot analyses were used, demonstrating the possibility of improving the micronutrient content without compromising the grain yield [31,32]. In chickpea, also for analyzsing the most stable genotype with wide adaptability across diverse environments, AMMI analysis were used to understand the GE interaction pattern. The biplot of the first principal component and mean grain yields for genotypes and environments revealed that high-yielding genotypes were not cultivars with the sustained yield [33]. For seed yield, it was found to be contributed by higher G × E variations and thus differential genotypic performance is observed over different environments [34]. Different methods have been developed to estimate significant genotypes by environment interaction (GEI) in chickpea [35].
All of these researchers discovered a significant G × E interactions for grain yield and emphasized the value of AMMI analysis in identifying and selecting promising stable genotypes for specific locations or environmental conditions. ANOVA revealed the maximum variation explained by the genotypic effect similar to the studies by Akter et al. [36] in rice and Anuradha et al. [32] in pearl millet. A contradictory observation was reported by Saboghpour et al. [33], Balapure et al. [34] and Kanouni et al. [35] where the largest contribution to the total variation was from environmental effects and the genotype had little effect. The AMMI model is useful because it uses overall fitting, imposes no restrictions on the multiplicative terms, and produces the least-square fit [37]. Gauch and Zobel [38] emphasized the usefulness of AMMI1 with IPCA1 and AM-MI2 with IPCA1 and IPCA2 biplots, as well as the graphical representation of axes, either as IPCA1 or IPCA2 against main effects or IPCA1 against IPCA2. The first two IPCs, IPCA1 and IPCA2 could explain 100% of the interaction effect for the seed weight and seed number per plant leaving no residue. This observation supports Gauch and Zobel’s [38] findings that the most accurate model for AMMI can be predicted using the first two IPCAs. G369 and G57 were identified as the most stable genotypes for the seed weight and seed number per plant, as deduced from their IPC scores in the biplot. A genotype is best suited to a given environment when it presents highly positive interactions with the specific environment making it invariably more suited to exploiting the ecological and management conditions of the environment. The study of G × E interaction discerns the stability of a genotype in different environments and the above study clearly showed the convenience of the AMMI model in deciphering the most stable and most unstable genotypes for different environments. It will further aid in developing environment-wise adaptable genotypes, depending on the extent of the genotypes’ interactions with the environment. Less interactive genotypes for general adaptation and more interacting genotypes for specific environments can be identified from this study.

Supplementary Materials

The following supporting information can be downloaded at: https://www.mdpi.com/article/10.3390/agronomy12123115/s1, Table S1: List of the genotypes used in the association panel (K—kabuli; D—desi).

Author Contributions

P.W.S., B.S.P. and S.P.P.R. conducted the phenotyping and genotyping work; S.M.S., N.K., T.S. and S.K.P. conducted the statistical analysis; C.B., R.K.V. and V.H. devised the work and study plan; M.R. and P.V. conducted the interpretations; P.W.S. and C.B. conducted the manuscript preparation; and all authors contributed to manuscript development and review. All authors have read and agreed to the published version of the manuscript.

Funding

This research was funded by ICAR-IARI and partly by CRP Molecular Breeding (12-143D) and DBT AISRF (24-557).

Data Availability Statement

Not applicable.

Acknowledgments

We duly acknowledge the support of the Division of Genetics, ICAR—Indian Agricultural Research Institute, New Delhi, who provided facilities to carry out phenotyping and data analysis and financial support to the first author for doctoral studies.

Conflicts of Interest

The authors declare no conflict of interest.

References

  1. Haider, M.; Haider, S.Q. Assessment of protein-calorie malnutrition. Clin. Chem. 1984, 30, 1286–1299. [Google Scholar] [CrossRef] [PubMed]
  2. Iqbal, A.; Khalil, I.A.; Ateeq, N.; Sayyar Khan, M. Nutritional quality of important food legumes. Food Chem. 2006, 97, 331–335. [Google Scholar] [CrossRef]
  3. UNICEF Data. From Promise to Impact Ending Malnutrition By 2030. 2016. Available online: https://data.unicef.org/wp-content/uploads/2016/06/130565-1.pdf. (accessed on 24 December 2018).
  4. Maiti, R.K.; Wesche-Ebeling, P. Vegetative and reproductive growth and productivity. In Advances in Chickpea Science; Maiti, R., Wesche-Ebeling, P., Eds.; Science Publishers: Enfield, NH, USA, 2001; Volume 67–104. [Google Scholar]
  5. FAOSTAT. 2020. Available online: http://www.fao.org/faostat/en/#data/QC (accessed on 24 December 2018).
  6. Gil, J.; Nadal, S.; Luna, D.; Moreno, M.T.; Haro, A.D. Variability of some physico-chemical characters in Desi and Kabuli chickpea types. J. Sci. Food Agril. 1996, 71, 179–184. [Google Scholar] [CrossRef]
  7. Ibrikci, H.; Knewtson, S.J.; Grusak, M.A. Chickpea leaves as a vegetable green for humans: Evaluation of mineral composition. J. Sci. Food Agric. 2003, 83, 945–950. [Google Scholar] [CrossRef]
  8. Gauch, H.G., Jr. Model selection and validation for yield trials with interaction. Biometrics 1988, 1, 705–715. [Google Scholar] [CrossRef]
  9. Vaghela, M.D.; Poshiya, V.K.; Savaliya, J.J.; Davada, B.K.; Mungra, K.D. Studies on character association and path analysis for seed yield and its components in chickpea (Cicer arietinum L.). Legume Res. 2009, 32, 245–249. [Google Scholar]
  10. Monpara, B.A.; Gaikwad, S.R. Combining high seed number and weight to improve seed yield potential of chickpea in India. Afr. Crop Sci. J. 2014, 22, 1–8. [Google Scholar]
  11. Tiwari, A.; Babbar, A.; Pal, N. Genetic variability, correlation and path analysis in yield and yield components in chickpea (Cicer arietinum L.) genotypes under late sown condition. Int. J. Agric. Res. 2016, 8, 2884–2886. [Google Scholar]
  12. Dumbre, A.D.; Deshmukh, R.B.; Navale, P.A. Analysis of genetic variability in chickpea. J. Maharashtra Agril. Univ. 1984, 9, 350. [Google Scholar]
  13. Saki, A.; Zaman, M.; Tuhina-Khatun, M.; Kamal, M.; Begum, H. Genetic Variability, Correlation and Path Co-Efficient Analysis for Agronomic Traits in Chickpea (Cicer arietinum L.). Agriculturists 2010, 7, 12–21. [Google Scholar] [CrossRef] [Green Version]
  14. Babbar, A.; Prakash, V.; Tiwari, P.; Iquebal, M.A. Genetic variability for chickpea (Cicer arietinum L.) under late sown season. Legume Res. Int. J. 2012, 35, 1–7. [Google Scholar]
  15. Salgotra, S.K. Association Studies for Seed Yield and Its Attributing Traits in Desi Chickpea (Cicer arietinum L.) Varieties. Legume Genom. Genet. 2016, 7, 1–6. [Google Scholar] [CrossRef] [Green Version]
  16. Kumar, N.; Bharadwaj, C.; Satyavathi, C.T.; Pal, M.; Kumar, T.; Singhal, T.; Sachdeva, S.; Jain, P.K.; Patil, B.S.; Soren, K.R. Morpho Physiological Characterization and Grouping (SAHN) of Chickpea Genotypes for Salinity Tolerance. Vegetos 2017, 30, 3. [Google Scholar] [CrossRef]
  17. Biçer, B.T. The effect of seed size on yield and yield components of chickpea and lentil. Afr. J. Biotechnol. 2009, 8, 1482–1487. [Google Scholar]
  18. Zobel, R.W.; Wright, M.J.; Gauch, H.G., Jr. Statistical Analysis of a Yield Trial. Agron. J. 1988, 80, 388–393. [Google Scholar] [CrossRef]
  19. Gauch, H.G., Jr. AMMI analysis on yield trials. In CIMMYT Wheat Special Report; CIMMYT: Veracruz, México, 1992. [Google Scholar]
  20. Purchase, J.L. Parametric Snalysis to Describe Genotype x Environment Interaction and Yield Stability in Winter Wheat. Ph.D. Thesis, University of the Free State, Bloemfontein, Africa, 1997. [Google Scholar]
  21. Gauch, H.G. A Simple Protocol for AMMI Analysis of Yield Trials. Crop Sci. 2013, 53, 1860–1869. [Google Scholar] [CrossRef]
  22. Thangavel, P.; Anandan, A.; Eswaran, R. AMMI analysis to comprehend genotype-by-environment (G × E) interactions in rainfed grown mungbean (Vigna radiata L.). Aust. J. Crop Sci. 2011, 5, 1767–1775. [Google Scholar]
  23. Farshadfar, E.; Sutka, J. Biplot analysis of genotype-environment interaction in durum wheat using the AMMI model. Acta Agron. Hung. 2006, 54, 459–467. [Google Scholar] [CrossRef]
  24. Osiru, M.O.; Olanya, O.M.; Adipala, E.; Kapinga, R.; Lemaga, B. Yield stability analysis of Ipomoea batatus L. cultivars in diverse environments. Aust. J. Crop Sci. 2009, 3, 213–220. [Google Scholar]
  25. Annicchiarico, P. Additive main effects and multiplicative interaction (AMMI) analysis of genotype-location interaction in variety trials repeated over years. Theor. Appl. Genet. 1997, 94, 1072–1077. [Google Scholar] [CrossRef]
  26. McLaren, C.G.; Chaudhary, R.C. Use of additive main effects and multiplicative Interaction models to analyse multilocation rice varietal trials. Oryza 1998, 34, 306–318. [Google Scholar]
  27. Ise, K.; Youquan, S.; Jishin, L.; Kudo, S.; Tano, H.; Sunohora, Y. Genotype by environment interaction analysis for rice yield in Yunan, China. Jpn. J. Trop. Agric. 2001, 45, 22–32. [Google Scholar]
  28. Das, S.; Misra, R.C.; Patnaik, M.C. G x E interaction of mid-late rice genotypes in LR and AMMI model and evaluation of adaptability and yield stability. Env. Ecol. 2009, 27, 529–535. [Google Scholar]
  29. Nachit, M.M.; Nachit, G.; Ketata, H.; Gauch, H.G.; Zobel, R.W. Use of AMMI and linear regression models to analyze genotype-environment interaction in durum wheat. Theor. Appl. Genet. 1992, 83, 597–601. [Google Scholar] [CrossRef] [PubMed]
  30. Rad, M.N.; Kadir, M.A.; Rafii, M.Y.; Jaafar, H.Z.; Naghavi, M.R.; Ahmadi, F. Genotype environment interaction by AMMI and GGE biplot analysis in three consecutive generations of wheat (Triticum aestivum) under normal and drought stress conditions. Aust. J. Crop Sci. 2013, 7, 956–961. [Google Scholar]
  31. Pawar, V.Y.; Patil, H.T.; Patil, H.S. AMMI analysis for grain yield stability of pearl millet (Penniseum glaucum L.) genotypes. Indian J. Genet. 2012, 72, 79–82. [Google Scholar]
  32. Anuradha, N.; Satyavathi, C.T.; Meena, M.C.; Sankar, S.M.; Bharadwaj, C.; Bhat, J.; Singh, O.; Singh, S.P. Evaluation of pearl millet [Pennisetum glaucum (L.) R. Br.] for grain iron and zinc content in different agro climatic zones of India. Indian J. Genet. Plant Breed. 2017, 77, 65–73. [Google Scholar] [CrossRef] [Green Version]
  33. Sabaghpour, S.H.; Razavi, F.; Danyali, S.F.; Tobe, D.; Ebadi, A. Additive Main Effect and Multiplicative Interaction Analysis for Grain Yield of Chickpea (Cicer arietinum L.) in Iran. Int. Sch. Res. Not. 2012, 2012, 1–6. [Google Scholar] [CrossRef] [Green Version]
  34. Balapure, M.M.; Mhase, L.B.; Kute, N.S.; Pawar, V.Y. AMMI analysis for stability of chickpea. Legum. Res. -Int. J. 2016, 39, 301–304. [Google Scholar] [CrossRef]
  35. Kanouni, H.; Farayedi, Y.; Saeid, A.; Sabaghpour, S.H. Stability Analyses for Seed Yield of Chickpea (Cicer arietinum L.) Genotypes in the Western Cold Zone of Iran. J. Agric. Sci. 2015, 7, 219. [Google Scholar] [CrossRef] [Green Version]
  36. Akter, A.; Jamil, H.M.; Umma, K.M.; Islam, M.R.; Hossain, K.; Mamunur, R.M. AMMI Biplot Analysis for Stability of Grain Yield in Hybrid Rice (Oryza sativa L.). J. Rice Res. 2014, 2, 126. [Google Scholar] [CrossRef]
  37. Freeman, G.H. Modern statistical methods for analyzing genotype-environment interactions. In Genotype × Environment Interaction and Plant Breeding; Kang, M.S., Ed.; Louisiana State University Agricultural Center: Baton Rouge, LA, USA, 1990; pp. 118–125. [Google Scholar]
  38. Gauch, H.G.; Zobel, R.W. AMMI analysis of yield trials. In Genotype by Environment Interaction; Kang, M.S., Gauch, H.G., Jr, Eds.; CRC Press: Boca Raton, FL, USA, 1996; pp. 85–122. [Google Scholar]
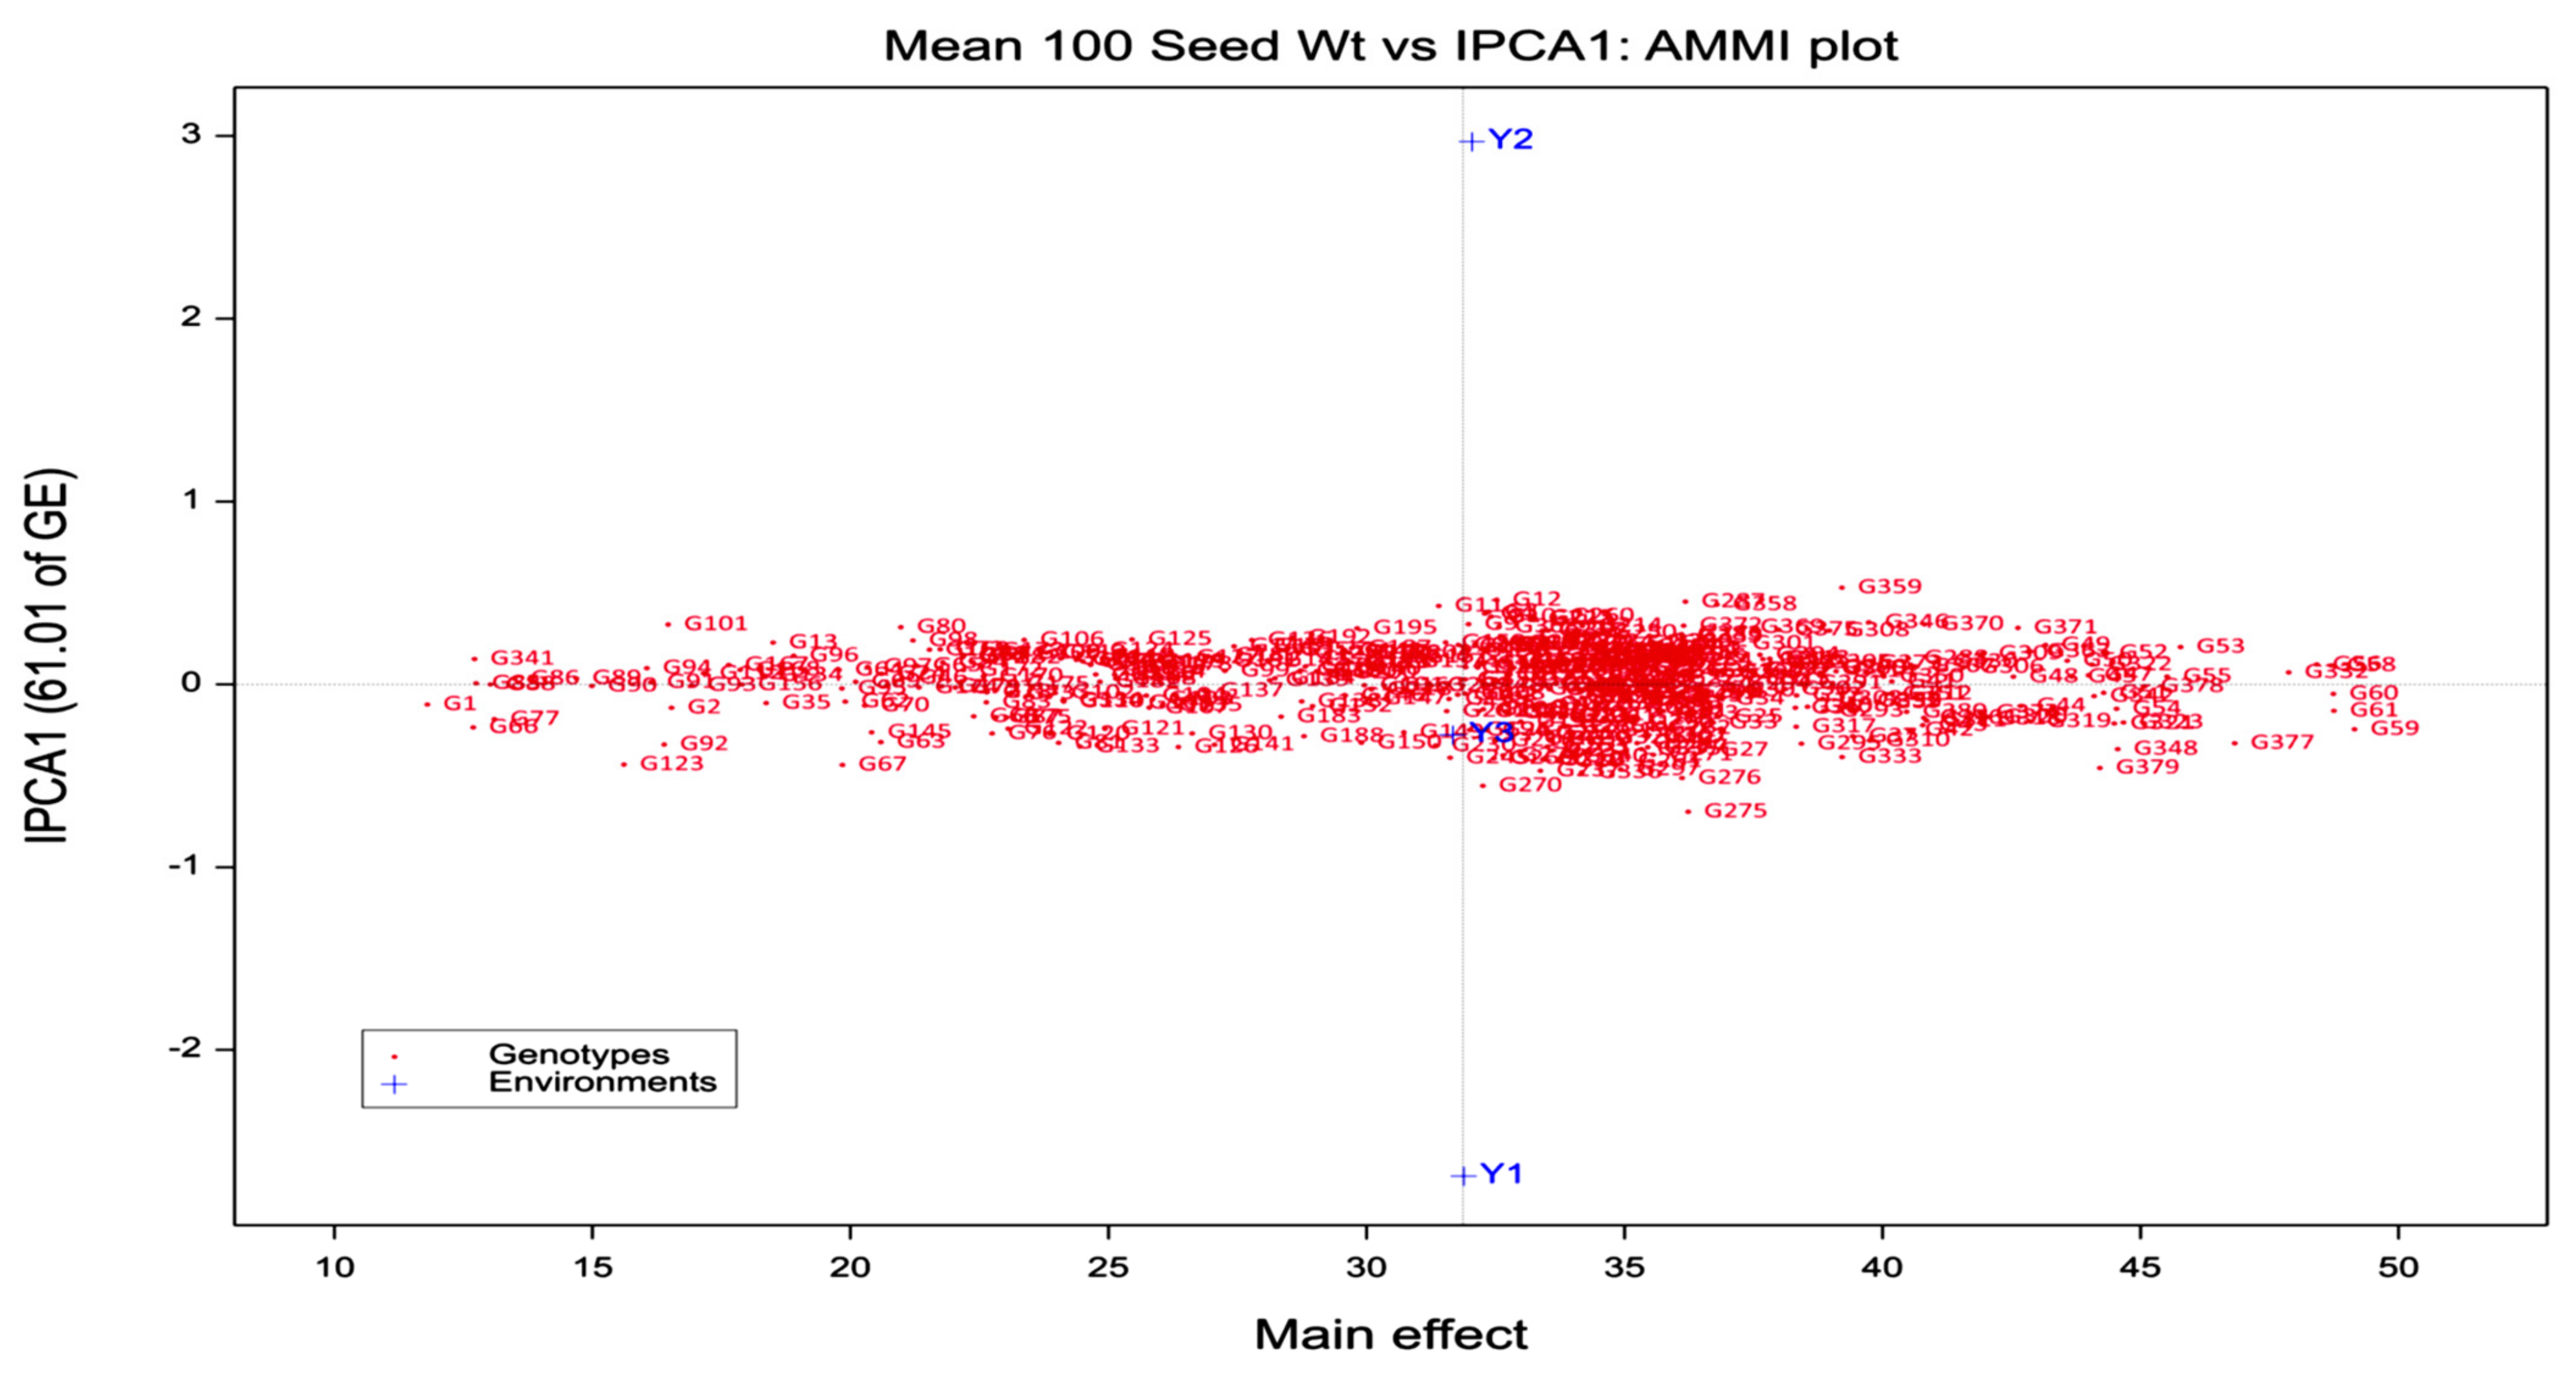
Figure 1. AMMI1 biplot for seed weight.
Agronomy 12 03115 g001
Figure 2. AMMI1 biplot for seed number. G59 had the highest mean seed weight (49.1 g) with good stability (IPC1 score of −0.28). G60 and G61 had high mean seed weights (48.7 and 48.7, respectively) and IPC1 scores nearing zero (−0.09 and −0.25, respectively). The most unstable genotype identified was G182 (IPC1 score of −0.78), with a mean seed weight of 24.8 g.
Agronomy 12 03115 g002
Figure 3. Seed weight—AMMI2 biplot of IPCA1 vs. IPCA2.
Agronomy 12 03115 g003
Figure 4. Seed number—AMMI2 biplot of IPCA1 vs. IPCA2.
Agronomy 12 03115 g004
Table 1. Rainfall and temperature data for the chickpea growing seasons for three years.
Cropping Season (October–April)Rainfall (mm)Temperature (°C)
MinimumMaximum
2014–15315.86.634.8
2015–1622.06.138.7
2016–17127.75.338.0
Table 2. Pooled ANOVA for seed weight and seed number across the years.
Sourced.f.Seed WeightSeed Number
MSSVariance (%)MSSVariance (%)
Genotypes 379606.3 **93.08606.3 **93.08
Environments 2457.4 **0.37457.4 **0.37
Rep within Env631.7 ** 31.7 **
G × E75813.4 **4.113.4 **4.1
Error22742.6 2.6
Total341972.2 72.2
** Highly significant at p < 0.01.
Table 3. ANOVA for AMMI2 model for seed weight and seed number.
Sourced.f.Seed WeightSeed Number
MSS% GE Explained% CumulativeMSS% GE explained% Cumulative
Treatments 1139211.5 ** 211.5 **
Genotypes 379606.3 ** 606.3 **
Environments 2457.4 ** 457.4 **
G X E75813.4 ** 13.4 **
IPCA138024.4 **61.0161.0124.4 **78.0278.02
IPCA23782.3 **38.991002.3 **21.98100
Residual00 0
Error22742.6 2.6
Total341972.2 72.2
** Highly significant at p < 0.01.
Publisher’s Note: MDPI stays neutral with regard to jurisdictional claims in published maps and institutional affiliations.