
Energy Assessment of Second-Generation (2G) Bioethanol Production from Sweet Sorghum (Sorghum bicolor (L.) Moench) Bagasse

 ,
, 

Abstract
:1. Introduction
2. Materials and Methods
2.1. Raw Material
2.2. Hydrothermal Pretreatment of Biomass (Autohydrolysis)
2.2.1. Experiment Design
2.2.2. Energy Efficiency of Hydrothermal Pretreatment
2.3. Enzymatic Hydrolysis (Saccharification)
Enzymes
2.4. Pre-Saccharification Simultaneous and Fermentation (PSSF)
2.4.1. Inoculum Preparation
2.4.2. Saccharification and Fermentation
2.5. Analytical Procedures
2.6. Energy Balance
2.6.1. Energy Input
2.6.2. Energy Output
3. Results and Discussion
3.1. Raw Material Composition
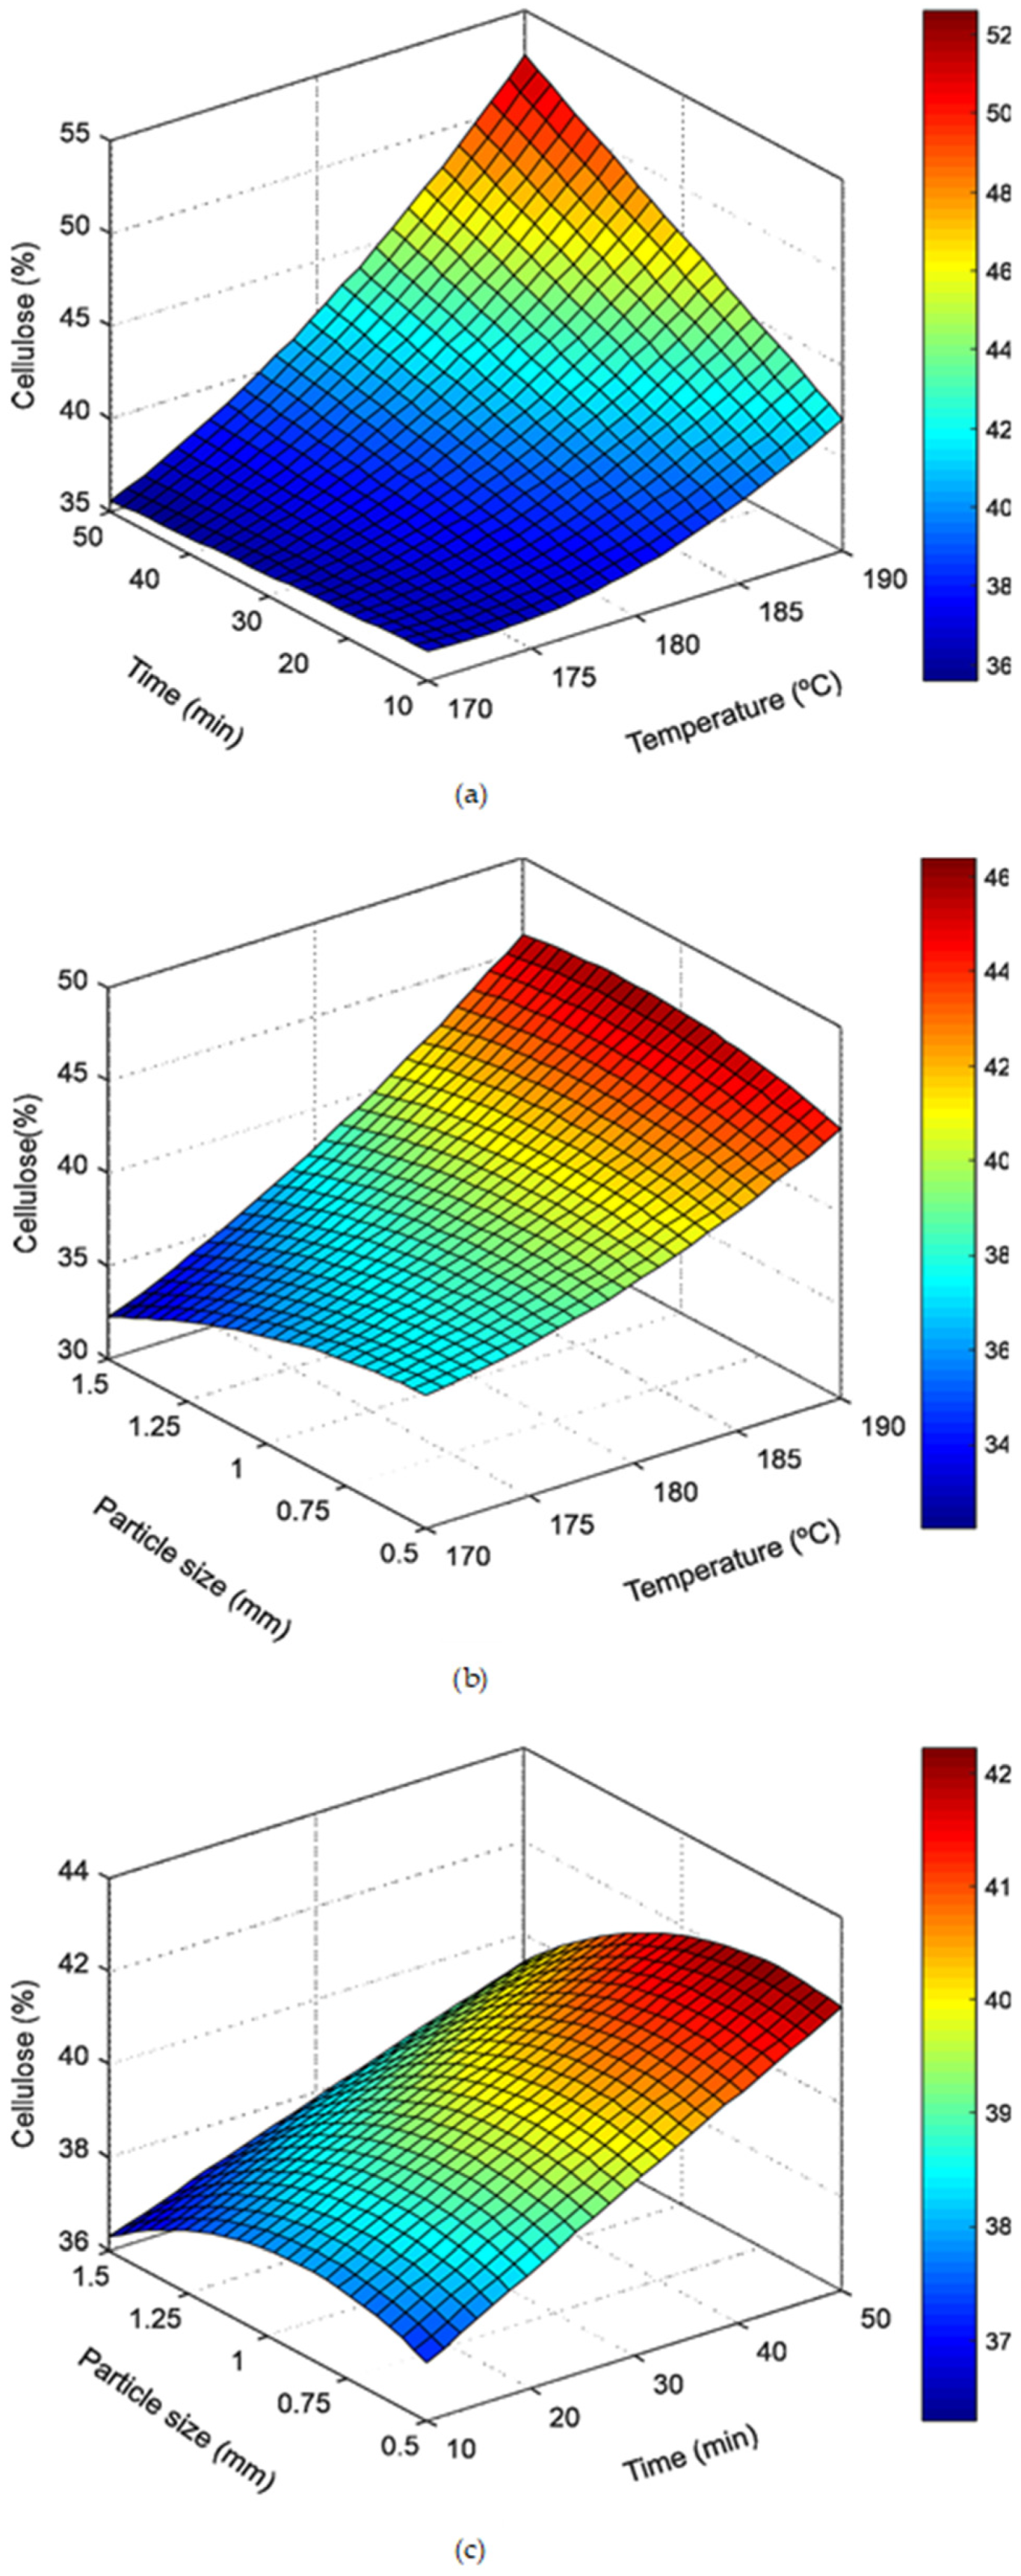
3.2. Effect of Hydrothermal Pretreatment (Autohydrolysis) on Raw Material Composition
3.2.1. Hydrothermal Pretreatment Influence on the Solid Phase
3.2.2. Hydrothermal Pretreatment Influence on the Liquid Phase
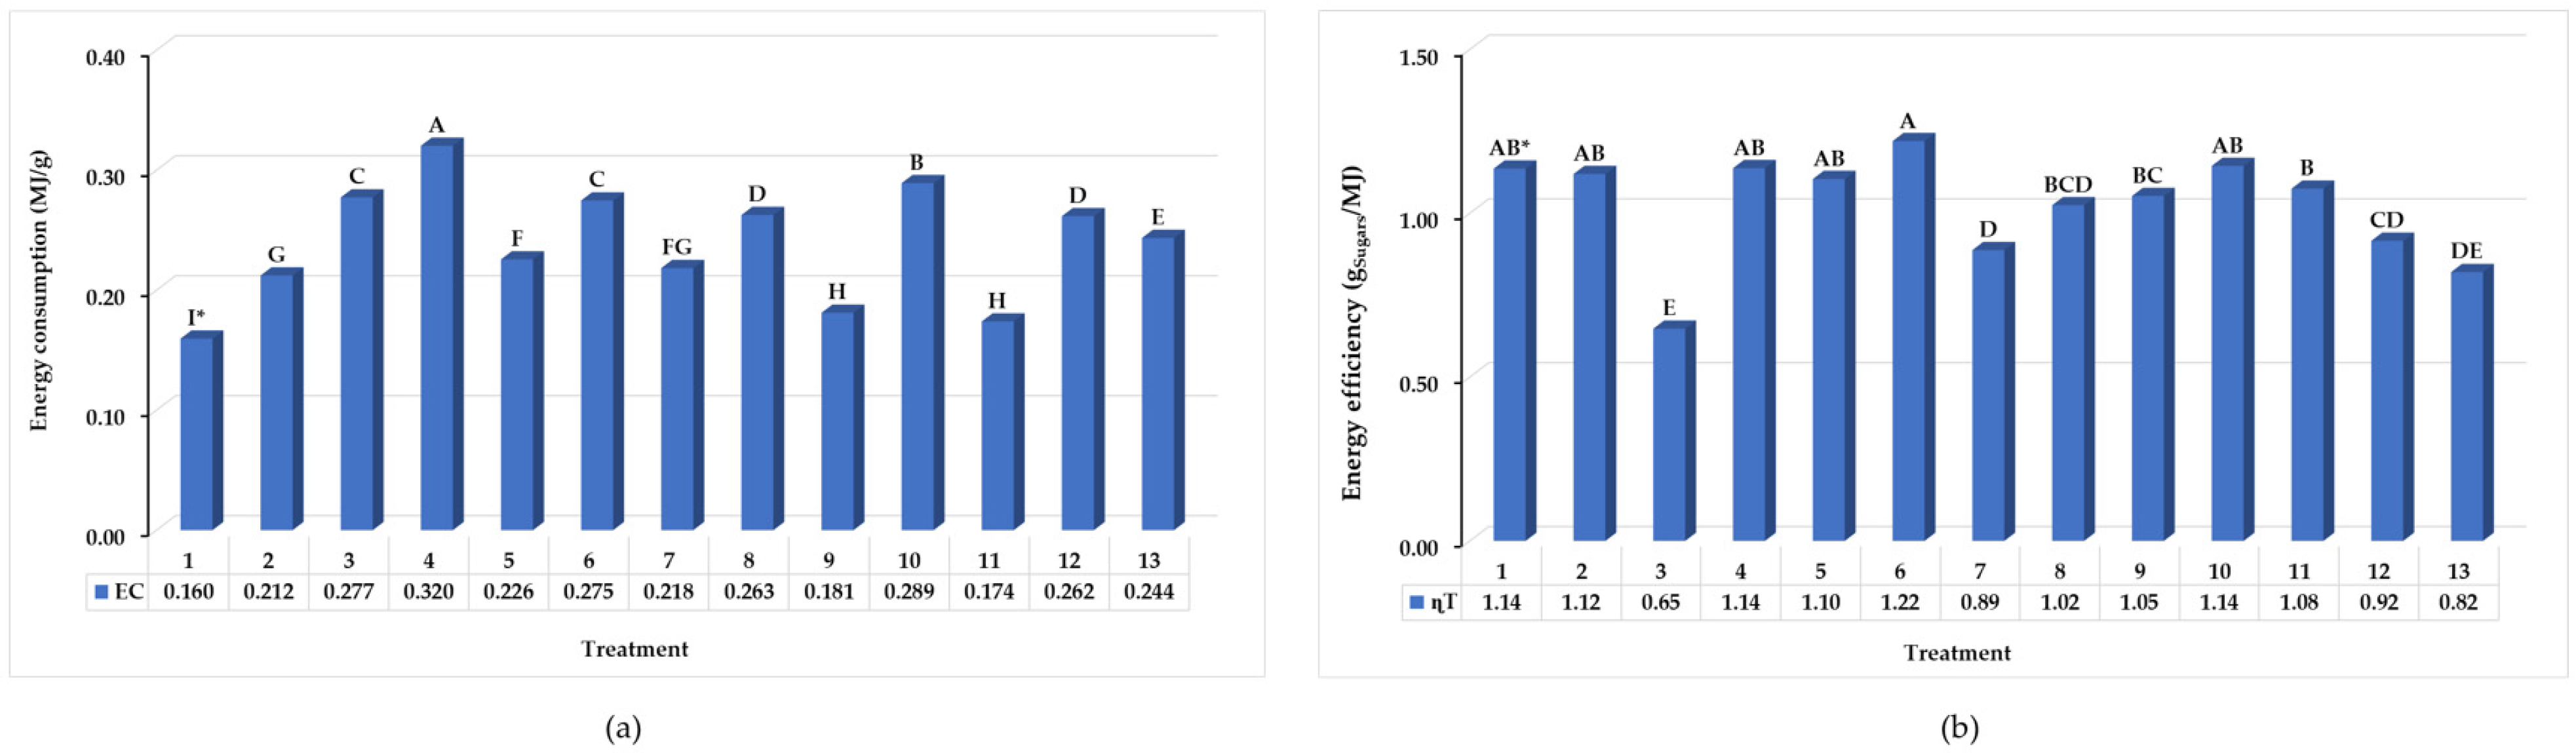
3.2.3. Energy Efficiency of Hydrothermal Pretreatment
3.3. Enzymatic Hydrolysis
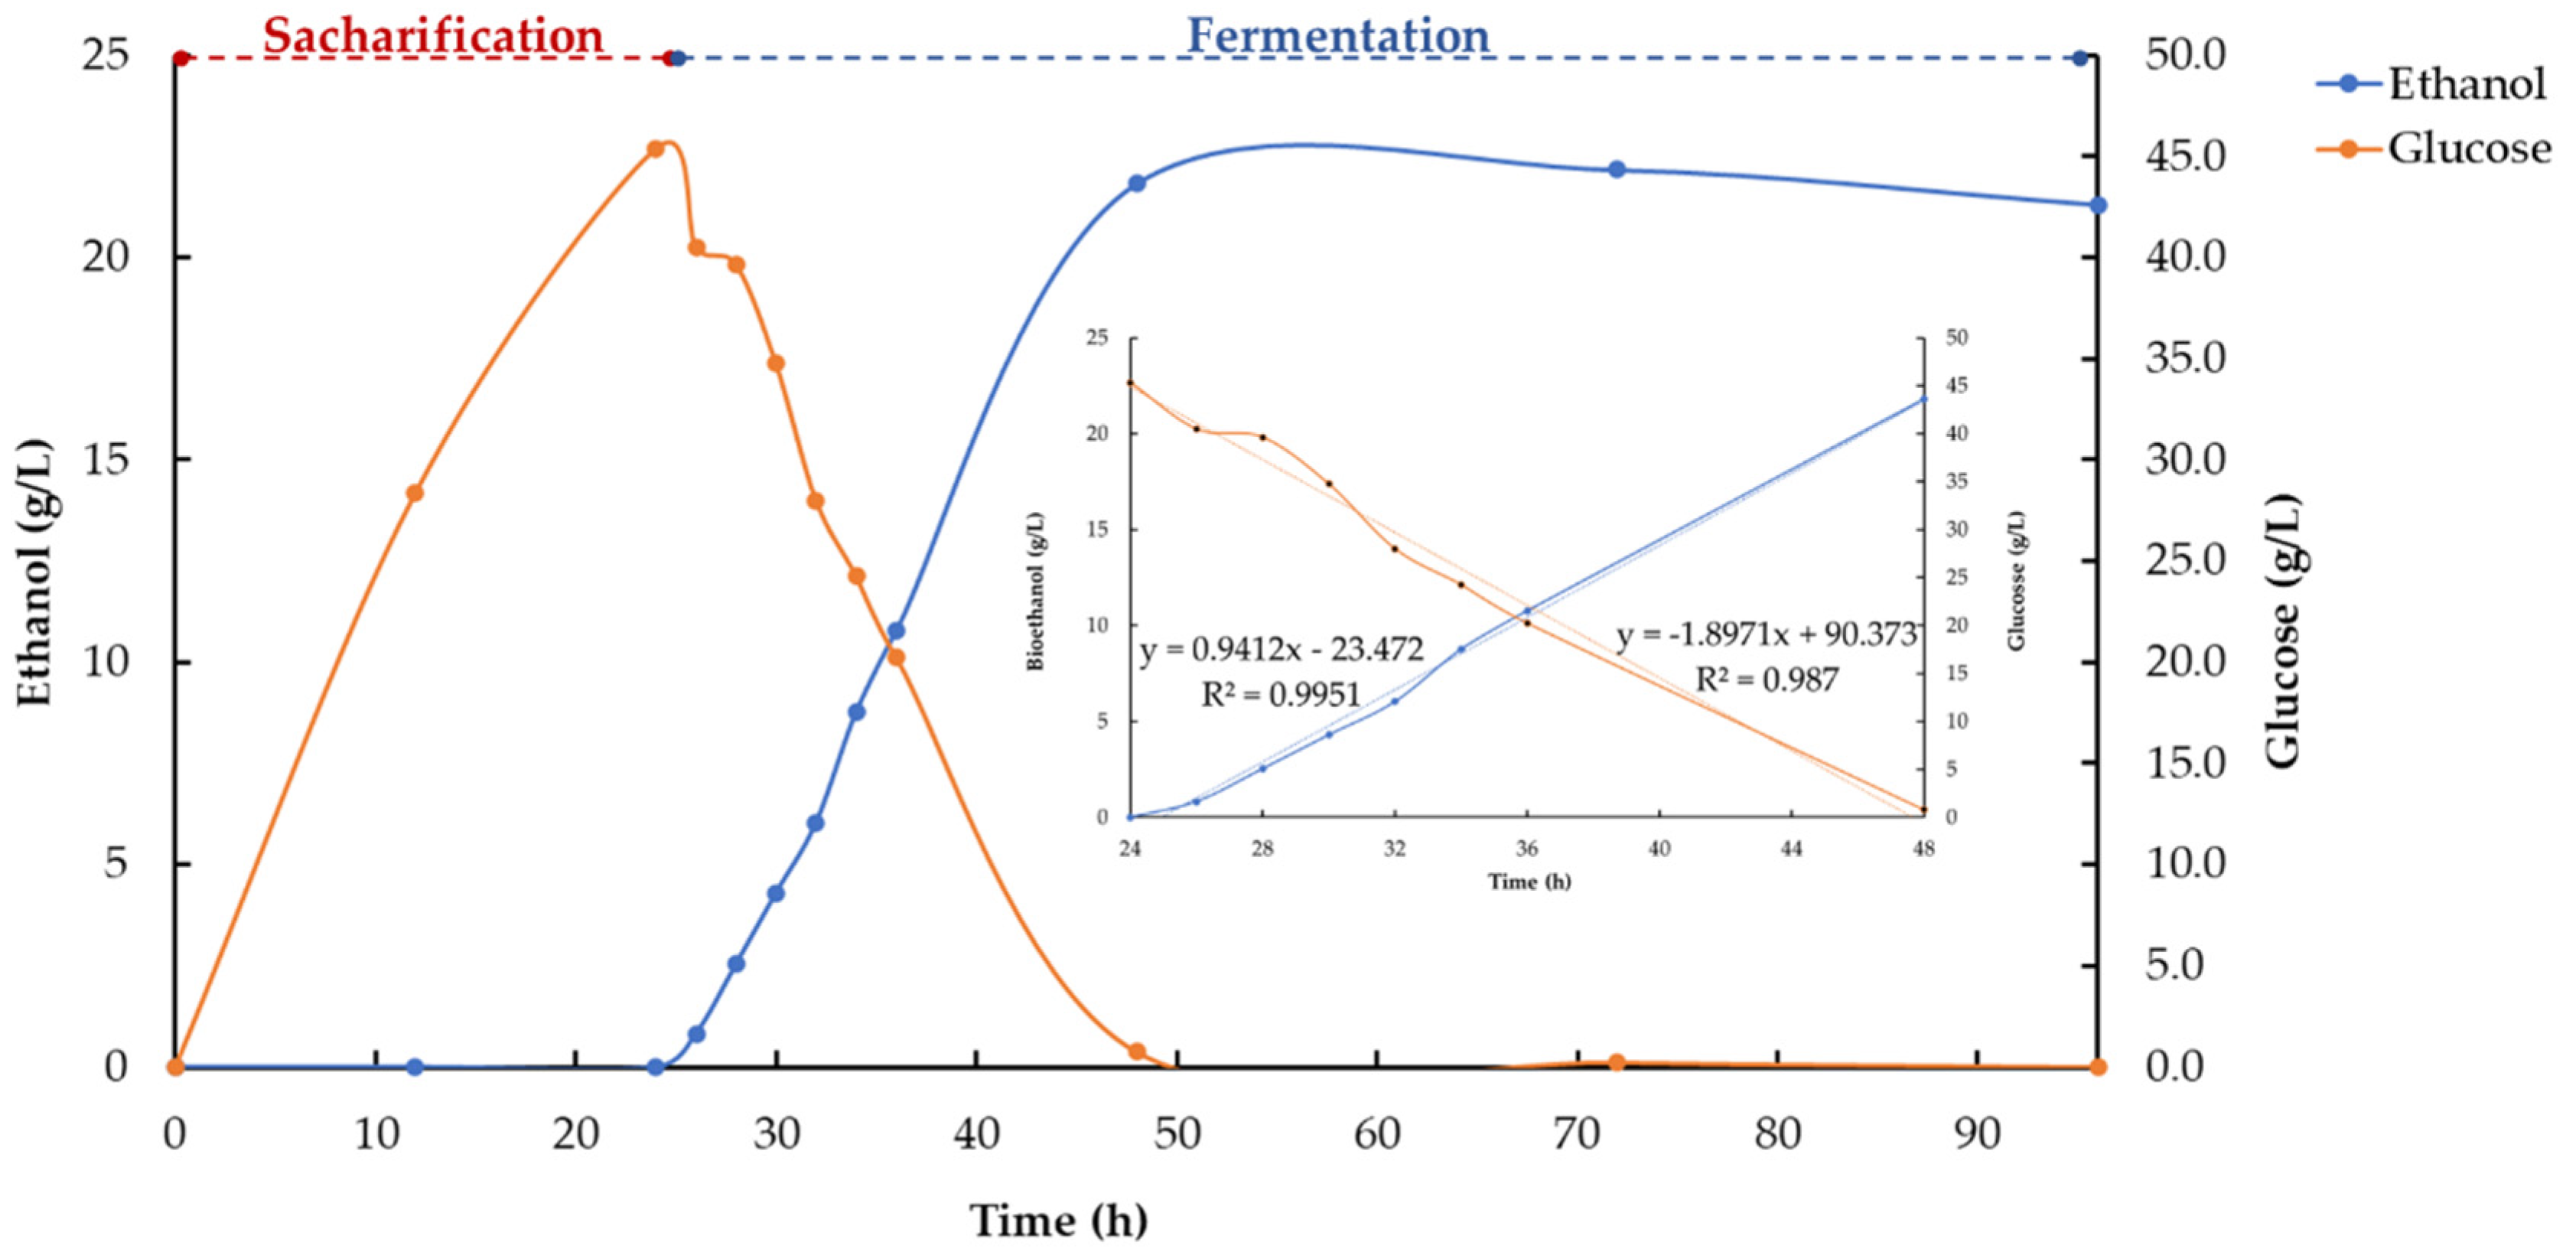
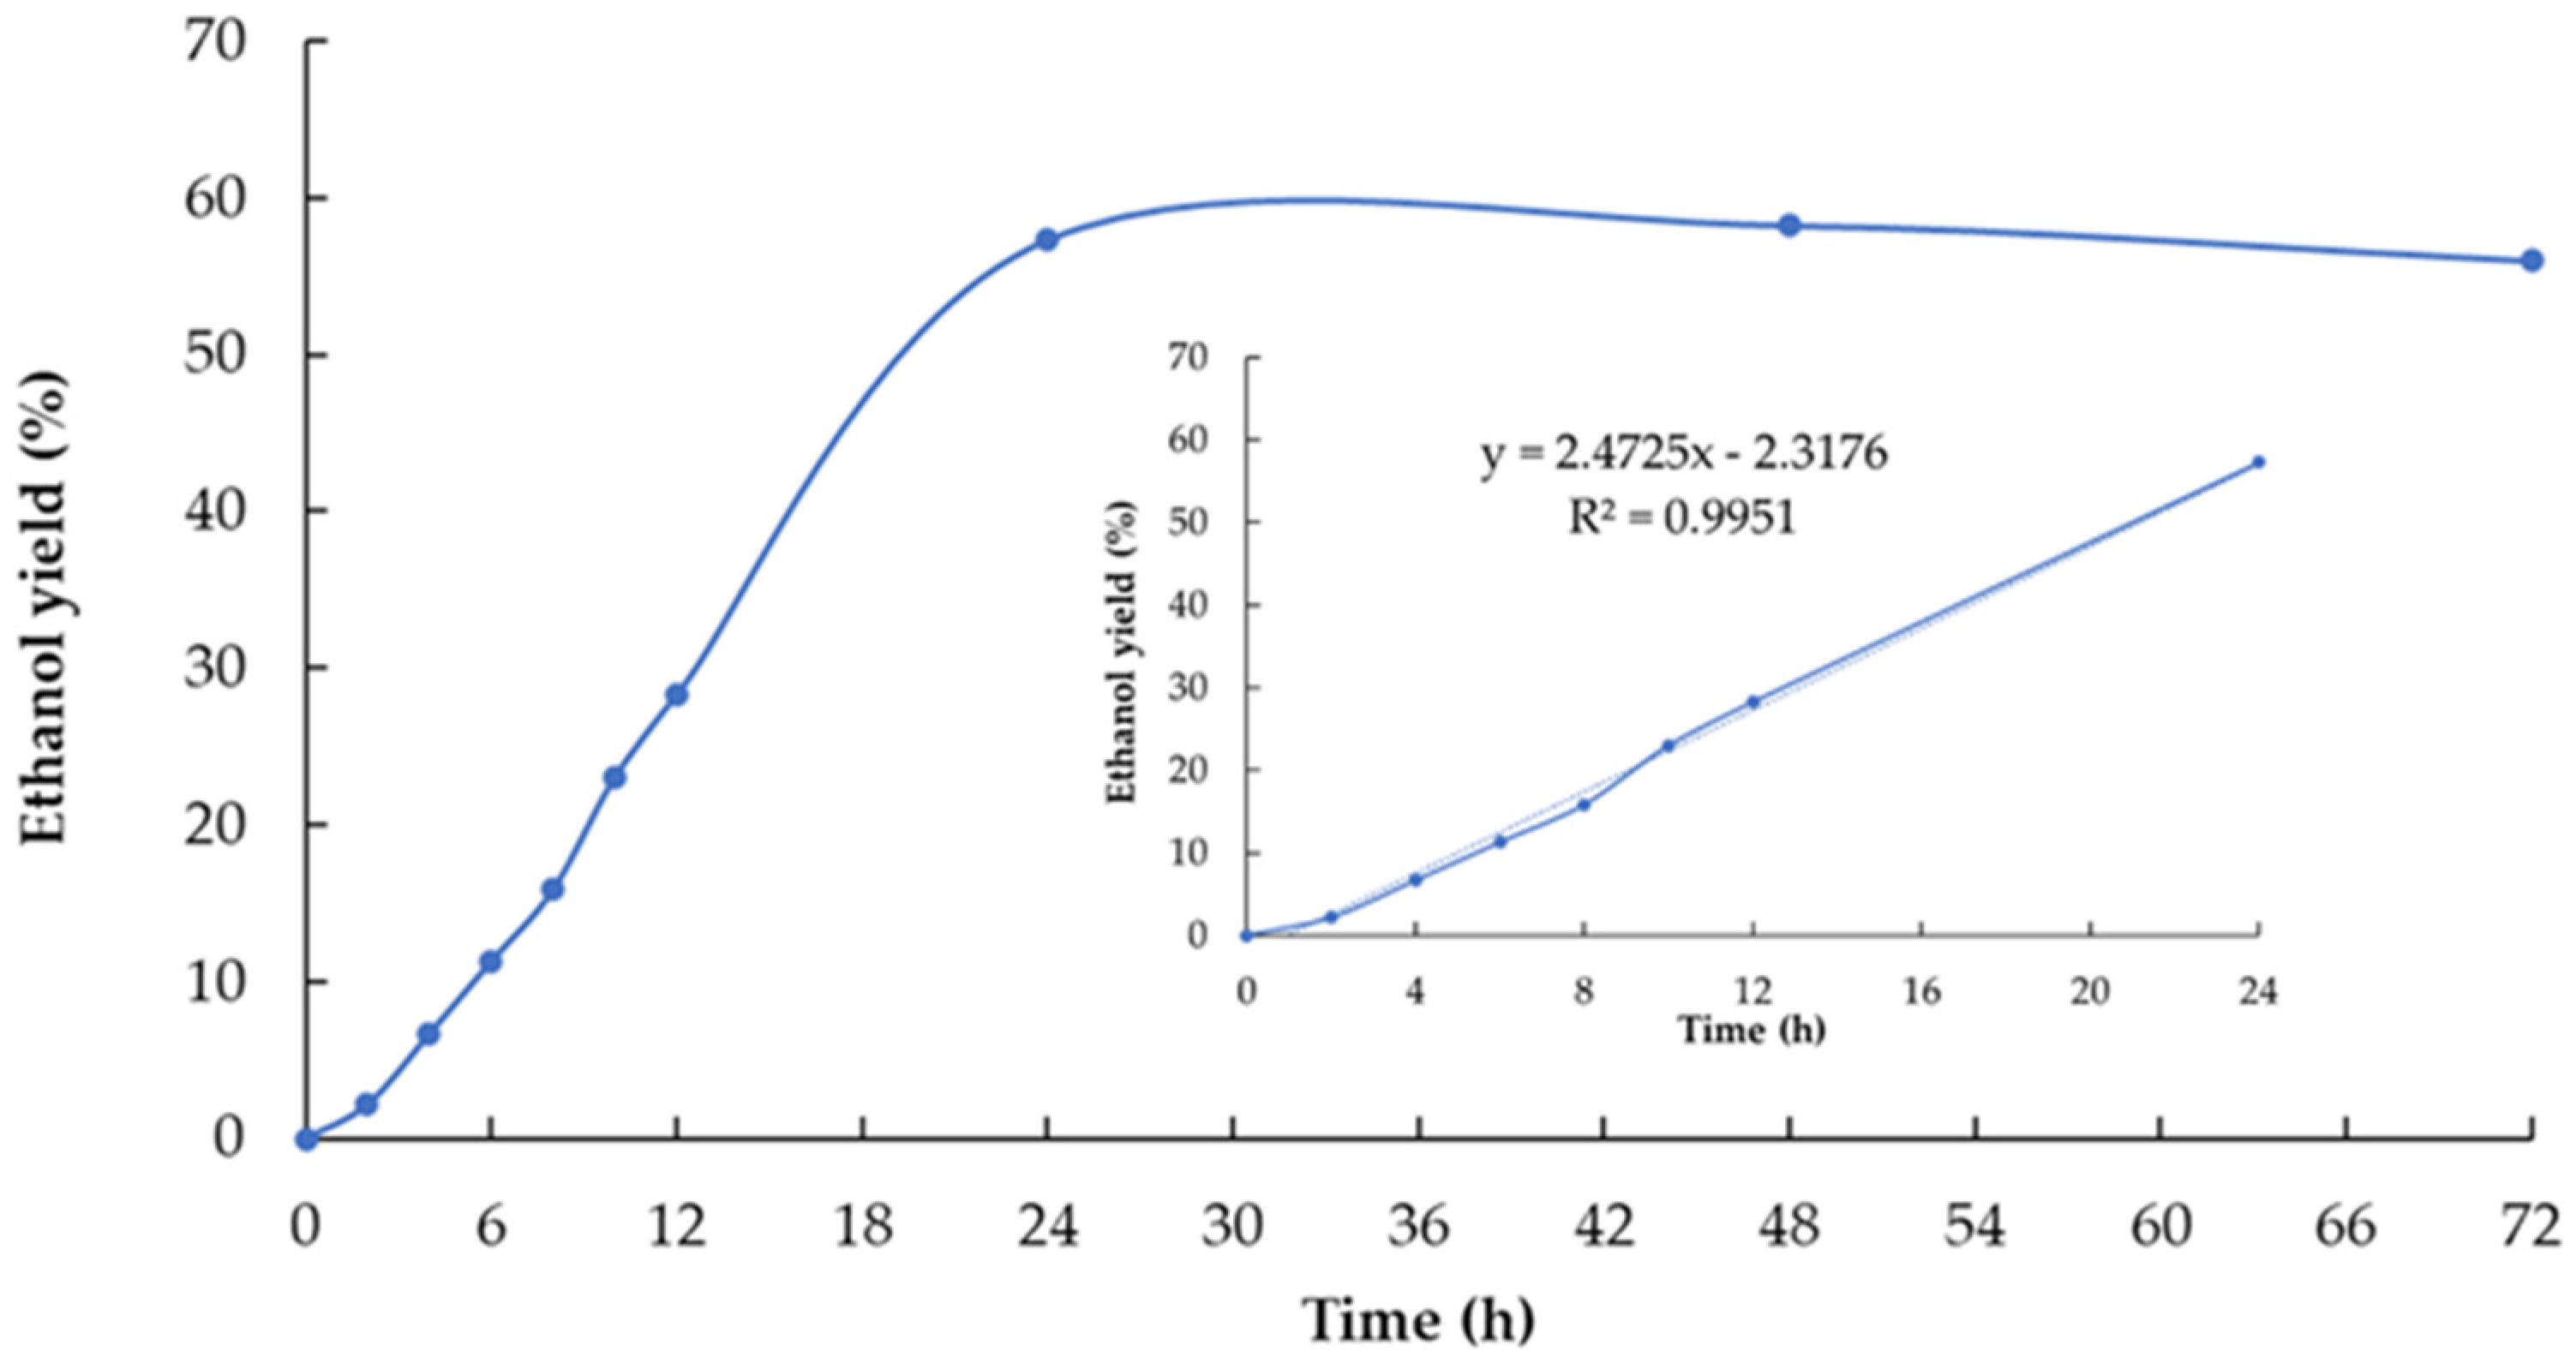
3.4. Pre-Simultaneous Saccharification and Fermentation (PSSF)
3.5. Energy Balance in the Bioethanol Production Process
4. Conclusions
Supplementary Materials
Author Contributions
Funding
Institutional Review Board Statement
Informed Consent Statement
Data Availability Statement
Conflicts of Interest
References
- López-Sandin, I.; Gutiérrez-Soto, G.; Gutiérrez-Díez, A.; Medina-Herrera, N.; Gutiérrez-Castorena, E.; Zavala-García, F. Evaluation of the use of energy in the production of sweet sorghum (Sorghum bicolor (L.) Moench) under different production systems. Energies 2019, 12, 1713. [Google Scholar] [CrossRef] [Green Version]
- Ruiz, H.A.; Thomsen, M.H.; Trajano, H.L. Hydothermal Processing in Biorefineries, 1st ed.; Springer: Cham, Switzerland, 2017; pp. v–viii. [Google Scholar] [CrossRef]
- Kumar, M.N.; Ravikumar, R.; Thenmozhi, S.; Kumar, M.R.; Shankar, M.K. Choice of pretreatment technology for sustainable production of bioethanol from lignocellulosic biomass: Bottle necks and recommendations. Waste Biomass Valoris. 2019, 10, 1693–1709. [Google Scholar] [CrossRef]
- Ruiz, H.A.; Rodriguez, R.M.; Fernandes, B.D.; Vicente, A.; Teixeira, A. Hydrothermal processing, as an alternative for upgrading agriculture residues and marine biomass according to the biorefinery concept: A review. Renew. Sustain. Energy Rev. 2013, 21, 35–51. [Google Scholar] [CrossRef] [Green Version]
- Rosero-Chasoy, G.; Rodríguez-Jasso, R.M.; Aguilar, C.N.; Buitrón, G.; Chairez, I.; Ruiz, H.A. Hydrothermal kinetic modeling for microalgae biomass under subcritical condition cultivated in a close bubble tubular photobioreactor. Fuel 2023, 334, 126585. [Google Scholar] [CrossRef]
- Demichelis, F.; Laghezza, M.; Chiappero, M.; Fiore, S. Technical, economic and environmental assessement of bioethanol biorefinery from waste biomass. J. Clean. Prod. 2020, 277, 124111. [Google Scholar] [CrossRef]
- Morales-Contreras, B.E.; Flórez-Fernández, N.; Torres, M.D.; Domínguez, H.; Rodríguez-Jasso, R.M.; Ruiz, H.A. Hydrothermal systems to obtain high value-added compounds from macroalgae for bioeconomy and biorefineries. Bioresour. Technol. 2022, 343, 126017. [Google Scholar] [CrossRef] [PubMed]
- Reshmy, R.; Paulose, T.A.P.; Philip, E.; Thomas, D.; Madhavan, A.; Sirohi, R.; Binod, P.; Awasthi, M.K.; Pandey, A.; Sindhu, R. Updates on high value products from cellulosic biorefinery. Fuel 2022, 308, 122056. [Google Scholar] [CrossRef]
- Srivastava, N.; Rawat, R.; Singh Oberoi, H.; Ramteke, P.W. A review on fuel ethanol production from lignocellulosic biomass. Int. J. Green Energy 2015, 12, 949–960. [Google Scholar] [CrossRef]
- Partida-Sedas, G.; Montes-García, N.; Carvajal-Zarrabal, O.; López-Zamora, L.; Gómez-Rodríguez, J.; Aguilar-Uscanga, M.G. Optimization of hydrolysis process to obtain fermentable sugars from sweet sorghum bagasse using a Box–Behnken design. Sugar Tech. 2017, 19, 317–325. [Google Scholar] [CrossRef]
- Velmurugan, B.; Narra, M.; Rudakiya, D.M.; Madamwar, D. Sweet sorghum: A potential resource for bioenergy production. In Refining Biomass Residues for Sustainable Energy and Bioproducts: Technology, Advances, Life Cycle Assessment and Economics, 1st ed.; Kumar, R.P., Edgard Gnansounou, E., Raman, J.K., Baskar, G., Eds.; Academic Press: Cambridge, MA, USA, 2020; Volume 1, pp. 215–242. [Google Scholar] [CrossRef]
- Nazli, R.I. Evaluation of different sweet sorghum cultivars for bioethanol yield potential and bagasse combustion characteristics in a semiarid Mediterranean environment. Biomass Bioenergy 2020, 139, 105624. [Google Scholar] [CrossRef]
- Xiao, M.Z.; Sun, Q.; Hong, S.; Chen, W.J.; Pang, B.; Du, Z.Y.; Wen-Bin, Y.; Zhuohua, S.; Yuan, T.Q. Sweet sorghum for phytoremediation and bioethanol production. J. Leather Sci. Eng. 2021, 3, 1–23. [Google Scholar] [CrossRef]
- Ximenes, E.; Farinas, C.S.; Kim, Y.; Ladisch, M.R. Hydrothermal pretreatment of lignocellulosic biomass for bioethanol production. In Hydrothermal Processing in Biorefineries, 1st ed.; Ruiz, A.H., Mette, M.H., Trajano, H.L., Eds.; Springer Nature: Cham, Switzerland, 2017; Volume 1, pp. 181–205. [Google Scholar] [CrossRef]
- Ruiz, H.A.; Galbe, M.; Garrote, G.; Ramirez-Gutierrez, D.M.; Ximenes, E.; Sun, S.N.; Lachos-Perez, D.; Rodríguez-Jasso, R.M.; Run-Cang, S.; Yang, B.; et al. Severity factor kinetic model as a strategic parameter of hydrothermal processing (steam explosion and liquid hot water) for biomass fractionation under biorefinery concept. Bioresour. Technol. 2021, 342, 125961. [Google Scholar] [CrossRef]
- Cybulska, I.; Thomsen, M.H. Bioethanol production from pretreated solids using hydrothermal processing. In Hydrothermal Processing in Biorefineries; Springer: Cham, Switzerland, 2017; pp. 237–252. [Google Scholar] [CrossRef]
- Huang, C.; Jiang, X.; Shen, X.; Hu, J.; Tang, W.; Wu, X.; Ragauskas, A.; Jameel, H.; Meng, X.; Yong, Q. Lignin-enzyme interaction: A roadblock for efficient enzymatic hydrolysis of lignocellulosics. Renew. Sustain. Energy Rev. 2022, 154, 111822. [Google Scholar] [CrossRef]
- Rezania, S.; Oryani, B.; Cho, J.; Talaiekhozani, A.; Sabbagh, F.; Hashemi, B.; Rupani, P.F.; Mohammadi, A.A. Different pretreatment technologies of lignocellulosic biomass for bioethanol production: An overview. Energy 2020, 199, 117457. [Google Scholar] [CrossRef]
- Ruiz, H.A.; Conrad, M.; Sun, S.N.; Sanchez, A.; Rocha, G.J.; Romaní, A.; Castro, E.; Torres, A.; Rodríguez-Jasso, R.M.; Andrade, L.P.; et al. Engineering aspects of hydrothermal pretreatment: From batch to continuous operation, scale-up and pilot reactor under biorefinery concept. Bioresour. Technol. 2020, 299, 122685. [Google Scholar] [CrossRef] [Green Version]
- Aristizábal-Marulanda, V.; Solarte-Toro, J.C.; Alzate, C.A.C. Study of biorefineries based on experimental data: Production of bioethanol, biogas, syngas, and electricity using coffee-cut stems as raw material. Environ. Sci. Pollut. Res. 2021, 28, 24590–24604. [Google Scholar] [CrossRef]
- Elyasi, S.N.; Rafiee, S.; Mohtasebi, S.S.; Tsapekos, P.; Angelidaki, I.; Liu, H.; Khoshnevisan, B. An integer superstructure model to find a sustainable biorefinery platform for valorizing household waste to bioenergy, microbial protein, and biochemicals. J. Clean. Prod. 2021, 278, 123986. [Google Scholar] [CrossRef]
- Islam, M.K.; Thaemngoen, A.; Lau, C.Y.; Guan, J.; Yeung, C.S.; Chaiprapat, S.; Leu, S.Y. Staged organosolv pretreatment to increase net energy and reactive lignin yield in whole oil palm tree biorefinery. Bioresour. Technol. 2021, 326, 124766. [Google Scholar] [CrossRef]
- Nitsos, C.K.; Matis, K.A.; Triantafyllidis, K.S. Optimization of hydrothermal pretreatment of lignocellulosic biomass in the bioethanol production process. ChemSusChem 2012, 6, 110–122. [Google Scholar] [CrossRef]
- Sluiter, A.; Hames, B.; Ruiz, R.; Scarlata, C.; Sluiter, J.; Templeton, D.; Crocker, D.L.A.P. Determination of Ash in Biomass. Lab. Anal. Proced. (LAP) 2005, NREL/TP-510-42622, 1–8. [Google Scholar]
- Sluiter, A.; Hames, B.; Ruiz, R.; Scarlata, C.; Sluiter, J.; Templeton, D.; Crocker, D.L.A.P. Determination of structural carbohydrates and lignin in biomass. Lab. Anal. Proced. (LAP) 2005, NREL/TP-510-42618, 1–17. [Google Scholar]
- Zhu, J.Y.; Pan, X.; Zalesny, R.S. Pretreatment of woody biomass for biofuel production: Energy efficiency, technologies, and recalcitrance. Appl. Microbiol. Biotechnol 2010, 87, 847–857. [Google Scholar] [CrossRef] [PubMed]
- Shiva; Rodríguez-Jasso, R.M.; Rosero-Chasoy, G.; López-Sandin, I.; Morais, A.R.C.; Ruiz, H.A. Enzymatic hydrolysis, kinetic modeling of hemicellulose fraction, and energy efficiency of autohydrolysis pretreatment using agave bagasse. BioEnergy Res. 2022, 1–13. [Google Scholar] [CrossRef]
- Adney, B.; Nrel, J.B. Measurement of Cellulase Activities. Meas. Cell. Act. Lab. Anal. Proced. LAP 1996, NREL/TP-510-42628, 1–11. [Google Scholar]
- Aparicio, E.; Rodríguez-Jasso, R.M.; Pinales-Márquez, C.D.; Loredo-Treviño, A.; Robledo-Olivo, A.; Aguilar, C.N.; Kostas, E.T.; Ruiz, H.A. High-pressure technology for Sargassum spp. biomass pretreatment and fractionation in the third generation of bioethanol production. Bioresour. Technol. 2021, 329, 124935. [Google Scholar] [CrossRef]
- Qing, Q. The Effects of Surfactant Pretreatment and Xylooligomers on Enzymatic Hydrolysis of Cellulose and Pretreated Biomass. Ph.D. Dissertation, University of California Riverside, Riverside, CA, USA, August 2010. Available online: https://escholarship.org/uc/item/5hc293kb (accessed on 20 April 2022).
- Dowe, N.; McMillan, J. SSF Experimental Protocols: Lignocellulosic Biomass Hydrolysis and Fermentation. Natl. Renew. Energy Lab. NREL Anal. Proced. 2001, NREL/TP-510-42630, 1–19. Available online: https://www.nrel.gov/docs/gen/fy08/42630.pdf (accessed on 10 March 2022).
- Mayer, F.D.; Brondani, M.; Carrillo, M.C.V.; Hoffmann, R.; Lora, E.E.S. Revisiting energy efficiency, renewability, and sustainability indicators in biofuels life cycle: Analysis and standardization proposal. J. Clean. Prod. 2020, 252, 119850. [Google Scholar] [CrossRef]
- Saga, K.; Imou, K.; Yokoyama, S.; Minowa, T. Net energy analysis of bioethanol production system from high-yield rice plant in Japan. Appl. Energy 2010, 87, 2164–2168. [Google Scholar] [CrossRef]
- Bernesson, S. Life Cycle Assessment of Rapeseed Oil, Rape Methyl Ester and Ethanol as Fuels—A Comparison between Large-and Small Scale Production. U.S. Department of Energy Office of Scientific and Technical Information, Studsvik Library, SE-611 82 Nykoeping, Sweden. 2004; p. 267. Available online: https://www.osti.gov/etdeweb/servlets/purl/20567425 (accessed on 20 April 2022).
- Bentsen, N.S.; Felby, C.; Ipsen, K.H. Energy Balance of 2nd Generation Bioethanol Production in Denmark. DONG Energy 2006, 43. Available online: https://www.researchgate.net/profile/Niclas-Bentsen/publication/237534730_ENERGY_BALANCE_OF_2nd_GENERATION_BIOETHANOL_PRODUCTION_IN_DENMARK/links/00b495320d4dba1cf5000000/ENERGY-BALANCE-OF-2nd-GENERATION-BIOETHANOL-PRODUCTION-IN-DENMARK.pdf (accessed on 20 April 2022).
- Zou, L.; Wan, Y.; Zhang, S.; Luo, J.; Li, Y.Y.; Liu, J. Valorization of food waste to multiple bio-energies based on enzymatic pretreatment: A critical review and blueprint for the future. J. Clean. Prod. 2020, 277, 124091. [Google Scholar] [CrossRef]
- Heredia-Olea, E.; Pérez-Carrillo, E.; Montoya-Chiw, M.; Serna-Saldívar, S.O. Effects of extrusion pretreatment parameters on sweet sorghum bagasse enzymatic hydrolysis and its subsequent conversion into bioethanol. BioMed Res. Int. 2015, 2015, 1–10. [Google Scholar] [CrossRef]
- Wen, H.; Chen, H.; Cai, D.; Gong, P.; Zhang, T.; Wu, Z.; Tan, T. Integrated in situ gas stripping–salting-out process for high-titer acetone–butanol–ethanol production from sweet sorghum bagasse. Biotechnol. Biofuels 2018, 11, 1–12. [Google Scholar] [CrossRef]
- Thanapimmetha, A.; Saisriyoot, M.; Khomlaem, C.; Chisti, Y.; Srinophakun, P. A comparison of methods of ethanol production from sweet sorghum bagasse. Biochem. Eng. J. 2019, 151, 107352. [Google Scholar] [CrossRef]
- Su, C.; Qi, L.; Cai, D.; Chen, B.; Chen, H.; Zhang, C.; Si, Z.; Wang, Z.; Li, G.; Qin, P. Integrated ethanol fermentation and acetone-butanol-ethanol fermentation using sweet sorghum bagasse. Renew. Energy 2020, 162, 1125–1131. [Google Scholar] [CrossRef]
- De Almeida, L.G.F.; da Costa Parrella, R.A.; Simeone, M.L.F.; de Oliveira Ribeiro, P.C.; dos Santos, A.S.; da Costa, A.S.V.; Gonçalves Guimarães, A.G.; Schaffert, R.E. Composition and growth of sorghum biomass genotypes for ethanol production. Biomass Bioenergy 2019, 122, 343–348. [Google Scholar] [CrossRef] [Green Version]
- Cesarino, I.; Araújo, P.; Domingues Júnior, A.P.; Mazzafera, P. An overview of lignin metabolism and its effect on biomass recalcitrance. Braz. J. Bot. 2012, 35, 303–311. [Google Scholar] [CrossRef]
- Pino, M.S.; Rodríguez-Jasso, R.M.; Michelin, M.; Ruiz, H.A. Enhancement and modeling of enzymatic hydrolysis on cellulose from agave bagasse hydrothermally pretreated in a horizontal bioreactor. Carbohydr. Polym. 2019, 211, 349–359. [Google Scholar] [CrossRef] [Green Version]
- Yu, J.; Zhang, X.; Tan, T. Ethanol production by solid state fermentation of sweet sorghum using thermotolerant yeast strain. Fuel Process. Technol. 2008, 89, 1056–1059. [Google Scholar] [CrossRef]
- Ewanick, S.; Bura, R. Hydrothermal pretreatment of lignocellulosic biomass. In Bioalcohol Production, 1st ed.; Keith Waldron, K., Ed.; Woodhead Publishing Series in Energy; Woodhead Publishing: Amsterdam, The Netherlands, 2010; Volume 1, pp. 3–23. [Google Scholar] [CrossRef]
- Singh, R.; Liu, H.; Shanklin, J.; Singh, V. Hydrothermal pretreatment for valorization of genetically engineered bioenergy crop for lipid and cellulosic sugar recovery. Bioresour. Technol. 2021, 341, 125817. [Google Scholar] [CrossRef]
- Geffert, A.; Geffertova, J.; Dudiak, M. Direct method of measuring the pH value of wood. Forests 2019, 10, 852. [Google Scholar] [CrossRef]
- Lin, R.; Deng, C.; Ding, L.; Bose, A.; Murphy, J.D. Improving gaseous biofuel production from seaweed Saccharina latissima: The effect of hydrothermal pretreatment on energy efficiency. Energy Convers. Manag. 2019, 196, 1385–1394. [Google Scholar] [CrossRef]
- Bedzo, O.K.; Dreyer, C.B.; van Rensburg, E.; Görgens, J.F. Optimisation of pretreatment catalyst, enzyme cocktail and solid loading for improved ethanol production from sweet sorghum bagasse. BioEnergy Res. 2022, 15, 1083–1095. [Google Scholar] [CrossRef]
- De Freitas, C.; Carmona, E.; Brienzo, M. Xylooligosaccharides production process from lignocellulosic biomass and bioactive effects. Bioact. Carbohydr. Diet. Fibre 2019, 18, 100184. [Google Scholar] [CrossRef]
- Huang, C.; Yu, Y.; Li, Z.; Yan, B.; Pei, W.; Wu, H. The preparation technology and application of xylo-oligosaccharide as prebiotics in different fields: A review. Front. Nutr. 2022, 9, 996811. [Google Scholar] [CrossRef] [PubMed]
- Pal, P.; Kumar, S.; Devi, M.M.; Saravanamurugan, S. Oxidation of 5-hydroxymethylfurfural to 5-formyl furan-2-carboxylic acid by non-precious transition metal oxide-based catalyst. J. Supercrit. Fluids 2020, 160, 104812. [Google Scholar] [CrossRef]
- Pinales-Márquez, C.D.; Rodríguez-Jasso, R.M.; Araújo, R.G.; Loredo-Trevino, A.; Nabarlatz, D.; Gullón, B.; Ruiz, H.A. Circular bioeconomy and integrated biorefinery in the production of xylooligosaccharides from lignocellulosic biomass: A review. Ind. Crops Prod. 2021, 162, 113274. [Google Scholar] [CrossRef]
- Velvizhi, G.; Balakumar, K.; Shetti, N.P.; Ahmad, E.; Pant, K.K.; Aminabhavi, T.M. Integrated Biorefinery Processes for Conversion of Lignocellulosic Biomass to Value Added Materials: Paving a Path Towards Circular Economy. Bioresour. Technol. 2021, 343, 126151. [Google Scholar] [CrossRef]
- De Barros, E.M.; Carvalho, V.M.; Rodrigues, T.H.S.; Rocha, M.V.P.; Gonçalves, L.R.B. Comparison of strategies for the simultaneous saccharification and fermentation of cashew apple bagasse using a thermotolerant Kluyveromyces marxianus to enhance cellulosic ethanol production. Chem. Eng. J. 2017, 307, 939–947. [Google Scholar] [CrossRef]
- López-Sandin, I.; Zavala-García, F.; Levin, L.; Ruiz, H.A.; Hernández-Luna, C.E.; Gutiérrez-Soto, G. Evaluation of bioethanol production from sweet sorghum variety roger under different tillage and fertilizer treatments. BioEnergy Res. 2021, 14, 1058–1069. [Google Scholar] [CrossRef]
- Matsakas, L.; Christakopoulos, P. Fermentation of liquefacted hydrothermally pretreated sweet sorghum bagasse to ethanol at high-solids content. Bioresour. Technol. 2013, 127, 202–208. [Google Scholar] [CrossRef]
- Tinôco, D.; Genier, H.L.A.; da Silveira, W.B. Technology valuation of cellulosic ethanol production by Kluyveromyces marxianus CCT 7735 from sweet sorghum bagasse at elevated temperatures. Renew. Energy 2021, 173, 188–196. [Google Scholar] [CrossRef]
- Mofijur, M.; Ong, H.C.; Jan, B.M.; Kusumo, F.; Sebayang, A.H.; Husin, H.; Silitonga, A.S.; Indra Mahlia, T.M.; Rahman, S.A. Production process and optimization of solid bioethanol from empty fruit bunches of palm oil using response surface methodology. Process 2019, 7, 715. [Google Scholar] [CrossRef] [Green Version]
- Couto, E.; Calijuri, M.L.; Assemany, P. Biomass production in high-rate ponds and hydrothermal liquefaction: Wastewater treatment and bioenergy integration. Sci. Total Environ. 2020, 724, 138104. [Google Scholar] [CrossRef]
- Souza, S.P.; Gopal, A.R.; Seabra, J.E. Life cycle assessment of biofuels from an integrated Brazilian algae-sugarcane biorefinery. Energy 2015, 81, 373–381. [Google Scholar] [CrossRef]

 Correspond at 0 FPU,
  at 10 FPU, and
  at 15 FPU.
Correspond at 0 FPU, at 10 FPU, and at 15 FPU.
at 15 FPU.
Correspond at 0 FPU, at 10 FPU, and at 15 FPU.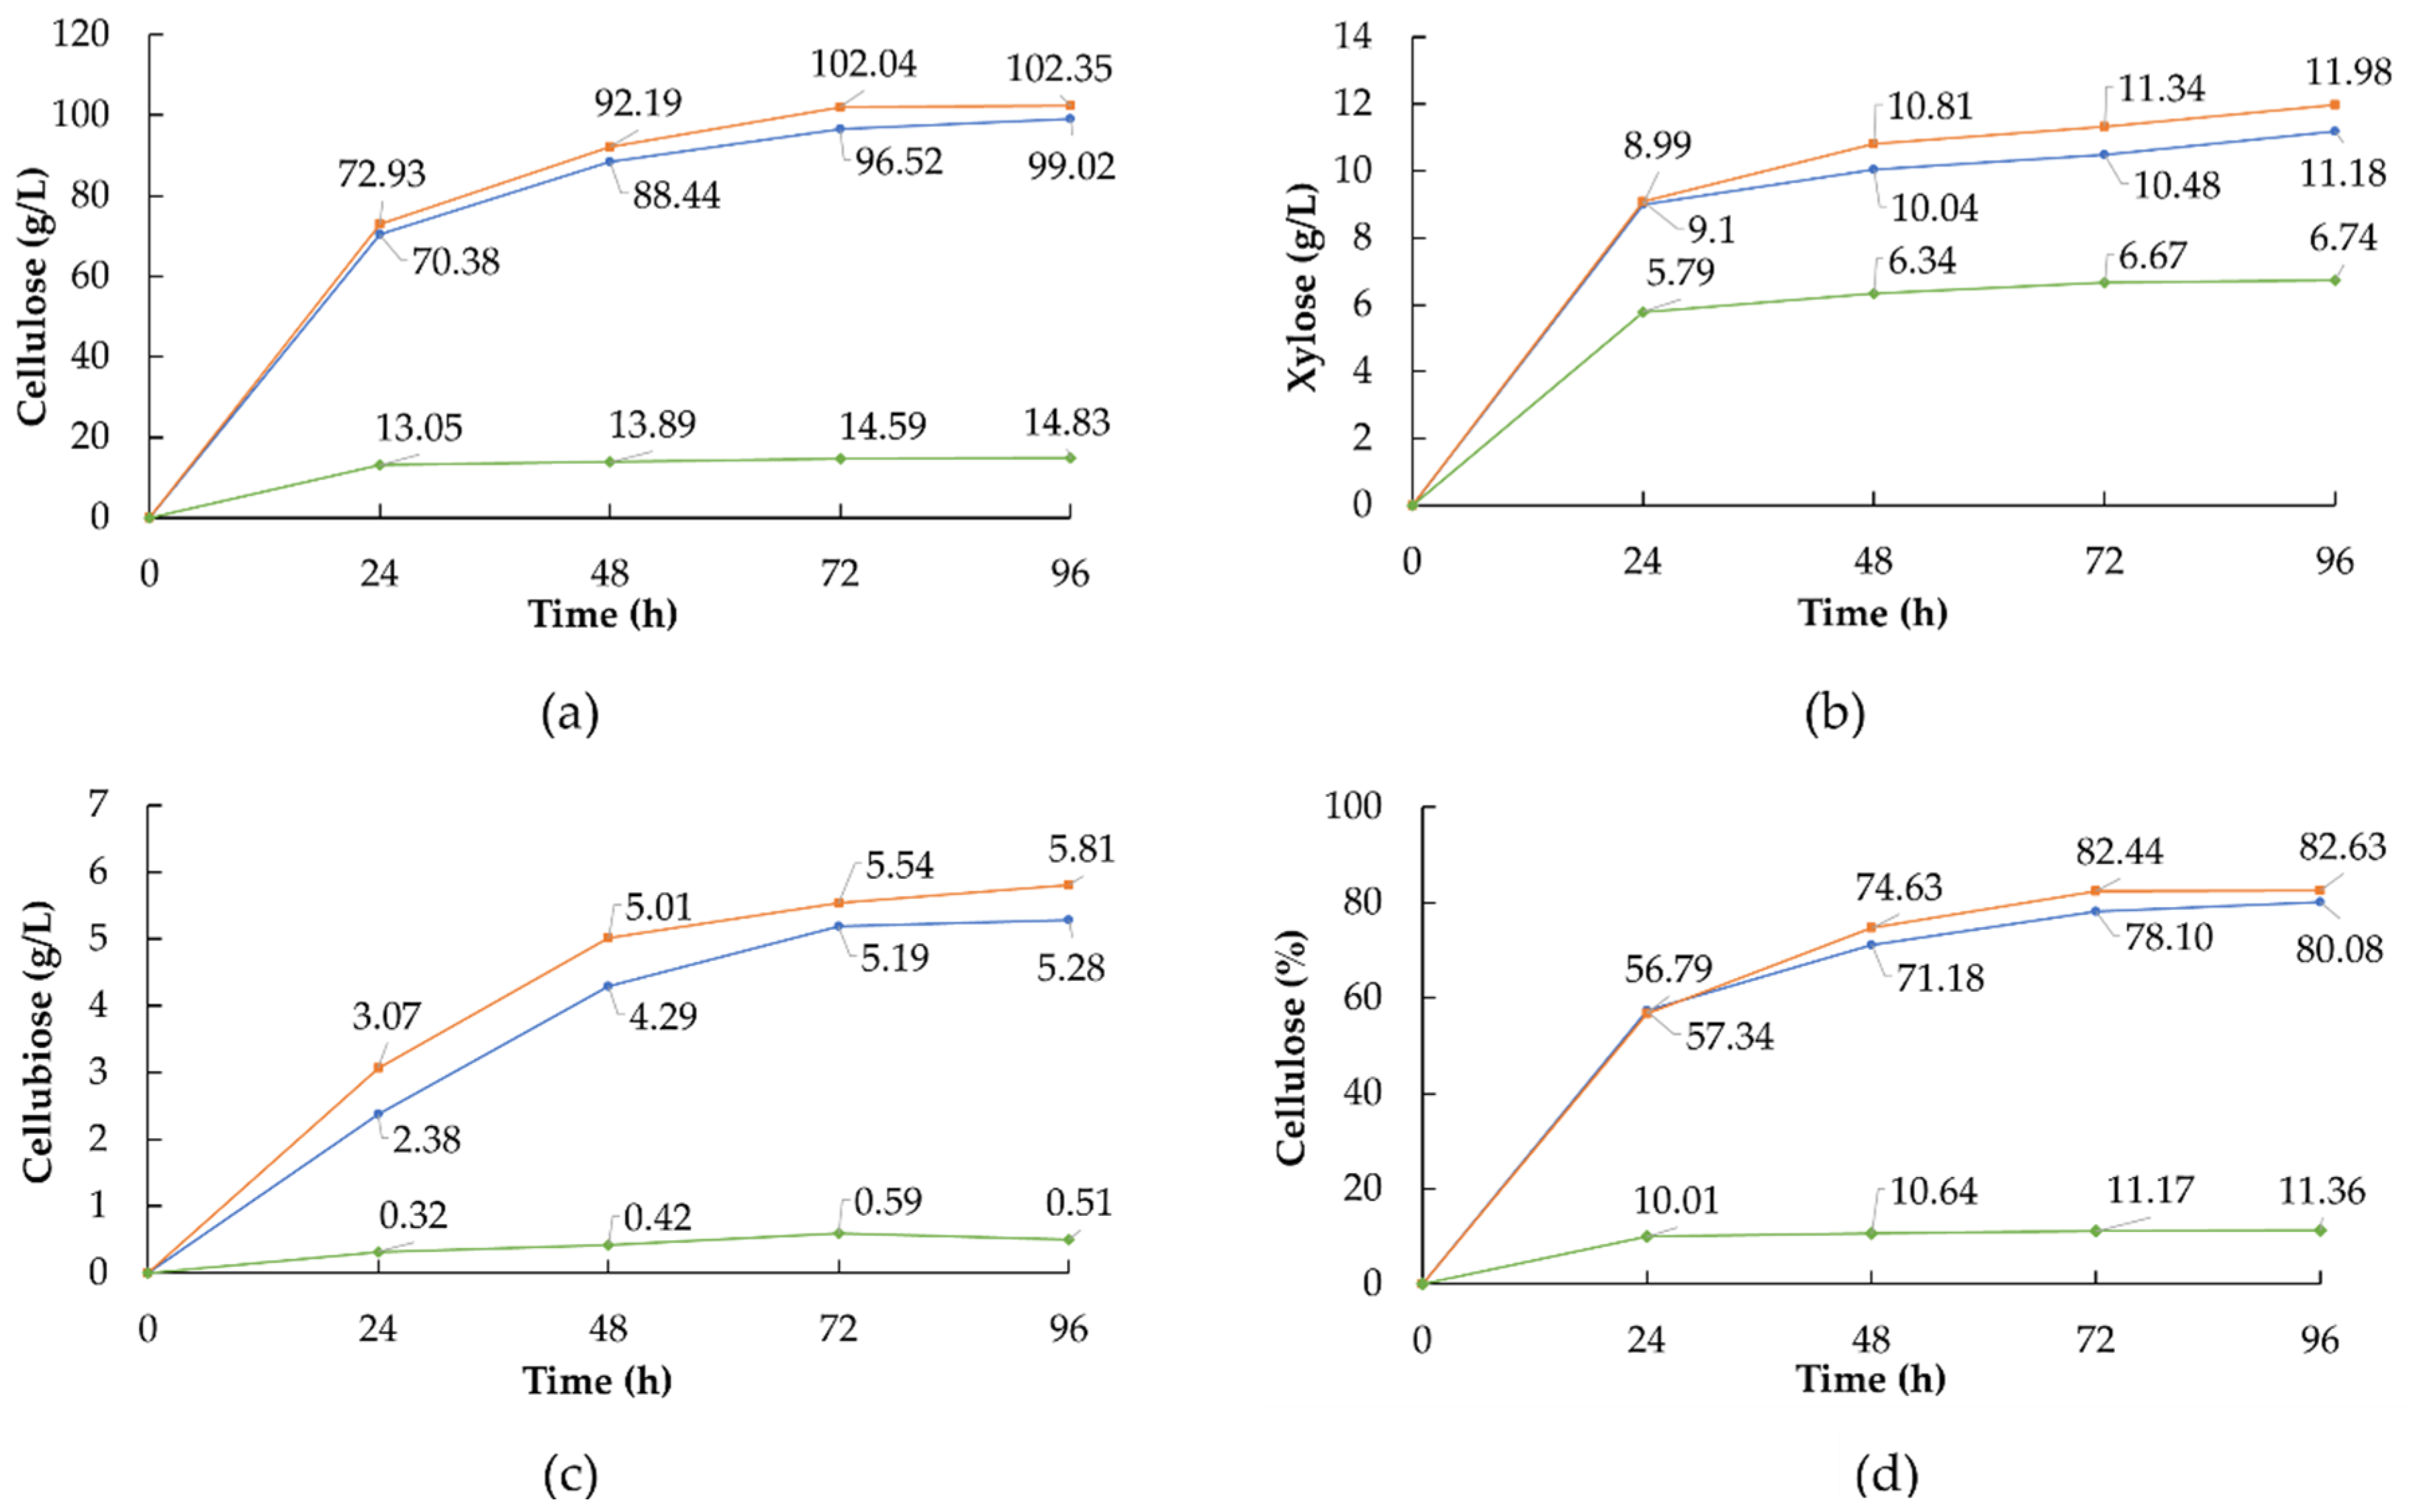

| Run | Treatment | X1 (°C) | X2 (min) | X3 (mm) |
|---|---|---|---|---|
| 1 | 1 | −1 | −1 | 0 |
| 2 | 2 | −1 | 1 | 0 |
| 3 | 3 | 1 | −1 | 0 |
| 4 | 4 | 1 | 1 | 0 |
| 5 | 5 | −1 | 0 | −1 |
| 6 | 6 | −1 | 0 | 1 |
| 7 | 7 | 1 | 0 | −1 |
| 8 | 8 | 1 | 0 | 1 |
| 9 | 9 | 0 | −1 | −1 |
| 10 | 10 | 0 | −1 | 1 |
| 11 | 11 | 0 | 1 | −1 |
| 12 | 12 | 0 | 1 | 1 |
| 13 * | 13 | 0 | 0 | 0 |
| Factors | Symbol | Levels | ||
| −1 | 0 | 1 | ||
| T (°C) | X1 | 170 | 180 | 190 |
| t (min) | X2 | 10 | 30 | 50 |
| S (mm) | X3 | 0.5 | 1 | 1.5 |
| Concept | Unit | Equivalent Energy (MJ/Unit) | Source | |
|---|---|---|---|---|
| Human labor | Manual | h | 1.96 | [1] |
| Mechanized | 1.05 | [1] | ||
| Sulphury acid | kg | 0.702 | [33] | |
| Sodium hydroxide | kg | 10.41 | [34] | |
| Other chemicals | kg | 8.74 | [34] | |
| Enzymes | kg | 6.32 | [34] | |
| Yeasts | kg | 6.32 | [34] | |
| Water | kg | 0.005 | [35] | |
| Electricity | kWh | 11.93 | [1] | |
| Calorific power | ||||
| Bioethanol | kg | 2.69 | [36] | |
| EC | GC | Component (Dry Weight: %, w/w) * | ||||||||
|---|---|---|---|---|---|---|---|---|---|---|
| Tt | T | t | S | P | [log(Ro)] | pH | HTR | Cellulose | Hemicellulose | Lignin |
| 1 | 170 | 10 | 1 | 0.71 | 3.75 | 4.66 | 7.22 | 33.75 ± 0.79 FG ** | 9.38 ± 0.61 A | 26.02 ± 0.20 F |
| 2 | 170 | 50 | 1 | 0.71 | 4.07 | 3.96 | 7.66 | 36.63 ± 0.16 EF | 9.32 ± 0.24 A | 30.40 ± 2.20 BC |
| 3 | 190 | 10 | 1 | 1.26 | 3.90 | 3.92 | 5.74 | 41.09 ± 0.77 CD | 7.78 ± 0.09 CD | 30.53 ± 1.20 BC |
| 4 | 190 | 50 | 1 | 1.26 | 4.17 | 3.60 | 6.76 | 52.48 ± 1.49 A | 5.03 ± 0.50 F | 32.53 ± 0.76 A |
| 5 | 170 | 30 | 0.50 | 0.71 | 4.01 | 3.75 | 6.98 | 37.85 ± 0.62 DE | 8.29 ± 0.49 A | 29.80 ± 1.62 CD |
| 6 | 170 | 30 | 1.50 | 0.71 | 3.93 | 4.01 | 8.09 | 33.68 ± 1.51 G | 8.82 ± 0.58 AB | 28.20 ± 1.31 E |
| 7 | 190 | 30 | 0.50 | 1.26 | 4.09 | 3.75 | 5.71 | 44.10 ± 1.27 BC | 5.45 ± 0.40 F | 30.73 ± 0.50 BC |
| 8 | 190 | 30 | 1.50 | 1.26 | 4.02 | 3.86 | 7.57 | 45.24 ± 1.73 B | 6.48 ± 0.37 EF | 31.13 ± 2.91 ABC |
| 9 | 180 | 10 | 0.50 | 0.89 | 3.85 | 4.43 | 7.07 | 38.75 ± 0.86 DE | 9.21 ± 0.68 A | 28.27 ± 1.29 DE |
| 10 | 180 | 10 | 1.50 | 0.89 | 3.76 | 4.54 | 8.53 | 37.97 ± 0.80 DE | 8.72 ± 0.60 ABC | 30.21 ± 1.12 BC |
| 11 | 180 | 50 | 0.50 | 0.89 | 4.13 | 3.72 | 7.73 | 40.39 ± 1.23 CD | 7.27 ± 0.60 DE | 31.66 ± 1.98 AB |
| 12 | 180 | 50 | 1.50 | 0.89 | 4.11 | 3.77 | 8.16 | 37.91 ± 1.24 DE | 7.09 ± 0.37 DE | 30.73 ± 1.41 BC |
| 13 | 180 | 30 | 1 | 0.89 | 4.01 | 3.80 | 7.43 | 39.86 ± 2.36 DE | 7.83 ± 0.19 BCD | 31.58 ± 1.50 AB |
| Tt | Compounds (g/L) * | |||||||
|---|---|---|---|---|---|---|---|---|
| Glucose | Xylose | Arabinose | Acetic Acid | Levulinic Acid | HMF | Furfural | XOS | |
| 1 | 0.15 ± 0.00 | 0.29 ± 0.00 | 0.23 ± 0.01 | 0.41 ± 0.02 | 0.00 ± 0.00 | 0.00 ± 0.00 | 0.01 ± 0.00 | 0.01 ± 0.00 |
| 2 | 0.17 ± 0.00 | 0.37 ± 0.03 | 0.37 ± 0.00 | 0.91 ± 0.21 | 0.03 ± 0.01 | 0.04 ± 0.00 | 0.36 ± 0.19 | 0.04 ± 0.02 |
| 3 | 0.18 ± 0.00 | 0.47 ± 0.02 | 0.47 ± 0.02 | 1.02 ± 0.04 | 0.03 ± 0.00 | 0.05 ± 0.00 | 0.45 ± 0.04 | 0.05 ± 0.00 |
| 4 | 0.21 ± 0.00 | 1.55 ± 0.10 | 0.12 ± 0.00 | 3.13 ± 0.06 | 0.06 ± 0.00 | 0.24 ± 0.02 | 5.67 ± 0.29 | 0.23 ± 0.02 |
| 5 | 0.18 ± 0.00 | 0.31 ± 0.02 | 0.36 ± 0.00 | 1.07 ± 0.36 | 0.02 ± 0.00 | 0.03 ± 0.01 | 0.18 ± 0.08 | 0.03 ± 0.01 |
| 6 | 0.18 ± 0.00 | 0.30 ± 0.00 | 0.36 ± 0.02 | 0.54 ± 0.04 | 0.00 ± 0.00 | 0.01 ± 0.00 | 0.09 ± 0.00 | 0.02 ± 0.00 |
| 7 | 0.19 ± 0.00 | 1.51 ± 0.03 | 0.48 ± 0.08 | 1.39 ± 0.10 | 0.05 ± 0.01 | 0.30 ± 0.03 | 3.77 ± 0.19 | 0.28 ± 0.03 |
| 8 | 0.18 ± 0.00 | 0.83 ± 0.12 | 0.17 ± 0.00 | 0.64 ± 0.12 | 0.04 ± 0.02 | 0.08 ± 0.02 | 1.58 ± 0.31 | 0.08 ± 0.02 |
| 9 | 0.17 ± 0.00 | 0.29 ± 0.01 | 0.29 ± 0.03 | 0.44 ± 0.01 | 0.04 ± 0.02 | 0.02 ± 0.00 | 0.10 ± 0.04 | 0.02 ± 0.00 |
| 10 | 0.16 ± 0.00 | 0.29 ± 0.00 | 0.28 ± 0.00 | 0.38 ± 0.00 | 0.02 ± 0.00 | 0.01 ± 0.00 | 0.05 ± 0.00 | 0.02 ± 0.00 |
| 11 | 0.19 ± 0.00 | 1.59 ± 1.49 | 0.26 ± 0.02 | 0.65 ± 0.08 | 0.03 ± 0.00 | 0.06 ± 0.01 | 0.84 ± 0.01 | 0.06 ± 0.01 |
| 12 | 0.18 ± 0.00 | 0.71 ± 0.04 | 0.31 ± 0.02 | 0.91 ± 0.09 | 0.04 ± 0.00 | 0.09 ± 0.01 | 1.20 ± 0.11 | 0.09 ± 0.00 |
| 13 | 0.17 ± 0.00 | 0.38 ± 0.00 | 0.31 ± 0.00 | 0.56 ± 0.02 | 0.03 ± 0.00 | 0.03 ± 0.00 | 0.36 ± 0.01 | 0.03 ± 0.00 |
| FE | Processes | Einp (MJ) | Eout (MJ) | |||
|---|---|---|---|---|---|---|
| GD (MJ) | HP (MJ) | AH (MJ) | PSSF (MJ) | |||
| Electricity | 0.79 | 29.73 | 25.35 | 125.39 | 181.26 | - |
| Human labor | 3.01 | 1.75 | 5.88 | 29.1 | 39.74 | - |
| Chemicals | 0.00 | 0.00 | 6.54 | 0.00 | 6.54 | - |
| Enzymes | 0.00 | 0.00 | 0.00 | 0.04 | 0.04 | - |
| Yeasts | 0.00 | 0.00 | 0.00 | 0.05 | 0.05 | - |
| Water | 0.00 | 0.47 | 0.93 | 0.0025 | 1.40 | - |
| Total | 3.80 | 31.95 | 38.71 | 154.58 | 229.03 | 2.52 |
| Energy consumed per unit of processed biomass * (MJ/g) | ||||||
| Electricity | 0.01 | 0.32 | 0.27 | 1.35 | 1.94 | - |
| Human labor | 0.03 | 0.02 | 0.06 | 0.31 | 0.43 | - |
| Chemicals | 0.00 | 0.00 | 0.07 | 0.00 | 0.07 | - |
| Enzymes | 0.00 | 0.00 | 0.00 | 0.0004 | 0.0004 | - |
| Yeasts | 0.00 | 0.00 | 0.00 | 0.0005 | 0.0005 | - |
| Water | 0.00 | 0.01 | 0.01 | 0.00 | 0.02 | - |
| Einp | 0.04 | 0.34 | 0.42 | 1.67 | 2.46 | - |
| Eout | - | - | - | - | - | 0.03 |
Publisher’s Note: MDPI stays neutral with regard to jurisdictional claims in published maps and institutional affiliations. |
© 2022 by the authors. Licensee MDPI, Basel, Switzerland. This article is an open access article distributed under the terms and conditions of the Creative Commons Attribution (CC BY) license (https://creativecommons.org/licenses/by/4.0/).
Share and Cite
López-Sandin, I.; Rodríguez-Jasso, R.M.; Gutiérrez-Soto, G.; Rosero-Chasoy, G.; Shiva; González-Gloria, K.D.; Ruiz, H.A. Energy Assessment of Second-Generation (2G) Bioethanol Production from Sweet Sorghum (Sorghum bicolor (L.) Moench) Bagasse. Agronomy 2022, 12, 3106. https://doi.org/10.3390/agronomy12123106
López-Sandin I, Rodríguez-Jasso RM, Gutiérrez-Soto G, Rosero-Chasoy G, Shiva, González-Gloria KD, Ruiz HA. Energy Assessment of Second-Generation (2G) Bioethanol Production from Sweet Sorghum (Sorghum bicolor (L.) Moench) Bagasse. Agronomy. 2022; 12(12):3106. https://doi.org/10.3390/agronomy12123106
Chicago/Turabian StyleLópez-Sandin, Iosvany, Rosa M. Rodríguez-Jasso, Guadalupe Gutiérrez-Soto, Gilver Rosero-Chasoy, Shiva, K. D. González-Gloria, and Héctor A. Ruiz. 2022. "Energy Assessment of Second-Generation (2G) Bioethanol Production from Sweet Sorghum (Sorghum bicolor (L.) Moench) Bagasse" Agronomy 12, no. 12: 3106. https://doi.org/10.3390/agronomy12123106
APA StyleLópez-Sandin, I., Rodríguez-Jasso, R. M., Gutiérrez-Soto, G., Rosero-Chasoy, G., Shiva, González-Gloria, K. D., & Ruiz, H. A. (2022). Energy Assessment of Second-Generation (2G) Bioethanol Production from Sweet Sorghum (Sorghum bicolor (L.) Moench) Bagasse. Agronomy, 12(12), 3106. https://doi.org/10.3390/agronomy12123106