Article

Influence of Reduced Tillage, Fertilizer Placement, and Soil Afforestation on CO2 Emission from Arable Sandy Soils

by
Tomasz Sosulski
1,
Tomasz Niedziński
1,
Tamara Jadczyszyn
2 and
Magdalena Szymańska
1,*
1
Division of Agricultural and Environmental Chemistry, Institute of Agriculture, Warsaw University of Life Sciences—SGGW, Nowoursynowska 159, 02-776 Warsaw, Poland
2
Department of Plant Nutrition and Fertilization, Institute of Soil Science and Plant Cultivation, State Research Institute, Czartoryskich 8, 24-100 Puławy, Poland
*
Author to whom correspondence should be addressed.
Agronomy 2022, 12(12), 3102; https://doi.org/10.3390/agronomy12123102
Submission received: 26 October 2022 / Revised: 4 December 2022 / Accepted: 5 December 2022 / Published: 7 December 2022

Abstract

:
Extreme meteorological phenomena resulting from climate change caused by anthropogenic emissions of greenhouse gases (GHG) require the implementation of CO2 mitigation practices from various industries, including agriculture. Owing to varying soil, climatic, and agrotechnical characteristics, they may have different efficiencies in mitigating soil CO2 emissions. The aim of this study was to evaluate the impact of three mitigation practices (reduced tillage, deep fertilizer placement, and soil afforestation) on CO2 emissions from sandy soils in Central and Eastern Europe allowing the prediction of the mitigation effectiveness of these methods. The average soil CO2-C flux under a moldboard plow system ranged from 218.4 ± 108.4 to 263.7 ± 176.6 mg CO2-C m−2 h−1 and under a reduced tillage system ranged from 169.7 ± 118.7 to 163.6 ± 115.2 mg CO2-C m−2 h−1 in a year with normal meteorological conditions and under extreme drought conditions, respectively. In the dry growing season, similar amounts of CO2-C were released from the soil fertilized to the soil surface and after mineral fertilizers application at a depth of 10 cm and 20 cm (133.7 ± 155.8, 132.0 ± 147.5 and 131.0 ± 148.1 mg CO2-C m−2 h−1, respectively). Meanwhile, from the forest soil, the average CO2-C emission in the dry growing season was 123.3 ± 79 mg CO2-C m−2 h−1. The obtained results revealed that reduced tillage on sandy soil allowed for reduced CO2 emissions from the soil by 28.7–61.2% in normal and drought weather, respectively. Under drought conditions, deep fertilizer placement did not reduce CO2 emissions from sandy soil, and CO2 emissions from forest soils were even higher than from arable soils.

1. Introduction

Implementation of the strategic objectives, set out in the European Green Deal, to reduce EU’s greenhouse gas (GHG) emissions to at least 50% by 2030 [1] and the need to limit the rise in atmospheric temperature [2] forces the implementation of methods to reduce GHG emissions from agriculture.
Agriculture is a significant emitter of GHG into the atmosphere [3]. Methods to reduce GHG emissions from agriculture are aptly described in the literature [4,5], but their effectiveness in different soil and climatic conditions may vary [6,7]. The issue of CO2 emissions from the soil in different cultivation systems (conventional tillage, no-tillage) was the subject of in-depth studies by Reicosky [8] conducted on clay loam soil. The results of these studies showed that the CO2 flux from conventionally farmed soil was nearly five times larger than in a no-tillage system. The effect of tillage reduction on CO2 emissions from sandy soils is less recognized. More than 70% of Polish soils were formed mainly from clays and sands, highly leached and shaped by glacial waters [9]. Low soil organic carbon (SOC), soil acidification, and susceptibility to drying out are a consequence of the processes that developed these soils [10,11,12]. Such soils are characterized by a low capacity to accumulate organic matter [13] and can be emitters of CO2. Sandy soils are widespread on different continents and in different climate zones. In Europe, agriculturally used sandy soils occur over a large area covering Lithuania, Poland, northeastern Germany, Denmark, and the Netherlands [14]. Moreover, despite the fact that these poorly fertile soils have been afforested (in Poland, during the campaign to restore the country’s forest cover after World War II in 1945–1970 [15]), crop production is still carried out on sandy soils of low fertility. It can be expected that in the face of the energy crisis caused mainly by the political situation in Eastern Europe, inducing an increase in the price of fertilizers, fuels, and inputs, an unspecified area of the infertile sandy soils will be further afforested. On the remaining soil, changes are likely to be made in soil tillage and fertilization methods allowing for reduced inputs in production (tillage reduction, reduced fertilizer application rates, precise deep placement of fertilizers). Changes in tillage technology allowing one to maintain or even increase crop production will be supported by mechanisms of the EU Common Agricultural Policy [16]. Some of the agrotechnical solutions that improve the economic efficiency of crop production are considered desirable practices that reduce GHG emissions. Climate change results from anthropogenic GHG emissions, and the increase in their content in the atmospheric air is recognized as the greatest civilization threat of the 21st century [2]. Between 2011 and 2020, warming temperatures (land by 1.59 °C and ocean by 0.88 °C, relative to the 1850–1900 average) covered all continents, oceans, and the atmosphere. A noticeable effect of climate change is disrupting the global hydrological cycle. This has resulted in agricultural and environmental droughts that have been occurring for the past few years [17,18]. Climate change projections show that the increase in summer temperatures will be accompanied by a decrease in precipitation. It can be predicted that even with a relatively stable annual sum of precipitation, the amount of precipitation will decrease during the growing season and increase outside this period. Thus, it can be expected that in the near future, the number of hot days without precipitation with prolonged periods of drought will increase during the summer. It is estimated that approximately 40–52% of Poland’s agricultural and forest lands are at high risk of drought [19]. Drought is responsible for up to 40% of crop yield loss [20]. Following the extreme drought of 2018, nearly €292 million in emergency government aid was allocated to many regions in Germany. Almost 25% of that amount went to Brandenburg in northeastern Germany, where sandy soils predominate [21].
The literature describes the impact of various practices on reducing GHG emissions from soil [4,5,22]. The reduction in soil CO2 efflux documented in the literature due to reduced tillage/no-till is mainly due to an increase in soil bulk density and a decrease in soil gas diffusivity [23]. However, there are significant discrepancies in the literature to assess the impact of reduced tillage on CO2 soil fluxes. Oorts et al. [24] showed that differences in CO2 soil emissions between conventional tillage and no-tillage depend on climatic conditions, soil organic matter (SOM) content, and the amounts and location of crop residues in the soil. These authors found no significant differences between CO2 cumulative emissions from silt loam soil (Haplic Luvisols) in climatic conditions of Northern France. Similar findings were obtained by Jia et al. [25], who proved no differences in CO2 emissions from soil in the no-tillage and moldboard plow system of corn cultivation in normal and dry years in Northeastern China. The importance of crop residues for the effectiveness of reducing CO2 emissions from silt loam soil was evaluated by Du et al. [26]. Under conditions of returning crop residues to the soil, the no-tillage system reduced heterotrophic soil respiration and did not affect autotrophic soil respiration compared to the moldboard plow system. Approximately 58% of the CO2 emitted from the soil is produced during the decomposition of corn residues [27]. Therefore, under conditions of crop residue return, it is possible to reduce CO2 emissions by approximately 10.8–19.4% in a no-tillage system compared to conventional tillage [28]. A meta-analysis of data from 50 peer-reviewed publications by Shakoor et al. [29] showed that a no-tillage system increases CO2 soil emissions by 7.1% compared to conventional tillage. Differently, Wang et al. [30] observed an approximately 14.5% reduction in CO2 emissions in the no-tillage system relative to a moldboard plow system in the crop residue-returned farming system. In contrast, a 21.8–26.5% reduction in soil CO2 emissions in a no-tillage system in wheat farming was obtained by Guo et al. [31]. Abdalla et al. [32] evaluated that, compared to conventional tillage, reduced tillage decreases soil CO2 emissions by an average of 21% of soil and 29% on dry sandy soils with a low SOC content (<10 g C kg−1). The cited literature data do not allow a clear assessment of the effect of no-tillage system cultivation on soil CO2 emissions and indicate the need for such studies on arable sandy soils located in northeastern Europe, especially with the insufficient amount of data collected from this region.
Deep placement of nitrogen fertilizers as a practice to improve N use efficiency is a highly successful practice for reducing N2O emissions from the soil [33]. In turn, there are limited data in the literature reporting the effectiveness of this practice in mitigating CO2 emissions from soil. Sosulski et al. [34] showed no impact of deep fertilizer placement on CO2 emissions from sandy soil, but these studies were conducted on soil without plant cover. A more promising method of mitigating CO2 emissions from the soil is to reforest them [35,36]. According to Jandl et al. [37], forest soils are responsible for the storage of more than 70% of the soil organic carbon of terrestrial ecosystems. It is estimated that European forests remove up to 462.7 million tons of CO2 equivalent annually, and up to 67.5 million tons of CO2 equivalent is removed in wood products. European forests can thus absorb up to 11.9% of the EU’s total GHG emission [38]. Therefore, forests are one of the most prominent sinks of atmospheric CO2.
Given the available literature data, we hypothesize that various mitigation practices for CO2 emissions from sandy soils in Central and Eastern Europe during dry years may have limited effectiveness. This study aimed to evaluate the impact of three mitigation practices (reduced tillage, deep placement of fertilizers, and soil afforestation) on CO2 emission from sandy soils in Central and Eastern Europe.

2. Materials and Methods

2.1. Location of the Experiments and CO2 Mitigation Practices

The assessment of the effectiveness of the three practices for mitigating CO2 emissions from soil was carried out in three locations: In Central Poland (2 experiments) and Western Poland (1 experiment), which represented typical sandy soils found in the area of Central and Eastern Europe, which includes Lithuania, Poland, Northeast Germany, Denmark, and part of the Netherlands [14].

2.1.1. Tillage Systems

The effect of reduced tillage on CO2 emissions from soil was investigated in a short-term experiment in Baborówko (52°58′ N, 16°63′ E) in western Poland. The experiment was located at the Experimental Stations belonging to the Institute of Fertilization and Soil Science of the State Research Institute in Puławy. The soil in the field experiment in Boborówko was Albic Luvisol (Cutanic) (FAO 2015) with a soil pH in 1 M KCl of 5.8, SOC content of 5.85 g C kg−1, and total nitrogen (TN) of 0.53 g N kg−1. In 2014 and 2015, the experiment grew corn for grain in the moldboard plow system (MP) and ploughless—reduced tillage system (RT). In 2013, the soil was calcified using a rate of 1.43 t Ca ha−1 (CaMg(CO3)2, 42.9% Ca) and applied 265 kg K ha−1 in the form of potassium chloride (KCl), 48% K). In the spring of 2014 and 2015, nutrients were applied to both treatments (MP and RT) at a rate of 120 kg N ha and 26 kg P ha−1. In the MP system, the dose of nutrients was applied to the soil surface in the form of urea (CO(NH2)2, 46% N) and superphosphate (Ca(H2PO4)2, 17% P). In the RT system, nutrients were applied in the form of UreaPhoS(Micro), a granular fertilizer manufactured by the New Chemical Syntheses Institute in Puławy (INS). This fertilizer contained 200 g of N, 43.7 g of P, 70 g of S, 1.5 g of Cu, 3.0 g of Zn, and 0.6 g of B kg−1. Nitrogen in this fertilizer was in the form of a urea calcium sulfate adduct. UreaPhoS(Micro) granules were applied during sowing with a drill for seeding and fertilizing (Figure 1) [39]. Soil CO2 emissions were measured in both years of the study on both combinations (MP and RT) at three dates at the following growth stages: 18–19 BBCH 8–9 leaves, 51 BBCH—panicle emergence, and 73–75 BBCH—milk grain maturity, in triplicate.

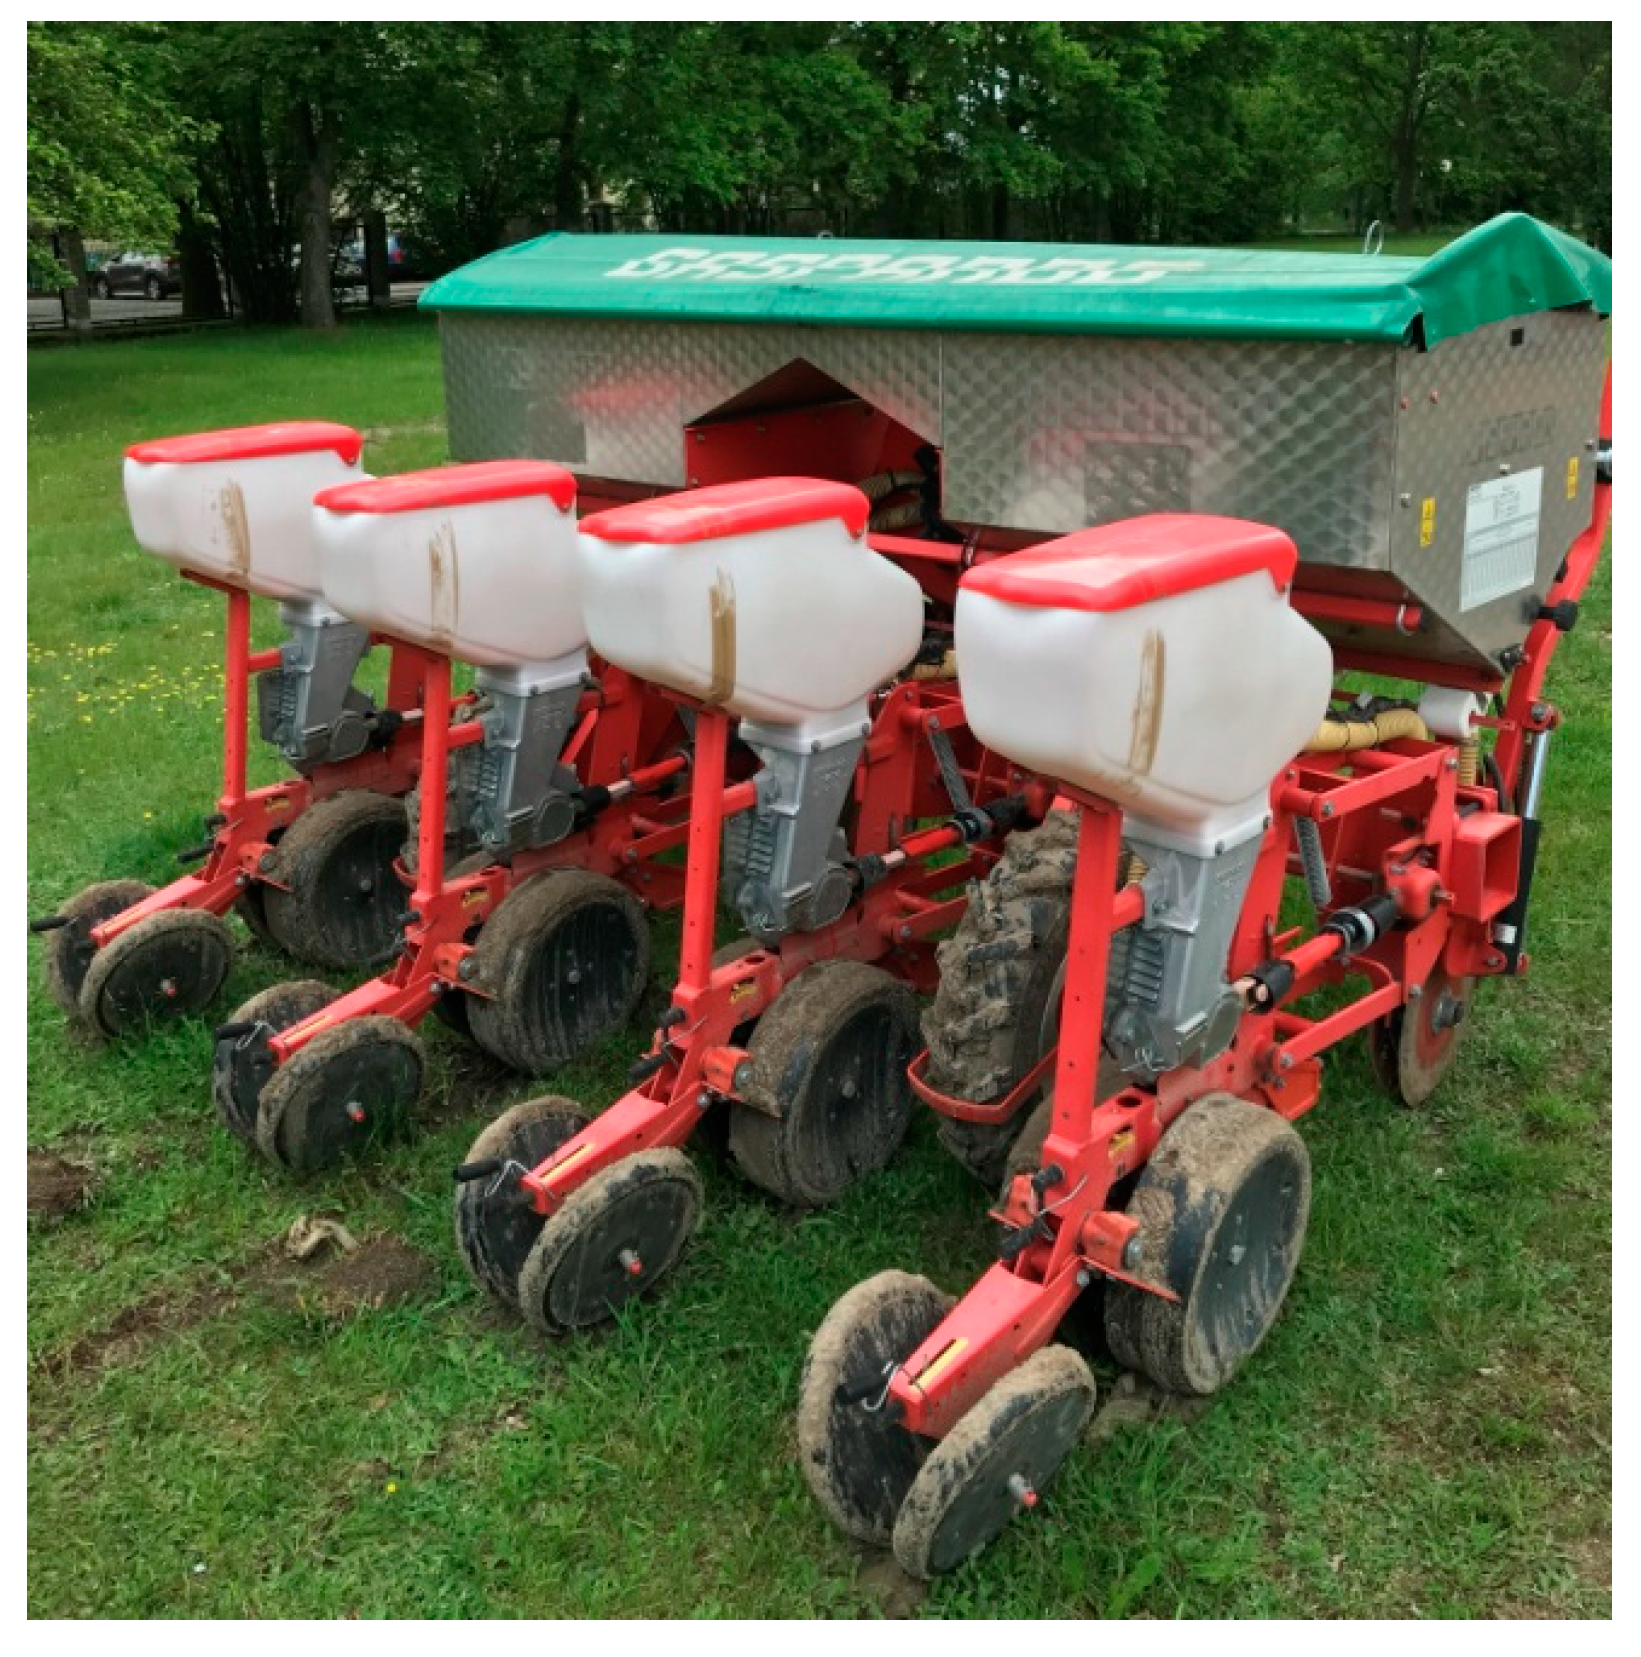
2.1.2. Fertilizer Placement

The effect of different fertilizer application methods (top dressing (TD) and deep placement (DP)) on CO2 emission from soil was studied in potato cultivation in a farm field experiment in Kuklówka Zarzeczna (52°04′63″ N, 20°59′27″ E), Central Poland, in 2014 and 2015 (Figure 2). The experiment, in which crops were grown in a three-field rotation of potatoes, wheat, and peas, was established on Ablic Podzol (Ochric) soil (FAO 2015) containing 7.3 g C kg−1 with soil pH in 1 M KCl of 5.9–6.2. Nutrients (200 kg N, 43.7 kg P, 83 kg K, and 30 kg S) were applied to the soil surface (TD) in the form of urea, triple superphosphate, 60% potassium salt, calcium sulfate) or in the form of UreaPhoS(Micro) compound fertilizer—using the deep placement method at a depth of 10 cm (DP10) and 20 cm (DP20) below the depth of potato tuber placement. Surface fertilization (TD) was carried out before planting, and fertilizers’ deep placement (DP) was carried out using a manual applicator with a depth limiter. Under each location of the potato tuber, a cylindrical hole with a diameter of 11 cm was made in the soil. Fertilizer granules were placed at the bottom of the hole. Then soil collected in a manual applicator was placed back in the soil hole, covering the fertilizer. This made it possible to place the seed potato tuber at the desired height above the fertilizers. Potatoes were planted at a 7 cm depth of soil. No organic fertilization was applied in the experiment. Soil CO2 emissions were measured in both years of study on TD, DP10, and DP20 sites at two or three dates: I—60 days after planting—the beginning of the tuber-filling stage, II—80 days after planting—the end of the tuber-filling stage, and III—105 days after planting—the maturation stage) in triplicate.

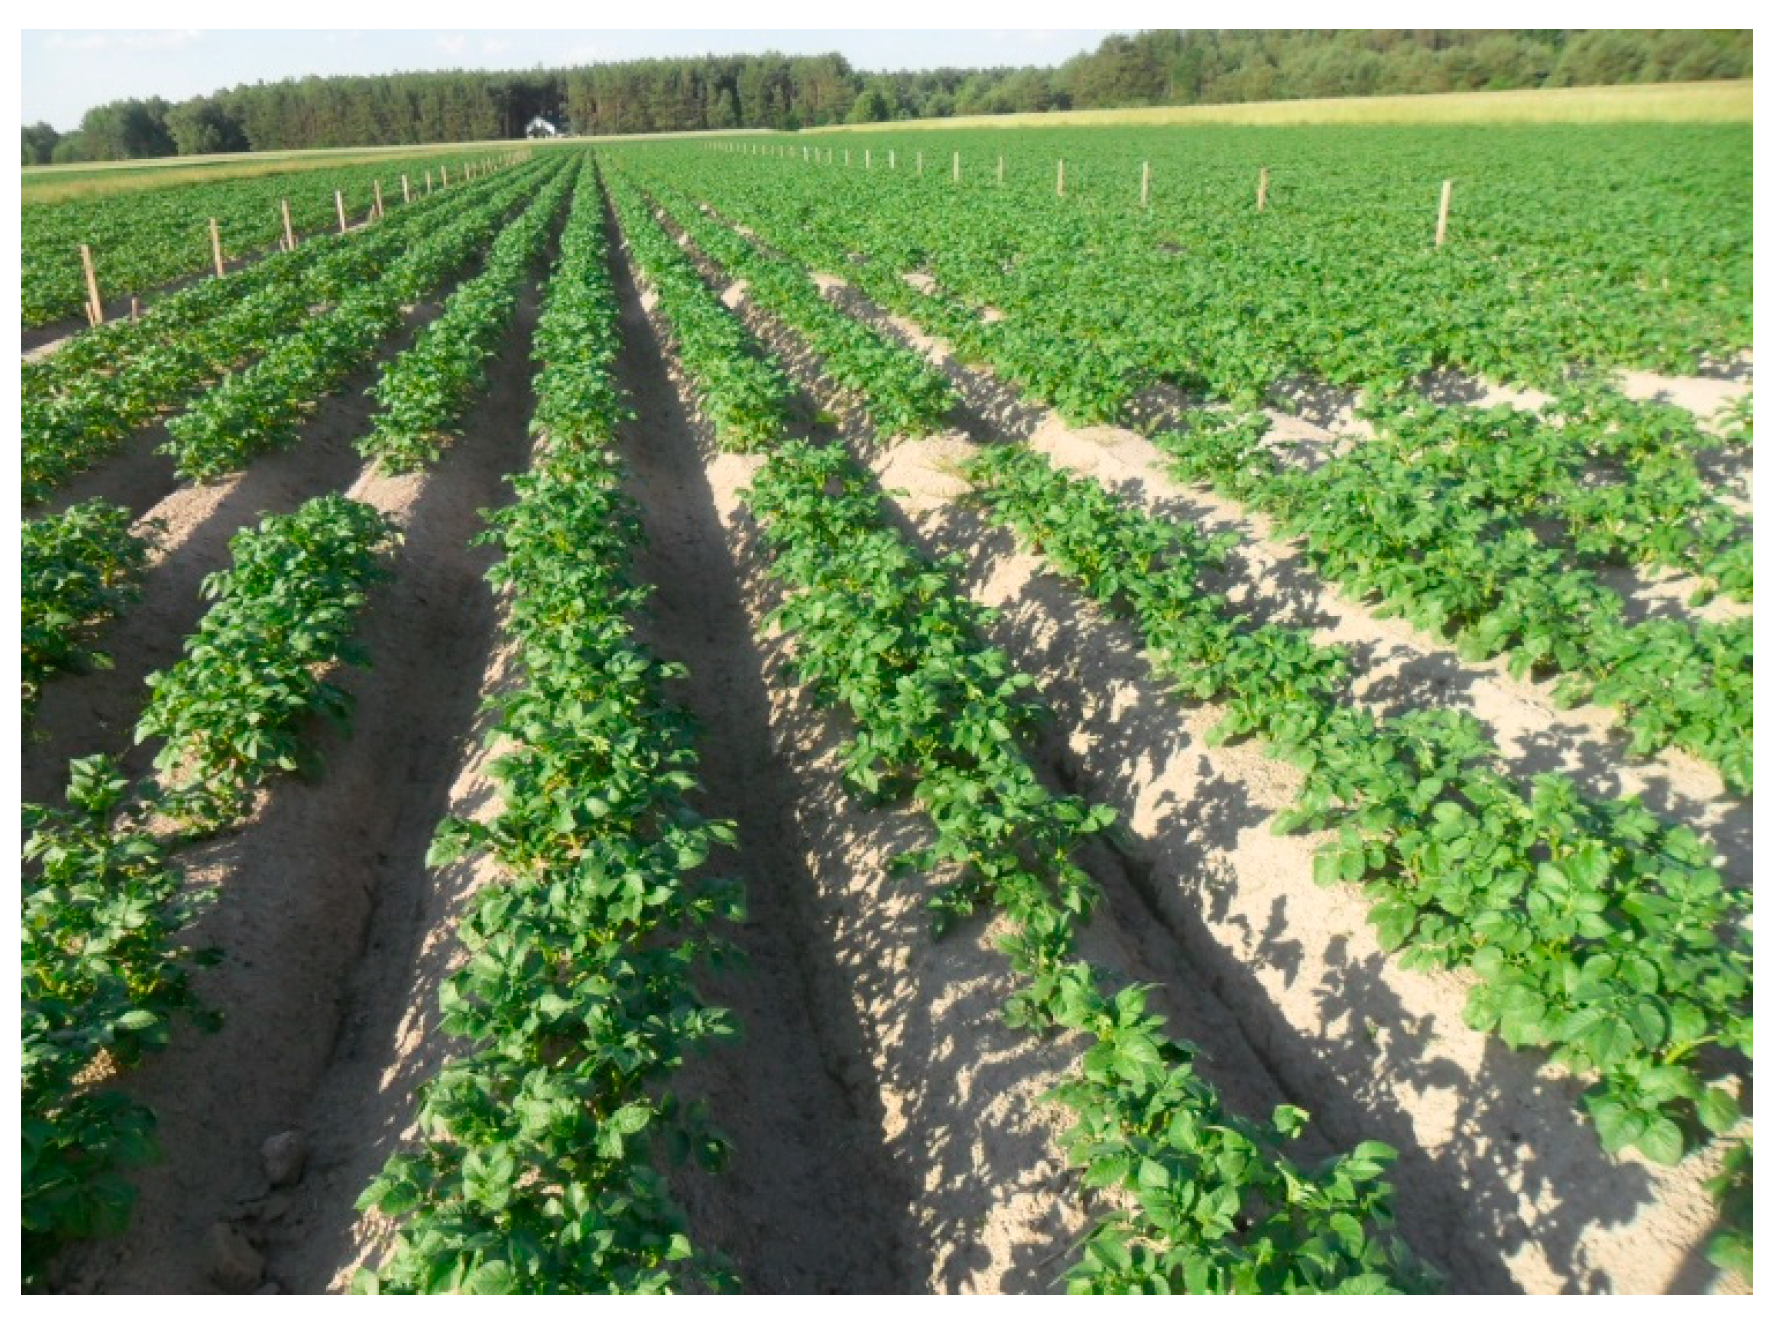
2.1.3. Afforestation of the Infertile Soils

The study on soil respiration of forest soil was carried out in the over-60-year-old Scots pine stand located next to the Mikanów village (52°08′25″ N, 21°35′11″ E) in Central Poland. This type of forest represents many regions of the country and is the result of a program to rebuild forest cover in Poland after World War II in 1945–1970 [40]. The soil under the pine forest is Dystric Brunic Arenoso (Ochric) (FAO 2015) containing, in a layer of 0–15 cm, 96% sand, 2% silt, and 2% clay [41]. The organic carbon content of the soil’s horizontal layer O was 18.14 g C kg−1, the soil’s total nitrogen content was 1.32 g N kg−1, and the soil’s pH in 1 M KCl was 4.3. Soil CO2 emissions were measured every week on 31 test dates between March 25 and October 21, 2012, from the same four randomly selected plots (approximately 10 m2) considered measurement replications.

2.2. Climatic Conditions

Poland is located in the zone of a cold, dry temperate climate [42], with an average air temperature and total annual atmospheric precipitation in Central Poland in the multi-year period of 2011–2020 of 9.8 °C and 546 mm, and in Western Poland, these values are 10.1 °C and 527 mm (2011–2020), respectively (Concise Statistical Yearbook of Poland, 2022). Meteorological data illustrating the weather patterns during the study period (Table 1) were obtained from meteorological stations at the Experimental Station in Baborówko and Chylice (6 km away from Kuklówka Zarzeczna), and for the Mikanów Scots pine stand were obtained from the Institute of Meteorology and Water Management [43]. The amount and distribution of precipitation in 2014 were favorable for plant growth, while in 2012 and 2015, there was a drought, which was determined by a shortage of precipitation in June and August in Mikanovo, May, June, July, and August (in Kuklówka Zarzeczna) and in April, May, August, September, and October (in Baborówko).

2.3. CO2 Soil Emissions Measurements

CO2-C soil fluxes were measured in situ using a portable FT-IR spectrometer model Alpha (Bruker, Germany) equipped with the device chamber. In studies conducted in Baborówko (maize fields) and Mikanów (Scots pine stand), the device chamber with dimensions of ø = 29.5 cm, h = 20 cm was exposed on the soil surface. In Kuklówka Zarzeczna (potato cultivation), the device chamber with dimensions of ø = 16 cm, h = 18.5 cm was used. Soil CO2 emissions were measured on the top of ridges. In all locations and test dates, the amount of CO2 released from the soil was calculated based on the increase in gas content in the device chamber after 10 min of exposure to the soil surface using the equation described by Hutchinson and Livingston [44].

2.4. Statistical Analysis

The analyses were performed using the Statistica PL 13.3 software (Tulsa, OK, USA). One-way analysis of variance (ANOVA) was applied to determine statistically significant differences (p < 0.05) in CO2-C soil fluxes. Homogeneous groups were determined using Tukey’s (HSD) multiple-comparison test.

3. Results and Discussion

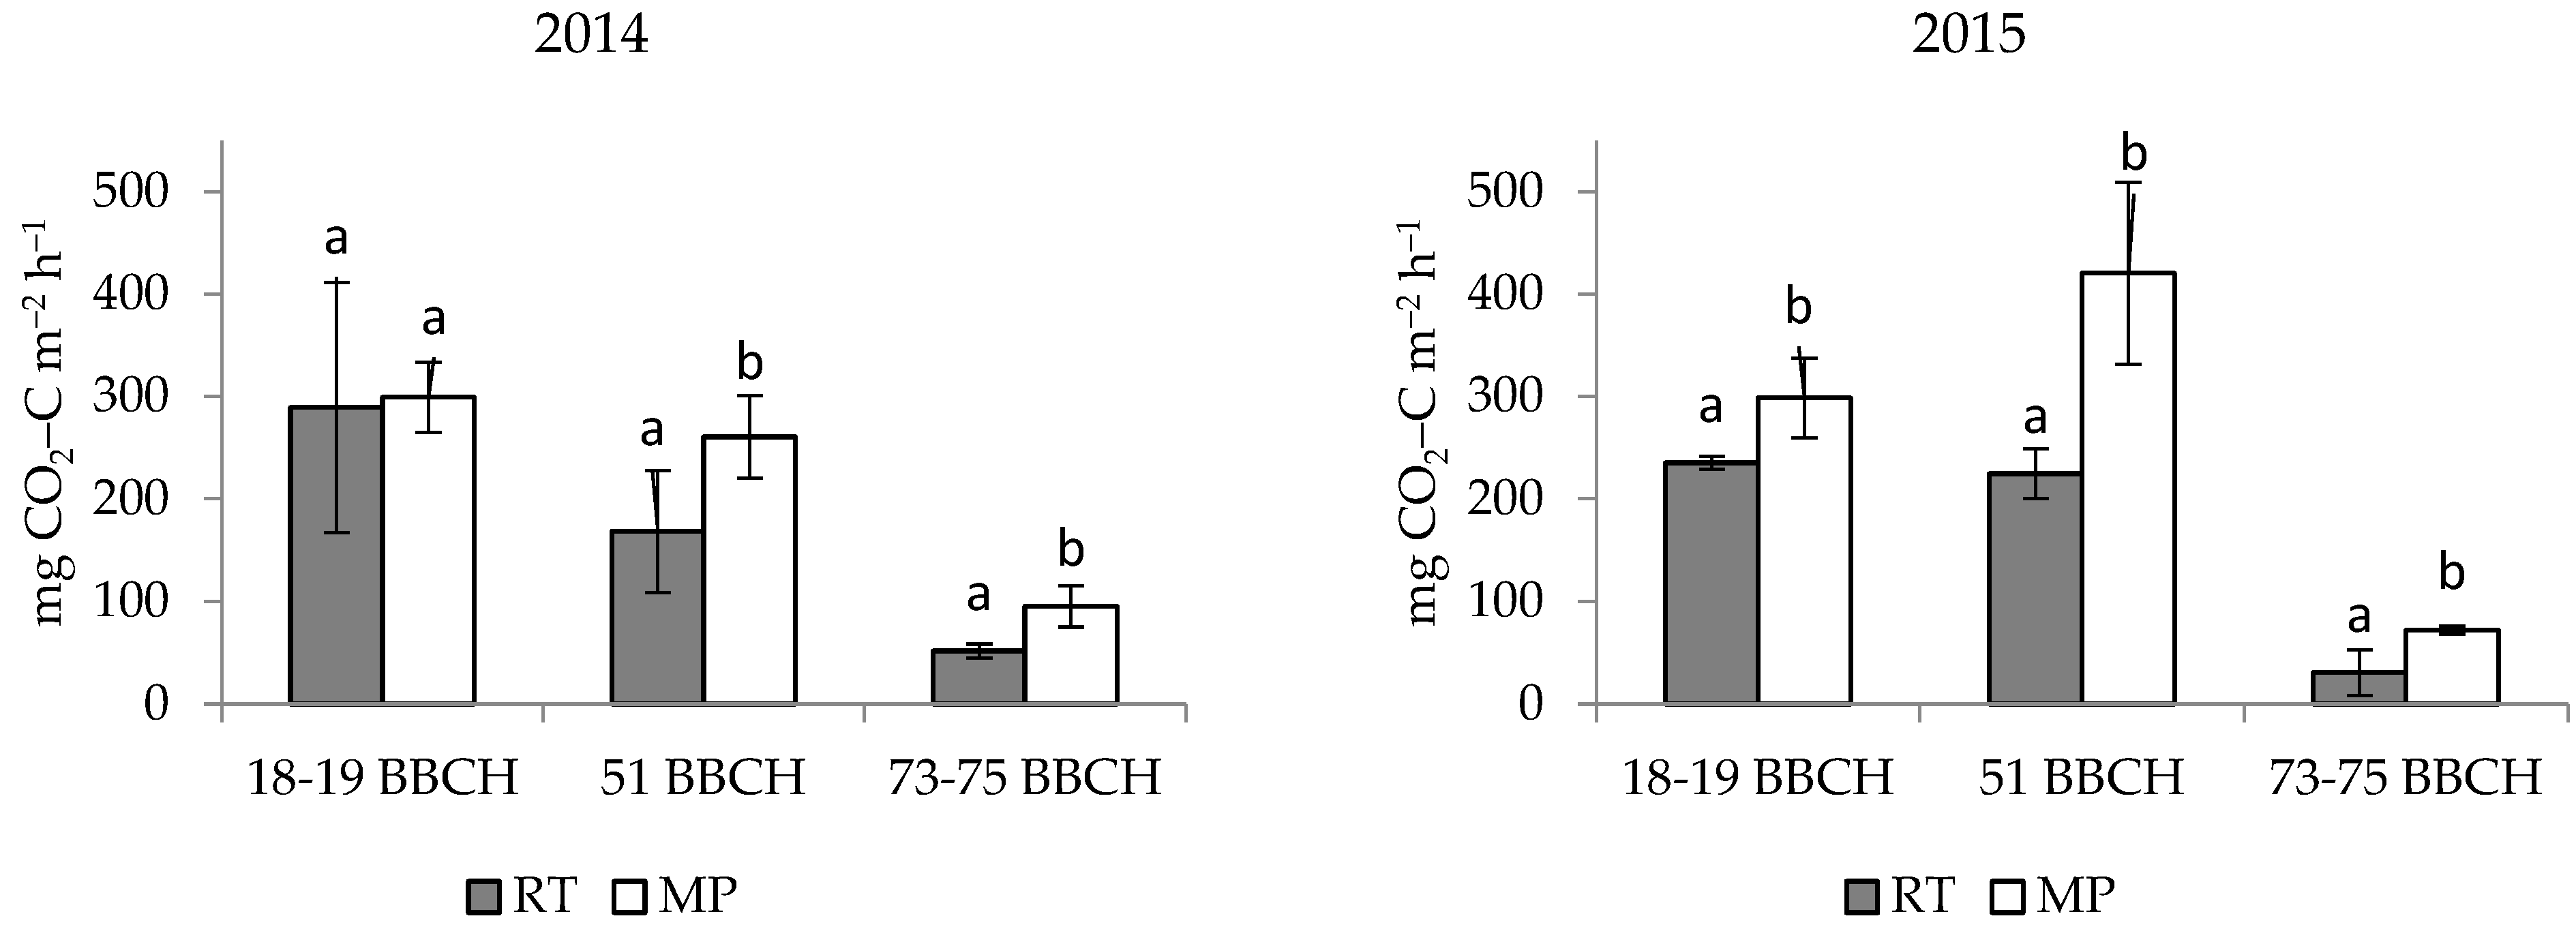
3.1. Effect of the Tillage Systems

Regardless of the soil tillage system, CO2 soil fluxes were mainly greater on the first test day (18–19 BBCH maize development stage) than on the other two test days (51 BBCH and 73–75 BBCH) (Figure 3). Only in the extremely dry year (2015) in the MP system was CO2 soil flux on the second test day (51 BBCH) greater than on the first and third test days (18–19 BBCH and 73–75 BBCH, respectively). Soil CO2 fluxes were positively correlated with the soil CO2 concentration [45]. The obtained results confirmed that under the climatic conditions of Poland, the most CO2 is produced and emitted from the soil at the stage of intensive growth of maize (18–19 BBCH) and during the panicle emergence stage of maize [46]. In both years, on all test dates in the short-term field experiment in Baborówko, CO2 soil fluxes in the RT system were primarily approximately 26.9–84.1% lower than in the MP system of corn cultivation. The effect of reducing soil CO2 emissions in the RT system was also received by Buragiené et al. [47] under the climatic conditions of central Lithuania. Depending on the method of soil tillage (deep and shallow ploughing and deep and shallow cultivation) and the test date, this reduction ranged between 7.9 and 198.8%. The high efficiency of mitigating soil CO2 emissions in the no-tillage system (62–118%) was obtained by Sanju et al. [48]. In our study, only in 2014 on the first test day (at 18–19 BBCH maize development stage) was the amount of CO2 released from the soil in both soil tillage systems similar. In an extremely dry year (2015) during the period of intensive maize growth (18–19 BBCH), i.e., 8–9 maize leaves, the differences in the amount of CO2 soil fluxes between the tested tillage systems were smaller than on the other test days. Although the amount of CO2 released from the soil on the last test day (at 73–75 BBCH maize development stage) was the smallest in both years of the study, the differences registered in the two maize cropping systems were the largest, reaching approximately 84.1% and 135.3% in the normal (2014) and extremely dry (2015) years, respectively. On average, the differences in the amount of CO2 released from the soil between the studied tillage systems during the growing season with a normal weather system (2014) and in an extremely dry year (2015) reached approximately 28.7% and 61.2%, respectively. The extent of CO2 reduction in the year with a typical weather pattern (2014) was thus close to the average level (29%) determined in a meta-analysis of sandy soil data by Abdalla et al. [32]. Average soil CO2 emissions in the RT system in both years of the study (2014 and 2015) were similar (169.75 and 163.6 mg CO2-C m−2 h−1, respectively) (Table 2). Greater soil aeration under increasing drought conditions likely increased gas diffusivity in the soil and may have been the reason for the increase in CO2 soil fluxes in the MP soil tillage system (263.7 mg CO2-C m−2 h−1), (Table 2). According to Chen [49], in the soil profile, the CO2 concentration is higher in the deeper soil layer than on top of it. Different results from the study were obtained by Bogužas et al. [50] in a long-term experiment on soil with a texture of Loam under the climate conditions of Lithuania. Soil CO2 emissions were lower in the dry year than in the wet year. In addition, in the wet year, there were no significant differences in soil CO2 emissions between the different tillage systems [50].

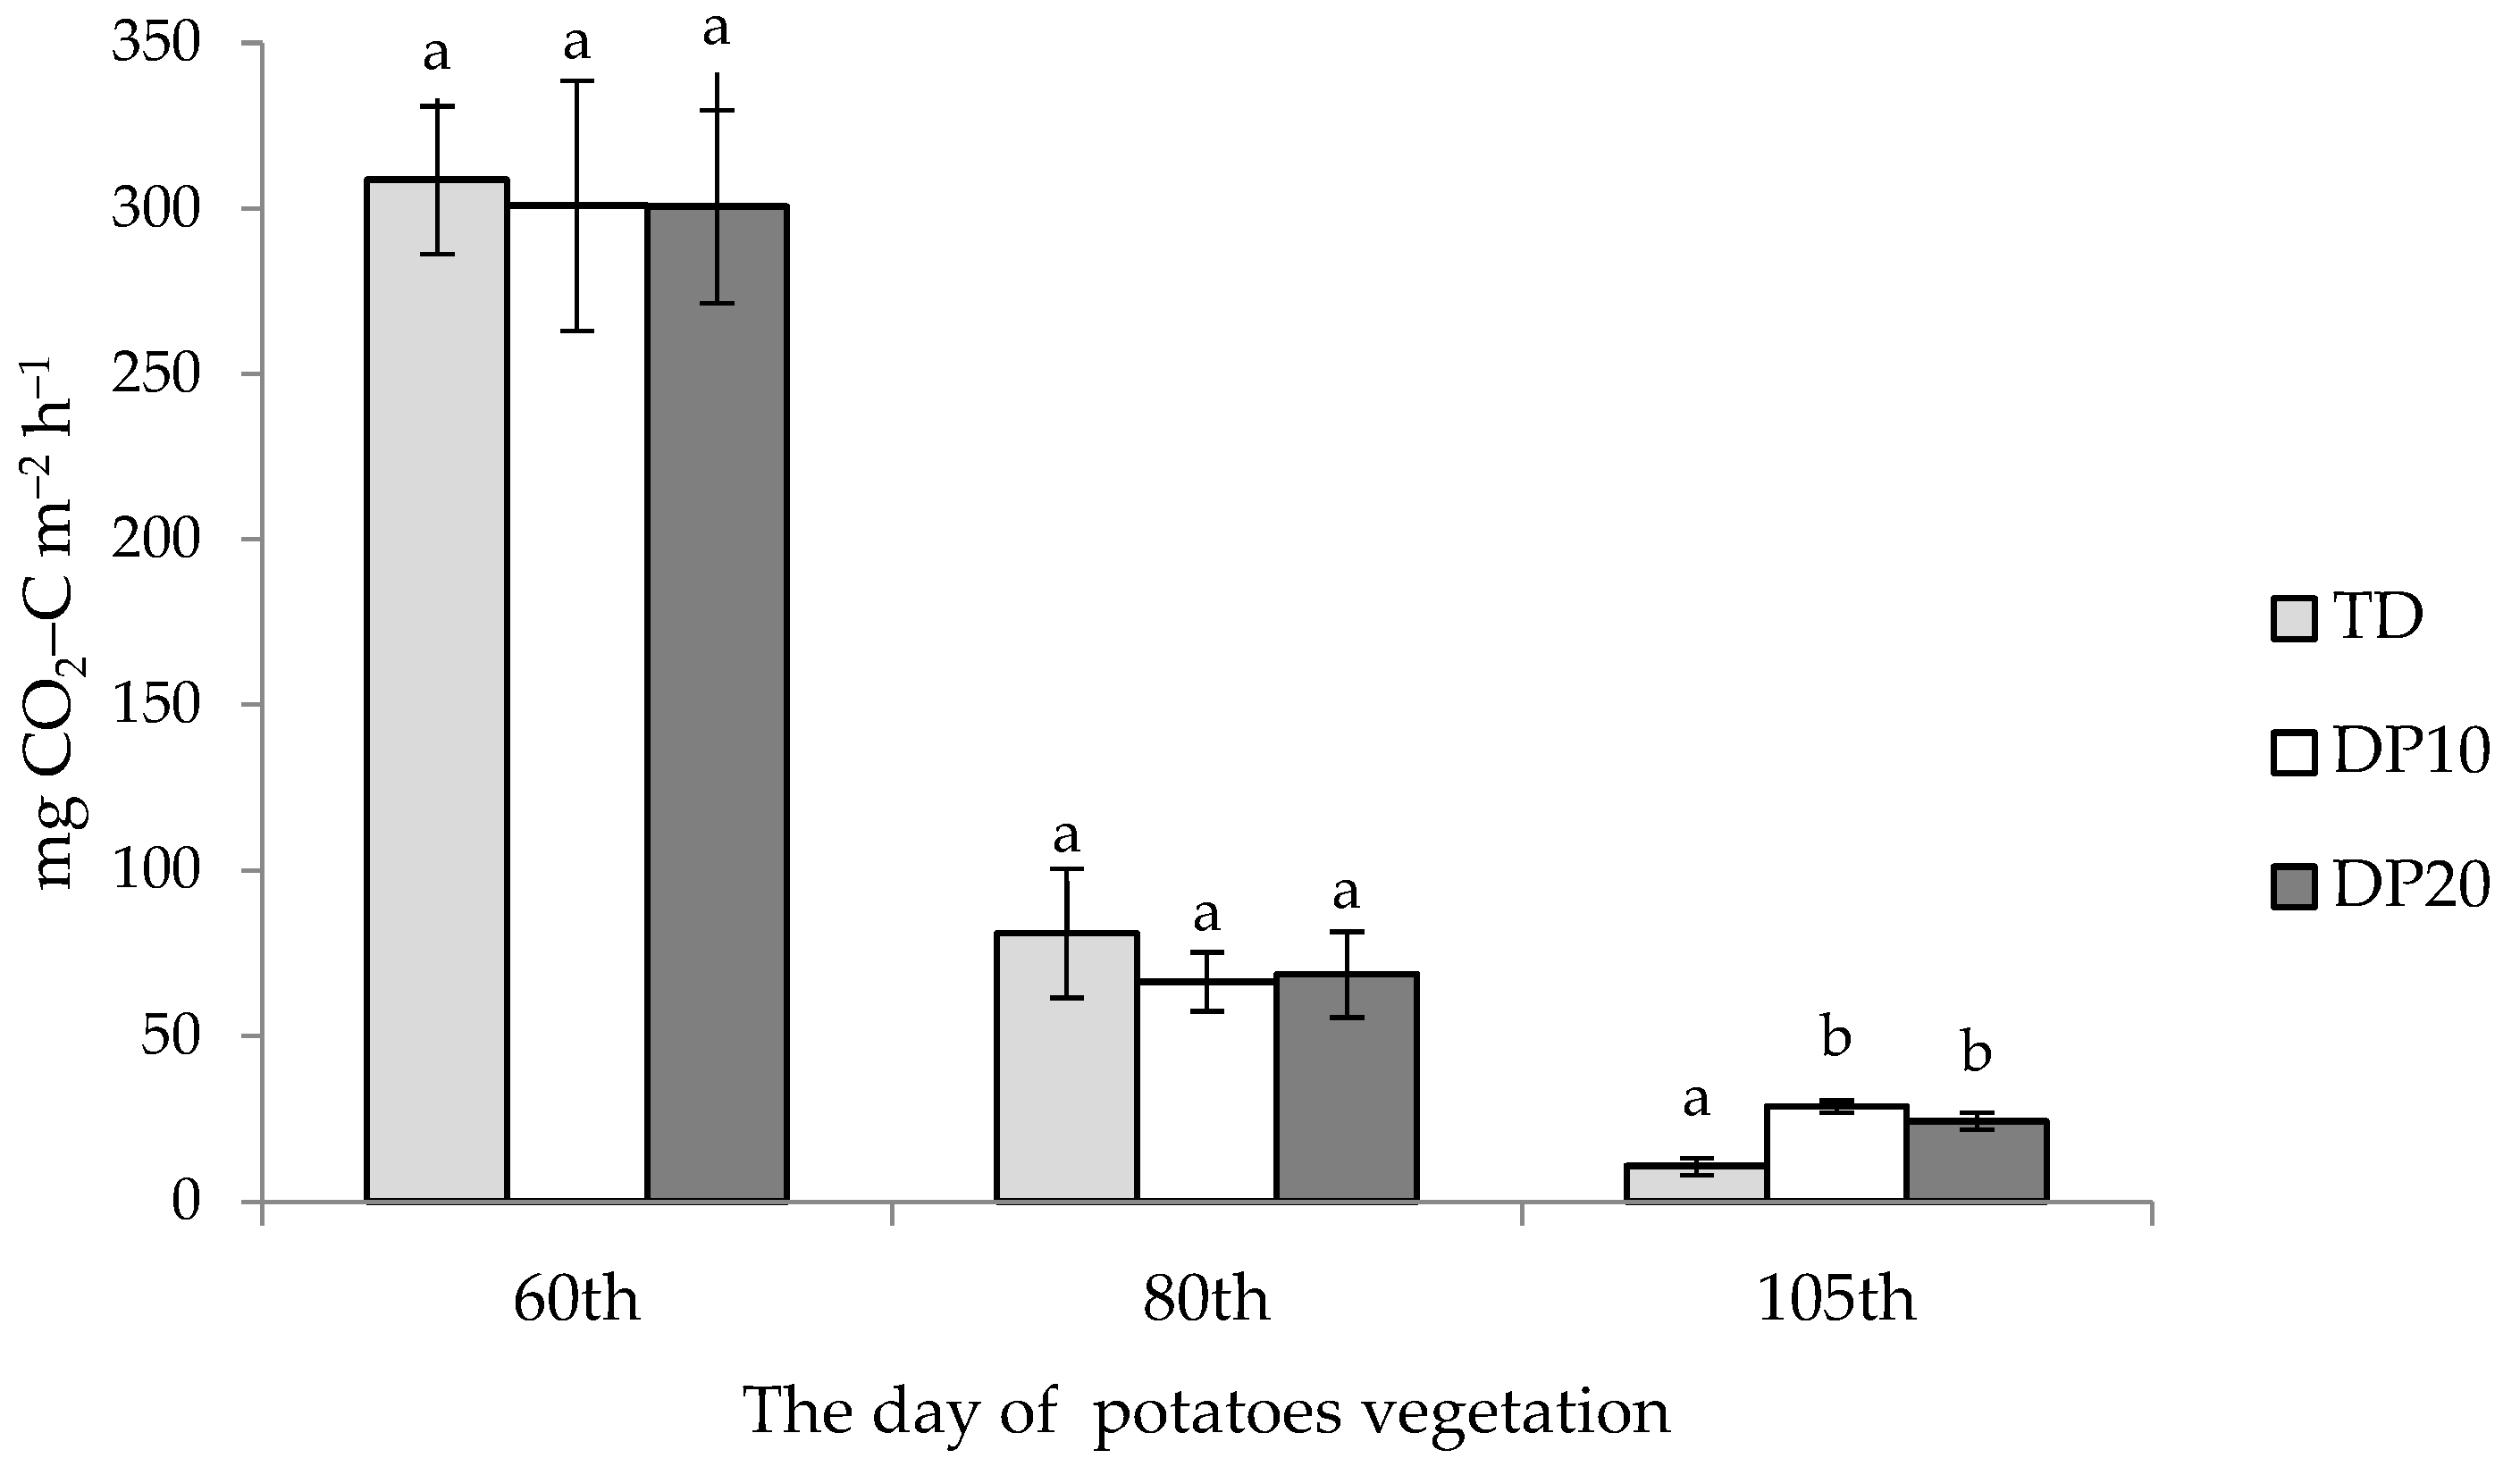
3.2. Effect of Fertilizer Placement

The results of the farm field experiment with potatoes indicate that the fertilizer application method (TD, DP10, and DP20) did not affect the amount of CO2 emissions from the soil in an extremely dry year (Figure 4, Table 2). The data obtained correspond with the results of studies on the effect of deep fertilizer placement on heterotrophic soil respiration under conditions of optimal soil moisture [34]. Therefore, improving fertilizer placement should not be considered a practice for mitigating CO2 emissions from sandy soils, especially when the effects of climate change intensify.
The results showed significant differences in CO2 emissions from the soil on successive test days (Figure 4). Regardless of the method of fertilization, the most CO2 in potato cultivation was emitted on the first test day (at the beginning of the tuber-filling stage of potato development). Adviento-Borbe et al. [51] reported that intense CO2 emissions from cultivated soils occur during intensive plant growth. On the second test day, at the end of the tuber-filling stage (80th day of potato vegetation), when biomass accumulation by potatoes was already limited, CO2 emissions from the tested soils were approximately 3.8–4.6 times lower than at the beginning of the tuber-filling stage of potatoes’ development (60th day of potato vegetation). The amount of CO2 released from the soil in the TD fertilization system on the third test day—the 105th day of potato vegetation (at the maturation potato stage)—was approximately 28 times lower than that recorded at the beginning of the tuber-filling stage. On the last test day, the amount of CO2 released from the soil under TD, DP10, and DP20 treatments was approximately 28, 10.4, and 12.5 times lower than that at the beginning of the tuber-filling stage, respectively. The sharp reduction in soil CO2 release under potatoes may have been due to the increasing soil water deficit and its impact on autotrophic and heterotrophic soil respiration. Amos et al. [52] stated that CO2 soil flux decreases when plants reach physiological maturity and senescence due to the absence of root respiration. The significant contribution of CO2 released by plant roots derived from their secretions is indicated in the study by Adviento-Borbe et al. [51].

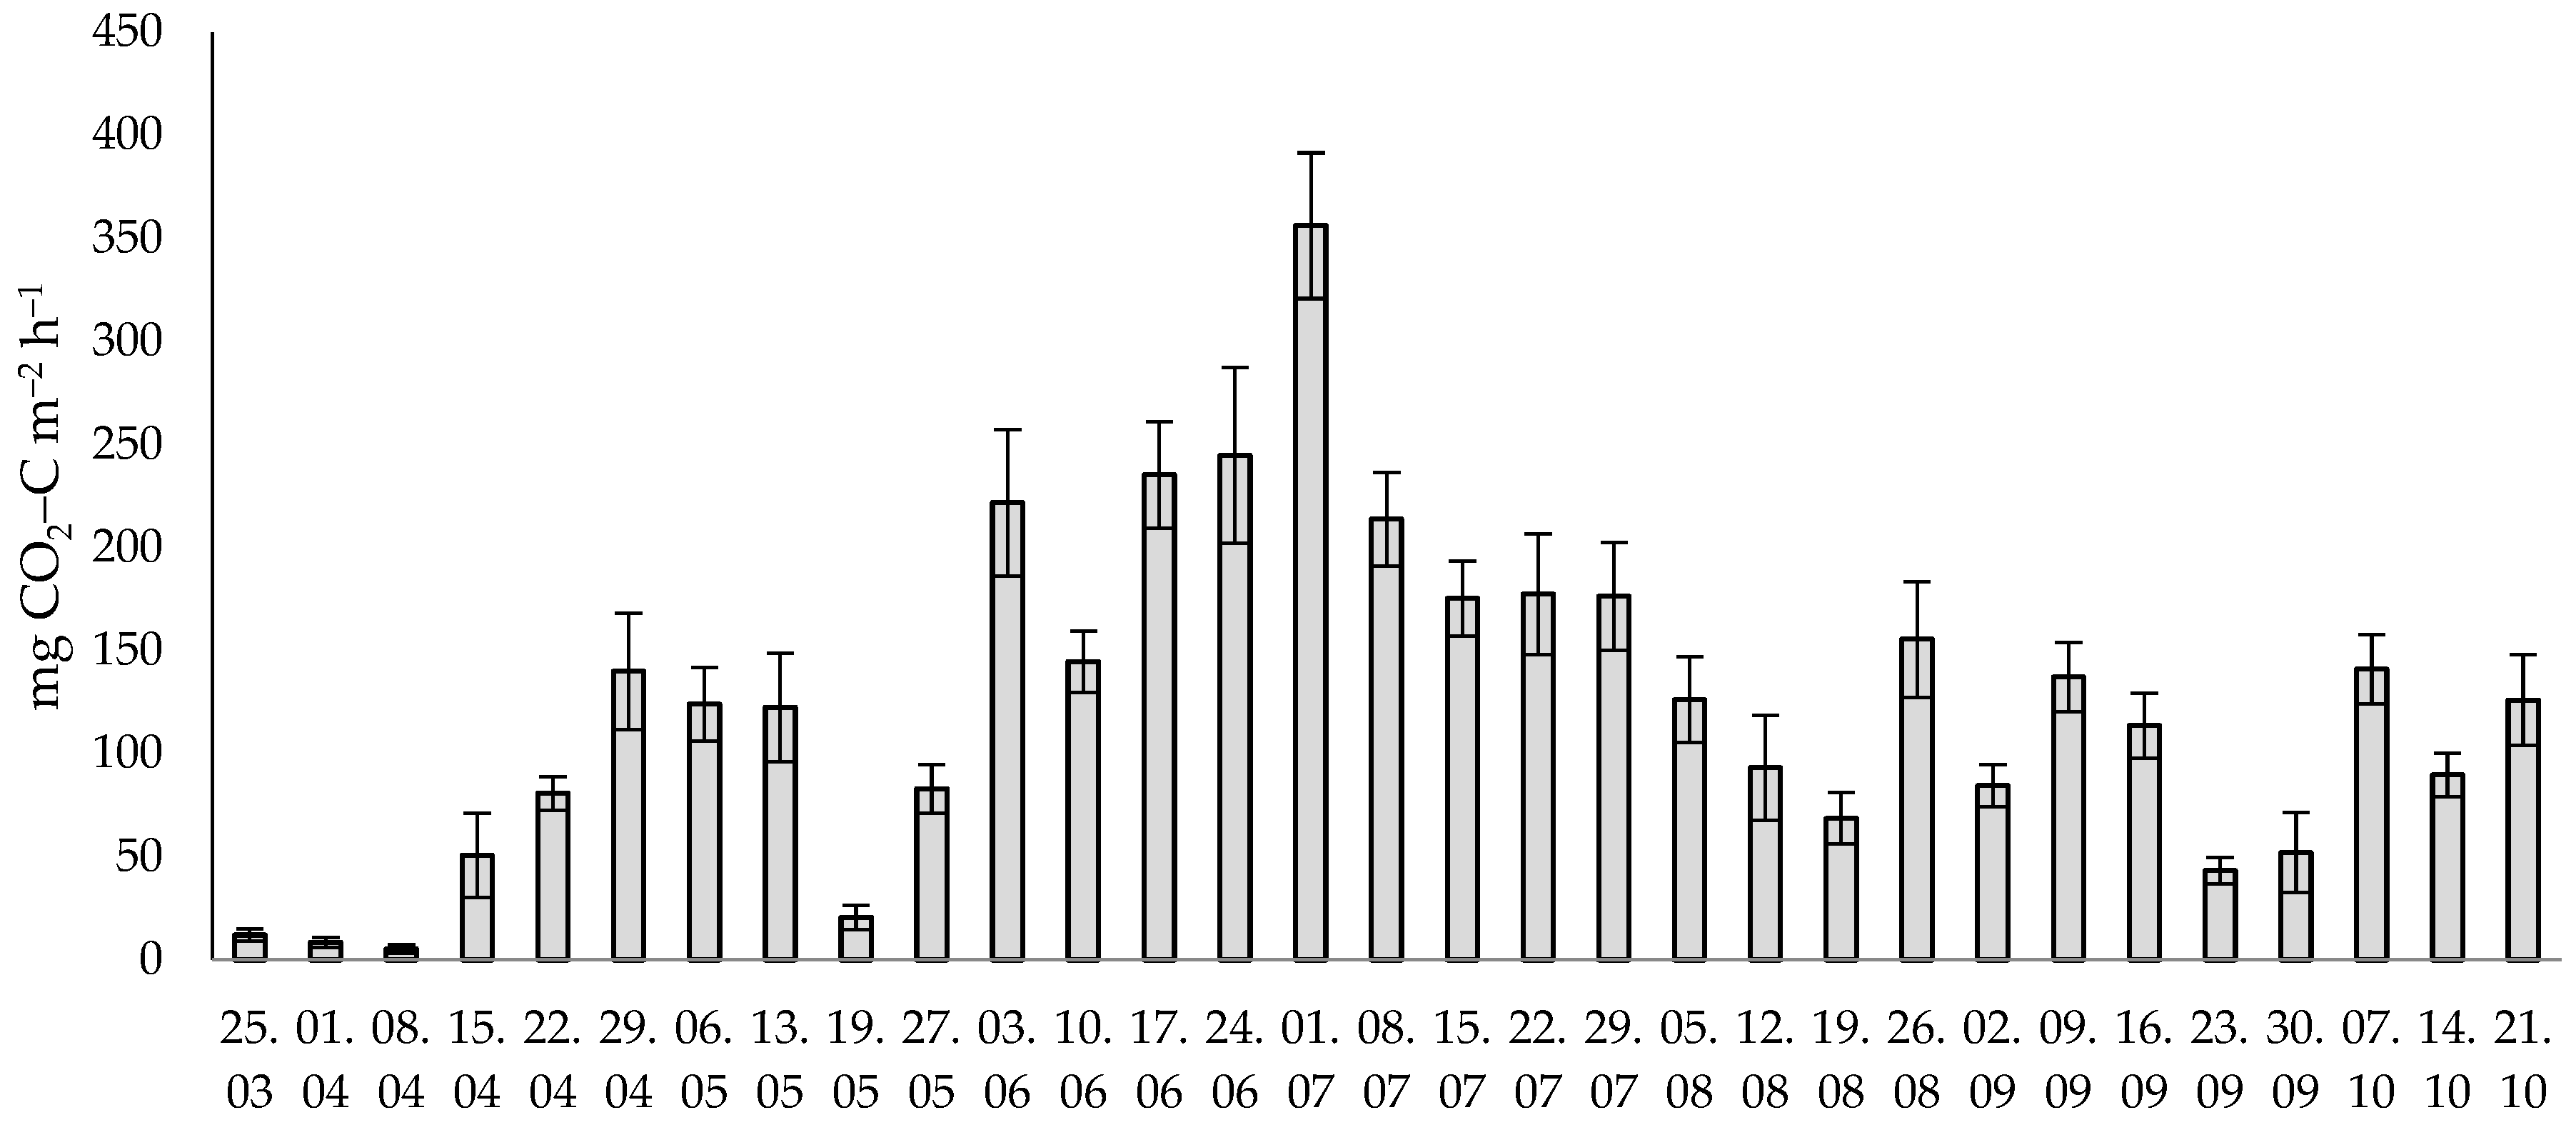
3.3. Prediction of Soil Afforestation Effect

The daily soil CO2 flux from a pine forest in Scotland averaged 123.36 mg CO2-C m−2 h−1 (Table 2) and showed very high variability during the growing season (3.44–405.47 mg CO2-C m−2 h−1) (Figure 5). According to Fang et al. [53], it was a typical range of soil CO2 flux for coniferous forest soil. Similar soil CO2-C emissions for a pine forest in Finland were also obtained by Pumpanen et al. [54]. However, Grüning et al. [55] showed lower CO2-C emissions from soil under Scots pine stands. Wu et al. [56] reported that in a Eurasian cold-temperate coniferous forest, soil CO2-C emissions ranged from 2.2 to 177.5 mg CO2-C m−2 h−1. Soil CO2 fluxes recorded in late March and early April were very low (Figure 5). From mid-April, soil CO2 fluxes began to increase, and by early July, they were very high. Moreover, Wu et al. [56] and Davidson et al. [57] showed peak CO2 emissions in the summer months. Fang et al. [53] described soil moisture as an essential factor in CO2 flux from forest soil. Analysis of the meteorological data (Table 1) indicated that CO2 flux gradually decreased during the drought, which occurred in August. According to Muhr et al. [58], drought generally reduced CO2 flux from forest soils, but the intensity of rewetting had no significant effect on CO2 flux. Therefore, the length of the drought period is more important for CO2 flux than wet periods. Higher soil CO2 flux was observed until mid-September. After the decline in late September, higher soil CO2 flux was observed in October. Litter decomposition contributes up to 30% of CO2 emissions from soil in temperate-zone forests [59]. This suggests that the observed soil CO2 fluxes may have been formed mainly by autotrophic soil respiration.
Our previous work analyzed CO2 emissions from arable soil in the same location (Mikanów) [46]. Previously performed studies showed that CO2 fluxes from arable soil under maize reached 84.58 mg CO2-C m−2 h−1 with fluctuations ranging from 3.63 to 302.31 mg CO2-C m−2 h−1 during the growing period. That indicates that under the same weather conditions, approximately 45.9% more CO2 was released from Scots pine stand soil than from arable soil under corn cultivation. This means that the effectiveness of reducing CO2 emissions from the soil by afforestation of low-productivity sandy soils may depend more on the amount of CO2 photosynthetically absorbed by tree stands than soil respiration in dry years. Luyssaert et al. [36] estimated the average net primary production (NPP) for EU-25 forests, which expresses the difference between the amount of CO2 taken during photosynthesis and the amount of CO2 released by plants during respiration, is 520 ± 75 g C m−2 yr−1. Bolinder et al. [60] showed much lower values of NPP (<350 g C m−2 yr−1) for boreal forests in Alberta, Saskatchewan, and Manitoba (Canada). However, in all locations, the NPPs calculated for forests were smaller than for annual arable crops. According to Zhou et al. [61], if soil respiration and plant photosynthetic CO2 accumulation are similar, old-growth forests can still sequester carbon. Recent results of research by Rodtassana et al. [62] showed that the soil respiration of tropical forests in Southeast Asia is a major source of CO2 emissions from terrestrial ecosystems and could have a major impact on the global carbon balance and climate change. The results of these studies indicate that the amount of CO2 released from tropical forest soils is greater in older than younger forest stages and periods. In these studies, an increase in soil temperature resulted in an increase in soil respiration only in older stands. According to Yang et al. [63], environmental variables and litterfall production together explain 82.0%, 86.8%, 42.9%, and 34.7% variations of monthly fluxes of total soil respiration, autotrophic respiration, heterotrophic respiration, and litter respiration of tropical forests, respectively. The ratio of autotrophic respiration and total soil respiration increased with soil temperature, but the opposite was true for heterotrophic respiration and total soil respiration and litter respiration and total soil respiration.

4. Conclusions

Among the analyzed practices for mitigating CO2 emissions from arable sandy soils in Central and Eastern Europe, the most effective is the reduced tillage plant cultivation system. In years with normal weather patterns, the efficiency of CO2 emission reduction in the reduced tillage system of sandy soils is 28.7% compared with CO2 soil emissions under the moldboard plow system. In dry years, on the other hand, the efficiency of this mitigation practice can be up to twice as high. In dry years, reducing CO2 emissions from sandy soils is not possible as an effect of fertilizer deep placement. CO2 emissions from forest sandy soils in dry years are greater than from arable soils.

Author Contributions

Conceptualization, T.S. and T.J.; methodology, T.S., T.J. and T.N.; validation, M.S.; formal analysis, M.S.; investigation, T.S., T.N. and T.J.; data curation, T.S.; writing—original draft preparation, T.S.; writing—review and editing, T.N., T.J. and M.S.; visualization, M.S.; supervision, M.S.; project administration, T.J. and T.S. All authors have read and agreed to the published version of the manuscript.

Funding

This work was supported by The National Centre for Research and Development—Poland (NCRD) [grant number PBS1/B8/4/2012], and the National Science Centre, Poland [grant number NN 305 060640].

Institutional Review Board Statement

Not applicable.

Informed Consent Statement

Not applicable.

Data Availability Statement

The data described in this study are available on request from the corresponding author.

Acknowledgments

Special thanks to the Staff of the Experimental Station in Baborówko, which belongs to the Institute of Soil Science and Plant Cultivation State Research Institute in Pulawy, and mgr Grzegorz Niedziński—the Klukówka Zarzeczna farm owner—for professional support for the conducted research.

Conflicts of Interest

The authors declare no conflict of interest.

References

  1. European Commission. Communication from The Commission to The European Parliament, The European Council, The Council, The European Economic And Social Committee, And The Committee of The Regions. The European Green Deal. Brussels, 11.12.2019 COM(2019) 640 final. p. 24. Available online: https://eur-lex.europa.eu/resource.html?uri=cellar:b828d165-1c22-11ea-8c1f-01aa75ed71a1.0002.02/DOC_1&format=PDF (accessed on 31 July 2022).
  2. IPCC. Summary for Policymakers. In Climate Change 2021: The Physical Science Basis; The Working Group I Contribution to the Sixth Assessment Report Addresses the Most up-to-Date Physical Understanding of the Climate System and Climate Change, Bringing Together the Latest Advances in Climate Science. Available online: https://www.ipcc.ch/report/sixth-assessment-report-working-group-i (accessed on 31 July 2022).
  3. FAO. FAOSTAT Analytical Brief 18. Emissions due to Agriculture. Global, Regional, and Country Trends 2000–2018. 2021. Available online: https://www.fao.org/3/cb3808en/cb3808en.pdf (accessed on 31 July 2022).
  4. Sanz-Cobena, A.; Lassaletta, L.; Aguilera, E.; del Prado, A.; Garnier, J.; Billen, G.; Iglesias, A.; Sánchez, B.; Guardia, G.; Abalos, D.; et al. Strategies for greenhouse gas emissions mitigation in Mediterranean agriculture: A review. Agric. Ecosyst. Environ. 2017, 238, 5–24. [Google Scholar] [CrossRef] [Green Version]
  5. Panchasara, H.; Samrat, N.; Islam, N. Greenhouse Gas Emissions Trends and Mitigation Measures in Australian Agriculture Sector—A Review. Agriculture 2021, 11, 85. [Google Scholar] [CrossRef]
  6. Ren, F.; Zhang, X.; Liu, J.; Sun, N.; Wu, L.; Li, Z.; Xu, M. A synthetic analysis of greenhouse gas emissions from manure amended agricultural soils in China. Sci. Rep. 2017, 7, 8123. [Google Scholar] [CrossRef]
  7. Mohammed, S.; Mirzaei, M.; Pappné Törő, Á.; Anari, M.G.; Moghiseh, E.; Asadi, H.; Szabó, S.; Kakuszi-Széles, A.; Harsányi, E. Soil carbon dioxide emissions from maize (Zea mays L.) fields as influenced by tillage management and climate. Irrig. Drain. 2021, 71, 228–240. [Google Scholar] [CrossRef]
  8. Reicosky, D. Tillage-induced CO2 emission from soil. Nutr. Cycl. Agroecosystems 1997, 49, 273–285. [Google Scholar] [CrossRef]
  9. Krasowicz, S.; Oleszek, W.; Horabik, J.; Dębicki, R.; Jankowiak, J.; Stuczyński, T.; Jadczyszyn, J. Rational management of the soil environment in Poland. Pol. J. Agron. 2011, 7, 43–58. [Google Scholar]
  10. Król, A.; Żyłkwski, T.; Kozyra, J.; Książak, J. Soil moisture under no-tillage and tillage systems in maize long-term experiment. Pol. J. Soil Sci. 2018, 51, 103–117. [Google Scholar] [CrossRef] [Green Version]
  11. Sosulski, T.; Korc, M. Effects of different mineral and organic fertilization on the content of nitrogen and carbon in soil organic matter fractions. Ecol. Chem. Eng. 2011, 18, 601–609. [Google Scholar]
  12. Ochal, P.; Jadczyszyn, T.; Jurga, B.; Kopiński, J.; Matyka, M.; Madej, A.; Rutkowska, A.; Smreczak, B.; Łysiak, M. Środowiskowe Aspekty Zakwaszenia Gleb w Polsce; Institute of Soil Science and Plant Cultivation State Research Institute: Puławy, Poland, 2017; p. 43. (In Polish) [Google Scholar]
  13. Körschens, M. The importance of long-term field experiments for soil science and environmental research—A review. Plant. Soil Environ. 2006, 52, 1–8. [Google Scholar]
  14. Ballabio, C.; Panagos, P.; Monatanarella, L. Mapping topsoil physical properties at European scale using the LUCAS database. Geoderma 2016, 261, 110–123. [Google Scholar] [CrossRef]
  15. Lasy w Polsce. Centrum Informacyjne Lasów Państwowych. Dyrekcja Generalna Lasów Państwowych. 2012; p. 55. Available online: https://www.lasy.gov.pl/pl/informacje/publikacje/do-poczytania/lasy-w-polsce-1/lasy-w-polsce-2012/ (accessed on 31 July 2022). (In Polish)
  16. de Castro, P.; Miglietta, P.P.; Vecchio, Y. The Common Agricultural Policy 2021–2027: A new history for European agriculture. Ital. Rev. Agric. Econ. 2020, 75, 5–12. [Google Scholar]
  17. Doroszewski, A.; Jadczyszyn, J.; Kozyra, J.; Pudełko, R.; Stuczyński, T.; Mizak, K.; Łopatka, A.; Koza, P.; Górski, T.; Wróblewska, E. Fundamentals of the agricultural drought monitoring system. Water Environ. Rural. Areas. 2012, 12, 77–91. (In Polish) [Google Scholar]
  18. SMSR IUNG PIB. 2012. Available online: https://susza.iung.pulawy.pl/kbw (accessed on 31 July 2022).
  19. Adamiak, M. Informacja o Wynikach Kontroli. Pomoc Rolnikom Poszkodowanym w Wyniku Suszy. NIK. KRR.430.008,2021. Nr ewid.163/2021/P/21/048/KRR. 2022; p. 85. Available online: https://www.google.com.hk/url?sa=t&rct=j&q=&esrc=s&source=web&cd=&ved=2ahUKEwj5q7a7v-b7AhU2gVYBHdcqBNwQFnoECA4QAQ&url=https%3A%2F%2Fwww.nik.gov.pl%2Fkontrole%2Fwyniki-kontroli-nik%2Fpobierz%2Ckrr~p_21_048_202111180815061637219706~01%2Ctyp%2Ckk.pdf&usg=AOvVaw3PJ2hQnC3BRPajetQRgtxL (accessed on 31 July 2022). (In Polish)
  20. Abęcki, L. Foreseen climate changes and irrigation development in Poland. Infrastruct. Ecol. Rural. Areas. 2009, 3, 7–18. [Google Scholar]
  21. Wirtschafts Woche. Dürrehilfe: Knapp 292 Millionen Euro an Bauern Ausgezahlt. 2020. Available online: https://www.wiwo.de/unternehmen/handel/landwirtschaft-duerrehilfe-knapp-292-millionen-euro-an-bauern-ausgezahlt/25549774.html (accessed on 31 July 2022). (In German).
  22. Sosulski, T.; Szymańska, M.; Szara, E. Assessment of various practices of the mitigation of N2O emissions from the arable soils of Poland. Soil Sci. Annu. 2017, 68, 55–64. [Google Scholar] [CrossRef]
  23. Zhang, X.; Xin, X.; Yang, W.; Ding, S.; Ren, G.; Li, M.; Zhu, A. Soil respiration and net carbon flux response to long-term reduced/no-tillage with and without residues in a wheat-maize cropping system. Soil Tillage Res. 2021, 214, 105182. [Google Scholar] [CrossRef]
  24. Oorts, K.; Merckx, R.; Gréhan, E.; Labreuche, J.; Nicolardot, B. Determinants of annual fluxes of CO2 and N2O in long-term no-tillage and conventional tillage systems in northern France. Soil Tillage Res. 2007, 95, 133–148. [Google Scholar] [CrossRef]
  25. Jia, S.; Liang, A.; Zhang, S.; Chen, X.; McLaughlin, N.B.; Sun, B.; Zhang, X.; Wu, D. Effect of tillage system on soil CO2 flux, soil microbial community and maize (Zea mays L.) yield. Geoderma 2021, 384, 114813. [Google Scholar] [CrossRef]
  26. Du, K.; Li, F.; Leng, P.; Li, Z.; Tian, C.; Qiao, Y.; Li, Z. Differential Influence of no-tillage and precipitation pulses on soil het-erotrophic and autotrophic respiration of summer maize in the North China Plain. Agronomy 2020, 10, 2004. [Google Scholar] [CrossRef]
  27. Flessa, H.; Ludwig, B.; Heil, B.; Merbach, W. The Origin of Soil Organic C, Dissolved Organic C and Respiration in a Long-Term Maize Experiment in Halle, Germany, Determined by13C Natural Abundance. J. Plant. Nutr. Soil Sci. 2000, 163, 157–163. [Google Scholar] [CrossRef]
  28. Li, Z.; Zhang, Q.; Qiao, Y.; Du, K.; Li, Z.; Tian, C.; Zhu, N.; Leng, P.; Yue, Z.; Cheng, H.; et al. Evaluation of no-tillage impacts on soil respiration by 13C-isotopic signature in North China Plain. Sci. Total Environ. 2022, 824, 153852. [Google Scholar] [CrossRef]
  29. Shakoor, A.; Shahbaz, M.; Farooq, T.H.; Sahar, N.E.; Shahzad, S.M.; Altaf, M.M.; Ashraf, M. A global meta-analysis of greenhouse gases emission and crop yield under no-tillage as compared to conventional tillage. Sci. Total. Environ. 2020, 750, 142299. [Google Scholar] [CrossRef] [PubMed]
  30. Wang, H.; Wang, S.; Yu, Q.; Zhang, Y.; Wang, R.; Li, J.; Wang, X. No tillage increases soil organic carbon storage and decreases carbon dioxide emission in the crop residue-returned farming system. J. Environ. Manag. 2020, 261, 110261. [Google Scholar] [CrossRef] [PubMed]
  31. Guo, Y.; Yin, W.; Chai, Q.; Fan, Z.; Hu, F.; Fan, H.; Zhao, C.; Yu, A.; Coulter, J.A. No tillage with previous plastic covering increases water harvesting and decreases soil CO2 emissions of wheat in dry regions. Soil Tillage Res. 2020, 208, 104883. [Google Scholar] [CrossRef]
  32. Abdalla, K.; Chivenge, P.; Ciais, P.; Chaplot, V. No-tillage lessens soil CO2 emissions the most under arid and sandy soil con-ditions: Result from a meta-analysis. Biogeosci. Discuss. 2015, 12, 15495–15535. [Google Scholar]
  33. Gaihre, Y.K.; Singh, U.; Huda, A.; Islam, S.M.M.; Islam, M.R.; Biswas, J.C.; DeWald, J. Nitrogen use efficiency, crop productivity and environmental impacts of urea deep placement in lowland rice fields. In Proceedings of the 2016 International Nitrogen Initiative Conference, “Solution to Improve Nitrogen use Efficiency for the World”, Melbourne, VI, Australia, 4–8 December 2016; Volume 1, pp. 1–4. [Google Scholar]
  34. Sosulski, T.; Stępień, W.; Wąs, A.; Szymańska, M. N2O and CO2 Emissions from Bare Soil: Effect of Fertilizer Manage-ment. Agriculture 2020, 10, 602. [Google Scholar] [CrossRef]
  35. Ťupek, B.; Lehtonen, A.; Mäkipää, R.; Peltonen-Sainio, P.; Huuskonen, S.; Palosuo, T.; Heikkinen, J.; Regina, K. Extensification and afforestation of cultivated mineral soil for climate change mitigation in Finland. For. Ecol. Manag. 2021, 501, 119672. [Google Scholar] [CrossRef]
  36. Luyssaert, S.; Ciais, P.; Piao, S.L.; Schulze, E.-D.; Jung, M.; Zaehle, S.; Schelhaas, M.J.; Reichstein, M.; Churkina, G.; Papale, D.; et al. The European carbon balance. Part 3: Forests. Glob. Chang. Biol. 2010, 16, 1429–1450. [Google Scholar] [CrossRef]
  37. Jandl, R.; Lindner, M.; Vesterdal, L. How strongly can forest management influence soil C sequestration? Geoderma 2007, 137, 253–268. [Google Scholar] [CrossRef]
  38. Eurostat Statistics Explained. Available online: https://ec.europa.eu/eurostat/statistics-explained/index.php?title=Archive:Forestry_and_climate_change (accessed on 20 October 2022).
  39. Talarczyk, W.; Szulc, T.; Szczepaniak, J.; Łowński, Ł. Functional verification of unit for strip tillage, fertilization and corn sowing. J. Res. Appl. Agric. Eng. 2016, 61, 110–113. [Google Scholar]
  40. Milewski, W. Lasy w Polsce. Lasy Państwowe. Centrum Informacyjne Lasów Państwowych. Warszawa. 2012; p. 58. Available online: https://www.lasy.gov.pl/pl/informacje/publikacje/do-poczytania/lasy-w-polsce-1/lasy-w-polsce-2012/ (accessed on 31 July 2022). (In Polish)
  41. Sosulski, T.; Szara, E.; Szymańska, M.; Stępień, W.; Rutkowska, B.; Szulc, W. Soil N2O emissions under conventional tillage conditions and from forest soil. Soil Tillage Res. 2019, 190, 86–91. [Google Scholar] [CrossRef]
  42. Bickel, K.; Köhl, M.; IPCC. Default Climate and Soil Classifications. In 2006 IPCC Guidelines for National Greenhouse Gas Inventories.Ch. 3. Consistent Representation of Lands. Available online: https://www.ipcc-nggip.iges.or.jp/public/2006gl/pdf/4_Volume4/V4_03_Ch3_Representation.pdf (accessed on 30 July 2022).
  43. Institute of Meteorology and Water Management IMGW-PIB. Available online: https://www.imgw.pl. (accessed on 31 July 2022).
  44. Hutchinson, G.L.; Livingston, G.P. Use of Chamber Systems to Measure Trace Gas; Fluxes, L.A., Mosier, A.R., Duxbury, J.M., Rolston, D.E., Eds.; Agricultural Ecosystem Effects on Trace Gases and Global Climate Change; Special Publication: Madison, WI, USA, 1993; pp. 63–78. [Google Scholar]
  45. Frouz, J.; Bujalský, L. Flow of CO2 from soil may not correspond with CO2 concentration in soil. Sci. Rep. 2018, 8, 10099. [Google Scholar] [CrossRef] [PubMed] [Green Version]
  46. Sosulski, T.; Szymańska, M.; Szara, E. CO2 Emissions from Soil Under Fodder Maize Cultivation. Agronomy 2020, 10, 1087. [Google Scholar] [CrossRef]
  47. Buragiené, S.; Šaruskis, E.; Romaneckas, K.; Adamavičiené, A.; Kriaučiüniené, Z.; Zvižienyté, D.; Mazoras, V.; Naujokiené, V. Relationship between CO2 emissions and soil properties of differently tilled soils. Sci. Total Environ. 2019, 662, 786–795. [Google Scholar] [CrossRef] [PubMed]
  48. Sainju, U.; Jabro, J.D.; William, B.S. Soil carbon dioxide emissions and carbon content as affected by irrigation, tillage, cropping system and nitrogen fertilization. J. Environ. Qual. 2008, 37, 98–106. [Google Scholar] [CrossRef] [PubMed] [Green Version]
  49. Chen, Q. Characteristics of soil profile CO2 concentrations in karst areas and their significance for global carbon cycles and climate change. Earth Syst. Dyn. 2019, 10, 525–538. [Google Scholar] [CrossRef] [Green Version]
  50. Bogužas, V.; Sinkevičiene, A.; Romaneckas, K.; Steponavičiené, V.; Skinuliené, L.; Butkevičiené, L.M. The impact of tillage intensity and meteorological conditions on soil temperature, moisture content and CO2 efflux in maize and spring barley cul-tivation. Zemdirbyste 2018, 105, 307–314. [Google Scholar] [CrossRef] [Green Version]
  51. Adviento-Borbe, M.A.A.; Haddix, M.L.; Binder, D.L.; Walters, D.T.; Dobermann, A. Soil greenhouse gas fluxes and global warming potential in four high-yielding maize systems. Glob. Chang. Biol. 2007, 13, 1972–1988. [Google Scholar] [CrossRef]
  52. Amos, B.; Arkebauer, T.J.; Doran, J.W. Soil Surface Fluxes of Greenhouse Gases in an Irrigated Maize-Based Agroecosystem. Soil Sci. Soc. Am. J. 2005, 69, 387–395. [Google Scholar] [CrossRef]
  53. Fang, H.J.; Yu, G.R.; Cheng, S.L.; Zhu, T.H.; Wang, Y.S.; Yan, J.H.; Wang, M.; Cao, M.; Zhou, M. Effects of multiple environmental factors on CO2 emission and CH4 uptake from old-growth forest soils. Biogeosciences 2010, 7, 395–407. [Google Scholar] [CrossRef] [Green Version]
  54. Pumpanen, J.; Ilvesniemi, H.; Perämäki, M.; Hari, P. Seasonal patterns of soil CO2 efflux and soil air CO2 concentration in a Scots pine forest: Comparison of two chamber techniques. Glob. Chang. Biol. 2003, 9, 371–382. [Google Scholar] [CrossRef]
  55. Grüning, M.M.; Germeshausen, F.; Thies, C.; Arnold, A.I.M. Increased forest soil CO2 and N2O emissions during insect infes-tation. Forests 2018, 9, 612. [Google Scholar] [CrossRef] [Green Version]
  56. Wu, X.; Zang, S.; Ma, D.; Ren, J.; Chen, Q.; Dong, X. Emissions of CO2, CH4, and N2O Fluxes from Forest Soil in Permafrost Region of Daxing’an Mountains, Northeast China. Int. J. Environ. Res. Public Health 2019, 16, 2999. [Google Scholar] [CrossRef] [PubMed] [Green Version]
  57. Davidson, E.A.; Savage, K.E.; Trumbore, S.E.; Borken, W. Vertical partitioning of CO2 production within a temperate forest soil. Glob. Chang. Biol. 2006, 12, 944–956. [Google Scholar] [CrossRef] [Green Version]
  58. Muhr, J.; Goldberg, S.D.; Borken, W.; Gebauer, G. Repeated drying–rewetting cycles and their effects on the emission of CO2, N2O, NO, and CH4 in a forest soil. J. Plant. Nutr. Soil. Sci. 2008, 171, 719–728. [Google Scholar] [CrossRef]
  59. Leitner, S.; Sae-Tun, O.; Kranzinger, L.; Zechmeister-Boltenstern, S.; Zimmermann, M. Contribution of litter layer to soil greenhouse gas emissions in a temperate beech forest. Plant. Soil 2016, 403, 455–469. [Google Scholar] [CrossRef] [Green Version]
  60. Bolinder, M.A.; Janzen, H.H.; Gregorich, E.G.; Angers, D.A.; Vanden Bygaart, A.J. An approach for estimating net primary productivity and annual crops in Canada. Agric. Ecosyst. 2007, 118, 29–42. [Google Scholar] [CrossRef]
  61. Zhou, G.; Liu, S.; Li, Z.; Zhang, D.; Tang, X.; Zhou, C.; Yan, J.; Mo, J. Old-Growth Forests Can Accumulate Carbon in Soils. Science 2006, 314, 1417. [Google Scholar] [CrossRef] [Green Version]
  62. Rodtassana, C.; Unawong, W.; Yaemphum, S.; Chanthorn, W.; Chawchai, S.; Nathalang, A.; Brockelman, W.Y.; Tor-Ngern, P. Different responses of soil respiration to environmental factors across forest stages in a Southeast Asian forest. Ecol. Evol. 2021, 11, 15430–15443. [Google Scholar] [CrossRef]
  63. Yang, K.; Yang, Y.; Xu, Z.; Wu, Q. Soil respiration in a subtropical forest of southwestern China: Components, patterns and controls. PLoS ONE 2018, 13, e0204341. [Google Scholar] [CrossRef]
Figure 1. A fieldwork module (photo. Sosulski T.).
Agronomy 12 03102 g001
Figure 2. The farm field experiment in Kuklówka Zarzeczna (Central Poland), 50th potato growing day (photo. Niedziński T.).
Agronomy 12 03102 g002
Figure 3. Soil CO2 fluxes in RT and MP cropping systems in an optimal moisture year (2014) and a dry year (2015) in a short-term experiment in Baborówko (Western Poland). Different letters (a, b) indicate significant differences (p < 0.05) among treatments (RT, and MP) (separately for test dates).
Agronomy 12 03102 g003
Figure 4. Soil CO2 flux under the influence of TD, DP10, and DP20 fertilization in a field experiment in Kuklówka Zarzeczna (Central Poland). Different letters (a, b) indicate significant differences (p < 0.05) among treatments (TD, DP10, and DP20) (separately for test dates).
Agronomy 12 03102 g004
Figure 5. Soil CO2 fluxes under a pine stand in Mikanów during the dry growing season (2012).
Agronomy 12 03102 g005
Table 1. Cumulative precipitation (mm) and average monthly air temperature (°C) during 2012, 2014, and 2015 growing seasons at the Grabów and Baborówko Experimental Stations and at the Kuklówka Zarzeczna farm field experiment and the Mikanów Scots pine stand.
LocationYear of InvestigationAprilMayJunJulyAugustSeptemberOctoberGrowing Period
mm°Cmm°Cmm°Cmm°Cmm°Cmm°Cmm°Cmm°C
Western PolandBaborówko201446.810.467.913.430.016.151.621.591.617.529.514.935.310.5352.714.9
201516.38.526.812.741.315.971.319.212.822.320.114.521.67.6210.214.4
Central PolandKuklówka Zarzeczna201545.87.551.213.016.116.364.018.86.421.137.214.144.56.4265.213.7
Mikanów201241.79.445,415.610.317.356.021.10.019.028.514.748.38.2230.115.0
Table 2. The average soil CO2 flux (mg CO2-C m−2 h−1) during the growing season under the influence of different tillage systems, mineral fertilization methods, and permanent forest.
Meteorological ConditionsLocationTreatmentmg CO2-C m−2 h−1
MeanMedian
NormalBaborówkoRT169.7 ± 118.7168.4
MP218.4 ± 108.4260.6
Extremely dryRT163.6 ± 115.2224.9
MP263.7 ± 176.6298.6
Extremaly dryKuklówka ZarzecznaTD133.7 ± 155.881.0
DP10132.0 ± 147.566.0
DP20131.0 ± 148.169.0
DryMikanówForest123.3 ± 79.079.0
Publisher’s Note: MDPI stays neutral with regard to jurisdictional claims in published maps and institutional affiliations.

