Article

Experimental Study of a 4HLB-4 Half-Feed Four-Row Peanut Combine Harvester

1
Linshu Dongtai Machinery Co., Ltd., Linyi 276700, China
2
Nanjing Institute of Agricultural Mechanization, Ministry of Agriculture and Rural Affairs, Nanjing 210014, China
3
Agricultural Integrated Service Center, Daxing Town, Linshu County, Linyi 276700, China
*
Author to whom correspondence should be addressed.
These authors contributed equally to this work.
Agronomy 2022, 12(12), 3094; https://doi.org/10.3390/agronomy12123094
Submission received: 13 November 2022 / Revised: 3 December 2022 / Accepted: 4 December 2022 / Published: 7 December 2022

Abstract

:
In order to improve the operational performance of the self-developed 4HLB-4 half-feed four-row peanut combine harvester, single-factor and multifactor field tests were conducted on key operational parameters affecting the quality of harvesting. The response surface methodology was used to study the effects of the forward speed, clamping height, peanut picking roller rotational speed, and cleaning sieve vibrational frequency on the loss rate and impurity rate. A response surface regression model of the loss rate and impurity rate was constructed. A multi-objective integrated optimization was carried out for each factor. The results showed that, in terms of the order of significance, the influence of each factor on the impurity rate was as follows: cleaning sieve vibrational frequency > clamping height > forward speed > peanut picking roller rotational speed. The order of significance of the influence of each factor on the loss rate was as follows: peanut picking roller rotational speed > forward speed > clamping height > cleaning sieve vibrational frequency. The optimal combination of parameters was a forward speed of 0.85 m/s, clamping height of 190 mm, peanut picking roller rotational speed of 550 rpm, and cleaning sieve vibrational frequency of 590 cpm. Under these conditions, the impurity rate of 2.62% and the loss rate of 2.05% were obtained, which effectively reduced the impurity rate and loss rate and met the quality requirements of Chinese peanut mechanized harvesting operations. The results of this study can provide a basis for the improvement and optimization of the 4HLB-4 half-feed four-row peanut combine harvester and the optimization of its operating parameters.

1. Introduction

Harvesting is the main operational aspect of peanut production, with many complex processes and a high labor intensity. Mechanized harvesting is a key technology used to improve peanut production efficiency and increase revenue [1]. Semi-feed combined harvesting is one of the main technologies used to achieve mechanized peanut harvesting, which is the most integrated peanut mechanized harvesting technology at present. The United States, Argentina, Brazil, and other countries with a high peanut planting concentration and large-unit planting scale all use large machinery for two-stage harvesting and no products or applications related to semi-feed combined harvesting technology [2,3]. In China, in recent years, many domestic scientific research units, universities, and production enterprises involved in key peanut-harvesting technologies and equipment have engaged in the research, development, and production of a variety of peanut-harvesting machines in the main peanut production areas, demonstrating the application and formation of a series of products. Among them, Professor Shuqi Shang of Qingdao Agricultural University and the R&D team developed the improved 4HBL-2-type peanut combine harvester [4,5,6]. Researcher Zhichao Hu of the Nanjing Institute of Agricultural Mechanization, Ministry of Agriculture and Rural Affairs, and the R&D team developed the improved 4HLB-2-type crawler self-propelled semi-feed peanut combine harvester, on the basis of which the 4HLB-4-type semi-feed four-row peanut combine harvester was developed, according to the demands of industrial development [7,8,9].
The 4HLB-4 half-feed four-row peanut joint harvester can harvest four rows (two plots) of peanuts at the same time, along with conveying, soil cleaning, peanut picking and cleaning, peanut collection, plant throwing, and other operations, but the machine’s structure is complex, and its operational performance is greatly affected by the movement parameters and the operating technology. In recent years, Chinese scholars have conducted research studies on peanut combine harvesting technology, and scholars from other countries have conducted little research on peanut combine harvesting technology. Hu et al. developed a semi-fed peanut two-row combine harvester, a semi-fed peanut four-row combine harvester, and a semi-fed peanut picker and conducted a great deal of research on the structural form, structural parameters, motion parameters, and peanut-picking mechanism of the semi-feed peanut-picking mechanism [10,11,12,13]. Wang et al. optimized the structure and motion parameters of a curved-roller peanut-picking device [14]. Gao et al. developed a small-roller semi-fed plot-breeding peanut-picking device, conducted experimental studies on the structure and parameters [15,16,17], and carried out the design of, and experimental research on, the cleaning device [18]. Wang et al. designed a lap-type snapping finger vibrating screen peanut-cleaning device and carried out experimental optimization of the key parameters of the screen body [19].
At present, in the field of peanut combine harvesting technology, relevant design and experimental research has been carried out only for certain related operations, such as clamping and conveying, peanut picking, and clearing, whereas systematic research on the overall operational performance and parameters of the half-feed four-row peanut combine harvester is relatively scarce. To this end, we conducted experimental research on the 4HLB-4 half-feed peanut combine harvester with the impurity rate and loss rate as the main control targets and explored the primary and secondary relationships between the forward speed, clamping height, peanut picking roller rotational speed, and cleaning sieve vibrational frequency with respect to the operational performance through single-factor and multifactor tests, using the response surface methodology to determine the harvester’s optimal combination of operational parameters and to provide a basis for their perfect design and optimization.

2. Materials and Methods

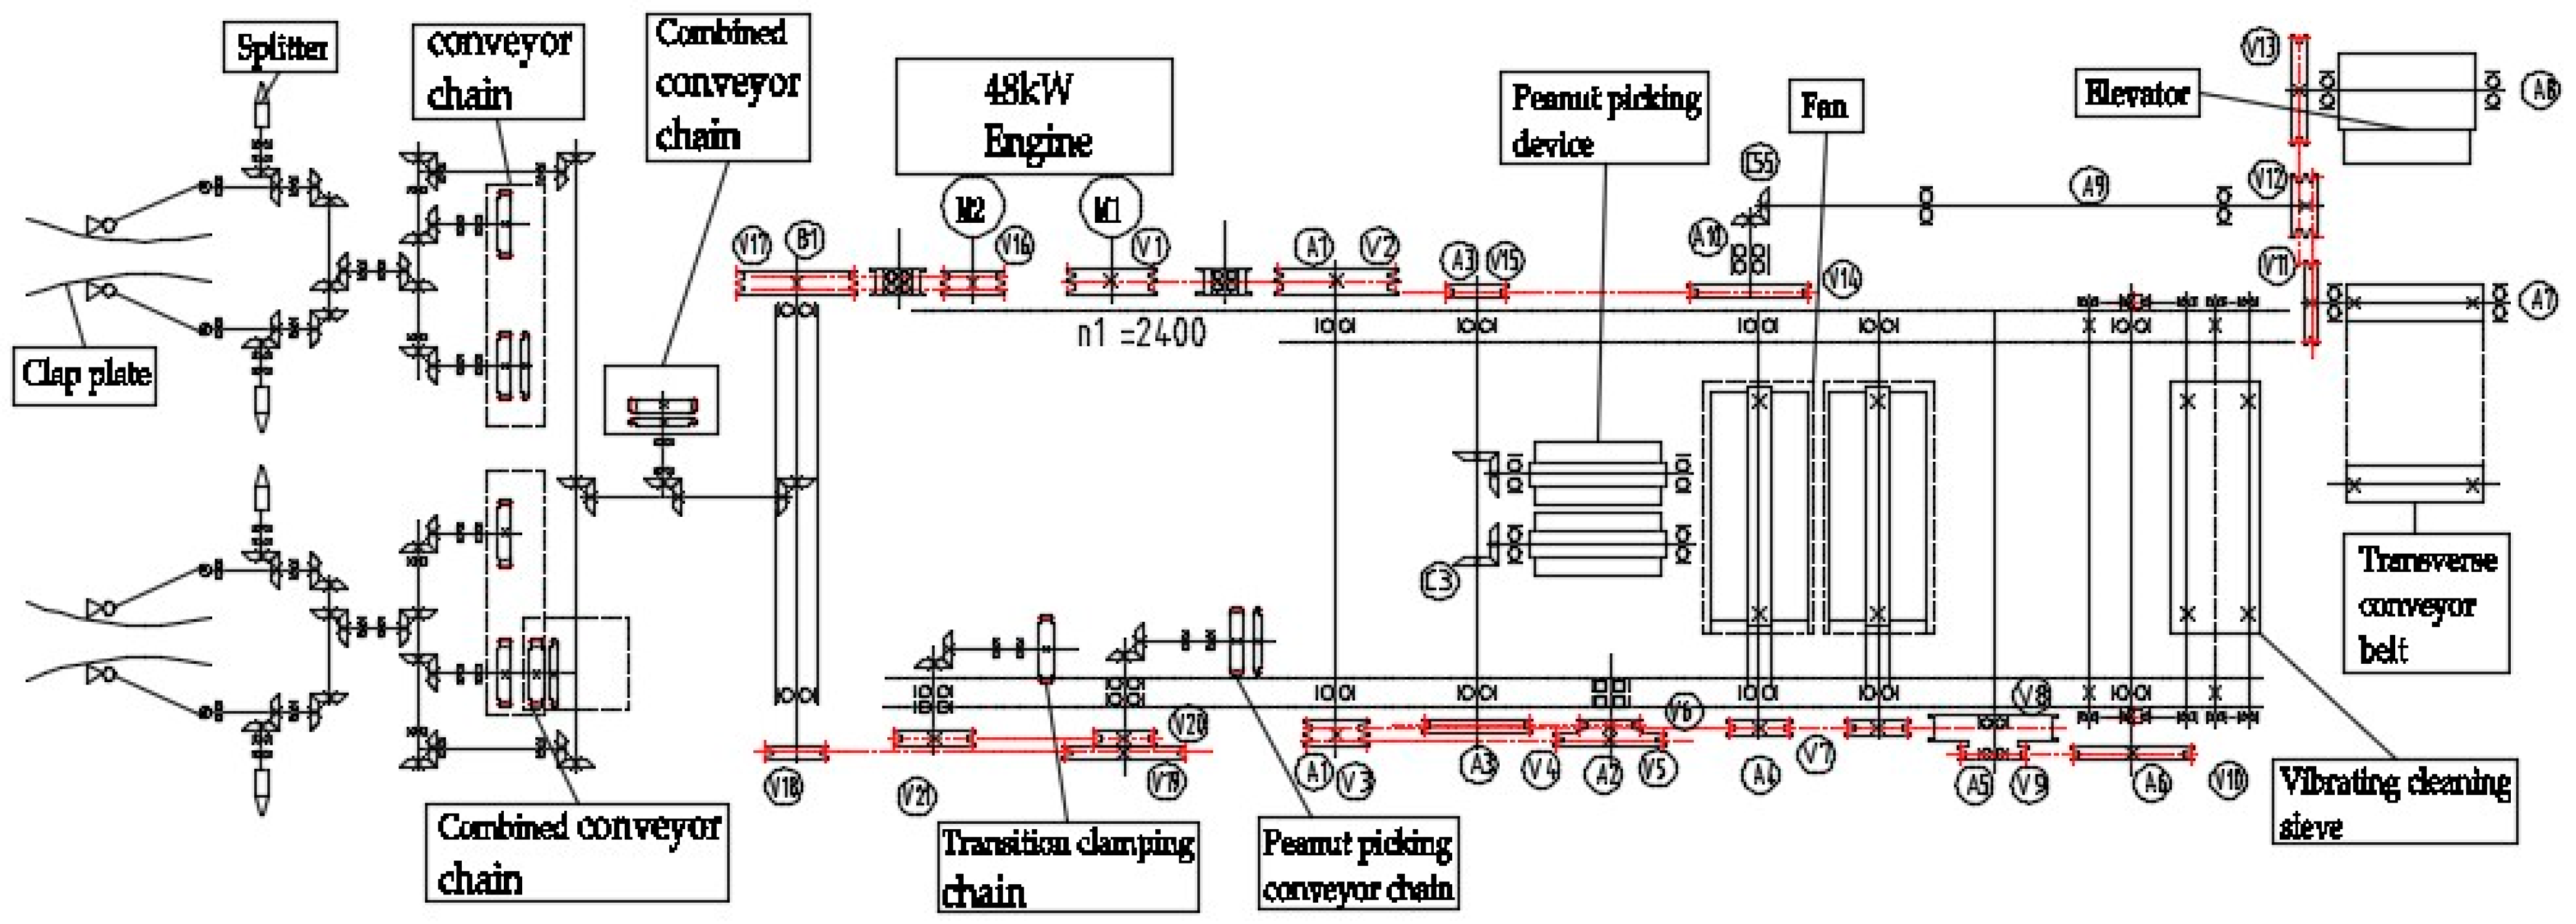
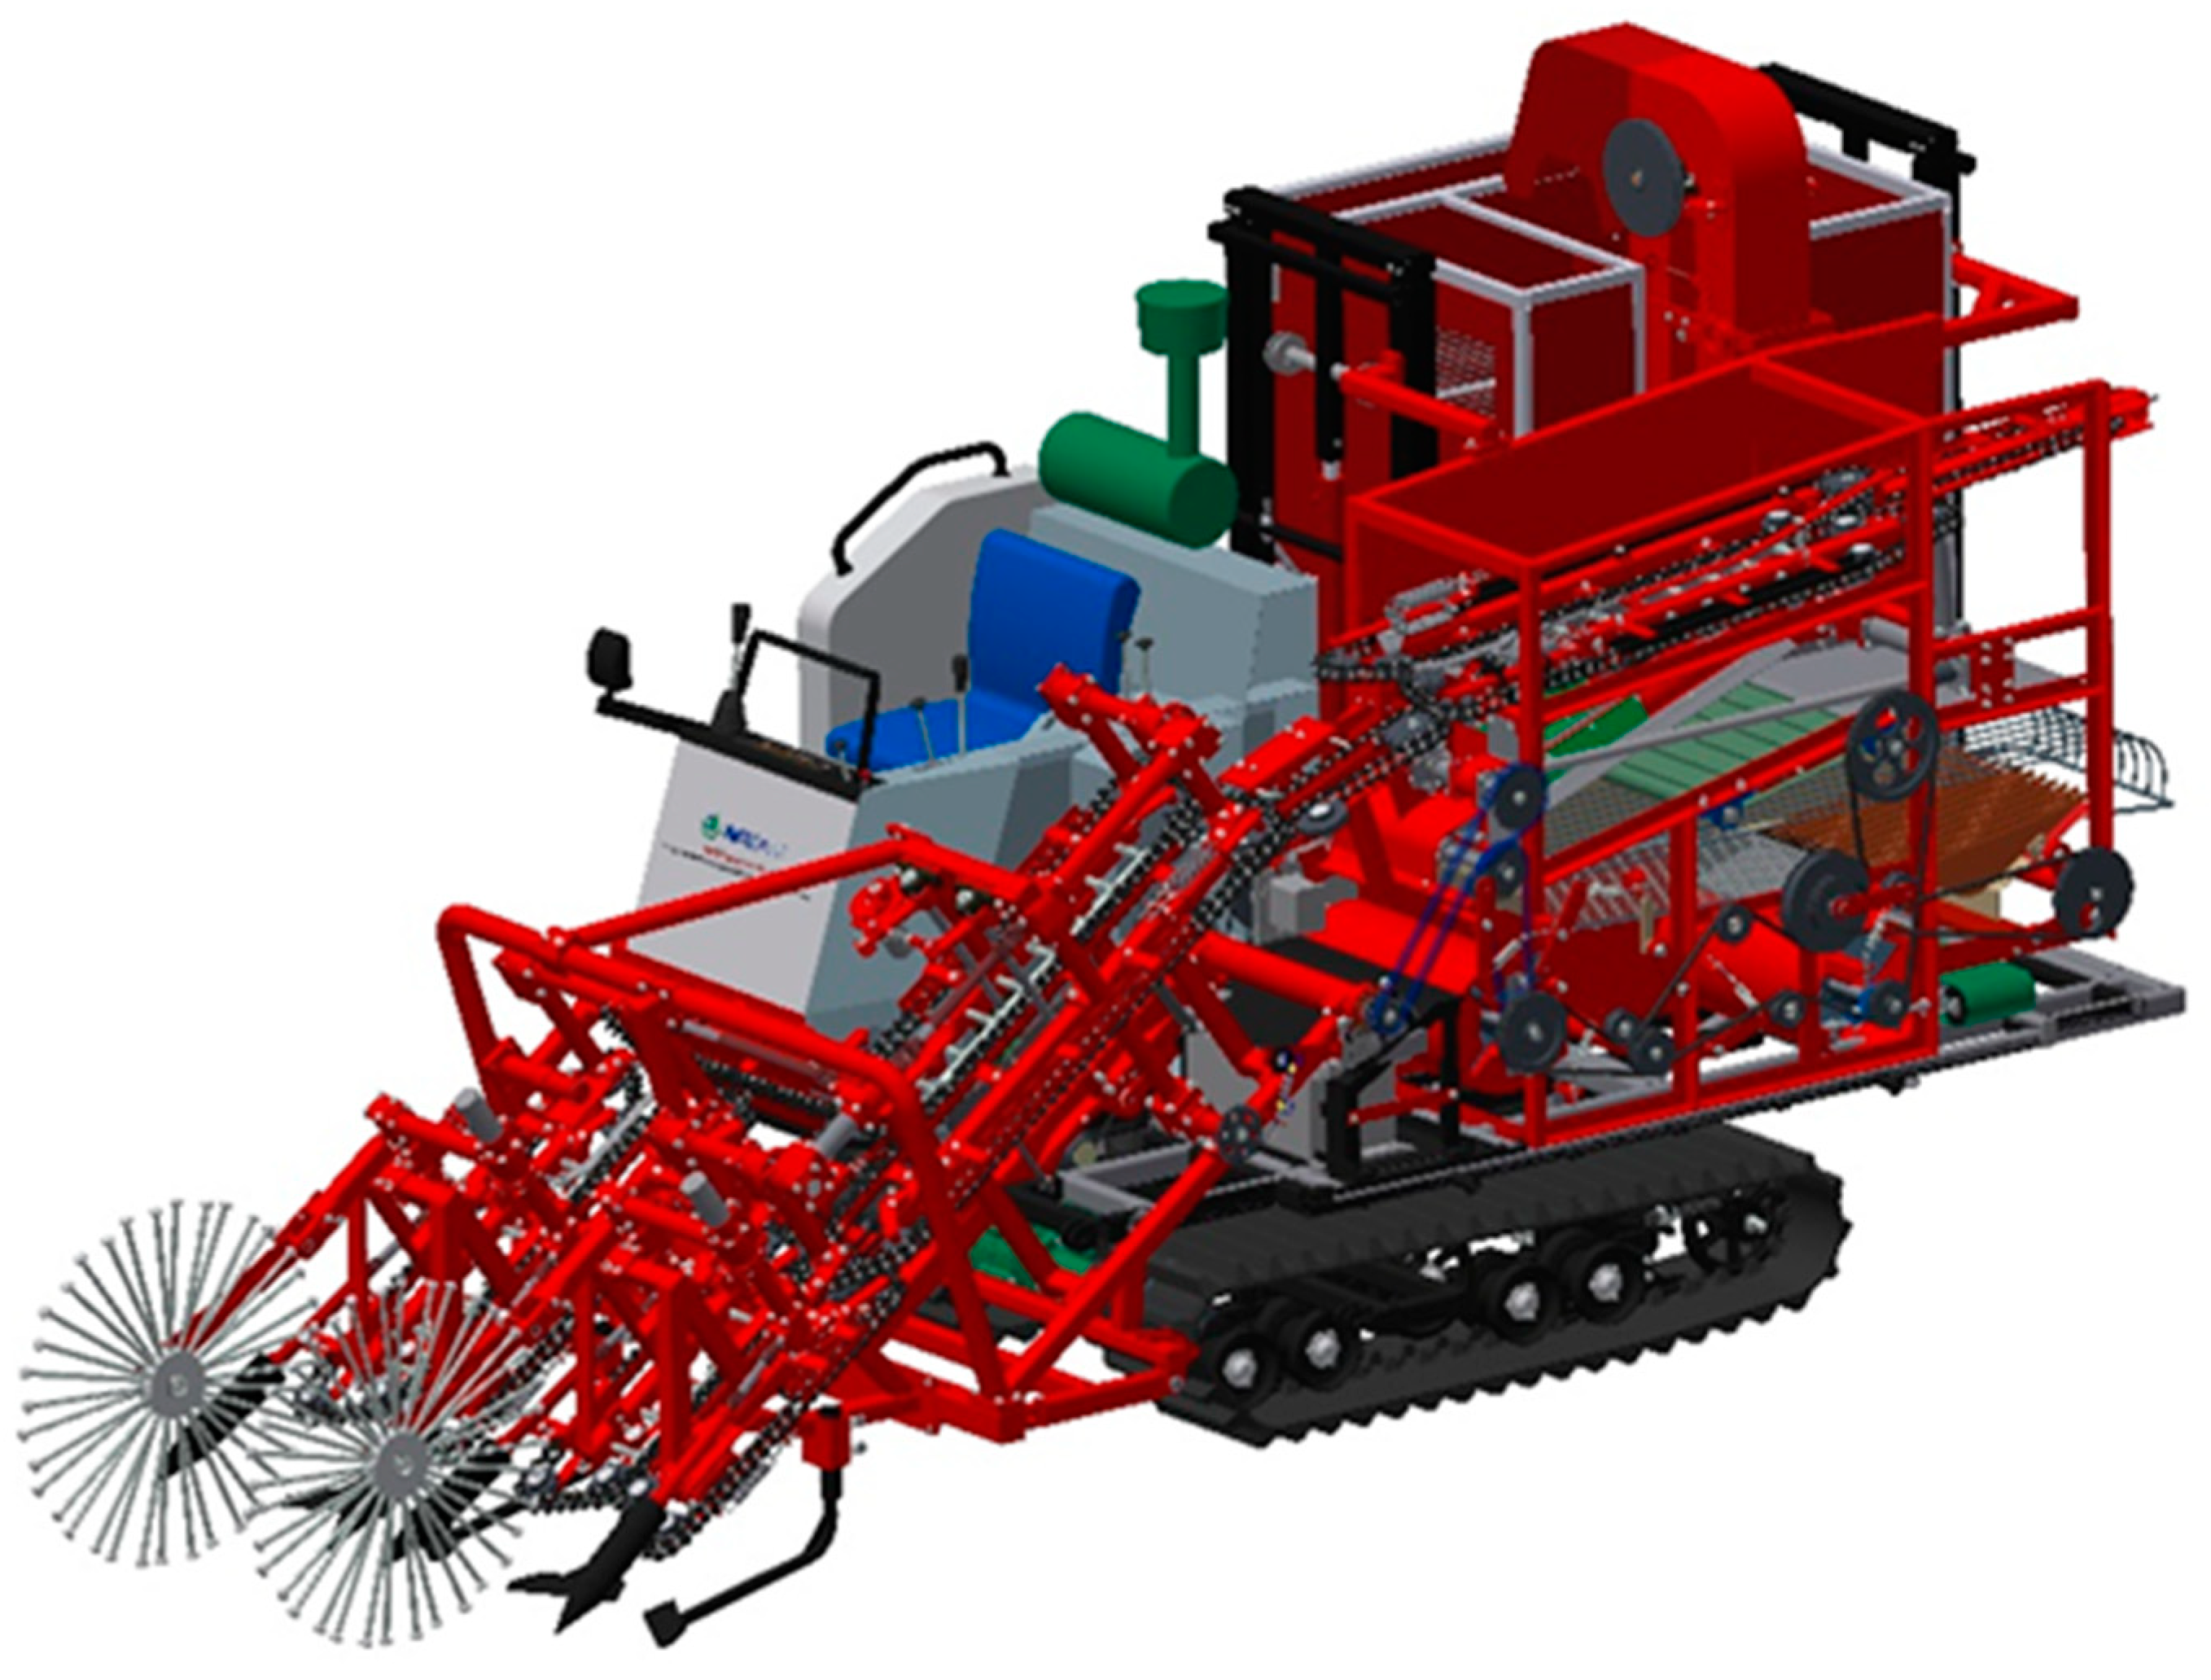
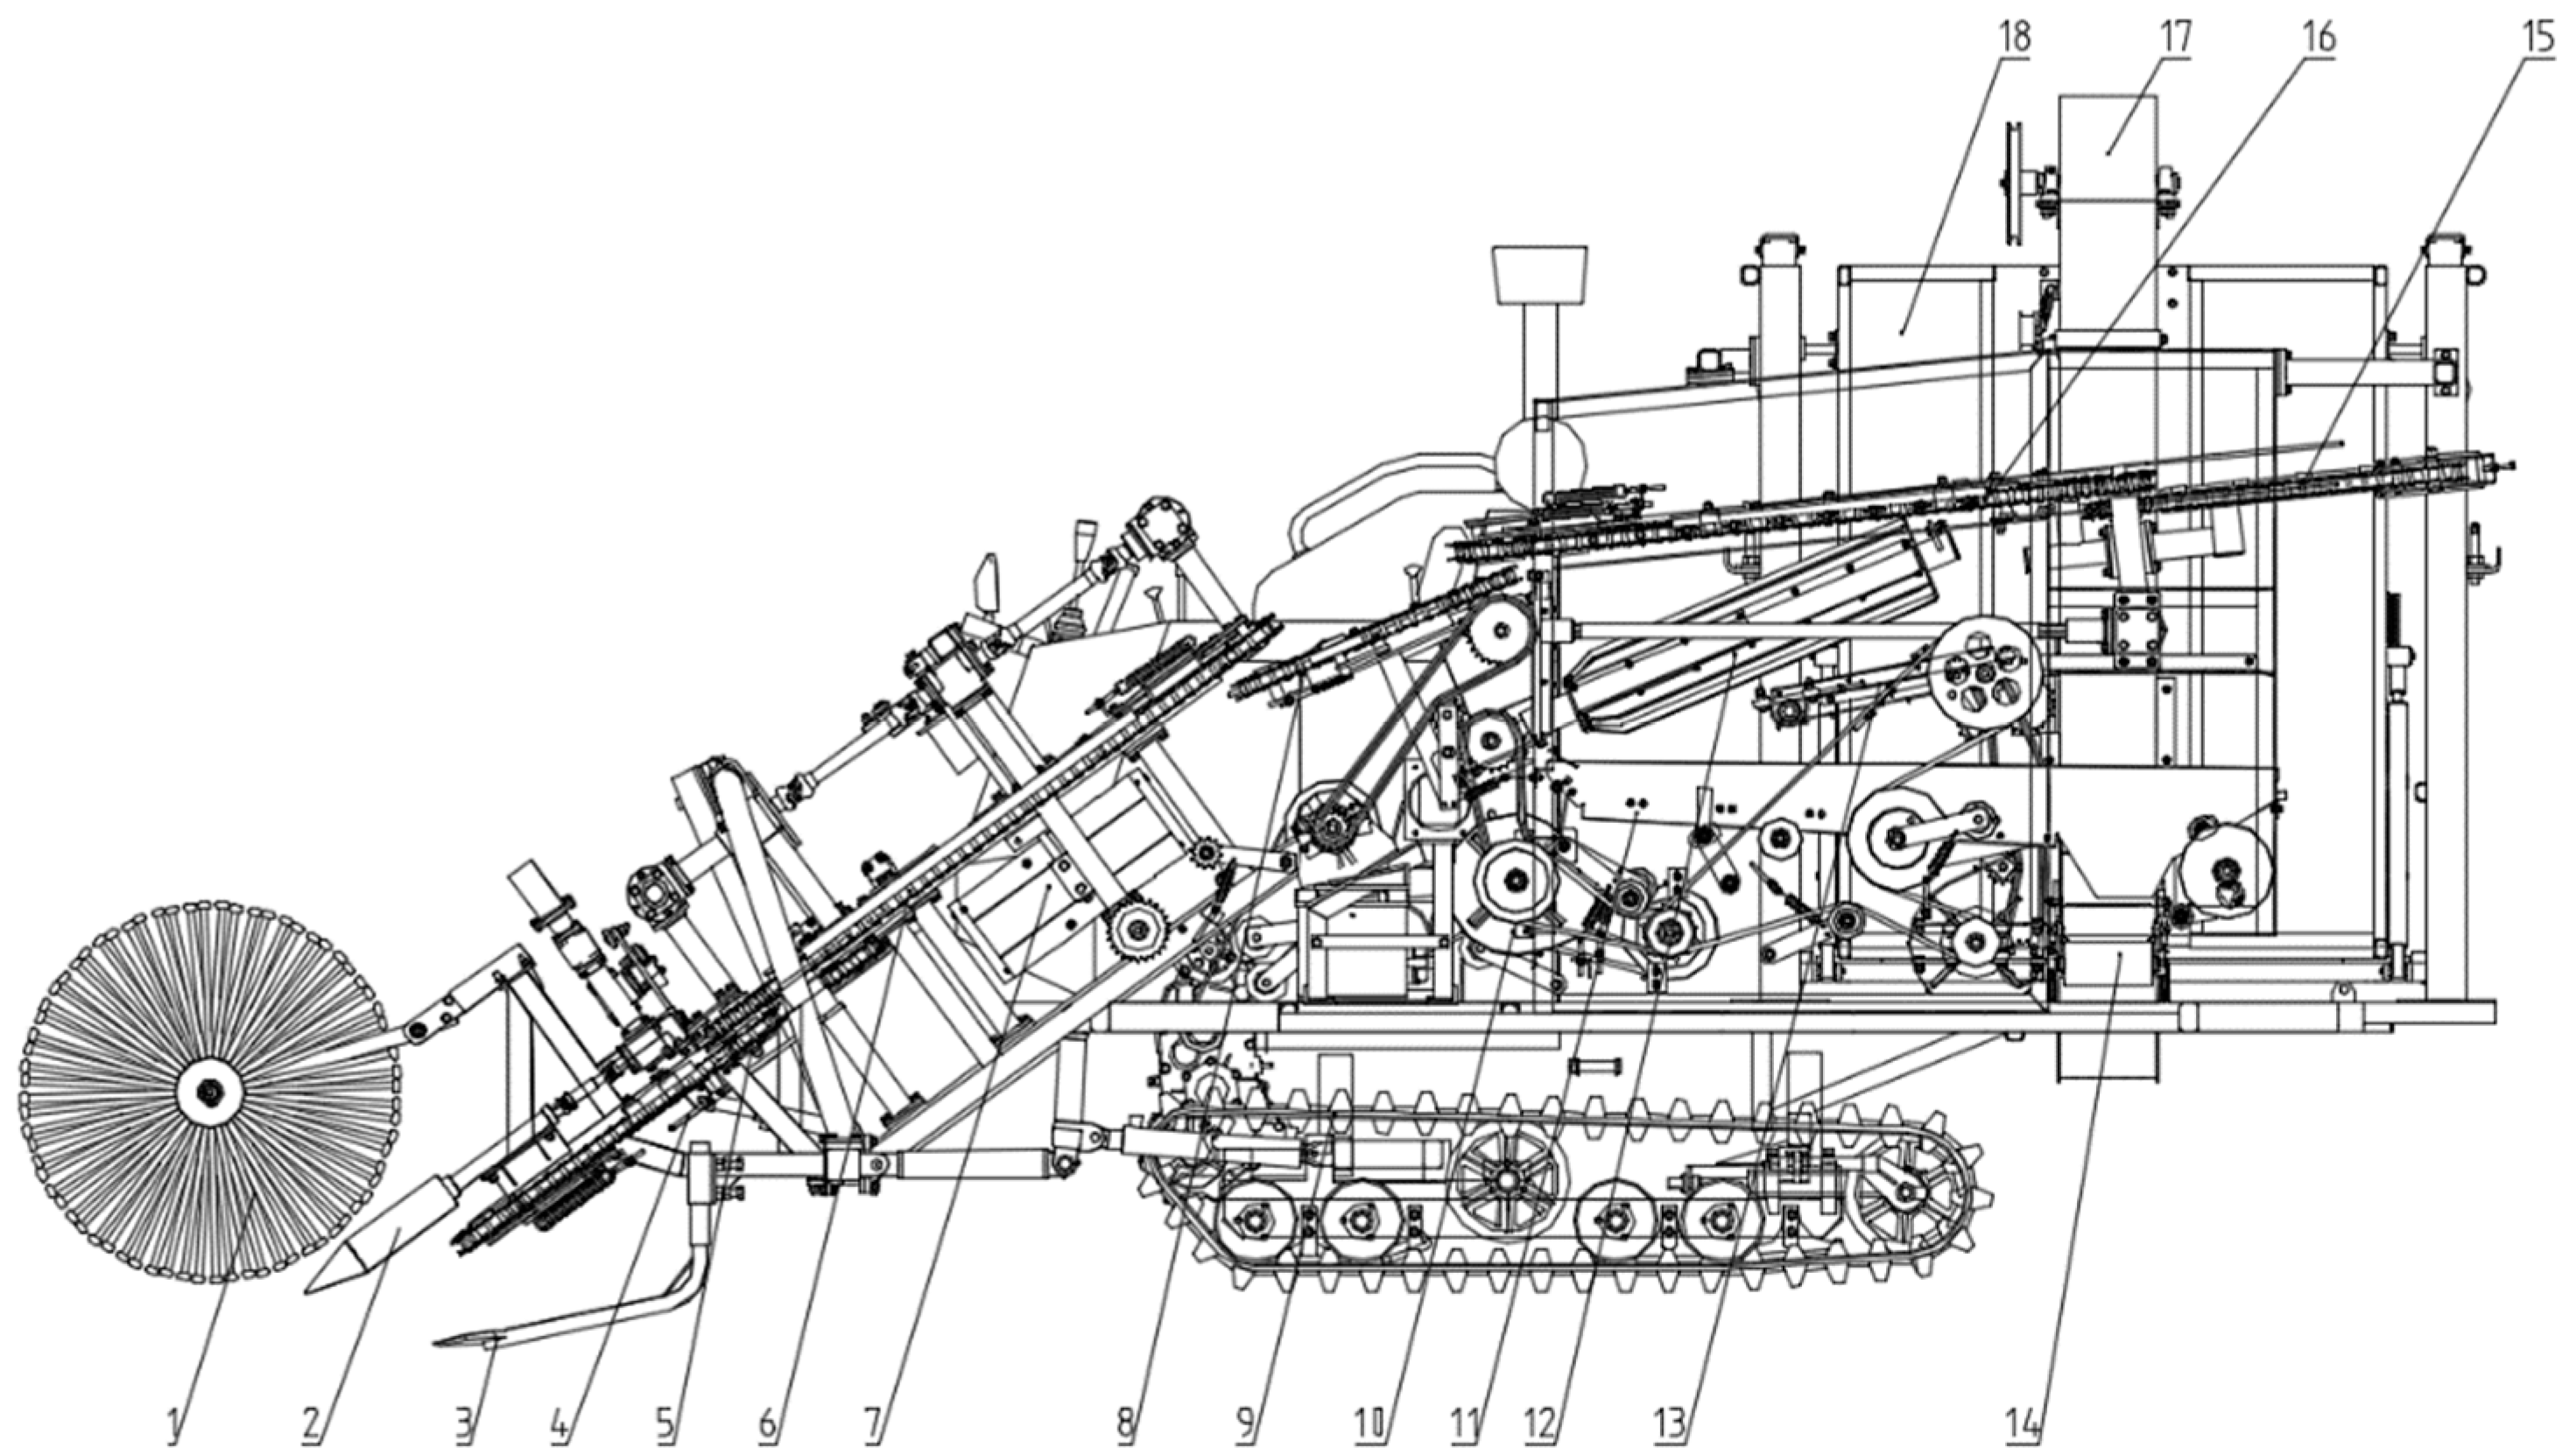
2.1. Overall Structure and Technological Process

The 4HLB-4 half-feed peanut combine harvester is a half-feed, self-propelled peanut combine harvester capable of harvesting four rows (two plots) at a time (adjustable plot harvesting distance: 700–900 mm), and its harvesting process includes digging and plant, along with conveying, soil cleaning, peanut picking, cleaning, peanut collection, plant throwing, and other associated operations. The device uses the technology of automatic plant pulling up with a line depth limit for the plots, along with staggered intersection and merging transportation, anti-tangle peanut picking, and snapping finger vibrating screen peanut cleaning. The overall structure is shown in Figure 1 and Figure 2 and mainly includes a profiling depth-limiting wheel 1, lifter 2, excavation shovel 3, earth-moving rod 4, left and right clamping and pulling devices 5, combined conveying device 6, clap plate 7, transition clamping and conveying parts 8, chassis 9, fan 10, cleaning sieve 11, peanut picking device 12, scraper conveyor belt 13, transverse conveyor belt 14, grass-throwing conveyor chain 15, peanut-picking conveyor chain 16, elevator 17, and peanut box 18, among other components. The transmission system’s configuration is shown in Figure 3. The transmission system adopts split transmission, and both drives have a belt-press wheel clutch. One drive provides power to the chassis’ operating system, the clamping and conveying system, and the supporting device through the gearbox, and its speed is related to the walking speed of the machine, as well as the gear and stepless speed of the gearbox. The other drive provides power to the soil-cleaning device, peanut-picking device, cleaning fan, cleaning vibrating screen, elevator feeding conveyor belt, elevator, and other operating components, where the power is output directly from the engine, and its speed increases or decreases with the speed of the engine and is unaffected by the walking speed of the machine.
The technological process is as follows: First, adjust the spacing between the left and right harvesting tables and set the same distance between the peanut plots. When the left and right clamping and pulling devices are aligned with the two adjacent plots, their respective lifter 2 will lift up according to the width of the peanut plants. The excavation shovel 3 breaks the main roots of the peanut plants and loosens the soil, and then the plants are pulled up by the left and right clamping and pulling devices 5 and clamped to their respective channels for upward (backward) transport. The plants are transported backwards by the earth-moving rod 4 and the soil removal plate 7 to remove the soil from the roots of the plants. The peanut plants in the channel of the right clamping device are turned vertically and transported laterally under the action of the curved lever and the clamping chain and then merged with the peanut plants in the channel of the left clamping device for upward (backward) transport under the combined conveying device 6. The plants are then transported backwards by the peanut-picking conveyor chain 16 after being handed over twice by the front and rear of the transition clamping and conveying parts 8. The plants are transported to the peanut picking section by the peanut-picking device 12, the peanuts are brushed off from the plants directly into the cleaning sieve 11 by the front end of the peanut-picking roller, and the rear end of the peanut-picking device brushes the peanuts that have fallen onto the scraper conveyor belt 13 towards the front of the cleaning sieve 11. Under the combined action of the cleaning sieve and the front and rear fans 10, the stems, leaves, soil, film, and other debris are separated and discharged from the machine. The selected peanuts are sent to the peanut box 18 through the transverse conveyor belt 14 and the elevator 17, and the peanut plants continue to be transported backwards and thrown out of the machine by the grass-throwing conveyor chain 15, completing the harvesting operation.

2.2. Key Operating Components

The 4HLB-4 half-feed peanut combine harvester has a complex structure, many operating components, and many parameters affecting its operational performance. We selected several key working components: the plant clamping and pulling conveying device, the peanut-picking device, and the cleaning device, and determined the main factors affecting the harvesting performance of the whole machine by combining their working principles.

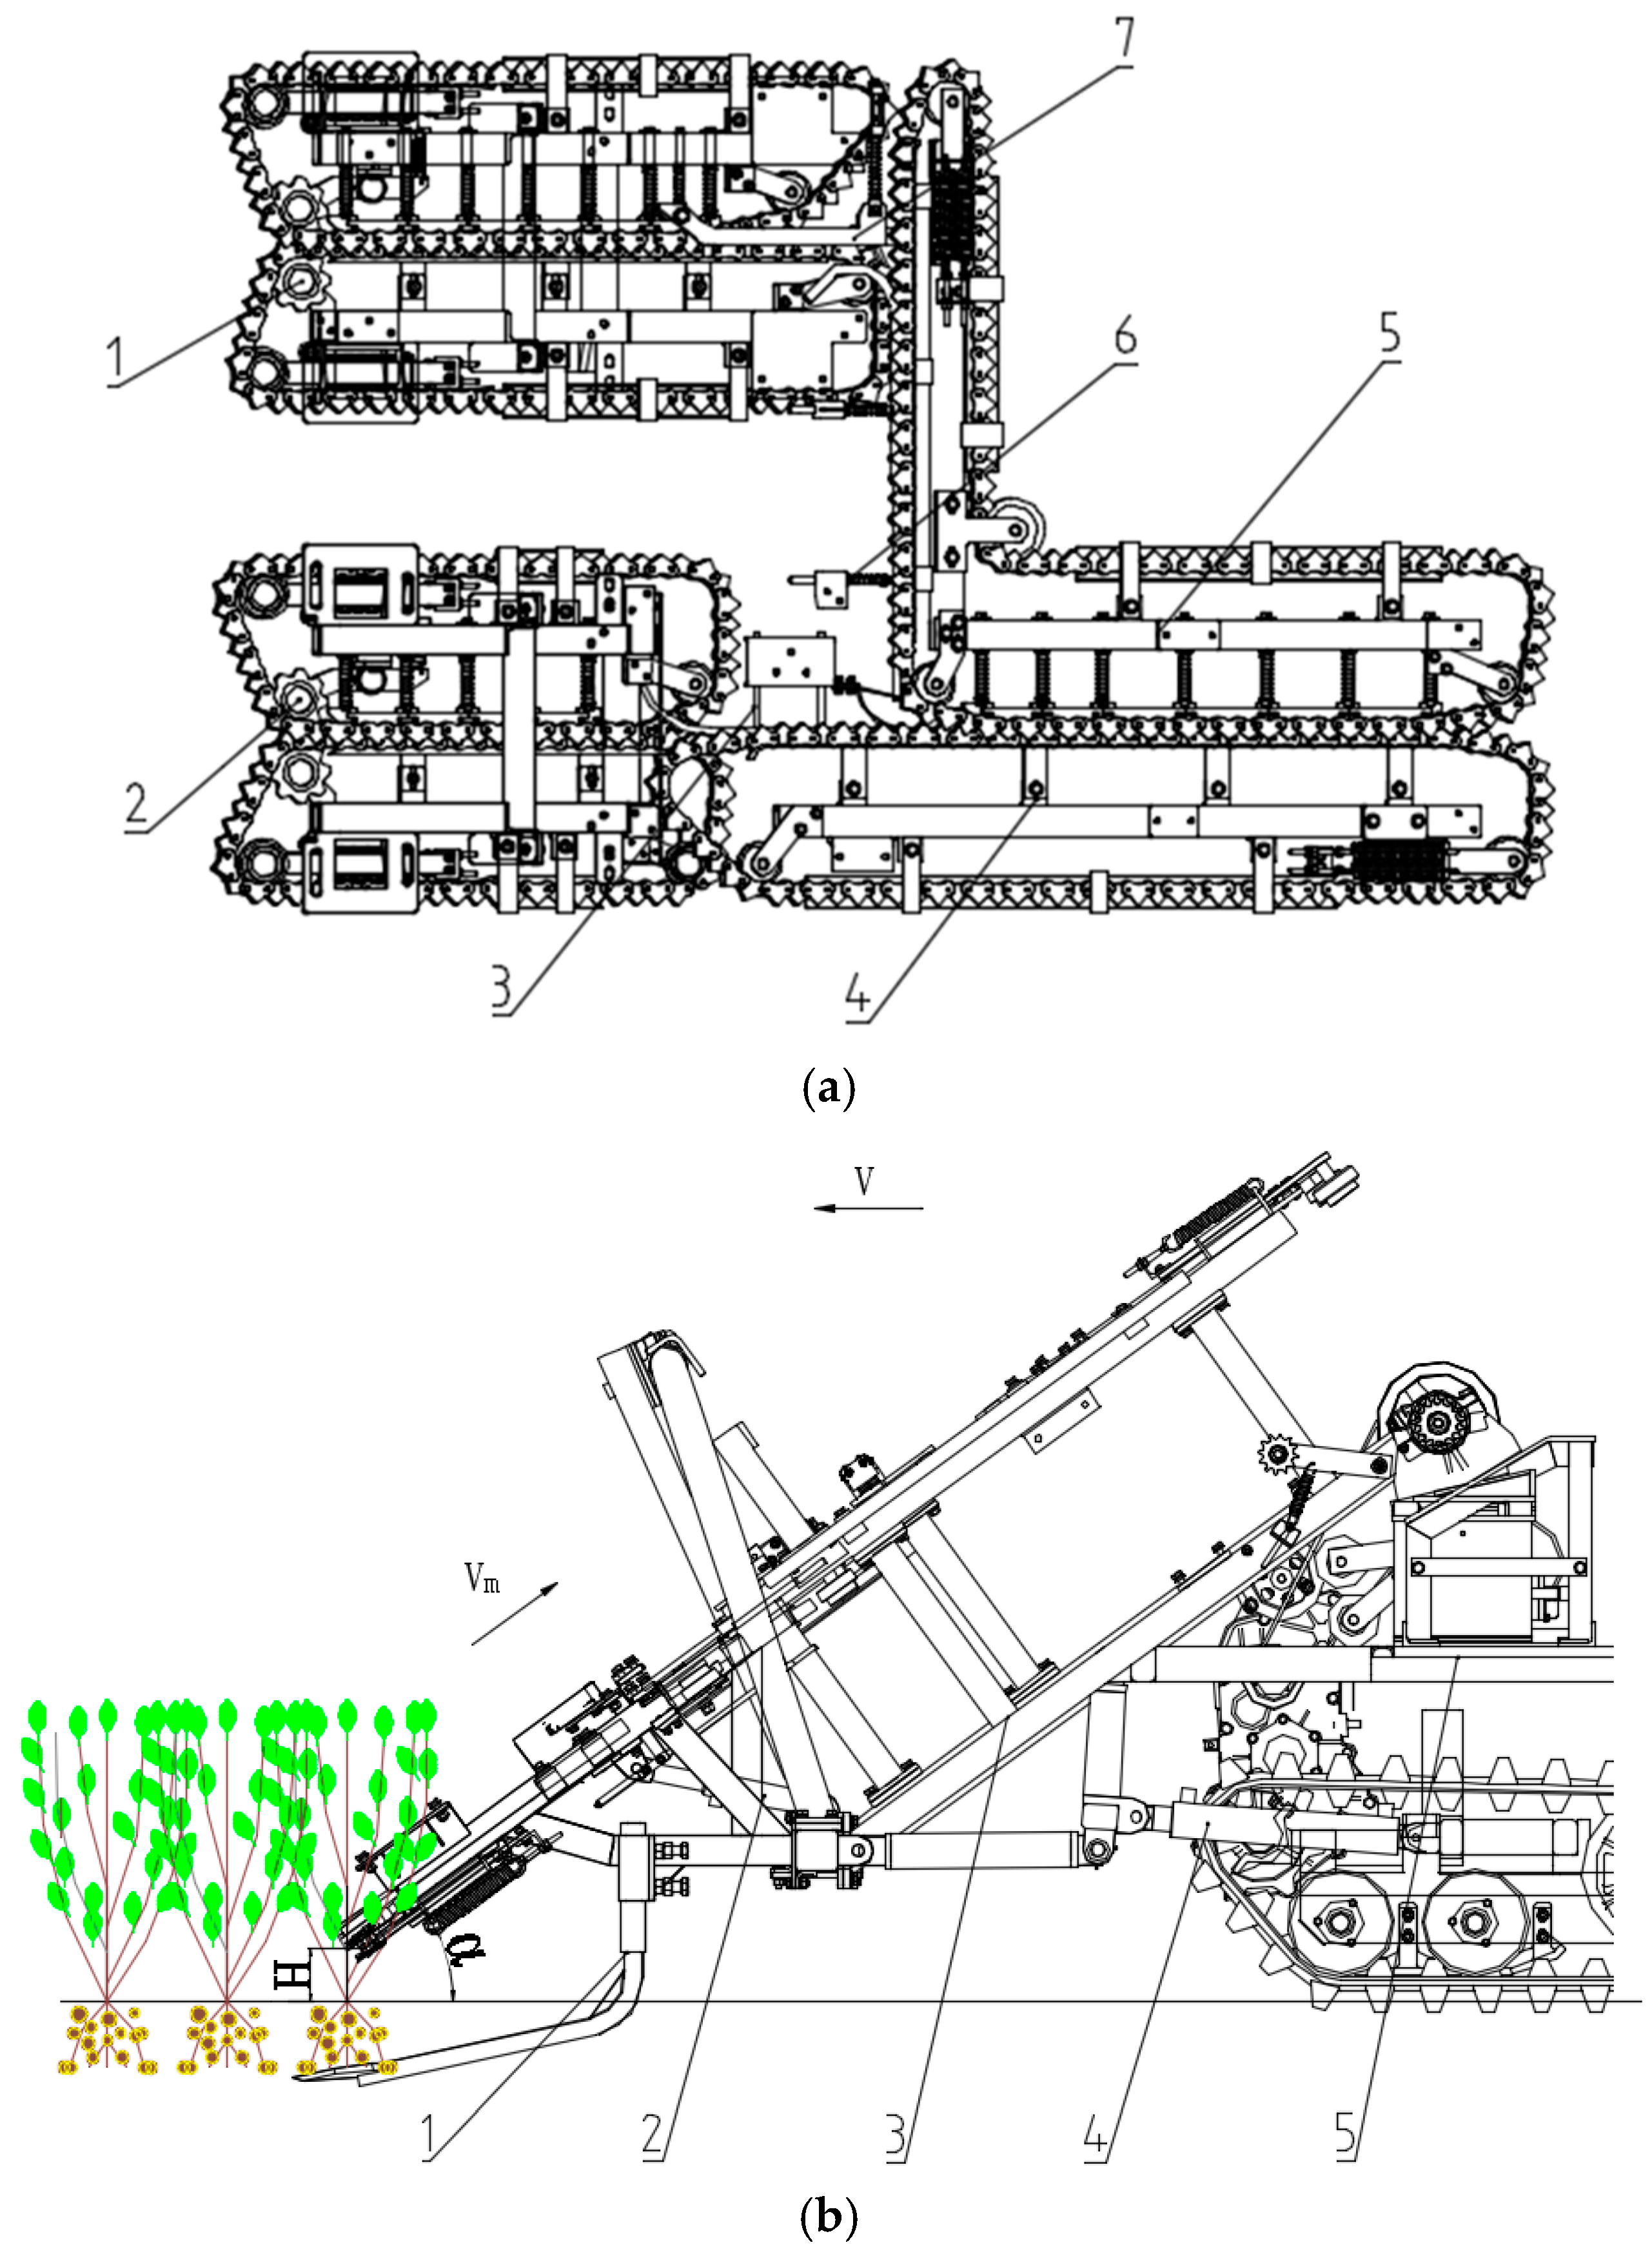
2.2.1. Plant Clamping and Pulling Conveying Device

The clamping and pulling conveying device mainly performs the clamping and pulling up of the two plots of peanut plants at the same time before merging and conveying them. Its structure is shown in Figure 4. The main parameters of the clamping and pulling conveying device are the clamping feeding angle, clamping chain inclination angle, clamping height, and clamping chain speed. According to the design requirements, the clamping feeding angle is 135°, and the initial inclination angle of the clamping chain is 30°. The clamping height H is the height from the clamping part of the clamping chain to the ground surface during the harvesting operation, which can be adjusted from 160 to 250 mm during the operation.
The speed and direction of the plants clamping point determine the state of the plants clamping and extraction. In order to ensure the upward positive extraction of the plants by the clamping chain, the synthetic clamping direction should be approximately vertical. Therefore, the clamping chain’s forward clamping speed is equal to the forward speed of the machine.
v = v m cos α
where v is the machine forward speed, m/s; vm is the clamping chain clamping speed, m/s; and α is the initial clamping angle between the clamping chain and the ground, 30°.
Based on the clamping chain tilt angle, the clamping speed ratio (the ratio of the clamping conveyor speed to the machine’s forward speed) is 1.15, according to Equation (1). The machine’s forward speed is set between 0.6 and 1.5 m/s, and the clamping and conveying speed is set between 0.69 and 1.72 m/s. The clamping height H and forward speed v (associated with the clamping chain speed) determine the plants’ conveying status and have direct impacts on the subsequent soil-patting and peanut-picking operations.

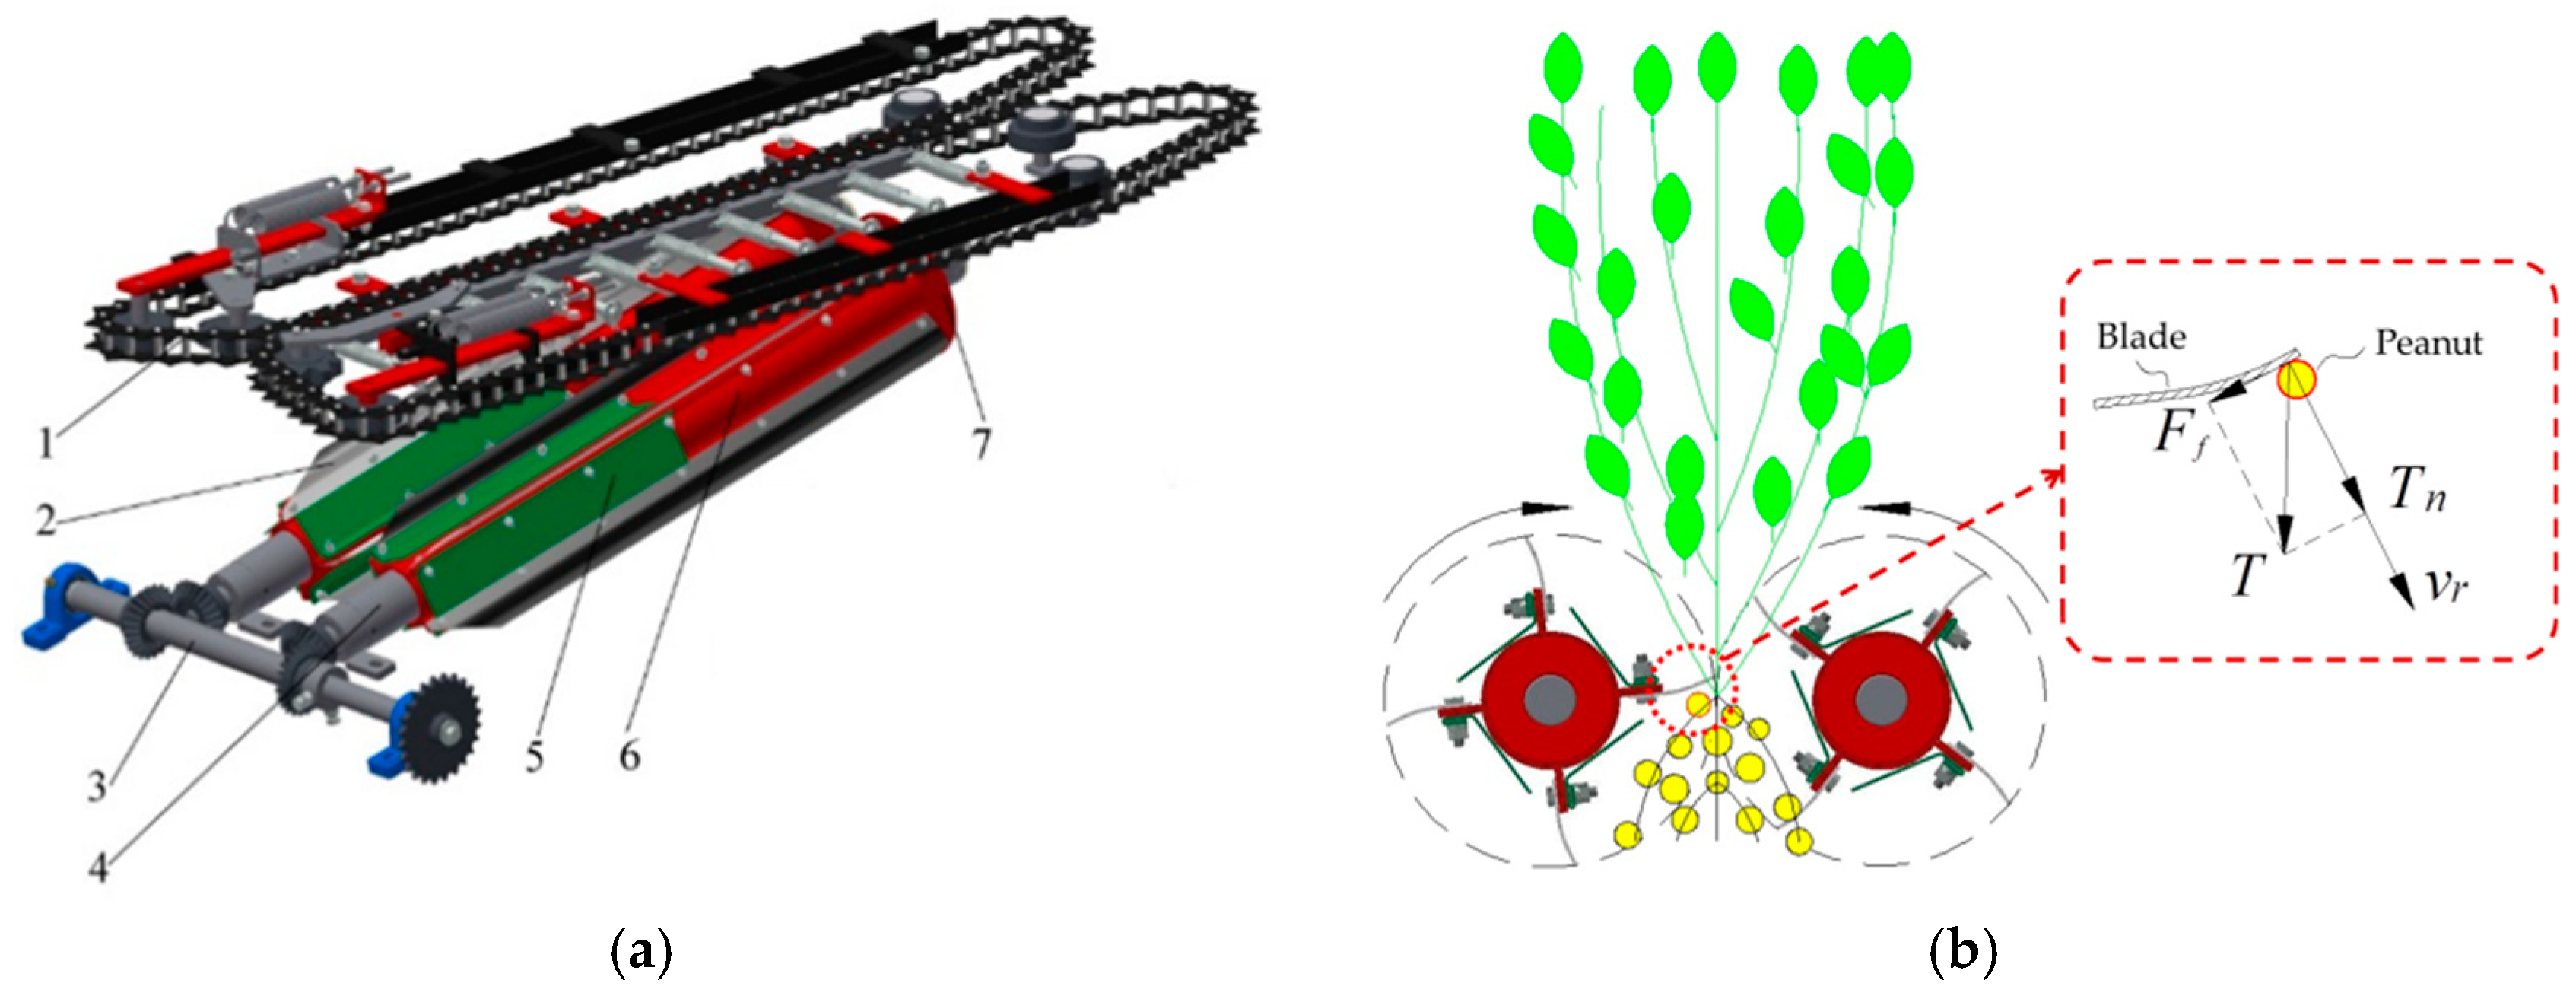
2.2.2. Peanut-Picking Device

Peanut picking is the most important operation in the combine harvesting of peanuts and is also the core technology of four-row peanut combine harvesting. The structure of the peanut-picking device is shown in Figure 5a. Four groups of peanut-picking blades are fixed by bolts along the circumference of the two rollers, installed in a symmetrical setup, with each picking the peanuts from the other. When the peanut plant is clamped and transported through the peanut picking section, the multiple groups of peanut-picking blades on the rollers hit the peanut plants continuously, and when the impact force exceeds the strength of the connection between the peanuts and the plants, the peanuts are separated from the plants.
The peanuts are subjected to the striking force of the picking blade at the moment when the blade strikes the peanuts, as shown in Figure 5b. The peanut-picking blade collides with the peanuts at a relative velocity vr. The peanuts are subjected to a normal striking force Tn and a tangential friction force Ff. The normal striking force Tn causes the peanuts in the collision area to have a normal velocity vn, and the peanuts undergo local compression deformation. At the same time, under the reaction force of Tn, the local compression deformation of the peanut-picking blade occurs, and the relative velocity of the blade decreases.
When the peanuts’ normal velocity increases to the same speed as the peanut-picking blade, the relative velocity of the two is zero, and the normal striking force increases to the maximum Tnmax. At this time, the kinetic energy generated by the blade striking the peanuts is absorbed by the local elastic–plastic deformation of the peanuts, and the blade’s normal striking force Tn is equal to the blade’s initial kinetic energy upon impact. The instantaneous energy conservation equation [20,21] for the striking is as follows:
m e v r 2 = 0 ζ T n d ξ = 2 λ ξ T n max
where Tnmax is the maximum value of the normal striking force Tn (N); me is the equivalent mass of the peanuts and the picking blades (kg); 1 / m e = 1 / m 1 + 1 / m 2 , m1, and m2 are the masses of the peanuts and the picking blades (kg); λ is the energy absorption coefficient of the peanut collision [2]; and ξ is the relative displacement of the striking force at the moment of collision (m).
The maximum normal striking force Tnmax at the moment of impact is obtained from Equation (3) as follows:
T n max = m e v r 2 2 λ ξ
According to Hertz’s collision contact theory [20], the impact stress Pn on the peanuts during the striking process is as follows:
P n = 6 T n E e 2 π 3 R e 2 3
where Ee is the equivalent modulus of elasticity of the peanuts and peanut-picking blades (Pa); 1 / E e = ( 1 μ 1 2 ) / E 1 + ( 1 μ 2 2 ) / E 2 , E1, and E2 are the moduli of elasticity of the peanuts and the peanut-picking blades (Pa); μ1 and μ2 are the Poisson’s ratio of the peanuts and the peanut-picking blades, respectively; Re is the equivalent relative radius of the curvature of the peanuts and the peanut-picking blades (m); and 1 / R e = 1 / R 1 + 1 / R 2 , R1, and R2 are the radii of curvature of the peanuts and peanut-picking blades in the collision region (m).
From Equations (3) and (4), we can find the maximum impact stress Pnmax of the peanuts during the striking process as follows:
P n max = 3 m e v r 2 E e 2 λ π 3 R e 2 ξ 3
During the peanut-picking process, when the maximum normal striking force Tnmax exceeds the peanut–plant connection force, the peanut–plant connection breaks and the peanuts are separated from the plants. When the maximum impact stress Pnmax exceeds the elastic limit of the peanuts, the peanuts undergo irreversible plastic deformation. From Equations (3)–(5), it can be seen that the maximum striking force and maximum striking stress are positively correlated with the relative velocity of the peanut-picking blades and the equivalent mass of the bulb and the peanut-picking blades, and they are negatively correlated with the collision energy absorption coefficient of the peanuts and the relative displacement of the striking force at the moment of collision. From the above analysis, it can be seen that the relative speed of the picking blade is the key motion parameter affecting its impact strength, and the relative speed of the picking blade depends on the picking roller’s rotational speed r. According to the results of the previous bench test [19], the picking roller’s rotational speed r was selected to be in the range of 300–600 rpm. The axis distance of the peanut picking roller is 220 mm, the diameter of the peanut picking roller is 230 mm, each group of rollers is equipped with 4 pieces of steel plate, the size of the steel plate is 986 mm × 2 mm (length × thickness).

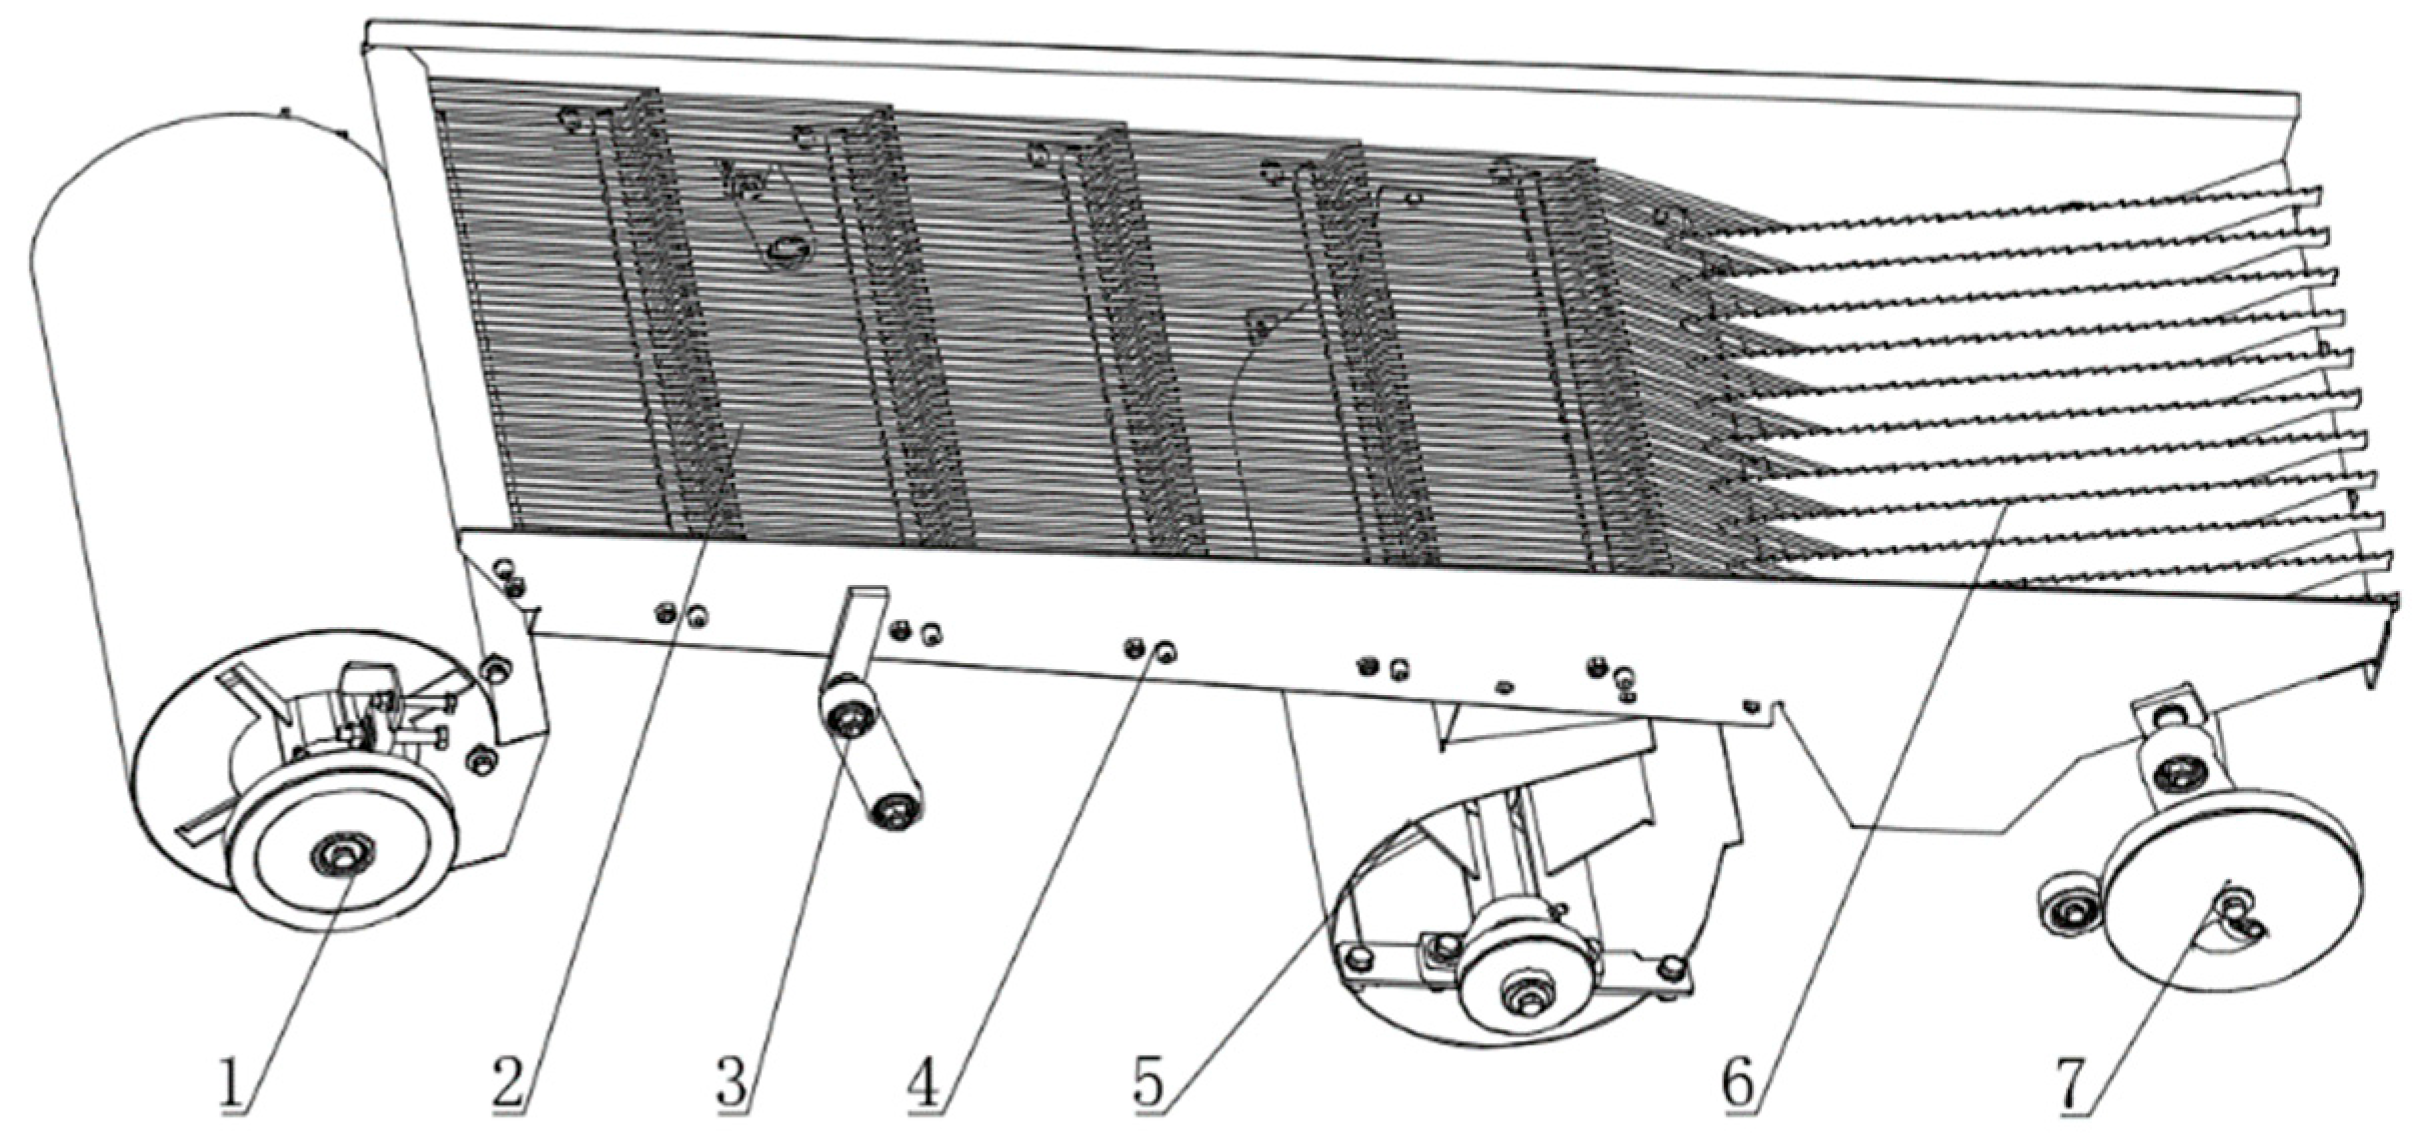
2.2.3. Cleaning Device

The cleaning device uses a double wind system with a snapping finger sieve structure to clean the peanuts and remove impurities such as broken branches, peanut stalks, and soil. The structure is shown in Figure 6. During its operation, the picked peanuts and impurities first fall onto the vibrating screen through the eccentric transmission mechanism, which is driven by a certain amplitude and frequency of reciprocating motion, so that the cleaning material is evenly distributed and the broken soil, short stalks, roots, deflated peanuts, and other impurities are removed, while the remaining peanuts and long stalks are transported backwards through the vibrating screen of the bullet finger sieve to the conveyor belt, and the long stalks are removed from the machine through the draft-by-draft device. The leaves, film, and other light debris are blown backwards out of the machine by the fan. According to the design requirements, the parameters of the cleaning device are as follows: the diameter of the snapping finger is 3 mm, the distance between the bars of the snapping finger sieve is 11 mm, the installation angle is 2.8°, the size of the sieve body is 1500 mm × 520 mm (length × width), and the amplitude of the snapping finger sieve is 7 mm. The vibrational frequency of the vibrating sieve is the key index affecting the cleaning effect. When the cleaning sieve vibrational frequency is too low, the material on the screen cannot be smoothly transported backwards, resulting in the accumulation of peanut material, which is not conducive to normal operation. Conversely, when the cleaning sieve vibrational frequency is too high, the material flow speed is too fast, the cleaning sieve vibration is too short, and the material cleaning effect is poor. Combined with the test results, the cleaning sieve vibrational frequency f was set to be in the range of 400–700 cpm (cycles per minute).
According to the overall operational performance requirements, the parameters that can be adjusted as needed during the field harvesting operation are the forward speed v, plant clamping height H, peanut picking roller rotational speed r, and the cleaning sieve vibrational frequency f. We conduct experimental research and optimization of these four parameters.

2.3. Test Methods and Evaluation Indices

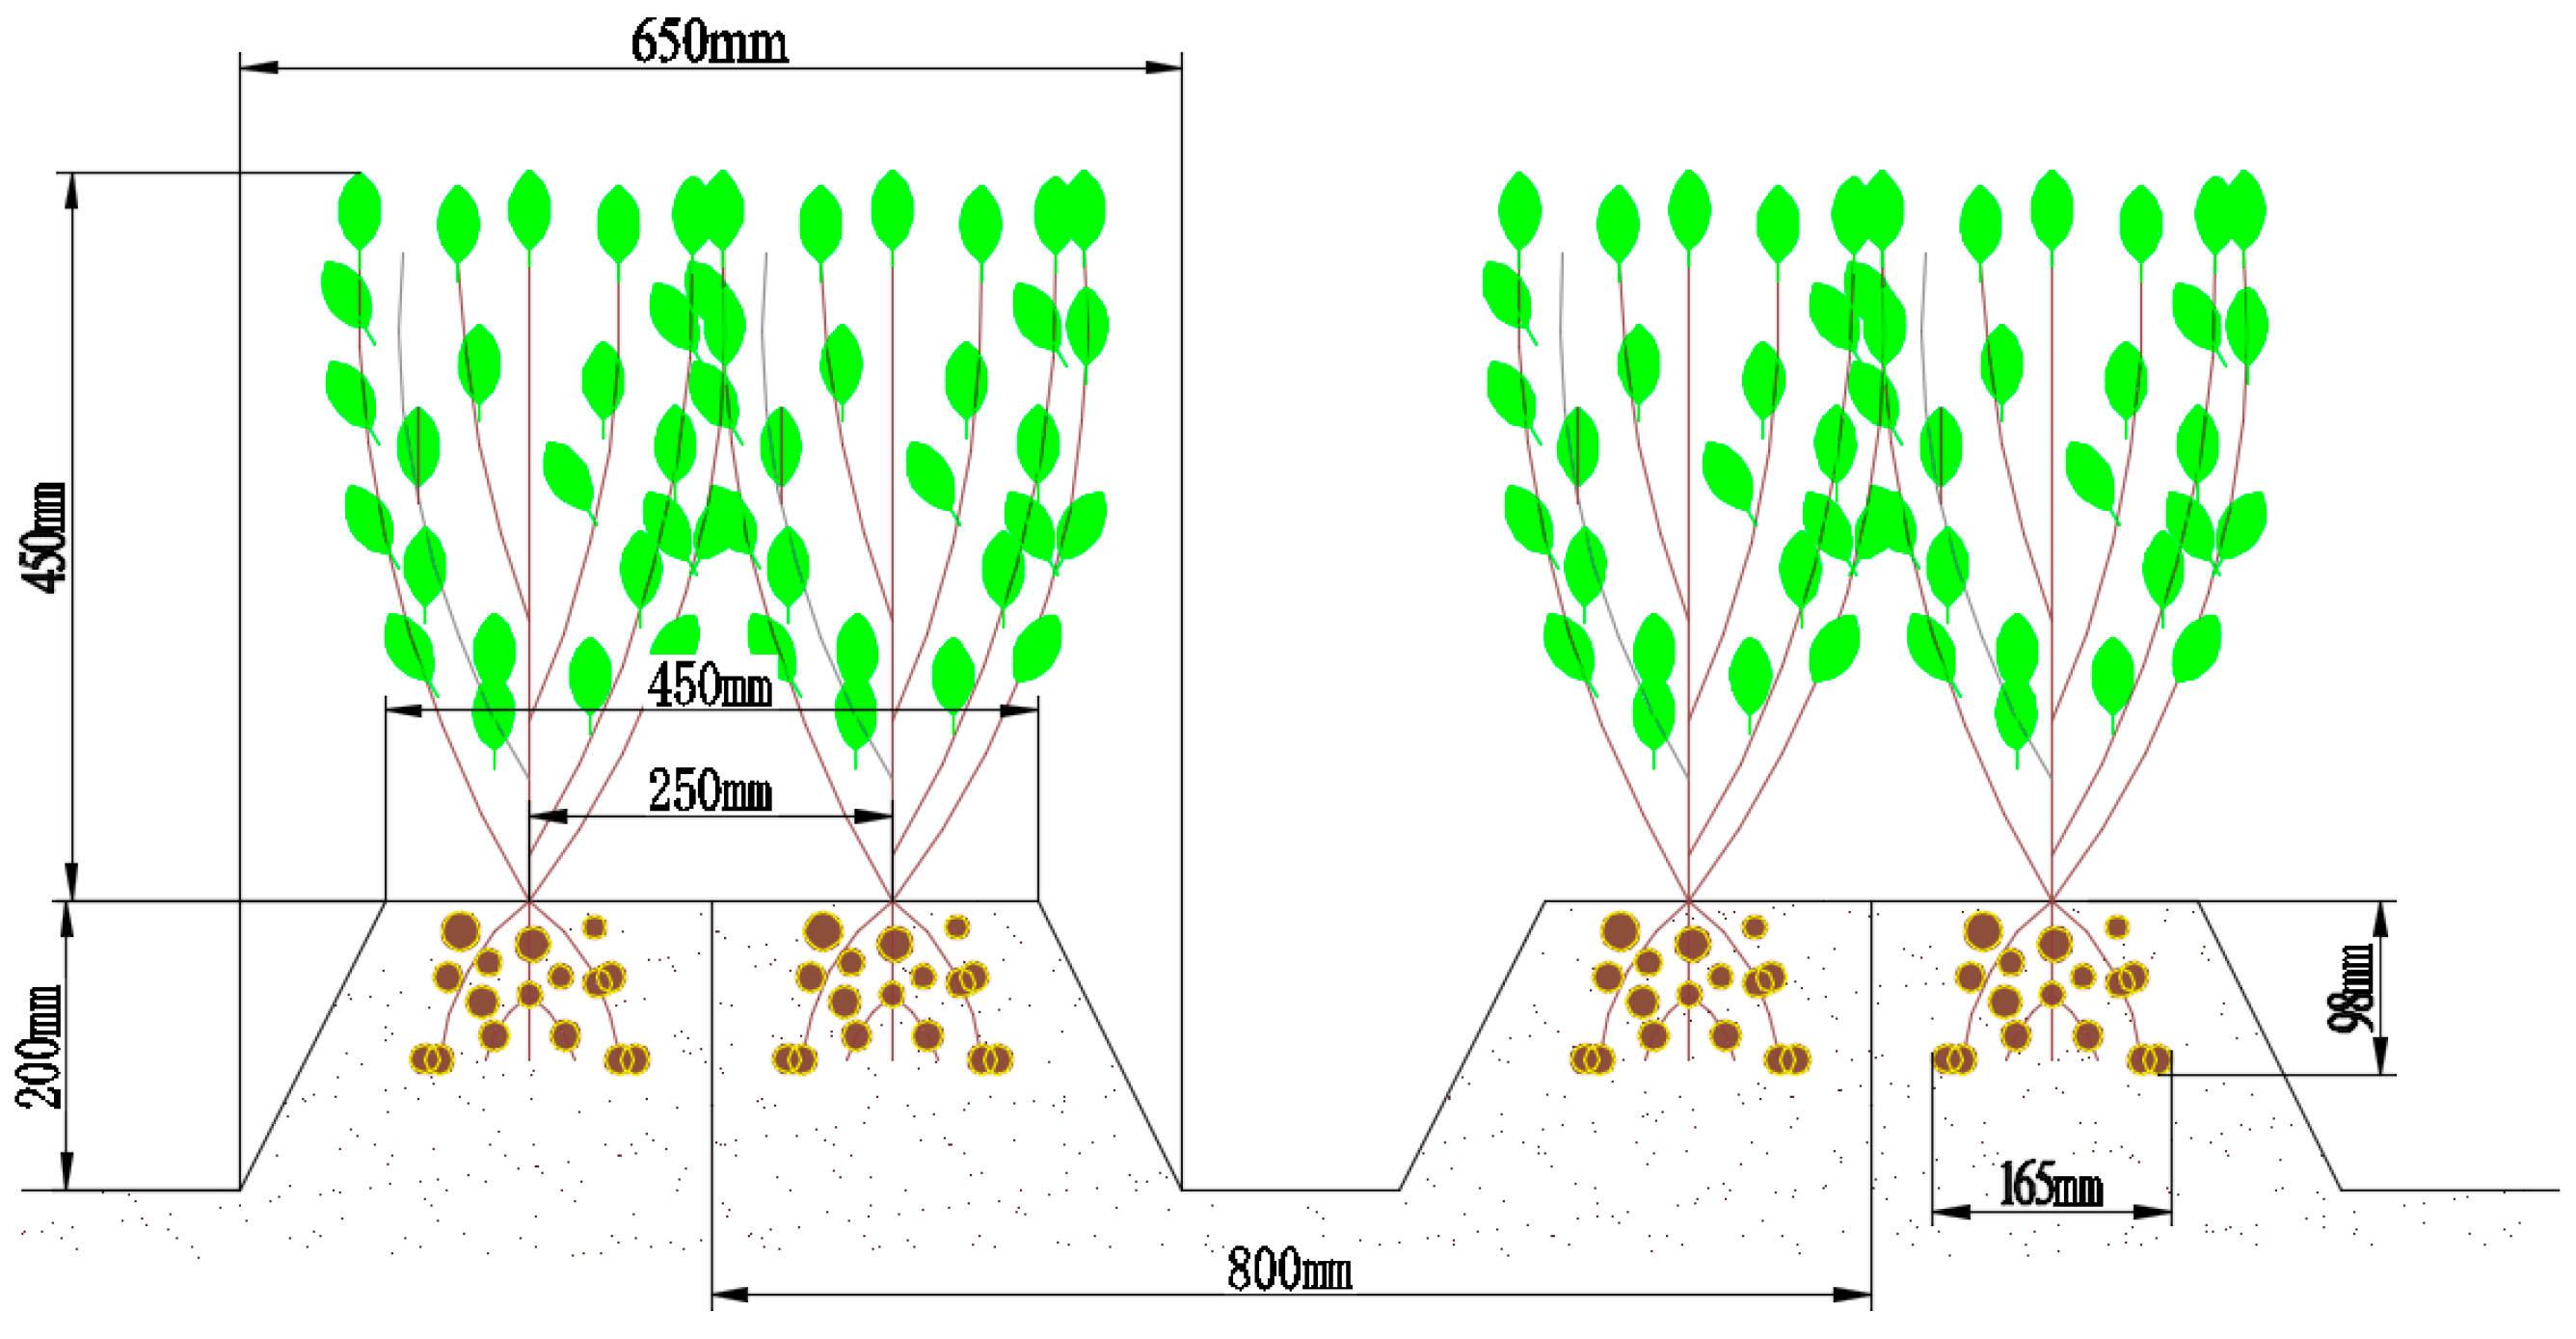
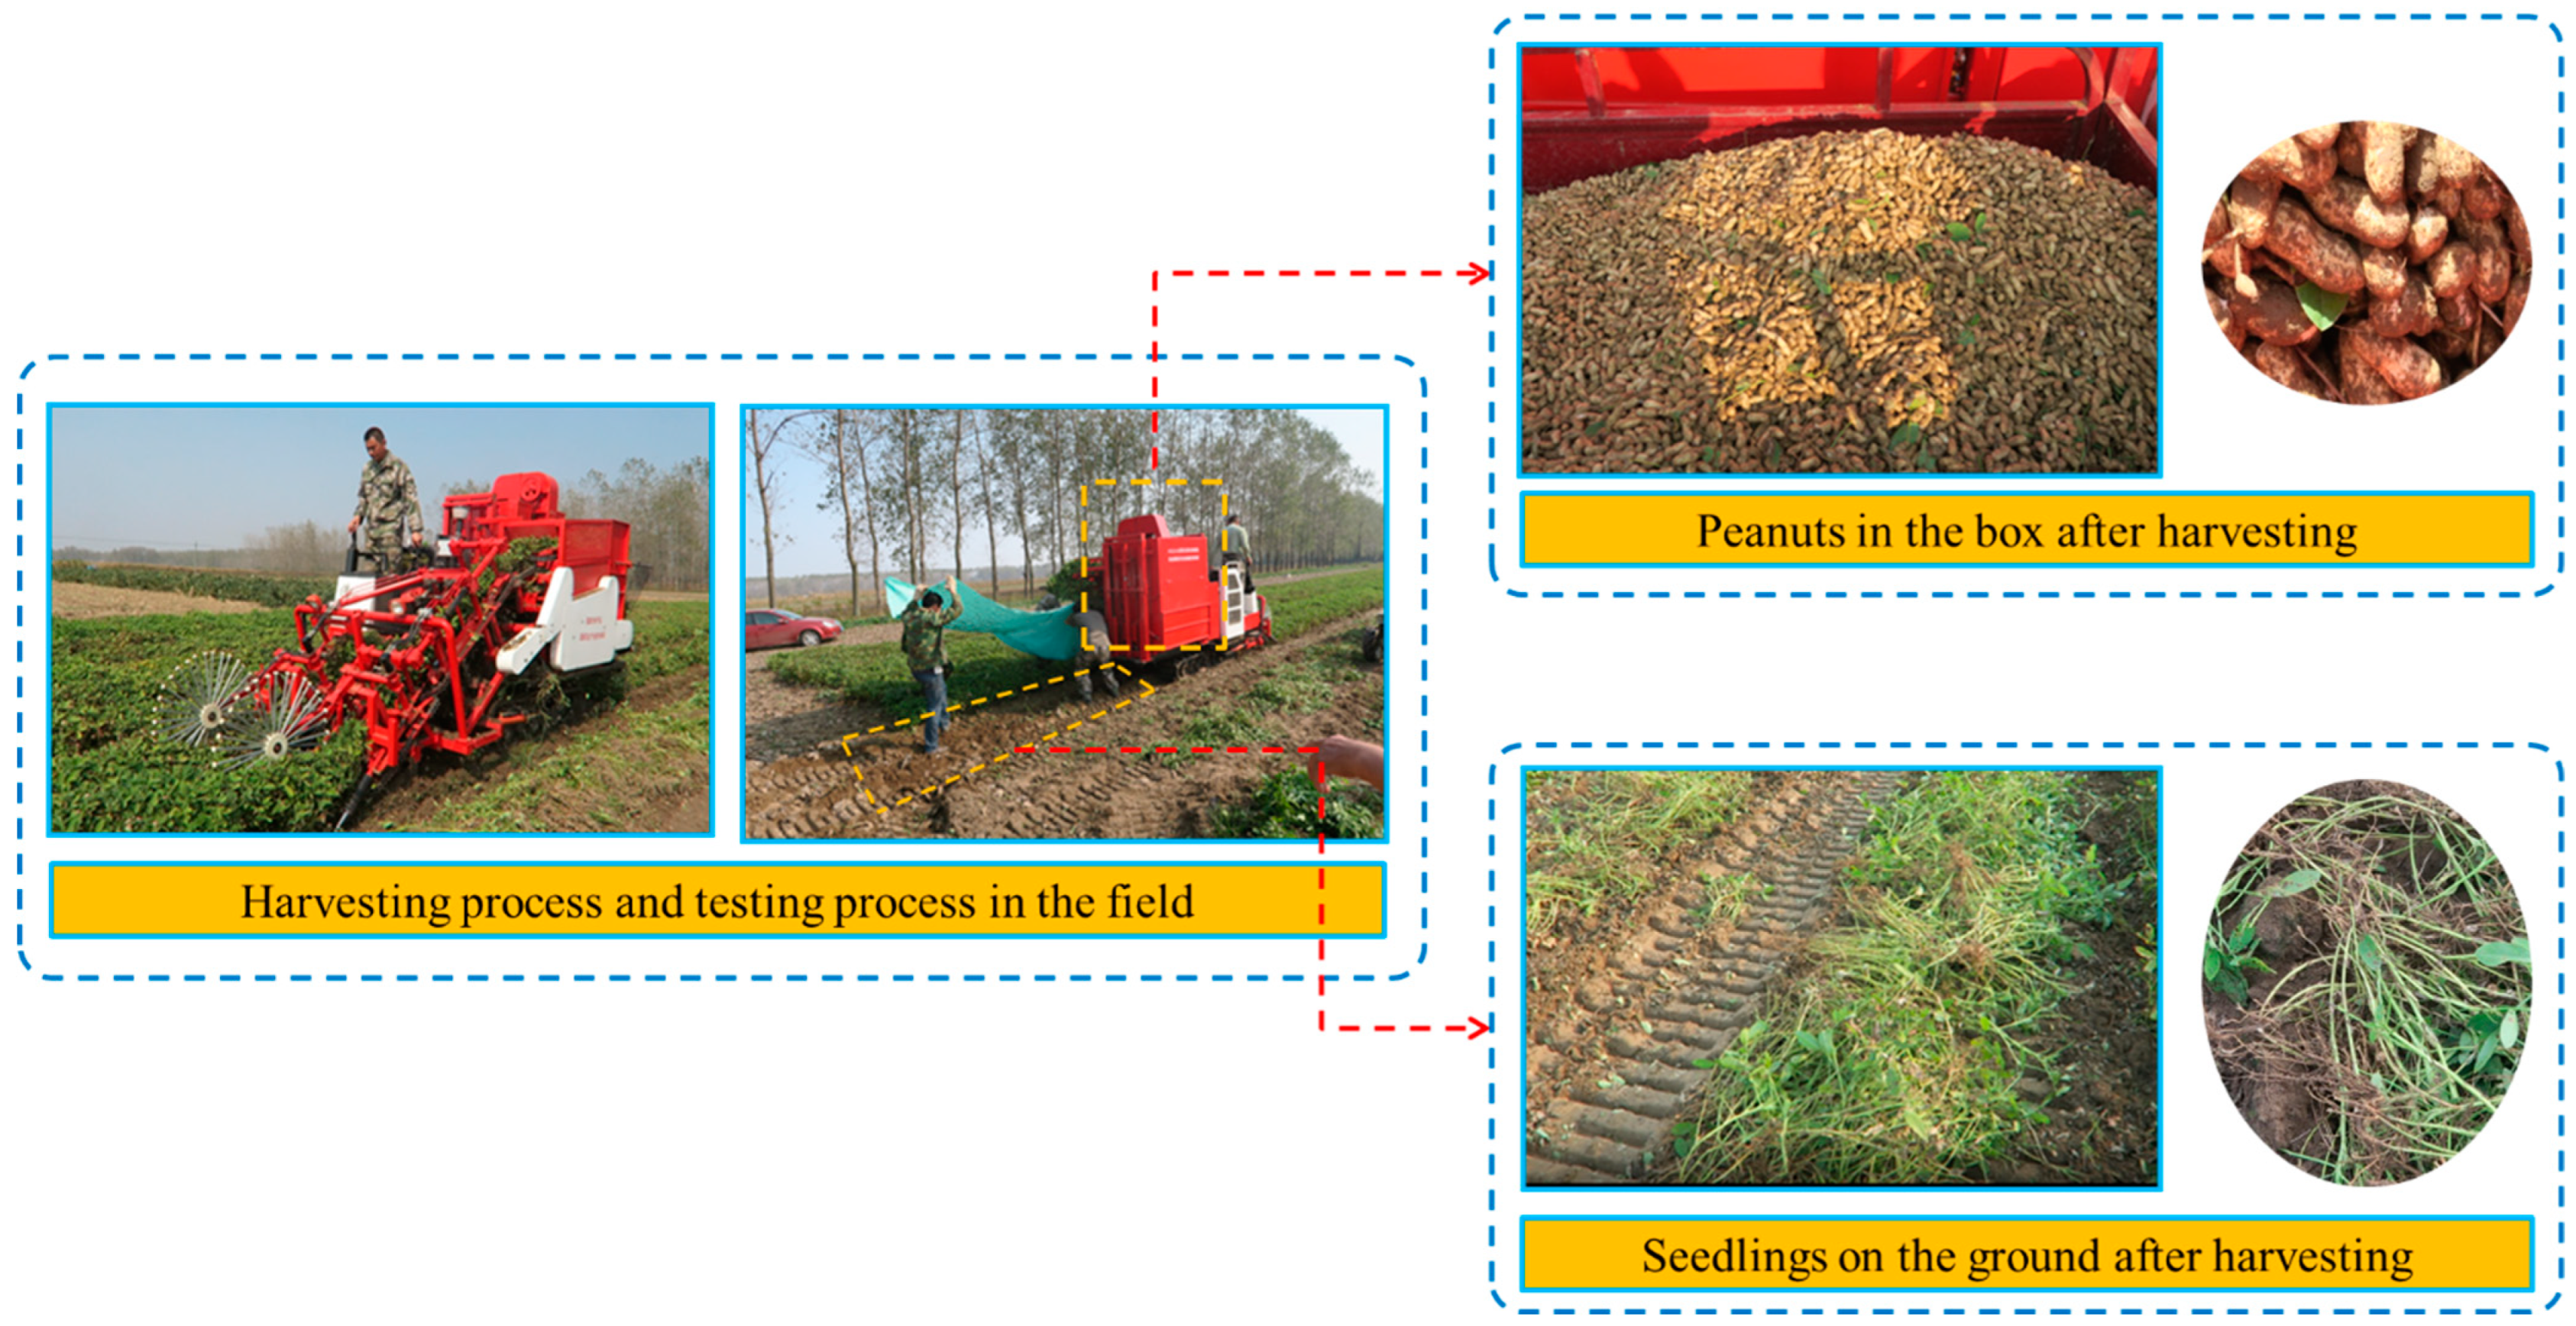
2.3.1. Experimental Conditions

Peanuts grown in the experimental field of the Nanjing Institute of Agricultural Mechanization, Ministry of Agriculture and Rural Affairs, were selected, and the variety was Yuhua 9. The soil type at the test site was sandy loam with a soil moisture content of 15%. The main growth characteristics of the peanut plants were as follows: a plot bottom width of 650 mm, plot surface width of 450 mm, plot height of 200 mm, plot spacing of 800 mm, row spacing of 250 mm, plant spacing of 216 mm, plant height of 450 mm, single-hole peanut distribution diameter of 165 mm, single-hole peanut distribution depth of 98 mm, and 32 peanuts per hole. The planting pattern was as shown in Figure 7.

2.3.2. Experimental Methodology

The soil moisture content in the test area was essentially the same as that in the test area, and the length of the test area was no less than 100 m. In the peanut combine harvester’s operating area, we randomly selected three plots for testing. Each plot had a length of 20 m, the operating width of the peanut harvester, and the forward speed of the machine was in accordance with the design requirements. In each plot, we randomly selected three small sampling areas with a length of 2 m and the same width as the machine’s operating width [22,23].
During the test, the peanut combine harvester’s engine rotated at 2000 rpm, and the forward speed could be adjusted by a speed lever. The plant clamping height was adjusted using a hydraulic cylinder to control the height of the harvesting table, while the peanut picking roller rotational speed and the cleaning sieve vibrational frequency were adjusted by changing the drive pulley.

2.3.3. Evaluation Indicators

The harvest loss rate and impurity rate are the most important performance indicators of peanut combine harvesters. We selected a test area with essentially the same soil moisture content as the measurement area, and the length of the measurement area was no less than 100 m. The peanut impurity rate and loss rate were measured by collecting materials on the surface of the screen body of the half-feed four-row peanut combine harvester, below the screen, and from the discharge outlet and the peanut collection box. The above evaluation indicators were calculated as follows:
(1)
Impurity rate
A sample of at least 2000 g was taken from each test plot, and the sample was processed to calculate the impurity rate according to Equation (6):
Y 1 = m 3 m 1 + m 2 + m 3 × 100
where Y1 is the percentage of impurities (%), m1 is the mass of kernels and peanuts in the sample with broken and cracked shells (g), m2 is the mass of good peanuts in the sample (g), and m3 is the mass of impurities in the sample (g).
(2)
Loss rate
We set a colored strip of cloth below the sieve and at the exit point of the row, gathered all of the peanuts on the cloth in the small sampling area, weighed their mass, collected the peanuts stuck or adhered to the surface of the sieve in the sampling area, and calculated the loss rate according to Equation (7):
Y 2 = m 4 + m 5 m 4 + m 5 + m 6 + m 7 + m 8 + m 9 × 100
where Y2 is the loss rate (%), m4 is the mass of the peanuts under the sieve and at the discharge point in the sampling area (g), m5 is the mass of the peanuts adhered to the sieve’s surface in the sampling area (g), m6 is the mass of the peanuts on the ground in the sampling area (g), m7 is the mass of the peanuts buried in the soil in the sampling area (g), m8 is the mass of the unpicked peanuts on the peanut plants in the sampling area (g), and m9 is the mass of the harvested peanuts in the sampling area (g).

3. Results

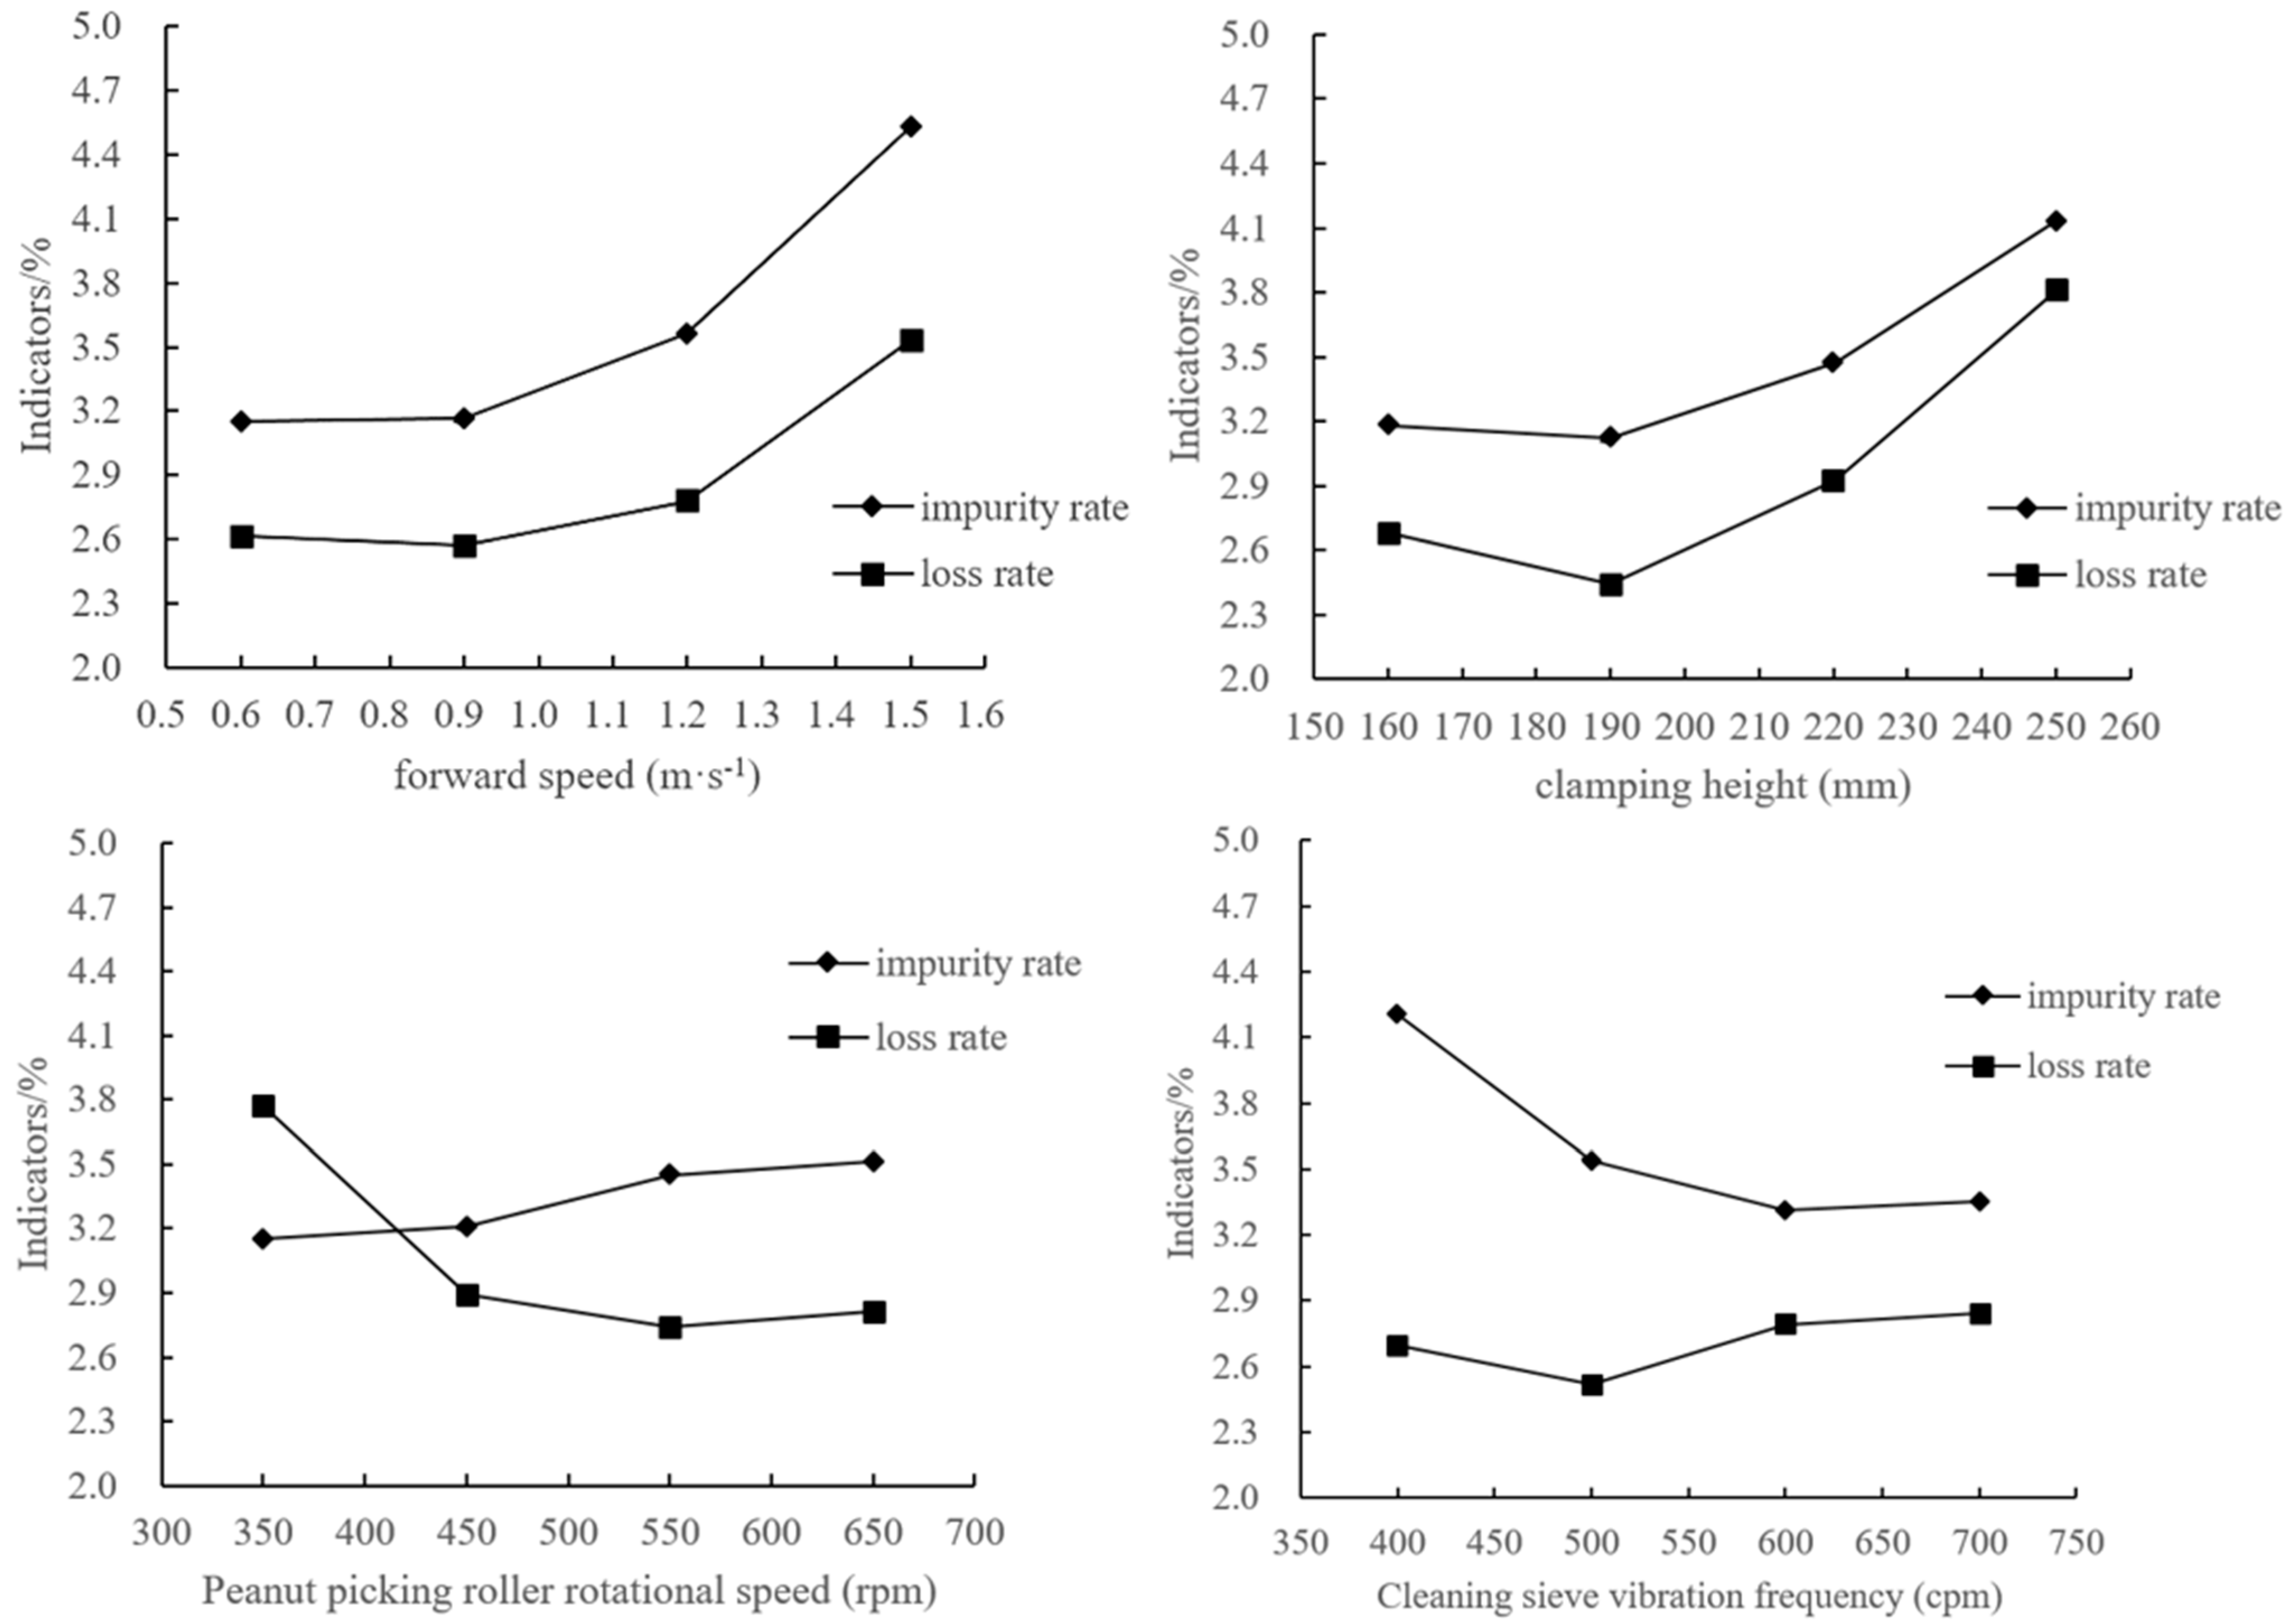
3.1. Single-Factor Tests

According to the above analysis and research, the forward speed v, clamping height H, peanut picking roller rotational speed r, and cleaning sieve vibrational frequency f had comprehensive impacts on the operational performance of the peanut harvester. To further optimize the above operational parameters, single-factor tests were conducted on these four parameters. The values of each factor level are shown in Table 1, while the test results are shown in Figure 8.
According to the single-factor test results, the cleaning sieve vibrational frequency, the clamping height, and the forward speed had relatively stronger influences on the impurity rate, while the speed of the peanut picking roller had less influence on the impurity rate. With the increase in the vibrational frequency of the cleaning sieve, the impurity rate showed an obvious trend of reduction, because the increase in the vibrational frequency improved the separation of the peanuts and miscellaneous materials, making the impurities easier to sieve down. The increase in the clamping height made it easier to remove the stems and leakage from the peanut roller brush in the peanut picking section but increased the difficulty of removing the broken branches. When the forward speed was too high, the rate of impurities was obviously increased, because the high speed made the direction control more difficult, with negative effects on the plots, the plant clamping was misaligned, scattered, and disorderly, resulting in more broken branches. Additionally, the harvesting volume increased significantly, as did the thickness of the peanut and miscellaneous materials on the sieve’s surface, which was difficult to fully break up, and the impurities were not easy to sieve down.
In terms of the loss rate performance indices, the peanut picking roller rotational speed, the clamping height, and the forward speed had significant impacts on the loss rate. If the speed of the peanut picking roller rotational speed was too low, the number of peanuts picked during the machine’s operation was insufficient, the peanuts were not picked cleanly, and the loss rate was high. The higher the speed of the peanut picking roller, the cleaner the peanut are picked, the smaller the peanut picking loss, so the loss rate is obviously reduced. When both the forward speed and the clamping height were increased, the impurity rate was significantly increased, because the high speed caused increased leakage from the clamped peanut plants, increasing the loss rate, while the excessive clamping height caused the peanut-picking system to miss parts of the peanut picking area, resulting in increased peanut unpicked losses. The cleaning sieve vibrational frequency has little effect on the loss rate.

3.2. Multifactor Tests

3.2.1. Experimental Protocol and Results

Based on the single-factor tests, a four-factor, three-level response surface test was conducted on the forward speed, clamping height, peanut picking roller rotational speed, and cleaning sieve vibrational frequency based on the Box–Behnken central combination design theory [24,25,26,27,28], with the impurity rate Y1 and loss rate Y2 as the response values. The four-factor, three-level quadratic regression orthogonal experimental design scheme was used to test and analyze the significance of the four main parameters affecting the impurity and loss rates and to obtain the response surface model of the significant test factors and evaluation indices. The test factors and level designs are shown in Table 2.
According to the four-factor, three-level analysis based on the Box–Behnken central combination design, the test protocol comprised 29 test points, including 24 analysis factors and five zero estimation errors, and the test protocol and response values are shown in Table 3.

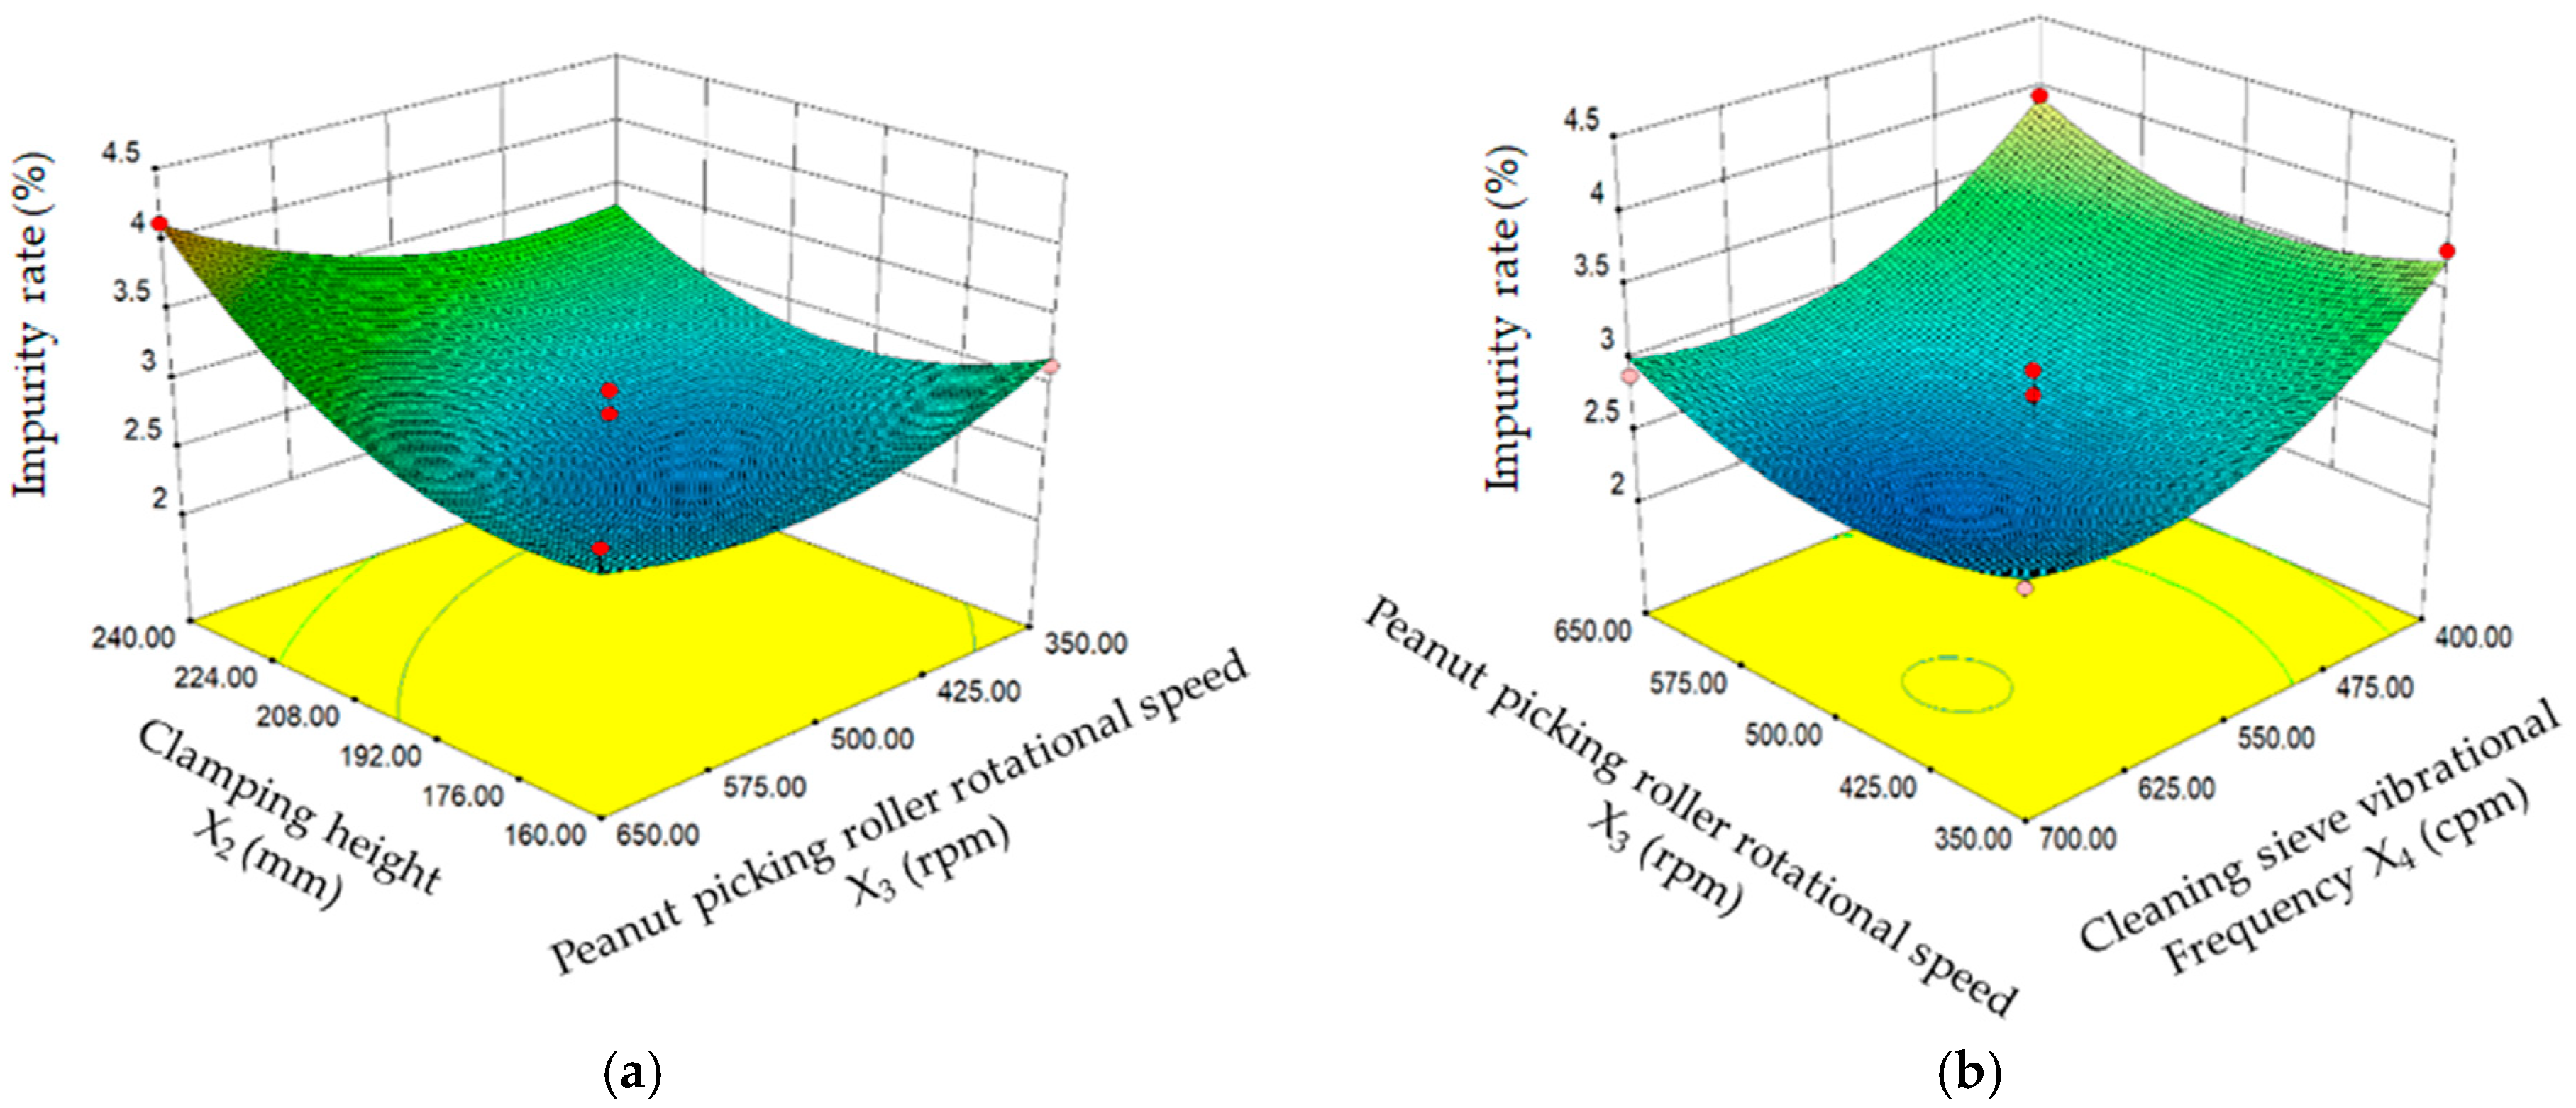
3.2.2. Analysis of Results
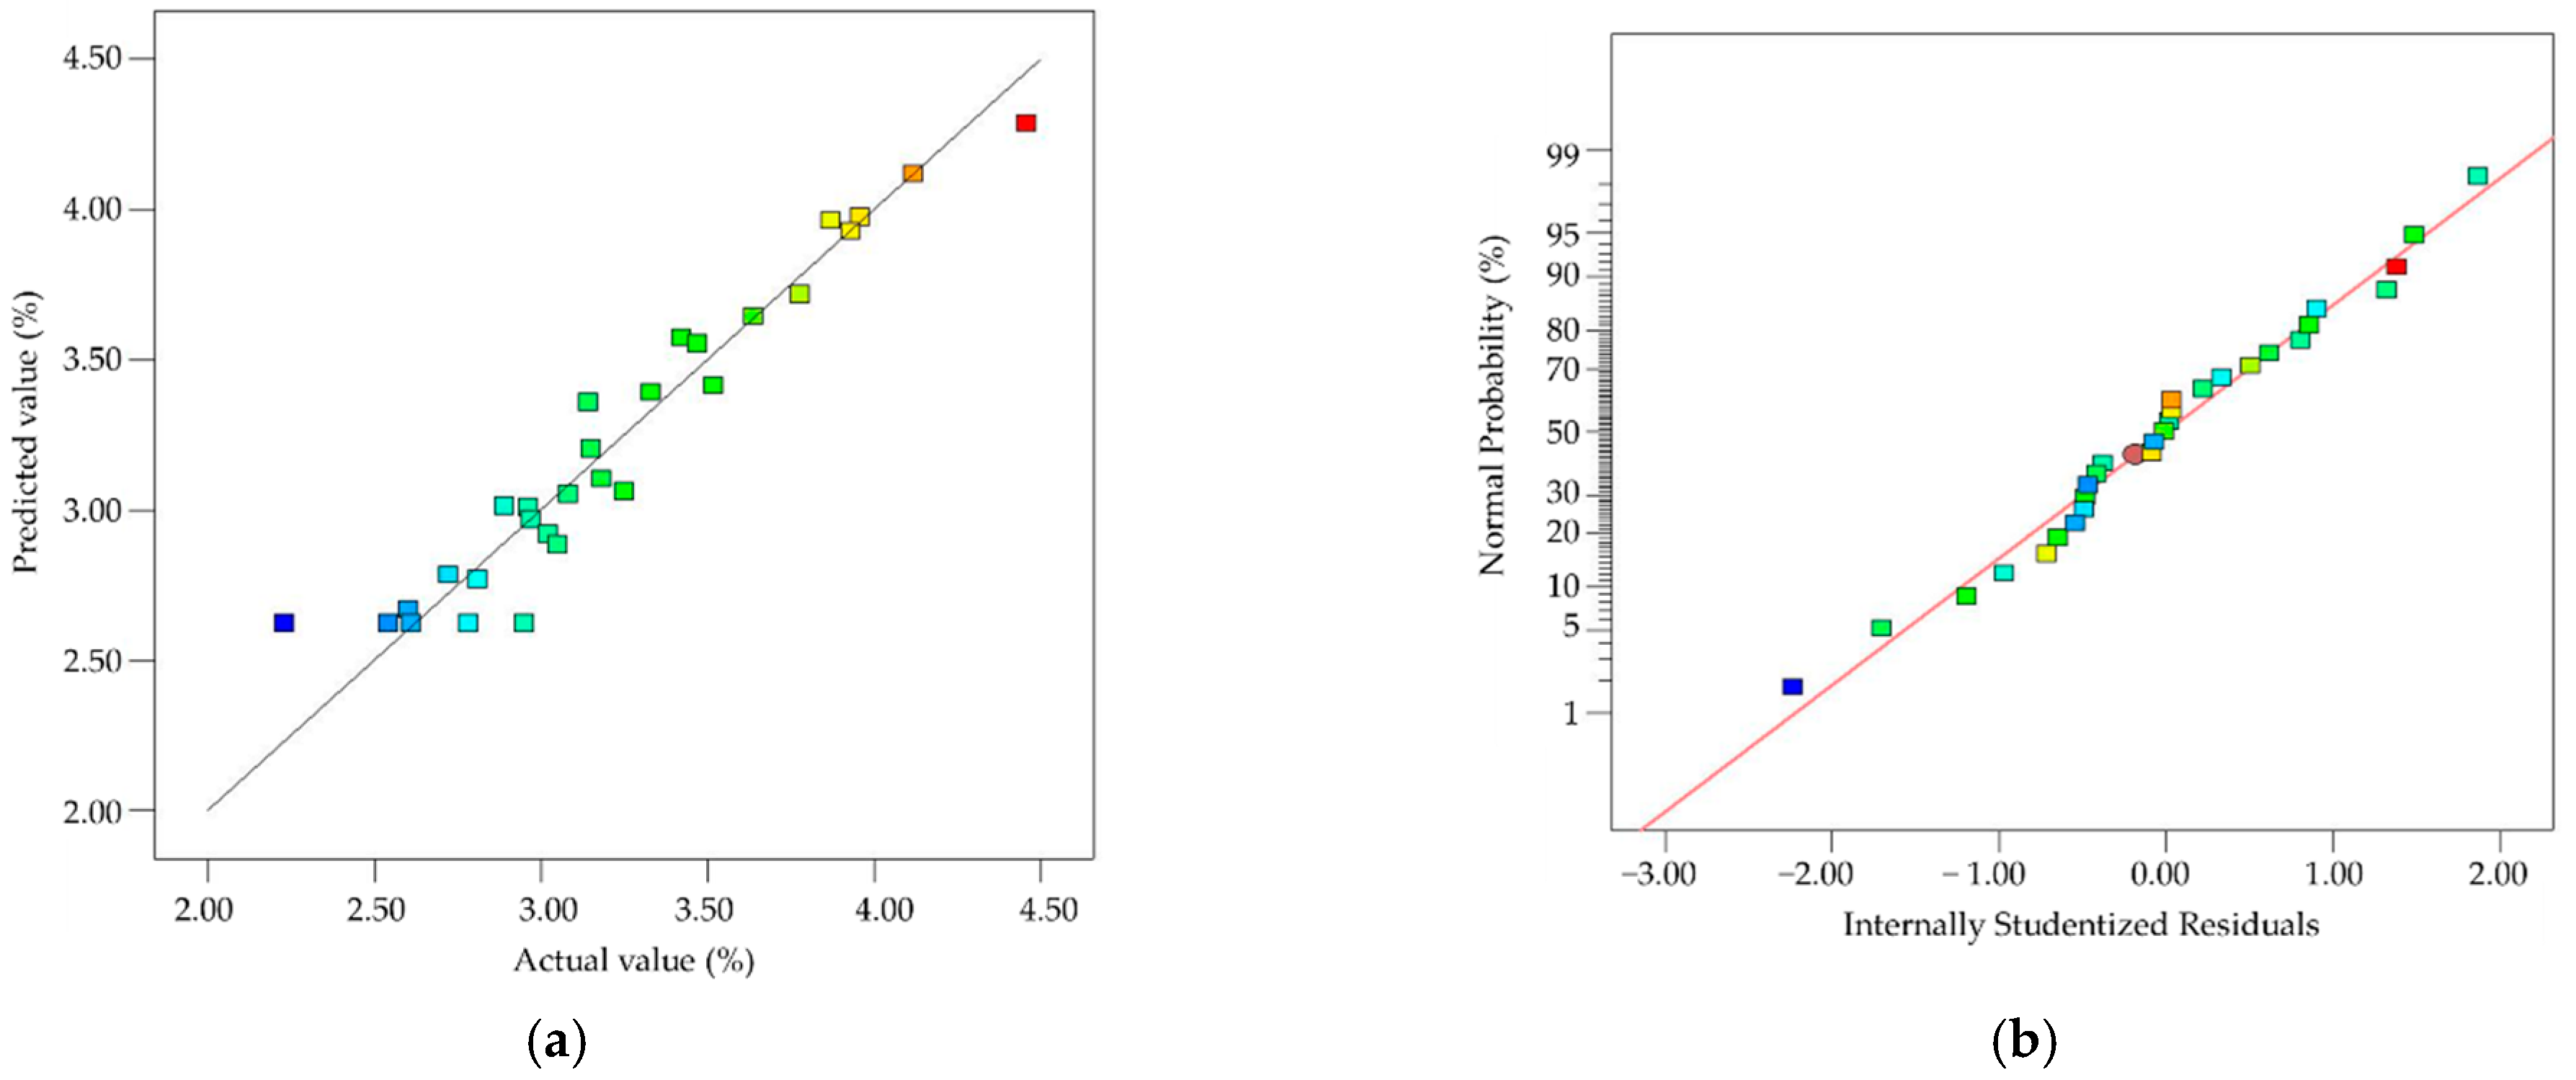
(1)
Establishment and significance test of the regression model of the impurity rate Y1
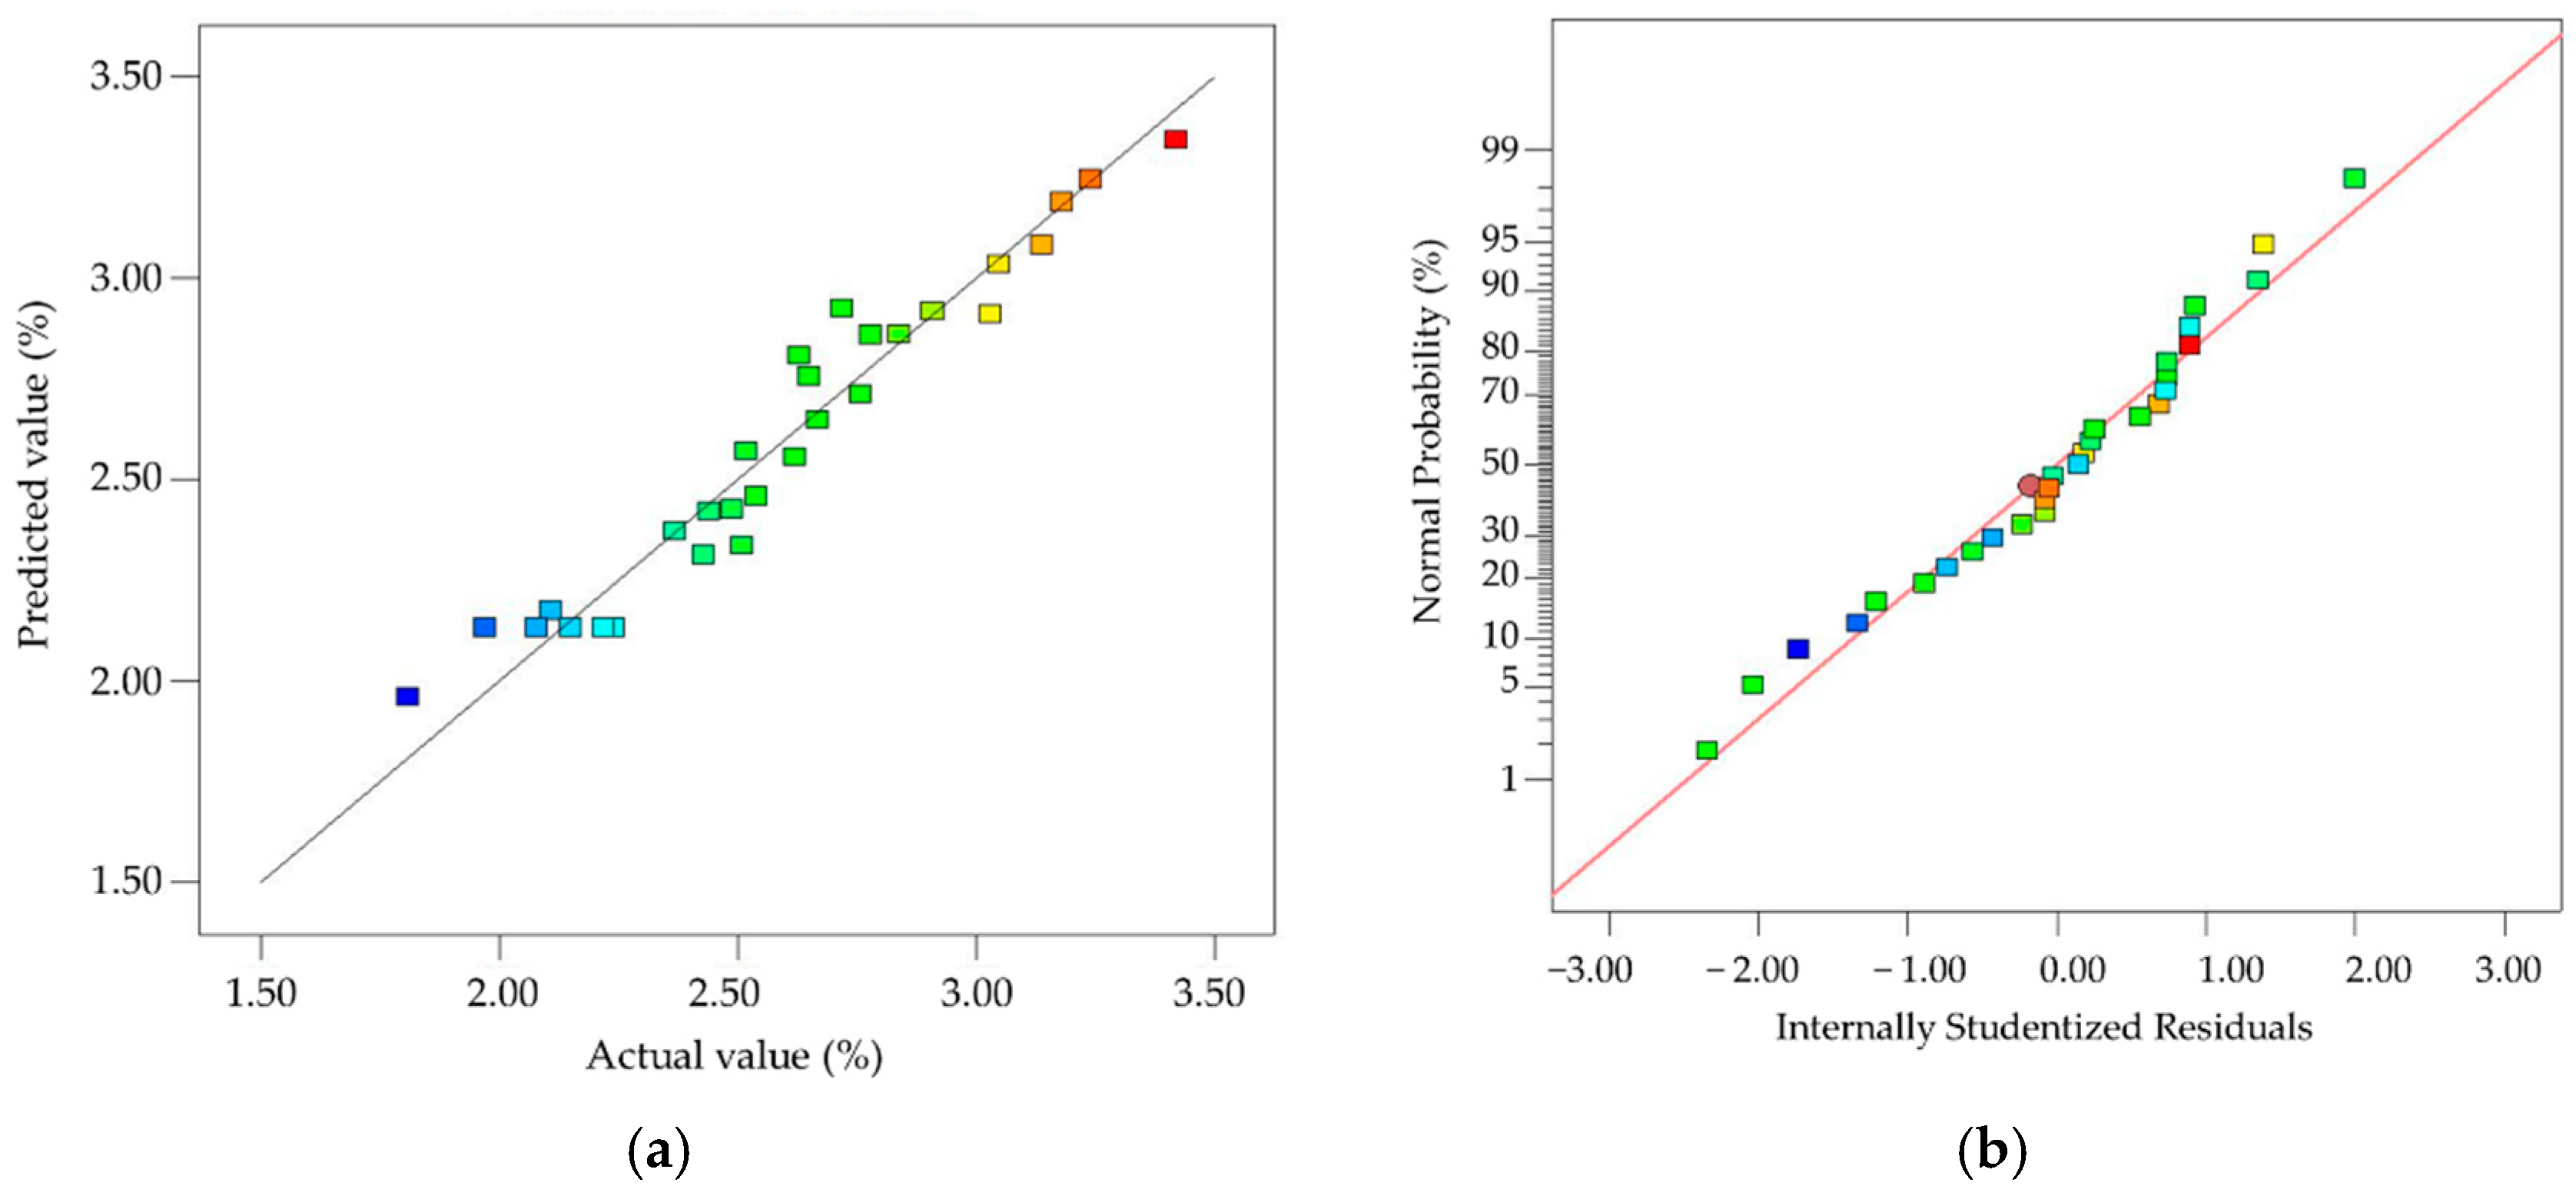
According to the experimental design and test results shown in Table 3, the Design-Expert.V8.0.6.1 data analysis software was used to establish a quadratic polynomial regression model of the impurity rate for the four independent variables of the forward speed, clamping height, peanut picking roller rotational speed, and cleaning sieve vibrational frequency, as shown in Equation (8). The significance test of the regression model is shown in Table 4.
Y 1 = 2 . 62 + 0 . 14 X 1 + 0 . 35 X 2 + 0 . 11 X 3 0 . 46 X 4 + 0 . 15 X 1 X 2 + 0 . 11 X 1 X 3 0 . 06 X 1 X 4 + 0 . 27 X 2 X 3 0 . 025 X 2 X 4 + 0 . 005 X 3 X 4 + 0 . 26 X 1 2 + 0 . 45 X 2 2 + 0 . 31 X 3 2 + 0 . 42 X 4 2
According to the analysis presented in Table 4, the response surface model’s p-value of <0.01 for the impurity rate demonstrates that the fit of this model is extremely significant. The lack-of-fit term of the Y1 model has a p-value > 0.05, and no lack-of-fit factor exists, indicating that the regression model can be used to analyze the results instead of the real points of the test. Figure 9a shows the analysis plot of the model-predicted values and the actual test values, showing that the predicted values were very close to the actual test values, indicating that the regression model is reliable. The coefficient of determination of the Y1 model was R2 = 93.04%, indicating that the model had only 6.96% variation and that the regression model showed a very good fit with the sample points. Figure 9b shows the residual analysis of the regression model. The vertical coordinates are the normally distributed probability of the residuals, while the horizontal coordinates are the standardized residual values. The residuals were mostly distributed in a straight line, indicating that the error of the regression model with respect to the impurity rate was normally distributed and that the regression model satisfied the requirements of the least-squares regression analysis method. Therefore, this model can be used to analyze and predict the impurity rate.
As shown in Table 4, the p-values of the clamping height speed and the peanut picking roller rotational speed were <0.01, and the p-values of the quadratic terms for the clamping height, cleaning sieve vibrational frequency, peanut picking roller rotational speed, and forward speed were all <0.01, indicating that the influences of the above factors on the impurity rate were extremely significant. The p-values of the interaction terms of the forward speed, clamping height, and peanut picking roller rotational speed were all <0.05, indicating that the influences of the above factors on the impurity rate were significant. The p-values of all of the other factors were >0.05, indicating no significant effects on the impurity rate Y1. From the regression coefficient analysis of each factor in the table, it can be seen that the order of importance of each factor was as follows: cleaning sieve vibration > clamping height > forward speed > peanut picking roller rotational speed.
Response surface plots were drawn using the Design-Expert.V8.0.6.1 software to visually describe the effects of the aforementioned factors on the waste content. Figure 10a shows the response surface plot between the clamping height and the peanut picking roller rotational speed when the forward speed and the cleaning sieve vibrational frequency were at the center level (X1 = 0, X4 = 0). It can be seen from Figure 10a that when X1 = 1.0 m/s and X4 = 600 cpm, the interaction between the clamping height and the peanut picking roller rotational speed was significant, and the impurity rate tended to increase with the increase in the clamping height and the peanut picking roller rotational speed. When the clamping height was greater than 200 mm, the impurity rate increased more rapidly with the increase in the picking roller rotational speed, because the increased clamping height caused the plant part of the stems to be below the clamps, and the length of the peanut plants below the clamping chain increased, meaning that they could easily be brushed off by the roller in the peanut picking section, increasing the difficulty of removing the broken branches, while the increased rotational speed of the peanut picking roller increased the intensity of the peanut picking, increasing the number of impacts, again making the peanut plants below the clamping chain easier to brush off, resulting in a significant increase in the rate of impurities.
Figure 10b shows the response surface plot between the peanut picking roller rotational speed and the cleaning sieve vibrational frequency when the forward speed and the clamping height were at the center level (X1 = 0, X2 = 0). From Figure 10b, it can be seen that when X1 = 1.0 m/s and X2 = 200 mm, the interaction between the peanut picking roller rotational speed and the cleaning sieve vibrational frequency was not significant, because the forward speed was moderate, the plant clamping was neat, and the clamping height was suitable, and the impurity rate showed a slow increasing trend with the increase in the picking roller rotational speed and with the decrease in the cleaning sieve vibrational frequency.
(2)
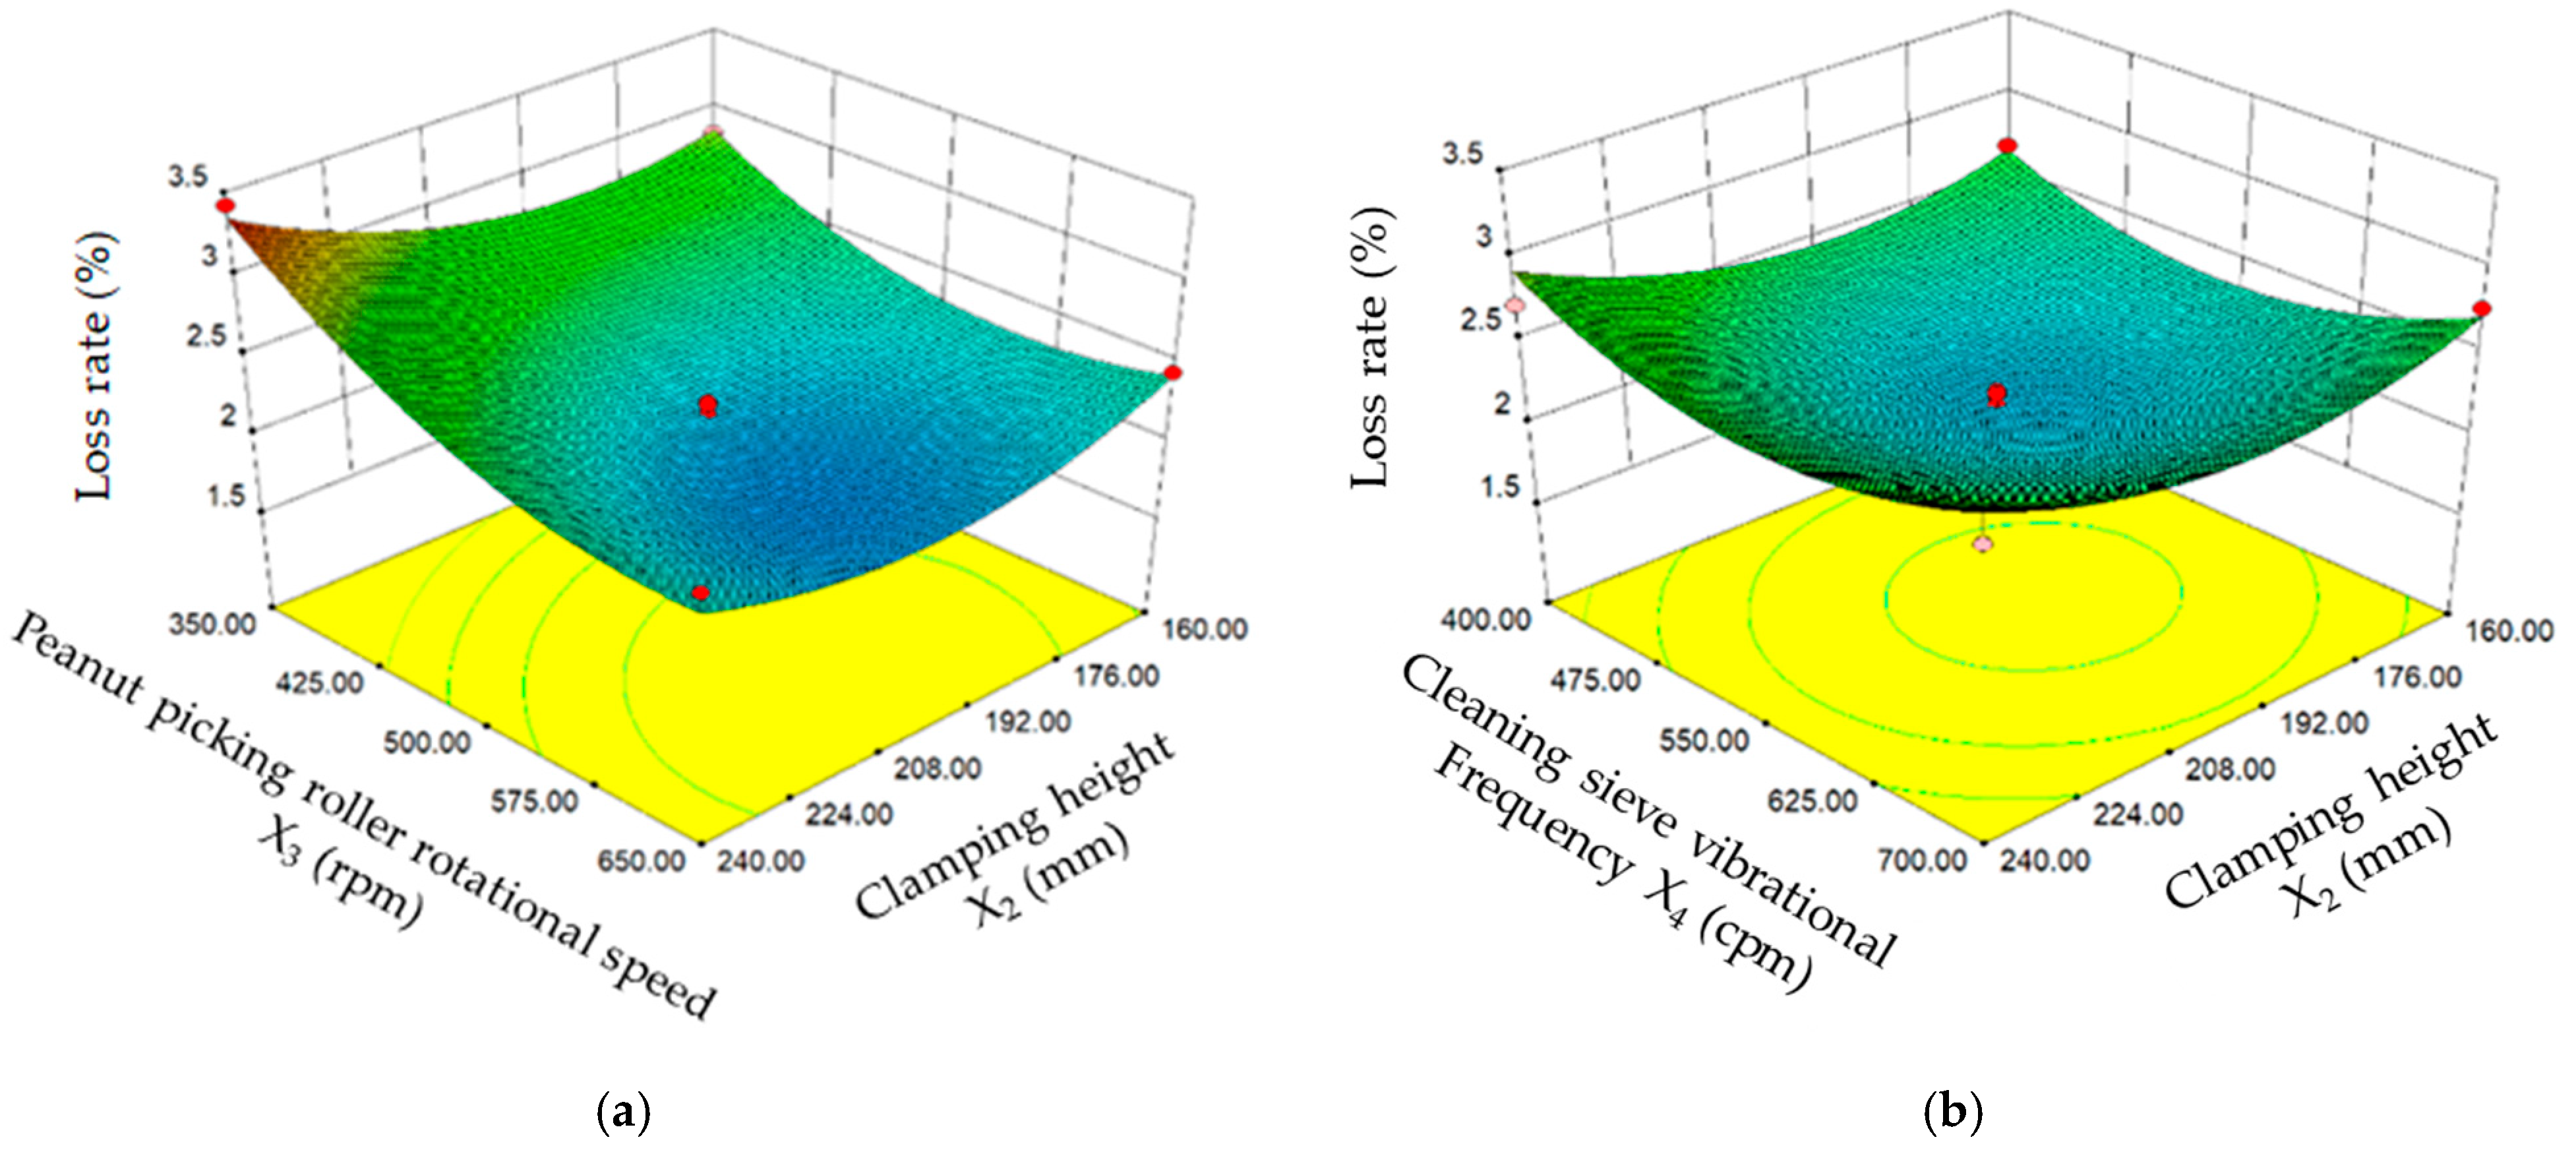
Establishment and significance test of the regression model of the loss rate Y2
According to the experimental design and test results shown in Table 3, a multiple regression fit was performed using the Design-Expert.V8.0.6.1 data analysis software to establish a quadratic polynomial regression model of the loss rate for the four independent variables of the forward speed, clamping height, peanut picking roller rotational speed, and cleaning sieve vibrational frequency, as shown in Equation (9). The significance test of the regression model is shown in Table 4.
Y 2 = 2 . 13 + 0 . 27 X 1 + 0 . 093 X 2 0 . 37 X 3 0 . 013 X 4 0 . 098 X 1 X 2 + 0 . 03 X 1 X 3 0 . 075 X 1 X 4 0 . 15 X 2 X 3 0 . 045 X 2 X 4 + 0 . 04 X 3 X 4 + 0 . 2 X 1 2 + 0 . 3 X 2 2 + 0 . 3 X 3 2 + 0 . 34 X 4 2
According to the analysis presented in Table 4, the response surface model’s p-value of <0.01 for the loss rate shows that the fit of this model is extremely significant. The lack-of-fit term has a p-value of > 0.05 for the Y2 model, and no lack-of-fit factor exists, indicating that the regression model can be used to analyze the results instead of the true points of the test. Figure 11a shows the analysis plot of the model-predicted values and the actual test values, and the predicted values were very close to the actual test values, indicating that the regression model is reliable. The coefficient of determination R2 = 94.28% for the Y2 model indicates that the model had only 5.72% variation, and the regression model showed a very good fit with the sample points. Figure 11b shows the residual analysis of the regression model. The vertical coordinates are the normally distributed probability of the residuals, while the horizontal coordinates are the standardized residual values. The residuals were mostly distributed in a straight line, indicating that the error of the regression model with respect to the loss rate was normally distributed and that the regression model satisfied the requirements of the least-squares regression analysis method. Therefore, this model can be used for the analysis and prediction of the loss rate.
As shown in Table 4, the p -values of the forward speed and the peanut picking roller rotational speed were <0.01, and the p-values of the quadratic terms for the forward speed, peanut picking roller rotational speed, clamping height, and cleaning sieve vibrational frequency were all <0.01, indicating that the above factors had significant effects on the loss rate. The p-values of the interaction terms of the clamping height and peanut picking roller rotational speed were <0.05, indicating that these factors had significant effects on the loss rate. The p-values of the cleaning sieve vibrational frequency were >0.05, indicating that they did not have significant effects on the loss rate. From the regression coefficient analysis of the factors in the table, it can be seen that the order of importance of each factor was as follows: peanut picking roller rotational speed > forward speed > clamping height > cleaning sieve vibrational frequency.
Design-Expert.V8.0.6.1 software was used to draw response surface plots so as to visually describe the effects of the aforementioned factors on the waste content. Figure 12a shows the response surface plot between the clamping height and the peanut picking roller rotational speed when the forward speed and the cleaning sieve vibrational frequency were at the center level (X1 = 0 and X4 = 0). As can be seen from Figure 12a, when X1 = 1.0 m/s and X4 = 600 cpm, the interaction between the clamping height and the peanut picking roller rotational speed was significant, and the loss rate Y2 showed a trend of decreasing and then increasing with the increase in the clamping height and increasing with the decrease in the picking roller rotational speed. This is because when the clamping height was too high, some of the peanut plants were not in the peanut picking area, increasing the loss rate. When the clamping height was greater than 200 mm, the loss rate increased rapidly with the decrease in the picking roller rotational speed, because when the clamping was too high and the peanut picking roller rotational speed was too low, part of the peanut plants were not within the effective striking range, and the striking intensity was too low, meaning that part of the peanut plants were missed by the roller, increasing the loss rate.
Figure 12b shows the response surface plot between the clamping height and the cleaning sieve vibrational frequency when the forward speed and the picking roller rotational speed were at the center level (X1 = 0, X3 = 0). From Figure 12b, it can be seen that when X1 = 1.0 m/s and X3 = 500 rpm, the interaction between the clamping height and the peanut picking roller rotational speed was not significant, and the loss rate showed a slow changing trend with the increase in the clamping height and with the decrease in the cleaning sieve vibrational frequency, and the change trend was not obvious. Combining Table 4 and Figure 10, the cleaning sieve vibrational frequency does not have a significant effect on the loss rate, because the role of the cleaning sieve is to remove impurities. The cleaning sieve vibrational frequency affects the cleaning effect on the peanuts and the size of the impurity rate but does not cause any additional loss of peanuts during the cleaning process.

3.2.3. Multi-Objective Parameter Synthesis, Optimization, and Analysis

The analysis of the effect of each factor shows that the factors and their interactions had different influences on the measurement indices. In order to identify the best combination of parameters for the peanut combine harvester, the influence of each factor on the measurement indices needed to be considered comprehensively. Therefore, multi-objective parameter optimization was carried out.
The optimization study of each parameter of the peanut combine harvester was carried out with the lowest impurity rate and the lowest loss rate as the optimization objectives. The objective function and the constraints of the parameter variables were established, as shown in Equation (10). The optimization solution module of the Design-Expert data analysis software was used to optimally solve the regression model for the two established indicators, and the optimal operating parameters of the snapping finger sieve were obtained as follows: a forward speed of 0.85 m/s, clamping height of 188 mm, peanut picking roller rotational speed of 548 rpm, and cleaning sieve vibrational frequency of 581 cpm. Under these conditions, the impurity rate was 2.53% and the loss rate was 1.97%.
{ min Y 1 ( X 1 , X 2 , X 3 , X 4 ) min Y 2 ( X 1 , X 2 , X 3 , X 4 ) 1 ( 0.7 m / s ) X 1 1 ( 1.3 m / s ) 1 ( 160 mm ) X 2 1 ( 240 mm ) 1 ( 400 rpm ) X 3 1 ( 600 rpm ) 1 ( 500 cpm ) X 4 1 ( 700 cpm )

3.2.4. Experimental Validation

In order to verify the accuracy of the above model predictions, the optimized combination of parameters was applied to the peanut test field of the Nanjing Institute of Agricultural Mechanization, Ministry of Agriculture and Rural Affairs, for experimental verification. The test time was September 2021, the test variety was Yuhua 9, the soil type was sandy loam, and the soil moisture content was around 15%. The growth characteristics and planting pattern of peanut plants were the same as those described in 2.3.1, and we used the same four-row semi-feed peanut combine harvester. The experimental process is shown in Figure 13. The test was repeated 10 times. Considering the feasibility and operability of the test, the optimal working parameters were revised as follows: a forward speed of 0.85 m/s, clamping height of 190 mm, peanut picking roller rotational speed of 550 rpm, and cleaning sieve vibrational frequency of 590 cpm.
By analyzing the results in Table 5, it can be seen that the relative error between the experimental value and the optimized model value of the impurity rate Y1 was 3.5%, while the relative error between the experimental value and the optimized model value of the loss rate Y2 was 4.1%, the relative error between both sets of experimental values and optimized model values was less than 5%. Therefore, the above parameter optimization model was accurate, and using the above combination of optimal working parameters (forward speed of 0.85 m/s, clamping height of 190 mm, peanut picking roller rotational speed of 550 rpm, and cleaning sieve vibrational frequency of 590 cpm) can effectively reduce the impurity rate and loss rate, with our results showing an impurity rate of 2.62% and a loss rate of 2.05%.

4. Conclusions

In this paper, we described the main structure and technical process of a 4HLB-4 semi-feed four-row peanut combine harvester, determined the key parameters affecting the harvest quality, and carried out single-factor and multi-factor experimental research. The results show that the cleaning sieve vibrational frequency, clamping height, and forward speed had significant effects on the impurity rate. The peanut picking roller rotational speed, clamping height, and forward speed had significant effects on the loss rate. The cleaning sieve vibrational frequency did not have a significant effect on the loss rate, but the vibration frequency had a very significant effect on the impurity rate. The impurity rate is an important operating index of peanut harvesters. In order to improve the adaptability and reliability of the optimization results, the factor of the cleaning sieve vibrational frequency must be considered when optimizing the impurity rate and loss rate.
Tests assessing the trends in the influences of the forward speed, clamping height, peanut picking roller rotational speed, and cleaning sieve vibrational frequency on the operating quality of the peanut harvester were conducted. A quadratic polynomial regression model was established for the impurity rate and loss rate with respect to these four factors, and these can be used as theoretical models for the optimal design of the peanut harvester. The optimal combination of parameters for the peanut harvester was obtained as 0.85 m/s forward speed of 0.85 m/s, clamping height of 190 mm, 550 rpm peanut picking roller rotational speed of 550 rpm, and cleaning sieve vibrational frequency of 590 cpm. Under these conditions, the impurity rate of 2.62% and the loss rate of 2.05% were obtained, which effectively reduced the impurity rate and loss rate and met the quality requirements of Chinese peanut mechanized harvesting operations. This provided a basis for the optimization of the operating parameters of the peanut harvester.
Due to the harvesting period and base conditions, in this paper, we only carried out experimental research on peanut fields for specific cultivars, planting patterns, soil types, and a specific soil water content, and research has not yet been carried out experiments under other conditions, such as different peanut cultivars, planting patterns, soil types, soil water contents, and harvesting periods, etc. Therefore, these studies should be carried out in a comprehensive manner in subsequent research on semi-feed four-row high-efficiency peanut combine harvesters.

Author Contributions

Conceptualization, Q.W., Y.Z. and Z.Y.; methodology, J.L., B.P. and B.W.; software, Q.W., J.L. and Z.Y.; validation, Y.Z.; formal analysis, B.P. and B.W.; investigation, Z.H. and J.L.; resources, Q.W. and Z.Y.; data curation, Q.W., B.W., Y.Z. and Z.Y.; writing—original draft preparation, Q.W., Y.Z. and Z.Y.; writing—review and editing, Q.W., Y.Z. and Z.Y.; visualization, B.P. and J.L.; supervision, Q.W., Y.Z. and Z.Y.; project administration, Y.Z., B.W., B.P. and Z.H.; funding acquisition, Q.W., Y.Z. and Z.Y. All authors have read and agreed to the published version of the manuscript.

Funding

The research was jointly supported by the National Natural Science Foundation of China (52105263), the Jiangsu Modern Agricultural Machinery Equipment and Technology Demonstration and Extension (NJ2021-22), the China Agriculture Research System for Peanut (grant No. CARS-14-Mechanized Equipment).

Data Availability Statement

The data collected in this research are available upon reasonable request.

Conflicts of Interest

The authors declare no conflict of interest.

References

  1. Hu, Z.C. Study on Key Technologies of Half-Feed Peanut Combine Harvester. Ph.D. Thesis, Nanjing Agricultural University, Nanjing, China, 2011. [Google Scholar]
  2. Chen, Z.Y.; Gao, L.X.; Chen, C.; Butts, C.L. Analysis on Technology Status and Development of Peanut Harvest Mechanization of China and the United States. J. Chin. Agric. Mech. 2017, 48, 1–21. [Google Scholar]
  3. Gao, L.X.; Chen, Z.Y.; Chen, C.; Butts, C.L. Development course of peanut harvest mechanization technology of the United States and enlightenment to China. Trans. Chin. Agric. Eng. 2017, 33, 1–9. [Google Scholar]
  4. Shang, S.Q.; Li, G.Y.; Yang, R.B.; Sun, T.Z.; Wang, Y.Y.; Lian, G.Z. Development of 4HQL-2 type whole-feed peanut combine. Trans. Chin. Agric. Eng. 2009, 25, 125–130. [Google Scholar]
  5. Wang, D.W.; Shang, S.Q.; Han, K. Design and test of picking mechanism in 4HJL-2 peanut combines. Trans. Chin. Agric. Eng. 2013, 29, 15–25. [Google Scholar]
  6. Wang, D.W.; Shang, S.Q.; Zhao, D.J.; Zhu, H.J. Type-4HBL-4 two-ridges and four-lines semi-feeding self-propelled peanut combine harvester. J. Chin. Agric. Mech. 2013, 44, 86–92. [Google Scholar]
  7. Hu, Z.C.; Peng, B.L.; Yin, W.Q.; Wang, H.O.; Tian, L.J.; Hu, L.L. Design of 4LH2 type half-feed and self-propelled peanut combine. Trans. Chin. Agric. Eng. 2008, 24, 148–153. [Google Scholar]
  8. Zhang, Y.H.; Hu, Z.C.; Peng, B.L.; Zhang, J.; Shen, C. Design of 4HLB-4 type semi-feeding peanut combine. Int. Agric. Eng. J. 2018, 27, 80–86. [Google Scholar]
  9. Hu, Z.C.; Wang, H.O.; Wang, J.N.; Hu, L.L.; Tian, L.J.; Zhong, T. Experiment on 4HLB-2 Type half Feed peanut combine harvester. J. Chin. Agric. Mech. 2010, 41, 79–84. [Google Scholar]
  10. Hu, Z.C.; Wang, H.O.; Peng, B.L.; Chen, Y.Q.; Wu, F.; Zhang, Y.H. Optimized design and experiment on semi-feeding peanut picking device. J. Chin. Agric. Mech. 2012, 43, 131–136. [Google Scholar]
  11. Zhang, Y.H.; Tan, L.K. Design and test of semi-feeding test-bed for peanut pod picking. Trans. Chin. Agric. Eng. 2017, 33, 42–50. [Google Scholar]
  12. Shi, L.; Wang, B.; Hu, Z.; Yang, H. Mechanism and Experiment of Full-Feeding Tangential-Flow Picking for Peanut Harvesting. Agriculture 2022, 12, 1448. [Google Scholar] [CrossRef]
  13. Wang, B.K.; Gu, F.W.; Cao, M.Z.; Xie, H.; Wu, F.; Peng, B.; Hu, Z. Analysis and Evaluation of the Influence of Different Drum Forms of Peanut Harvester on Pod-Pickup Quality. Agriculture 2022, 12, 769. [Google Scholar] [CrossRef]
  14. Wang, D.W.; Shang, S.Q.; Han, K. Design and test of 4HJL-2 harvester for peanut picking-up and peanut-picking. Trans. Chin. Agric. Eng. 2013, 29, 27–36. [Google Scholar]
  15. Gao, L.X.; Su, Z.; Chen, Z.Y.; Liu, Z.X.; Lü, C.Y. Design and experiment of double-roller semi-feeding peanut picking device for breeding in mini type area. J. Chin. Agric. Mech. 2016, 47, 93–98. [Google Scholar] [CrossRef]
  16. Guan, M.; Chen, Z.Y.; Gao, L.X.; Liu, Z.X.; Cheng, J.; Zhang, X.D. Multifunctional modular full-feeding peanut picking testing device. J. Chin. Agric. Mech. 2015, 46, 88–94. [Google Scholar]
  17. Chen, Z.Y.; Guan, M.; Gao, L.X.; Chen, L.J.; Ma, F.; Dong, H.S. Design and test on axial flow peanut picking device with screw bending-tooth. J. Chin. Agric. Mech. 2016, 47, 106–113. [Google Scholar] [CrossRef]
  18. Gao, L.X.; Li, X.Q.; Guan, M.; Chen, J.; Zhang, X.D.; Liu, Z.X. Design and test on cleaning device of peanut pods with double air-suction inlets with vibration screen. J. Chin. Agric. Mech. 2015, 46, 110–117. [Google Scholar]
  19. Wang, B.; Hu, Z.C.; Peng, B.L.; Zhang, Y.H.; Gu, F.W.; Shi, L.L.; Gao, X.M. Structure operation parameter optimization for elastic steel pole oscillating screen of semi-feeding four rows peanut combine harvester. Trans. Chin. Agric. Eng. 2017, 33, 20–28. [Google Scholar]
  20. Johnson, J.K. Contact Mechanics; Cambridge University Press: London, UK, 1985. [Google Scholar]
  21. Kanafojski, C.; Karwowski, T. Corp-Harvesting Machines; Cao, C.W.; Wu, C.J.; Ke, B.K., Translators; China Agricultural Machinery Press: Beijing, China, 1983. [Google Scholar]
  22. JBT13076-2017; Mechanical Industry Standard of the People’s Republic of China—Peanut Combine Harvester. National Agricultural Machinery Standardization Technical Committee: Beijing, China, 2017.
  23. NY/T 993-2006; Agricultural Industry Standard of the People’s Republic of China—Operation Quality of Peanut Picker. Ministry of Agriculture of the People’s Republic of China: Beijing, China, 2006.
  24. Su, Z. Study on Semi-Feeding Peanut Picker with Double-Roller Breeding Testing Device. Master’s Thesis, Shenyang Agricultural University, Shenyang, China, 2016. [Google Scholar]
  25. Yu, Z.Y.; Hu, Z.C.; Wang, H.O.; Peng, B.L.; Xie, H.X.; Wu, F. Design and testing of head-stem segregation equipment for garlic. Trans. Chin. Agric. Eng. 2013, 29, 7–15. [Google Scholar]
  26. Yu, Z.Y.; Hu, Z.C.; Wang, H.O.; Peng, B.L.; Xie, H.X.; Wu, F. Parameters optimization and experiment of garlic picking mechanism. Trans. Chin. Agric. Eng. 2015, 31, 40–46. [Google Scholar]
  27. Lü, X.R.; Lü, X.L.; Wang, T.Y.; Zhang, X.Q.; Zhang, L.H. Virtual simulation and experimental research of half-feed peanut picker. J. Northwest A F Univ. 2017, 45, 190–196. [Google Scholar]
  28. Yu, Z.Y.; Hu, Z.C.; Cao, M.Z.; Wang, S.Y.; Zhang, P.; Peng, B.L. Design of cleaning mechanism of tangential flow peanut full feeding combine. Trans. Chin. Agric. Eng. 2019, 47, 29–37. [Google Scholar]
Figure 1. Three-dimensional diagram of a 4HLB-4 half-feed four-row peanut combine harvester.
Agronomy 12 03094 g001
Figure 2. Structural diagram of the 4HLB-4 half-feed four-row peanut combine harvester: 1. Profiling depth-limiting wheel; 2. lifter; 3. excavation shovel; 4. earth-moving rod; 5. left and right clamping and pulling devices; 6. combined conveying device; 7. clap plate; 8. transition clamping and conveying parts; 9. chassis; 10. fan; 11. cleaning sieve; 12. peanut-picking device; 13. scraper conveyor belt; 14. transverse conveyor belt; 15. grass-throwing conveyor chain; 16. peanut-picking conveyor chain; 17. elevator; 18. peanut box.
Agronomy 12 03094 g002
Figure 3. The transmission system configuration of the 4HLB-4 half-feed four-row peanut combine harvester. Note: A1–A8, B1 are the drive shafts; V1–V21 are the drive pulleys.
Agronomy 12 03094 g003
Figure 4. The clamping and pulling conveying device. (a) Sketch of the structure of the clamping and pulling conveying device: 1. right clamping conveyor; 2. left clamping conveyor; 3. left compression bar; 4. left merging conveyor; 5. right merging conveyor; 6. adjustable flexible lever; 7. right compression bar. (b) Side view of the structure of the clamping and pulling conveying device: 1. excavation shovel; 2. left and right clamping and drawing devices; 3. harvesting unit stand; 4. harvesting unit total adjusting cylinder; 5. Chassis.
Agronomy 12 03094 g004
Figure 5. Structural diagram of the peanut-picking device and the force involved in its operation. (a) Structural diagram of the peanut-picking device: 1. clamping conveyor chain; 2. blade; 3. drive system; 4. roller shaft; 5. soft film; 6. picking roller; 7. anti-tangle device. (b) Force analysis of the interaction between the peanuts and the peanut-picking blades.
Agronomy 12 03094 g005
Figure 6. Sketch of the structure of the cleaning device. 1. Front fan; 2. vibrating bullet finger sieve plate; 3. pendulum; 4. vibrating screen frame; 5. rear fan; 6. straw walker; 7. eccentric wheel drive mechanism.
Agronomy 12 03094 g006
Figure 7. Sketch of the peanut cultivation pattern.
Agronomy 12 03094 g007
Figure 8. Effects of various test factors on the impurity and loss rates.
Agronomy 12 03094 g008
Figure 9. The detection plot of the regression model for the impurity rate. (a) Analysis of the predicted and actual values of the impurity rate. (b) The residual analysis of the impurity rate.
Agronomy 12 03094 g009
Figure 10. Effects of the interaction factors on the impurity rate. (a) Interaction of X2 with X3 for X1 = 1.0 m/s, X4 = 600 cpm. (b) Interaction of X3 with X4 for X1 = 1.0 m/s, X2 = 200 mm.
Agronomy 12 03094 g010
Figure 11. The detection plot of the regression model for the loss rate. (a) Analysis of the predicted and actual values of the loss rate. (b) The residual analysis of the loss rate.
Agronomy 12 03094 g011
Figure 12. Effects of the interaction factors on the loss rate. (a) Interaction of X2 with X3 for X1 = 1.0 m/s, X4 = 600 cpm. (b) Interaction of X2 with X4 for X1 = 1.0 m/s, X3 = 500 cpm.
Agronomy 12 03094 g012
Figure 13. Validation tests in the field.
Agronomy 12 03094 g013
Table 1. Experimental factors and their levels.
FactorsTest LevelOther Parameters
1234
v (m·s−1)0.60.91.21.5H = 190, r = 500, f = 600
H (mm)160190220250v = 0.9, r = 500, f = 600
r (rpm)350450550650v = 0.9, H = 190, f = 600
f (cpm)400500600700v = 0.9, H = 190, r = 500
Table 2. Factors and levels of the response surface test.
FactorsCodeTest Level
−101
v (m·s−1)X10.71.01.3
H (mm)X2160200240
r (rpm)X3400500600
f (cpm)X4500600700
Table 3. Experimental design and response values.
No.LevelsResponse Values
Forward Speed
X1
Clamping Height
X2
Peanut Picking Roller Rotational Speed
X3
Cleaning Sieve Vibrational Frequency
X4
Impurity Rate Y1
(%)
Loss Rate Y2
(%)
1−1−1002.962.11
2−11003.332.62
3−10103.081.81
401104.122.43
500002.541.97
601−103.143.42
7−10012.812.54
800−1−13.783.18
90−1−103.152.84
10100−13.873.05
1100002.612.08
12010−14.462.72
130−10−13.642.67
1410−103.183.24
15−100−13.422.51
1600002.232.24
1710103.472.52
18−10−103.252.65
19001−13.932.37
2000−112.723.14
2100112.892.49
220−1103.052.44
2310013.022.78
2400002.782.15
2511003.963.03
260−1012.62.76
2700002.952.22
2801013.522.63
291−1002.972.91
Table 4. Experimental design and response values.
SourceImpurity Rate Y1/%Loss Rate Y2/%
Sum of SquaresDfF-Valuep-ValueSum of SquaresDfF-Valuep-Value
Model7.2021413.36<0.0001 **4.2211416.49<0.0001 **
X10.21915.680.0319 *0.902149.33<0.0001 **
X21.442137.45<0.0001 **0.10515.720.0314 *
X30.14513.770.07251.621188.63<0.0001 **
X42.558166.43<0.0001 **0.00210.120.7378
X1X20.09612.500.13650.03812.080.1713
X1X30.05311.370.26070.00410.200.6640
X1X40.01410.370.55060.02311.230.2860
X2X30.29217.570.0156 *0.08714.760.0467 *
X2X40.00210.060.80260.00810.440.5165
X3X40.00010.000.96010.00610.350.5635
X120.430111.160.0049 **0.267114.580.0019 **
X221.342134.85<0.0001 **0.599132.78<0.0001 **
X320.633116.430.0012 **0.575131.45<0.0001 **
X421.171130.41<0.0001 **0.734140.17<0.0001 **
Residual0.53914 0.25614
Lack of Fit0.246100.340.92640.207101.700.3205
Pure Error0.2934 0.0494
Total7.74128 4.47728
Note: p < 0.01 (highly significant, **); p < 0.05 (significant, *).
Table 5. Experimental values of the evaluation indices under optimal conditions.
ItemImpurity Rate Y1 (%)Loss Rate Y2 (%)
Average Test Value 2.622.05
Optimal Value2.531.97
Relative Error (%)3.54.1
Publisher’s Note: MDPI stays neutral with regard to jurisdictional claims in published maps and institutional affiliations.

