Article

Honey Bee Exposure to the Fungicide Propiconazole in Lowbush Blueberry Fields

by
Francis Andrew Drummond
1,2
1
School of Biology and Ecology, University of Maine, Orono, ME 04469, USA
2
Cooperative Extension, University of Maine, Orono, ME 04469, USA
Agronomy 2022, 12(12), 3081; https://doi.org/10.3390/agronomy12123081
Submission received: 1 November 2022 / Revised: 30 November 2022 / Accepted: 2 December 2022 / Published: 5 December 2022
(This article belongs to the Special Issue Ecological Research on Crop Pollinators)

Abstract

:
The fungicide propiconazole is a commonly used fungicide in small fruit and tree fruit production in the U.S.A. In Maine wild blueberry production, it is used almost exclusively for mummy berry disease control. The goal of this study is to assess the risk of exposure to honey bee colonies deployed in wild blueberry fields for pollination. The study was conducted over a six-year period (2009–2014) in both the field and laboratory. Field surveys (2009–2011) measured the residues on blueberry flowers in 41 commercial fields across the blueberry growing region. A two-year study (2010–2011) determined the decay rate of propiconazole in blueberry fields after application. A laboratory study determined the contact LD50 of propiconazole to honey bee workers (2013). A field exposure/effect study was conducted over three years (2011–2013). In this study, 8–18 previously unexposed colonies were randomly assigned to one of two treatments, (1) isolated fields that were treated prior to bloom with the fungicide, propiconazole, but no other pesticides, or (2) isolated fields that were not treated with propiconazole or any other pesticides. The measures taken to evaluate effects of exposure monitored each year were (1) estimation of the exposure to colonies, measured as residues on flowers, workers, and in pollen brought back to hives; (2) colony population size (workers and brood); (3) queen status and presence; (4) queen oviposition rate; (5) supersedure rate; (6) egg hatch success; (7) mortality of developing larvae and pupae; (8) royal jelly deposition in wax comb cells; (9) worker longevity; (10) foraging activity; (11) treated bloom repellency to foragers; (12) colony overwintering success; (13) worker hypopharyngeal gland acini size; and (14) pathogen and parasite incidence and intensity. The results of these experiments and surveys showed that the propiconazole contact LD50 was 24,747 ppb. Residues of propiconazole were found to be commonly abundant on flowers in treated commercial fields after application with a mean concentration of 2083.8 ± 851.3 (se). The decay of propiconazole to non-detectable levels took about 40 days after application. The three-year hive deployment study showed that residues in treated fields were detected on flowers, pollen, and worker bees, demonstrating that exposure to this fungicide occurs even though it is applied before bloom. Also in the hive deployment study, evidence of reduced colony populations, increased supersedure, decreased queen oviposition rate, increased pathogen or parasite incidence and intensity, and increased overwintering colony loss due to propiconazole exposure was not found. However, propiconazole exposed colonies exhibited reduced worker longevity (17.3%), hypertrophy of 5 d old nurse bee hypopharyngeal acini (8.3%), and a 3.5 h repellency of foragers to treated bloom.

1. Introduction

In lowbush blueberry production, Vaccinium angustifolium Aiton, the most serious plant disease is mummy berry caused by the pathogen, Monolinia vaccinii-corymbosi (Reade) Honey. In Maine lowbush blueberry fields, the fungus overwinters as pseudosclerotia which germinate to form apothecia that produce infective ascospores in the early spring [1]. The ascospores land on and subsequently infect leaf and flower bud tissue (primary infection). Secondary spores or conidia are produced in necrotic tissue. These spores are vectored by bees and other pollinators to flower stigmas [2,3] resulting in a secondary infection of flowers. A mycelial filled fruit results which then develops into a hardened pseudosclerotium for overwintering [1].
Mummy berry infection resulting in blighted lowbush blueberry stems can be quite devastating, in excess of 90% [4]. Control of mummy berry disease in lowbush blueberry is based upon the use of fungicides applied prior to bloom with the objective of minimizing primary infection. If primary infection is minimized, secondary infection will also be low. Even though fungicide applications are made prior to the commencement of bloom in lowbush blueberry (Figure 1A), there is still a likelihood of exposure to bees since leaves and the outer surface of flower bud clusters will be contaminated. Bees often land on foliage and come in contact with the outer surface of flower petals when foraging for nectar and pollen once bloom begins. Figure 1B shows honey bee hives deployed in a lowbush blueberry field at the beginning of bloom. The resulting mummies are depicted in Figure 1C.
The application of fungicides in blueberry to control mummy berry disease either just prior to bloom as in lowbush blueberry production, or during bloom as in highbush blueberry production, begs the question: what is the exposure and effect of these fungicides in the spring during bloom on pollinators, specifically migratory honey bees that are brought into fields to maximize yield?
At one time, it was thought that agricultural fungicides had little if any deleterious effects on honey bees. This thinking was based upon several laboratory studies on bees showing that they have low acute contact toxicity to honey bees [5]. Ostiguy et al. [6] showed that levels of fungicide exposure in trapped pollen from honey bee colonies was three orders of magnitude less than acute toxicity levels for 28 detected fungicides sampled from apiaries in 7 U.S. states. While some classes of fungicides do not appear to harm honey bees, others do [7]. However, acute contact toxicity as an end point result from fungicide exposure is an extreme measure, a worse case senario. However, even this measure is only part of the potential effect due to exposure. Confounding our understanding of acute toxicity of fungicides to honey bees, it has been demonstrated that some fungicides can be more lethal to honey bee workers through oral exposure [6,8]. In addition, other life stages such as immatures have been shown to be more vulnerable to fungicide exposure than workers [9,10]. Mussen et al. [7] found that Captan, Rovral, and Ziram were so toxic that when fed to larvae, none completed development.
Acute toxicity effects other than direct exposure to a single fungicide can also arise. For instance, multiple simultaneous exposure of honey bees to a fungicide and other pesticides can result in synergisitc mortality. Zhu et al. [10] found synergisitc toxicity in larvae when exposed to chlorothalonil and fluvalinate compared to chlorothalonil alone. A similar synergy resulted when the researchers exposed larvae to both chlorothalonil and coumaphos [10]. However, when coumaphos was added to the mixture of chlorothalonil and fluvalinate mortality decreased.
Field and laboratory studies of honey bee fungicide exposure have also documented several deleterious sub-lethal effects. Fisher et al. [5] showed reduced worker longevity resulting in lower population densities when colonies were exposed to the fungicide Pristine®. These researchers also demonstrated decreased larval pollen consumption when exposed to Pristine®. Mussen et al. [7] reported beekeepers finding deformed pupae and wingless workers in colonies exposed to fungicides, although the specific fungicides were not mentioned. Mao et al. [11] showed that exposure of larvae to the fungicide myclobutanil caused metabolic disruption through down regulation of mitochondrial genes. Adult bees consuming myclobutanil metabolized less quercetin and produced less thoracic ATP, the energy source for flight muscles. Other fungicides have also been shown to affect gene regulation and transcription [12]. Christen et al. [13] investigated gene transcription in the brain of honey bees exposed to chlorothanolin, azoxystrobin, and folpet. The researchers found azoxystrobin and folpet resulted in minor changes, including the down regulation of the gene hbg-3 and induction of the gene ndufb-7. Chlorothanolin resulted in significant transcriptional down regulation of genes related to oxidative phosphorylation and metabolism. Traynor et al. [14] found a suite of non-lethal and lethal effects on colonies exposed to chlorothalonil and propiconazole. They observed increased pollen foraging, increased queen supersedure, brood loss, and atrophied hypopharyngeal glands in workers. Another colony-level effect observed was increased susceptibility to pathogens upon exposure to fungicides. Pettis et al. [15] observed that colonies with stored pollen contaminated with high levels of fungicide residues had higher incidence of Nosema ceranae Fries than colonies whose pollen stores had low fungicide residue levels. Lastly, behavioral effects have been observed after exposure to fungicides. DesJardins et al. [16] described a loss of associative learning of olfactory cues in workers exposed to the fungicide Pristine®. These chronic and sub-lethal effects have been shown to be dependent upon the specific fungicide, route of exposure, level of exposure (concentration), honey bee life stage exposed, and other pesticides and phyto-chemicals involved in co-exposure [5,6,7,8,9,10,11,12,13,14,15,16].
The most common fungicide used for control of mummy berry disease are the triazole fungicides. They are effective and inexpensive. In Maine, propiconazole is one of several triazole fungicides used in lowbush blueberry for mummy berry disease control, along with the other triazole fungicides febuconazole, metaconazole, and prothioconazole [17]. The azole fungicides (including triazoles), 14-alpha demethylase inhibitors (also referred to as DMI fungicides) are a broad-spectrum class of fungicide. They have been in use for more than four decades to control plant diseases in cereals, vegetables, and fruit. Azoles are known to be resilient in terms of a low rate of development of resistance by fungi [18]. The target of the azoles is the 14-alpha demethylase enzyme (CYP51) in the ergosterol biosynthetic pathway of fungal pathogens of both plants and humans [19]. Ergosterol is a major sterol in many fungal cell membranes in the higher fungi, such as the Ascomycetes and Basidiomycetes. An azole fungicide binding to the CYP51 enzyme leads to cessation in the production of ergosterol [20]. The result is a delay in fungal growth or, in higher concentrations, a fungicidal effect [21].
The azole fungicides have been implicated in deleterious effects to honey bees. However, these effects do not appear to be straight forward toxic responses in nature. Rutkowski et al. [22] showed that propiconazole could interrupt the dietary bee-fungus relationship and retard larval development, but this effect was dependent upon bee species. The most intensive research focused on these fungicides has been investigating the synergy between simultaneous exposure of honey bees to insecticides and azole fungicides [23,24,25,26]. The mechanism of the increased toxicity of certain insecticides in the presence of azole fungicides has to do with their super-affinity of cytochrome P450 competing for this enzyme with insecticides and thus delaying the immediate metabolic breakdown of the insecticide [27,28].
While there have been several association or correlative field studies suggesting links between fungicide exposure and deleterious effects on honey bee colonies, field-level causation experiments are generally lacking [5]. The study described in this paper had the objectives of determining: (1) the likelihood of exposure of honey bee colonies during bloom to the azole fungicide propiconazole; and (2) the effects of any exposure to propiconazole applied just prior to bloom in lowbush blueberry fields on colony health. The study was conducted for six years, 2009–2014 in Downeast Maine and involved documenting the residue levels of propiconaziole on blueberry flowers in commercial fields, the decay rate of propiconazole in the field under typical spring environmental conditions during bloom, a study of acute toxicity in workers subjected to contact exposure to propiconazole, and colony-level responses to propiconazole exposure in commercial fields during bloom and throughout the subsequent summer, fall, and winter.

2. Materials and Methods

A six-year study was initiated in May 2009. The first experiment conducted was a topical bioassay with worker honey bees. The first objective of this study was to estimate the exposure to propiconazole that honey bees brought into pollinate lowbush blueberries would encounter. The second objective was to determine any detrimental effects that honey bees would experience upon typical field exposure in lowbush blueberry.

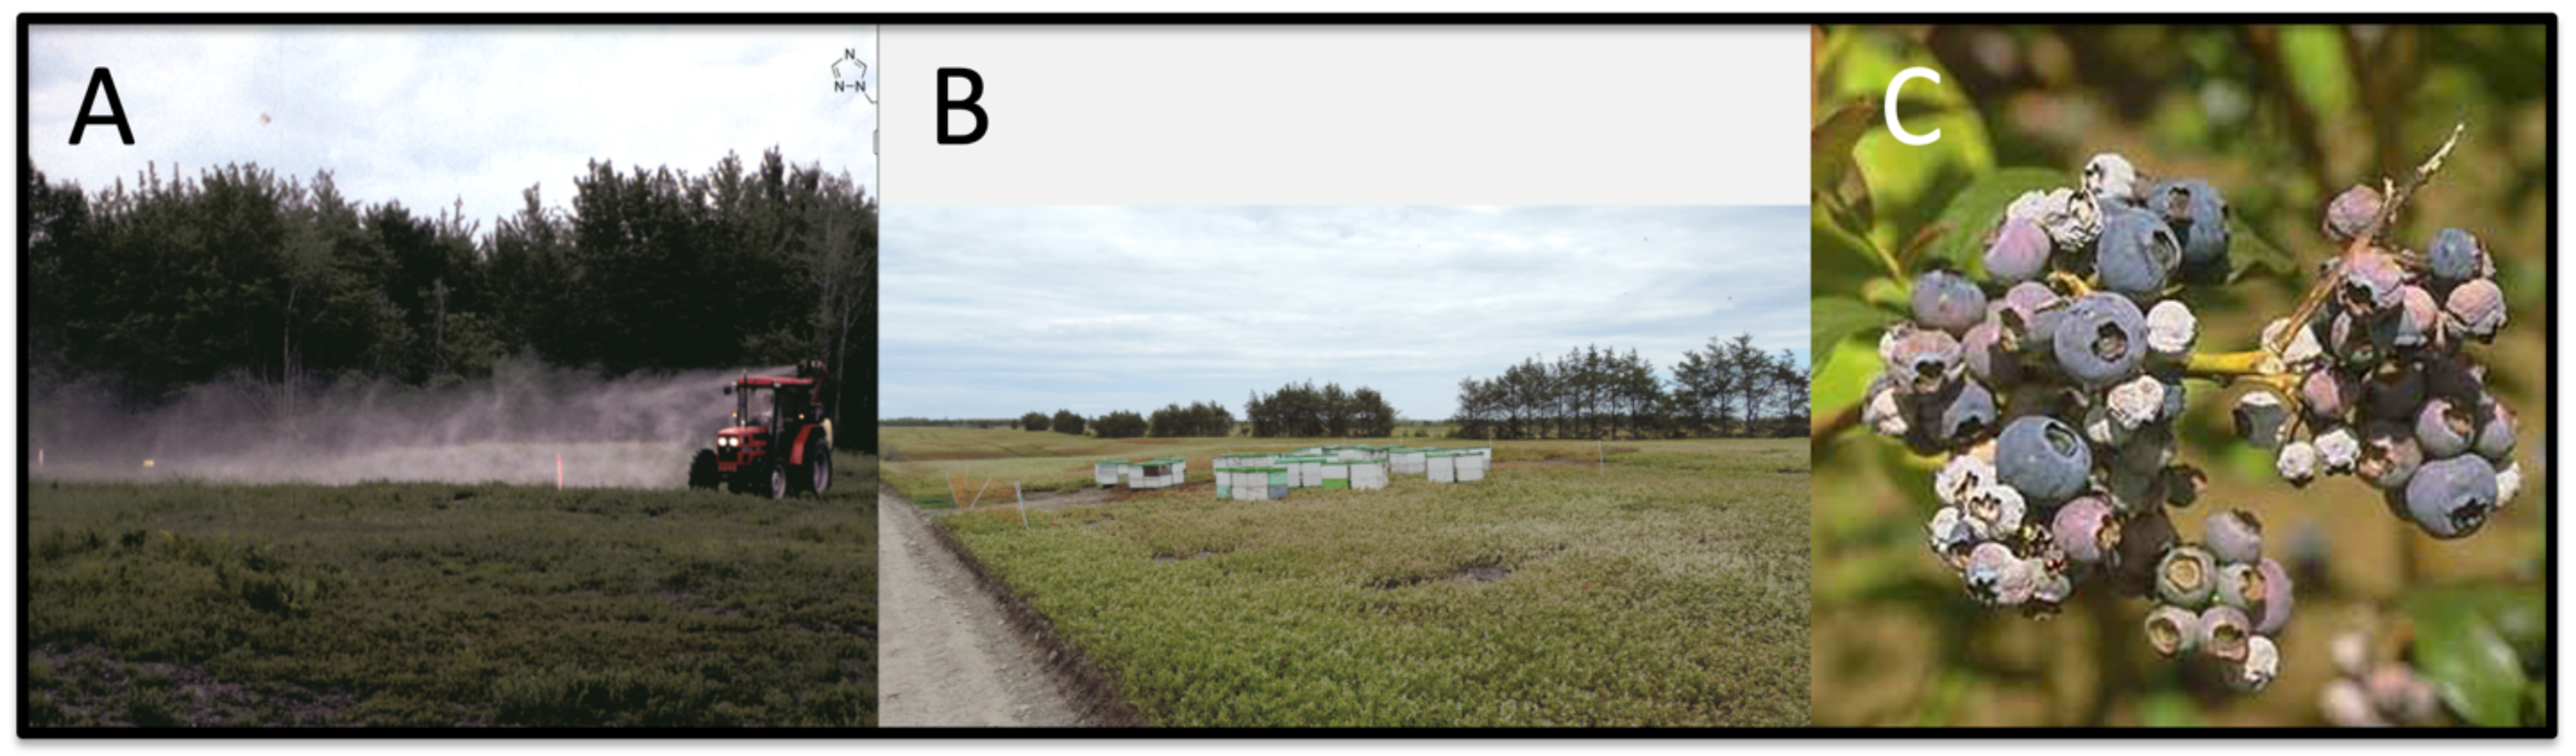
2.1. Propiconazole Exposure Experiments (2009–2013)

Three experiments were conducted to determine the level of exposure that foraging honey bees experience when applications are made in a typical fashion 3–12 days prior to bloom.

2.1.1. Propiconazole Residues on Lowbush Blueberry Flowers in Fields in Bloom (2009–2011)

During the years 2009–2011, 31 lowbush blueberry fields were sampled in Hancock, Lincoln, Waldo, and Washington counties, the major blueberry growing regions in Maine. All sampled fields had propiconazole based fungicides (e.g., Orbit®, Tilt®, or Bumper®) applied by growers at the recommended rate (0.19 kg ai/ha) to the stems, leaves and flower buds prior to bloom after an infection event had occurred. Samples of 1–3 stems were cut at ground level from 10 representative locations in each field during bloom. Flowers were carefully removed from the cut stems (average of 70–75 flowers per stem, [29]) and placed in a 3.8 L ZiplockTM freezer bag, labeled, and transported in insulated coolers (The Coleman Co., Inc., Golden, CO, USA) containing blue ice packs (Igloo MaxcoldTM ice blocks, Igloo Co., Katy, TX, USA) to the laboratory at the University of Maine. In the laboratory, approximately 0.95 L of flowers were separated from stems cut in each field bag and placed in a labeled 0.95 L ZiplockTM freezer bag and stored in an ultra-freezer (−80 °C, (Thermo Scientific®, Fisher Scientific, Hampton, NH, USA) until they were shipped overnight on dry ice for pesticide residue analysis. Samples were shipped to the quantitative chemical analytical laboratory at the Connecticut Agricultural Experiment Station, New Haven, CT, USA, when requested. The Connecticut Agricultural Experiment Station analytical chemistry laboratory used high-pressure liquid chroma-tography analysis targeting 140 different pesticides, and metabolites after extracting the residue targets using a modified QuECHERs procedure [30]. More details of the procedures can be found in Ostiguy et al. [6].
A frequency distribution of the residue quantities on flowers was used to estimate the mean and variance of the residues between fields. The goodness of fit, chi-square statistic, for several probability density functions [31] was used to determine the most appropriate model for the between field propiconazole residue frequency distribution during bloom.

2.1.2. Degradation of Propiconazole in the Field from the Time of Application until the End of Bloom (2010–2011)

In 2010 and 2011, an experiment was conducted to determine the decay rate of propiconazole on flower buds and flowers from the time an application of the fungicide Orbit® (41.8% propiconazole, Syngenta Agrichemical Company, Basel, Switzerland) was made just prior to bloom. The experiment was conducted in commercially managed lowbush blueberry fields in Deblois, Maine. In each year, a field in the crop phase of production was selected and seven randomly selected areas in the field were located. In each of the eight areas a 2.1 × 7.6 m plot was staked at the corners. Orbit® fungicide was applied with a slow walking rate at the recommended rate (0.136 kg/ha of active ingredient) [17]. The fungicide was sprayed with a CO2-propelled backpack sprayer (2.0 m boom sprayer (1.9 m swath) equipped with four, flat-spray, 8002VS TeeJet® nozzles (TeeJet Technologies, Glendale Heights, IL, USA) operating at 35 psi for a total of 250 L water-fungicide mixture/ha). The fields were treated on May 11 in 2010 (4 d prior to bloom) and May 8 in 2011 (5 d prior to bloom). Fields were then sampled and flowers (0.95 L) were collected as described above (see section: Propiconazole residues on lowbush blueberry flowers in fields in bloom) in one of the marked plots on 7 subsequent days: 0.2 (5 h after application), 5, 10, 15, 20, 25, and 40 days after the fungicide application. A two-way ANOVA was used to determine if propiconazole concentration (ppb) on flower buds and/or flowers (dependent variable) was different by year and days after application (independent variables) or if the interaction between year and days after application was significant [31]. In order to determine the rate of propiconazole decay during bloom, exponential curves of the form y = a × e(−bx) were fit to data from each year and the data for both years combined [31].

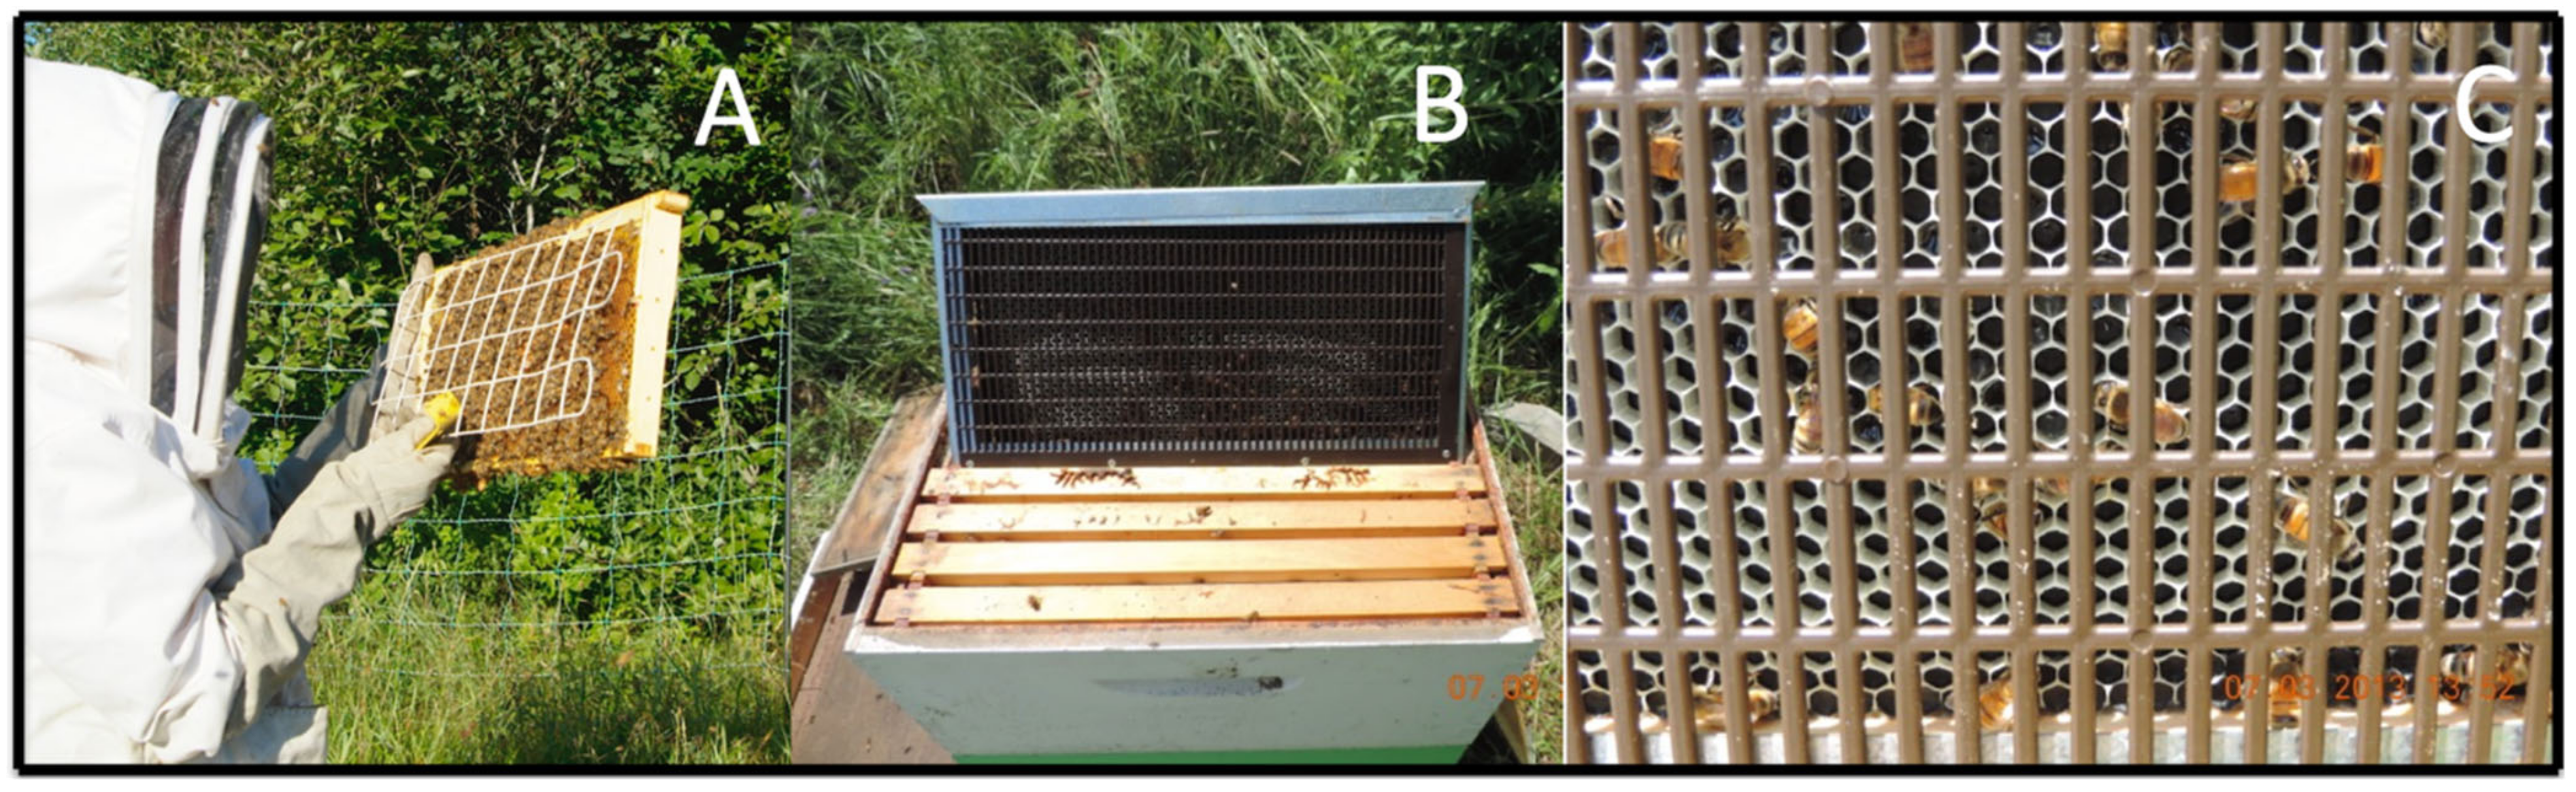
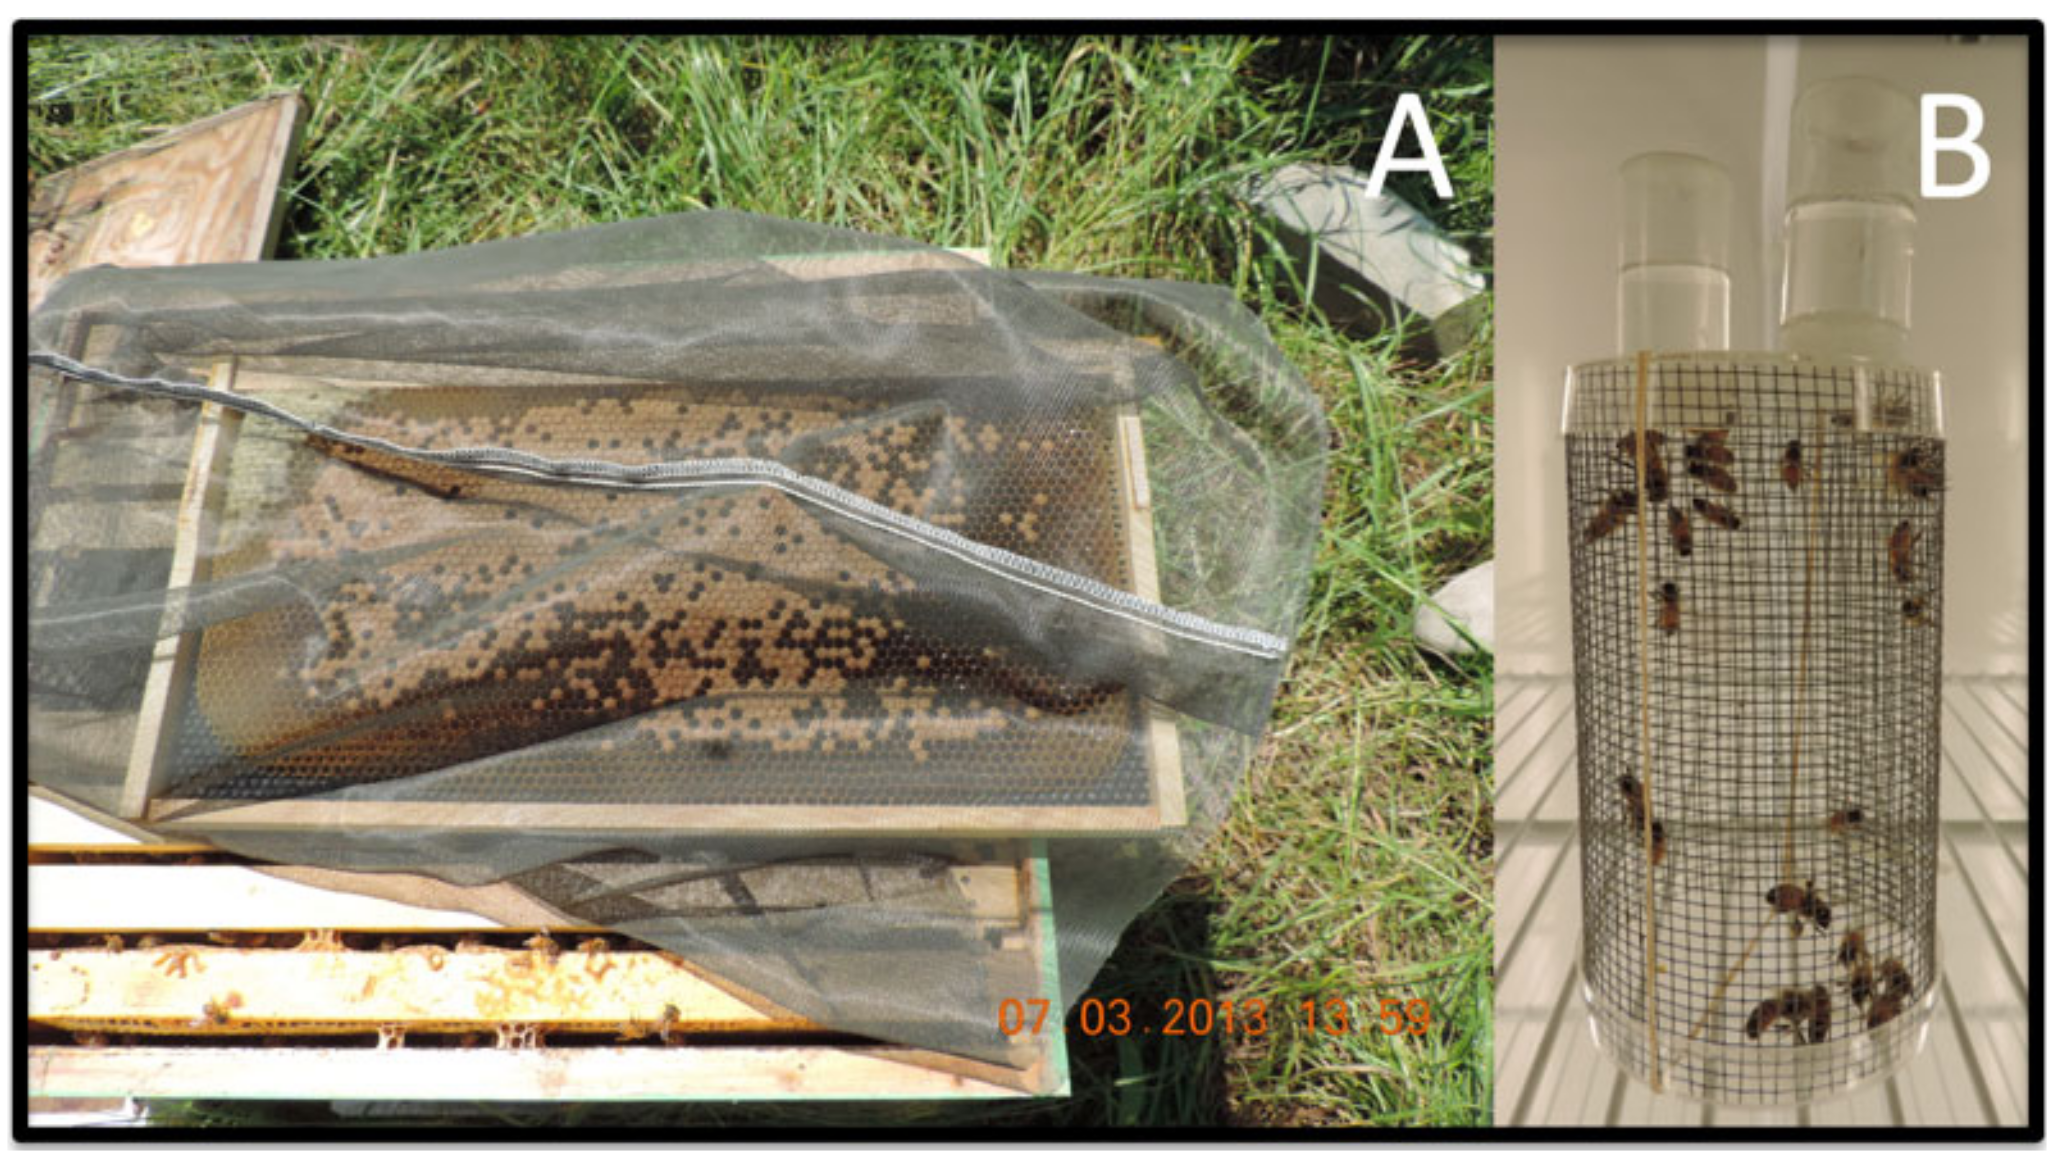
2.1.3. Bioassay for Estimating Acute Contact Mortality in Worker Honey Bees (2013)

In July 2013, a laboratory contact toxicity bioassay was designed to determine 24 h acute honey bee mortality to propiconazole. One hundred and fifty worker honey bees were randomly selected from honey supers in each of three colonies maintained at the University of Maine apiary. From each of these three groups of 150 workers, 80 workers were randomly selected for the experiment (a total of 240 bees).
Technical grade propiconazole was obtained from Syngenta Agrichemical Company (Basel, Switzerland). It was dissolved in a 10% Tween 80® distilled water solution and the following concentrations were formulated: 0 (control = 10% Tween 80® in water), 1 × 10², 1 × 10³, 1 × 10⁴, 1 × 104.5, 1 × 10⁵, 1 × 10⁶, 1 × 10⁷ ppb. Treatments were prepared and an amount of 0.1 microliter was dropped on top of the thorax of individual honey bee workers (collected from the brood area of colonies at the University of Maine). Worker age was not controlled for or standardized. The workers (30/dose) were held in cages with sugar water (10 workers to a cage or replicate) in a growth chamber set at 30 °C and survival was assessed and recorded for 24 h. The cages occupied a volume of 1683.7 cm3 (8.0 cm diameter × 33.5 cm height), with about nine hardwire gaps per cm2. Two dispenser vials containing 25% sugar solution were positioned at the top of each cage as carbohydrate and water sources. In all there were 8 treatment doses × 3 replicates or 24 cages. Care was taken not to select recently emerged teneral bees. Cages representing all 8 treatment doses were held in a growth chamber by replicate (i.e., three growth chambers) at 35 ± 1 °C under a 16:8 h (L:D) cycle. Preliminary trials showed that these temperature and photoperiod conditions insured consistent high survival for the duration of the bioassay. Cages were inspected for bee mortality 24 h after the cages were set up. Death was defined as no observable kinetic response to physical disturbance. Logistic regression was used to estimate the effect of dose and replicate on the proportion mortality of honey bees at 24 h [31]. There was no need to account for control mortality with Abbot’s formula as none was observed. The LD50 was estimated based upon the fitted logistic regression.

2.2. Experiment on the Detrimental Effects of Exposure to Propiconazole (2011–2013)
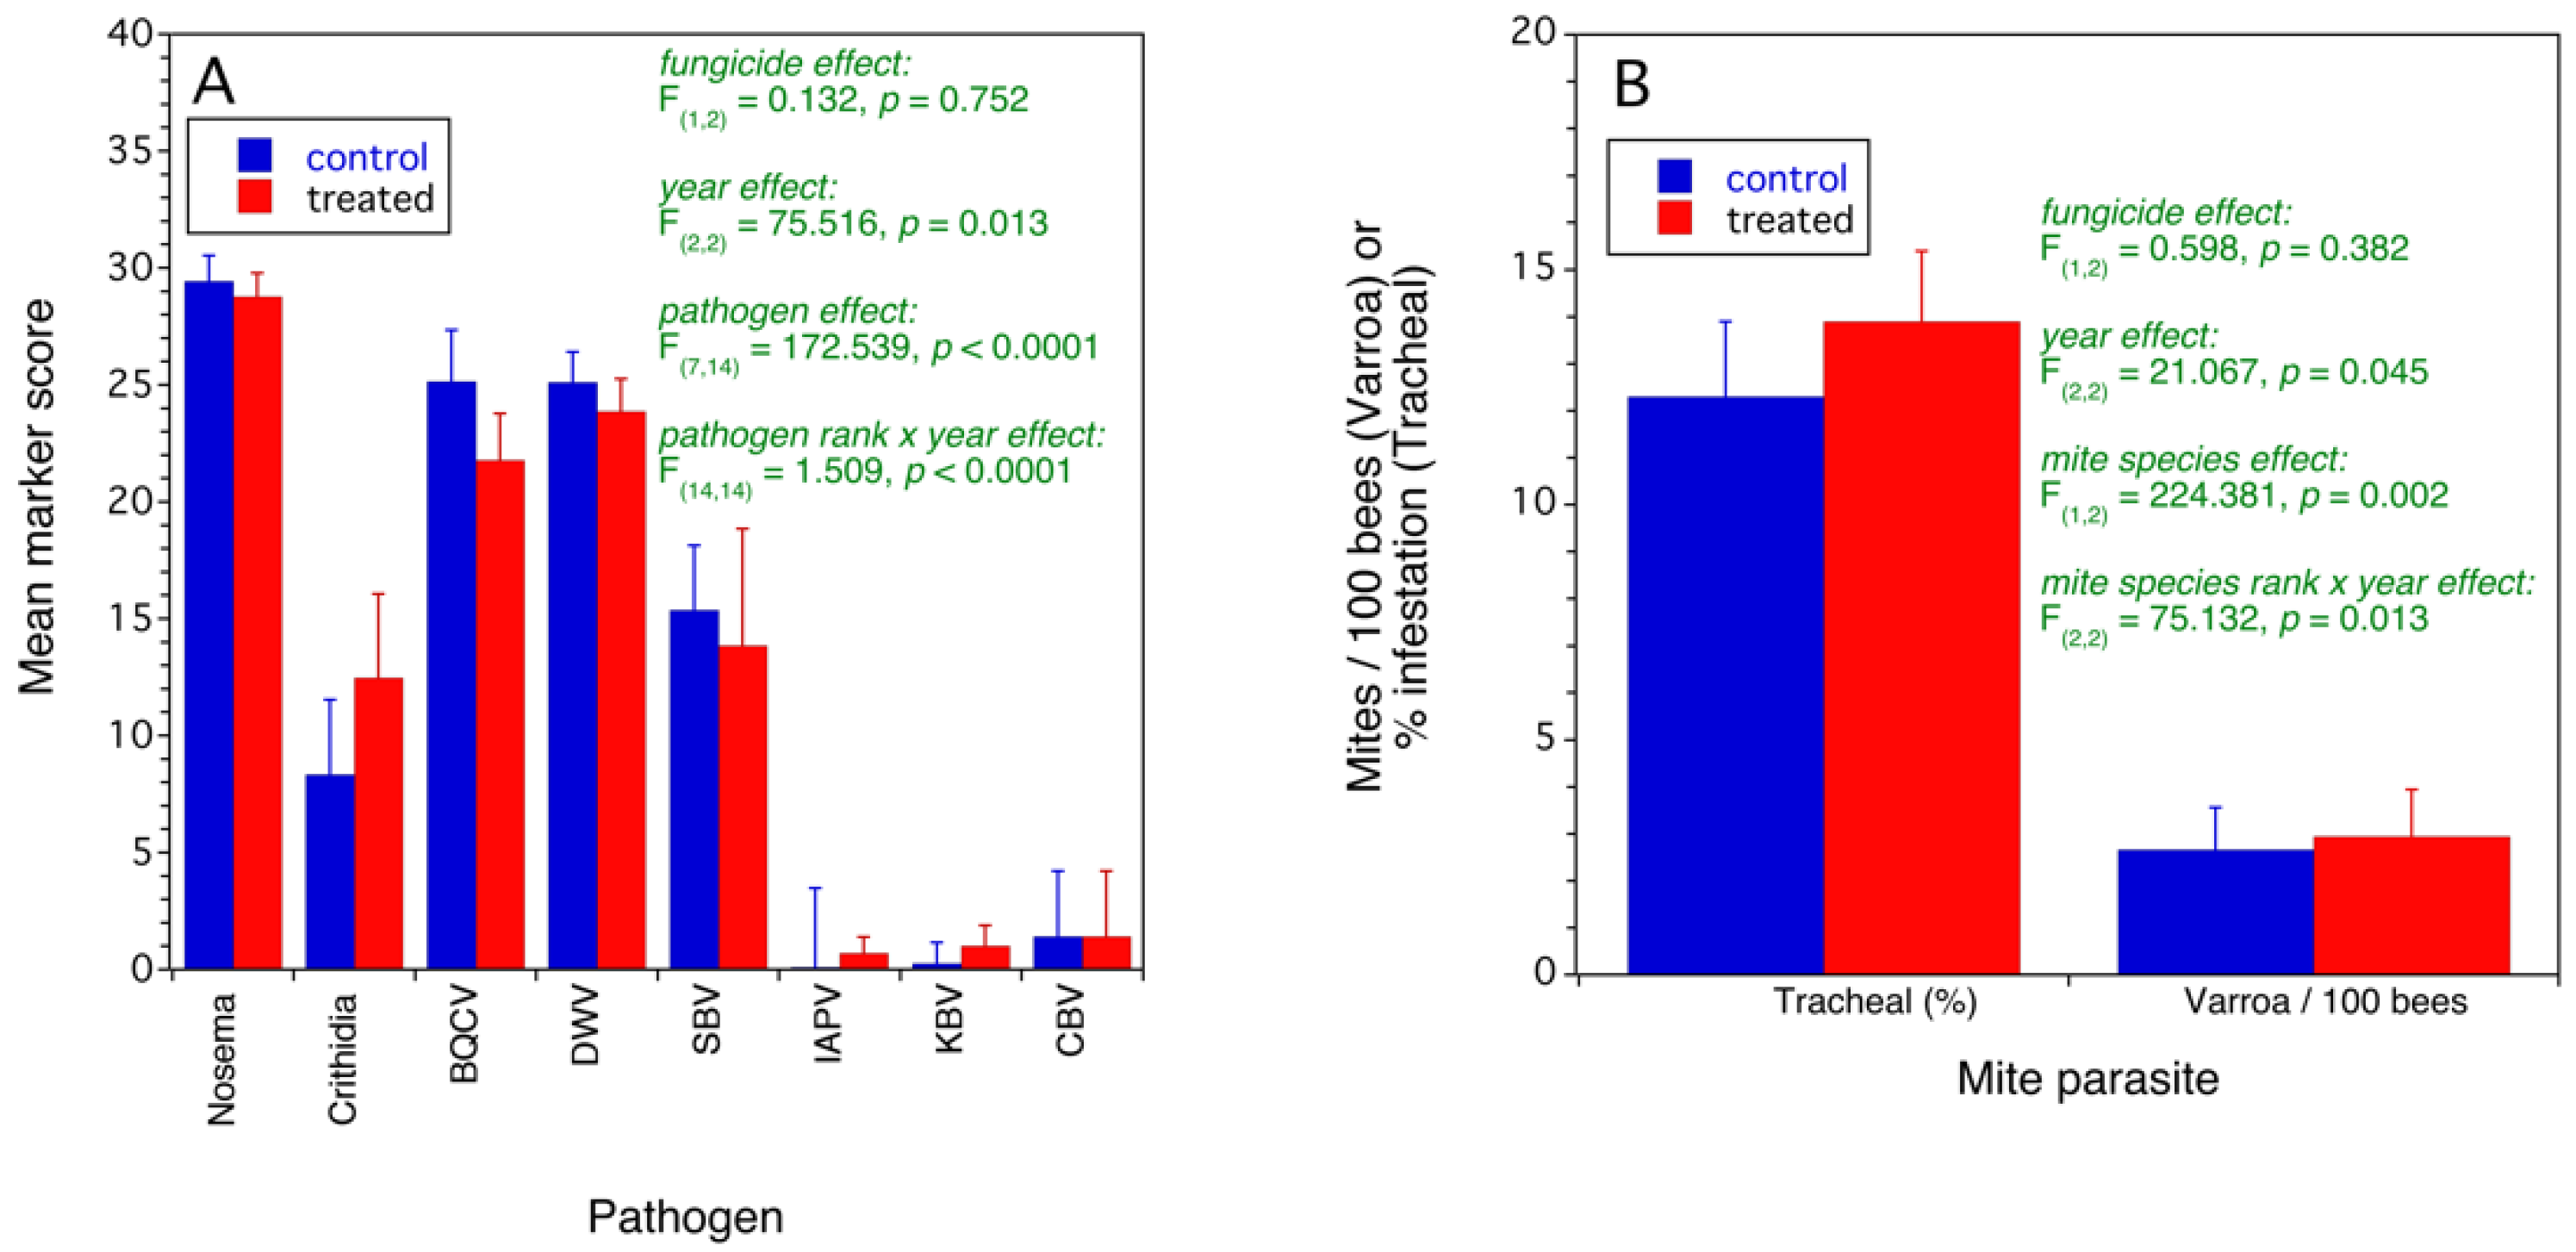
A three-year study (2011–2013) was conducted in the major lowbush blueberry growing region of Maine to determine the effects of exposure to propiconazole to honey bees at the individual and colony level. Specific subobjectives were to investigate if fields sprayed by a farmer with the fungicide Orbit® (ai propiconazole) compared to fields that were not sprayed resulted in higher exposure through: higher concentrations of propiconazole residues on flowers, trapped honey bee pollen, and foraging honey bees collected when returning to hives.
In addition, it was hypothesized that fields sprayed with propiconazole would be characterized by lower colony health represented by the following hypotheses:
(1)
higher spring queen supersedure rates during bloom;
(2)
lower colony brood and worker population sizes during and after bloom;
(3)
lower queen oviposition rates during bloom;
(4)
lower egg proportion hatch during bloom;
(5)
lower brood proportion survival, reared after bloom;
(6)
shorter worker longevity after bloom;
(7)
lower royal jelly deposition in hives during bloom;
(8)
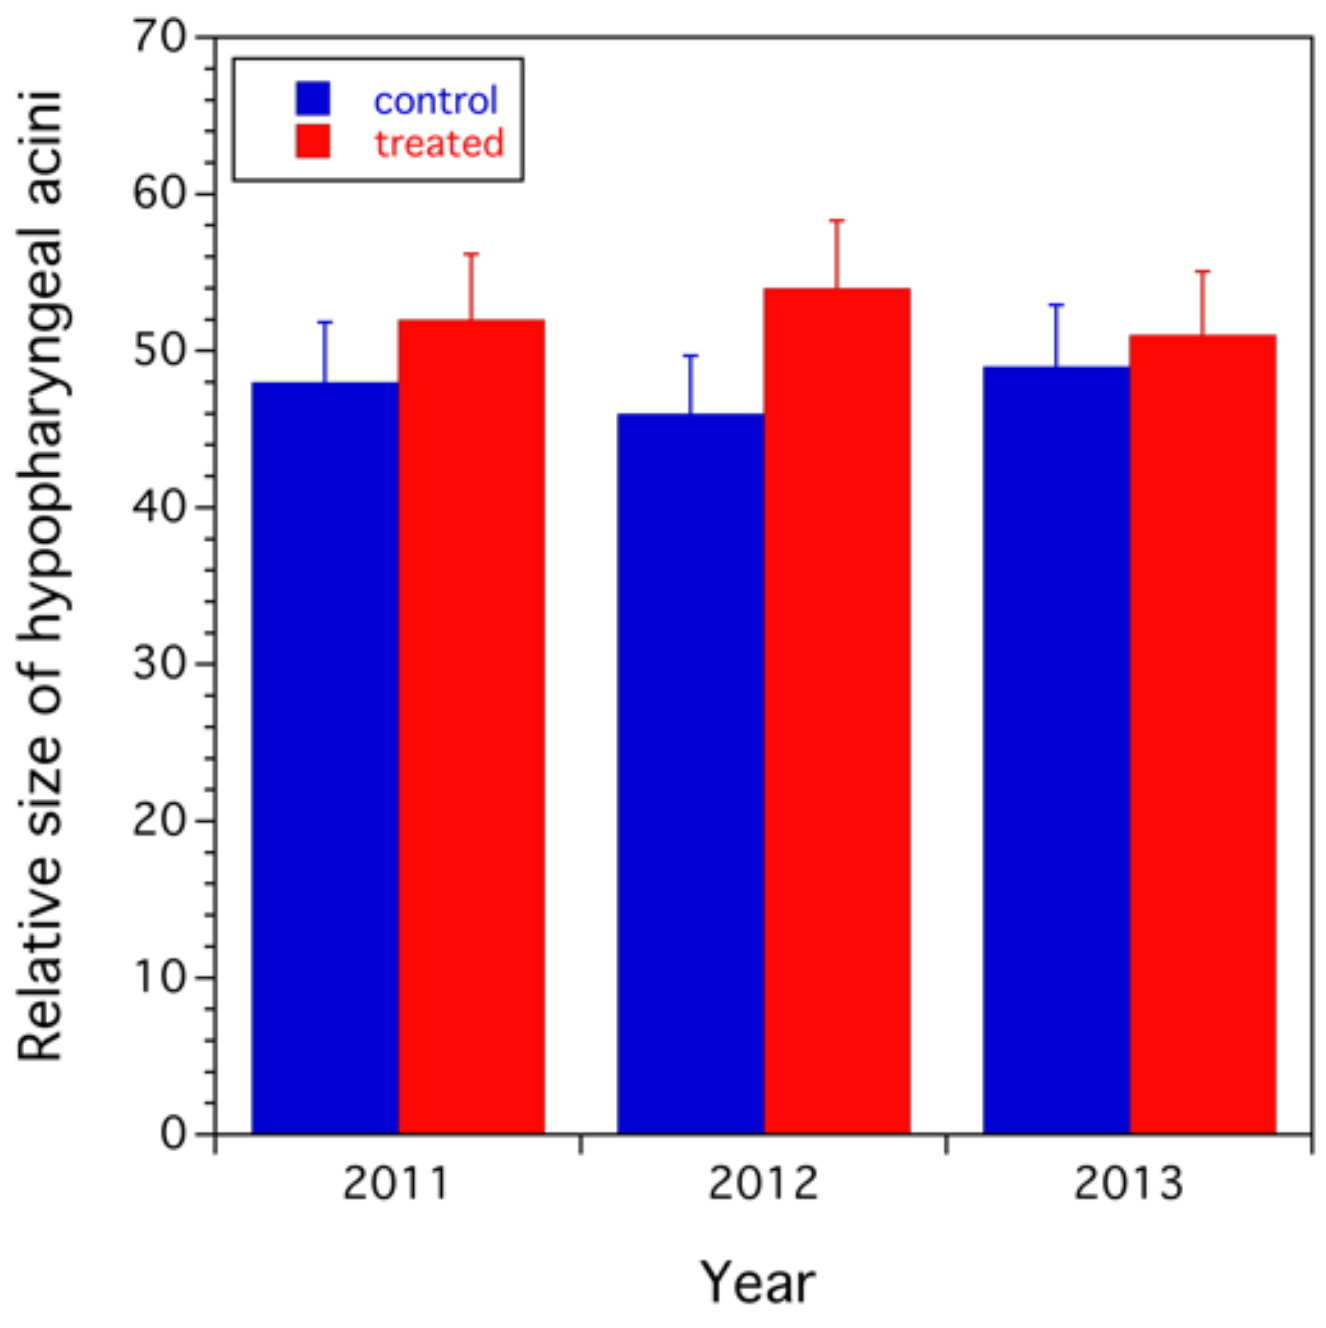
different hypopharyngeal gland biomass of recently emerged workers;
(9)
lower numbers of worker foragers returning back to the hive during bloom;
(10)
higher Varroa and tracheal mite abundances;
(11)
higher virus, protozoan, and fungal disease incidence based upon molecular markers and;
(12)
higher colony losses over the winter and during the subsequent early spring.
Thirdly, it was hypothesized that honey bees might have a negative behavioral reaction to fields sprayed with Orbit® (ai propiconazole): repellency of propiconazole contaminated flowers to foraging workers.
The three-year field study (2011–2013) was designed as a randomized complete block (RCB) design where year was the statistical block [31]. In each year, two groups of colonies were assigned randomly to two treatments: control and propiconazole treated. Two different commercial isolated lowbush blueberry fields were selected each year, one (propiconazole treatment) that had been sprayed by a farmer with Orbit® (propiconazole) prior to bloom (2011: 85 ha; 2012: 218 ha; 2013: 9 ha). The other field (control) was not sprayed with propiconazole prior to or during bloom (2011: 41 ha; 2012: 82 ha; 2013: 16 ha). There were no other pesticides applied in the two fields either prior to bloom or during bloom. Fields were located in the major wild blueberry growing regions in Maine, USA. The research was conducted in Hancock, Waldo, and Washington counties, in the towns of Amherst, Deblois, Stockton Springs, and Winterport, during the years 2011–2013.
Two groups of randomly selected colonies were moved to their respective treatment and control fields at the onset of bloom (usually mid- to late-May). All colonies were started as packages the previous year (obtained from commercial honey bee producers located in Florida and Georgia, USA) and treated with a miticide for control of Varroa mite (Varroa destructor Anderson and Trueman) in the fall. The colonies were housed in two deep hive bodies with 4–8 frames of brood and a marked queen that had successfully overwintered. In early spring (April–May), the colonies were fed sugar syrup (1:1 white granulated sugar: water volume) and pollen substitute (Bee Pro®) as needed and colony strength was equalized among colonies (population strength was assessed as described below). No medications or pesticides were placed in the hives for bee parasite or pathogen control. The number of colonies randomized to each group (treatment vs. control) in each year were as follows: 10 hives treatment and 11 hives control (2011); 9 hives treatment and 8 hives control (2012); and 12 hives treatment and 18 hives control (2013). All colonies were kept at the University of Maine (Orono, ME, USA) prior to blueberry bloom and then moved into either the treatment (sprayed with Orbit® fungicide at the recommended rate [9] 1–3 days before) or control field (not sprayed) in mid-May. In the three years (2011–2013), bloom started on 18, 12, and 15 May, respectively. Colonies were kept in the blueberry fields throughout bloom (30–40 d) and then moved to non-crop bee pasture at the University of Maine Witter Agriculture Farm (Old Town, ME, USA) from mid-late June until mid-June the following year.

2.2.1. Propiconazole Residues on Flowers, Trapped Honey Bee Pollen, and Foraging Honey Bees (2011–2013)

Blueberry flowers, trapped honey bee collected pollen, and honey bee foragers returning to the hives were assessed for propiconazole residue contamination during bloom. In 2011, 2012, and 2013 samples of flowers and trapped pollen were collected for quantitative chemical analysis. In 2012 and 2013, honey bee foragers were collected at the hive entrance of each hive to determine whole body contamination by propiconazole.
Samples of 1–3 stems were cut at ground level from 10 representative locations in each of the two fields during early bloom 1–3 d after the hives were placed in each field. Flowers on cut stems from each field and placed in separate plastic freezer bags, labeled, and transported to the laboratory at the University of Maine. In the laboratory, two hundred flowers were separated from the stems collected in each field and placed in a labeled bag according to the field treatment origin (control vs. treated) and stored in an ultra-freezer until they were shipped overnight on dry ice for pesticide residue analysis.
Pollen was collected from returning foragers with a hive front entrance pollen trap (Anatomic Front Mount Pollen TrapTM, Better Bee, Greenwich, NY, USA). The sampling was conducted each year 7–10 d after the hives were placed in the fields. The pollen traps were attached to each of the hive entrances without the trapping gate set for 24 h, allowing honey bee foragers to adapt to moving through the pollen trap. On the following day, the trapping gate on the pollen trap was closed, and pollen was trapped for 48 h, as foragers returned to the hive with pollen after foraging [32]. When honey bees with pollen moved through the pollen trap to enter the hive, a proportion of pollen was dislodged from their corbiculae and was collected in the pollen trap tray. Pollen was transferred to a labeled 0.95 L ZiplockTM freezer bag and stored in an ultra-freezer until they were shipped overnight on dry ice for pesticide residue analysis to the quantitative chemical analytical laboratory at the Connecticut Agricultural Experiment Station, New Haven, CT, USA.
Returning honey bee foragers were collected 3 d after the hives were placed in the fields. At each hive entrance, 5–10 honey bees were collected with a 38 cm diameter mesh sweep net. Collected bees were transferred to a 0.5 l collecting jar, placed in an insulated cooler with ice packs and transported to the laboratory where they were euthanized in a −20 °C freezer prior to transferring them to labeled 0.95 L ZiplockTM freezer bags and stored in an ultra-freezer until they were shipped overnight on dry ice for pesticide residue analysis to the quantitative chemical analytical laboratory at the Connecticut Agricultural Experiment Station, New Haven, CT, USA. The limit of detection (LOD) for pollen was 0.5 ppb and for flowers and honey bees was 1.0 ppb.
Poisson regression was used to determine if there was evidence for significant differences between control and treatment flower, trapped pollen, and foraging worker propiconazole residues [31]. Year was considered statistical block. Poisson regression was also used to determine if, when ranked 1–3 (flowers, trapped pollen, and foragers), there was a decline in residue concentration from flowers to trapped pollen to foragers. Whenever propiconazole was not detected (ND), a value halfway between 0 ppb and the LOD (midpoint) was used in statistical analyses even though the true value could be between 0.0 and the LOD. The analyses using this midpoint did not result in conclusions that were different from analyses where ND samples were coded as 0.0 or the LOD value and so the analyses using the midpoint value were reported.

2.2.2. Assessment of Colony Health (2011–2013)

Queen status (2011–2013). Colony health sampling was conducted three times during bloom at 7–10 d intervals. Measures included recording queen status (marked queen, unmarked queen (i.e., supersedure), queen absent), presence of eggs and larvae or brood, and the occurrence of developing (containing eggs or larvae) supersedure or swarm cells. Analysis of variance (RCB, year as a statistical block) was used to determine if there was any difference in marked queen status, supersedure rate (proportion of unmarked queens), developing supersedure cells, and proportion of egg and larval presence in the colonies due to treatment over the three years [31].
Sealed brood and worker population sizes (2011–2013). Capped or sealed brood and adult worker populations were estimated by determining the percent area of wax comb on varying sized hive bodies occupied by sealed brood and workers. This population monitoring was conducted three times during bloom and 2–3 times during the summer (2011 and 2012: mid-July and mid-September; and in 2013: early July, mid-August, and early September). To measure population size, the number of sealed brood and workers per frame were estimated using a frame grid tool that was split into 2 quadrants, 8 sections, of 110 cm2 per section. The proportion of coverage per frame was estimated as the number of sections covered by worker bees and repeated for capped brood for both the front and back of each frame (Figure 2A). Proportion of workers and brood per frame were determined using the following Equation (1):
Proportion per frame = [(Quadrats of frame filled) * (Surface area of one quadrant)]/(Total surface area of frame)
Total number of workers and brood in the colony was determined by accounting for frame size, derived from published formulae by Delaplane et al. [33] and then applying Equation (1). All equations were based upon North American frame types; Langstroth deep frame and medium frame. More detail of this assessment method can be found in Souza Cunha et al. [34]. The assessment was performed two times during bloom for each colony in each of the two fields each year by sampling each colony twice—(1) shortly after hive deployment in blueberry fields and (2) just before bloom ended. A measure of population growth was calculated by determining the percent rate of change from the first sample to the second sample of both sealed brood and workers. Previous studies have found that colony strength and its rate of change is a reliable measure of colony health [35]. Equation (2) was used to estimate the percentage rate of colony population change between the first and second samplings of the colonies is described below.
% rate of change = [(Colony strength at time t) − (Colony strength at time t + 1)]/(Colony strength at time t) * 100
Analysis of variance (RCB) was used to determine if there was any difference in percent sealed brood and worker population rates of change due to treatment over the three years [31].
Queen oviposition rate (2011–2013). Queen egg-laying was assessed in early June (late bloom) each year by confining queen in a cage (Figure 2B) built to enclose an empty deep drawn wax frame for 2 d. Nurse bees had access to the frame so that the queen could be fed and so royal jelly could be deposited in cells. After 48 h, the queen and workers were placed back in the hive on a new drawn frame and the frame in the queen excluding cage was taken back to the laboratory to count the number of eggs laid over the 2 d period. This was performed in each of five hives in each of the two fields. Analysis of variance (RCB) was used to determine if there was any difference in queen oviposition rate due to treatment over the three years.
Egg survival rates (2013). In 2013 only, twenty-five eggs were located and marked on each of the frames that were placed in the excluder cages and brought back to the laboratory in each year. The frames were placed in environmental chambers at 30 °C and a 24 h scotophase. The chambers were provided with pans underneath filled with tap water to provide high relative humidity conditions (70–80%). Hatch of eggs was recorded over a 5 d period. Statistical analysis was not performed because of only one year of data. Data were summarized and means were presented with 95% confidence intervals.
Brood proportion survival rates and worker emergence and longevity rates (2011–2013). In July of each year, a full frame of brood was taken from each of 5 randomly selected hives (4 colonies in 2012) from each experimental group (i.e., field) and stored in mesh cages (Figure 3A) in an environmental chamber at 35 °C, 95% RH and a 24 h scotophase. Emergence rate of the workers (brood survival) was estimated by counting the number of non-emerged worker cells on each frame and calculating the proportion of emerged adults from the number of total sealed brood incubated. Analysis of variance (RCB) was used to determine if there was any difference in queen oviposition rate due to treatment over the three years. Longevity of a subset of the newly emerged workers was assessed by setting up 5 replicates (1 per hive) of 15–20 workers from each emerged frame in a wire cage with access to sugar syrup (1:1 sugar: water by volume) vials and 2 g pollen substitute (Bee Pro®) mixed with 5 mL 1:1 sugar syrup and placed in 3 cm diam. watch glasses in environmental chambers at 35 °C, 95% RH with a 24 h scotophase (Figure 3B). Daily assessment of worker longevity was estimated by counting the number of dead workers until all workers had died, about 25–30 days. Parametric survival analysis (Weibel distribution) was used to estimate the mean daily mortality rates for each year [31]. Analysis of variance (RCB) was used to determine if there was any difference in worker daily mortality rates due to treatment over the three years [31].
Royal jelly secretions (2013). In 2013 during mid-bloom, wax comb was excised from frames of 5 colonies that had cells provisioned with royal jelly, but did not contain eggs or brood. The comb samples were transported back to the laboratory and the royal jelly was carefully scraped from the back of 25 cells of each colony collection and weighed. A mixed general linear model was used to determine if there was any difference in royal jelly provision rates due to treatment in the single year of 2013. This experiment was essentially pseudoreplicated as there was only a single true replicate year, but colonies as subsamples. No statistical analysis was performed due to only having data for one year. Data were summarized and means were compared with 95% confidence intervals.
Hypopharyngeal gland development (2011–2013). To determine potential physiological effects of propiconazole exposure, dissection of 5 d old nurse bee worker heads (3 collected per colony from 4–5 colonies per treatment) was conducted in all three years. Measurement of the surface area of the acini (a discrete lobe structure that constitutes the hypopharyngeal gland). This gland is an important endocrine gland in the honey bee that secretes royal jelly in cells for workers and queens and have been shown to be affected by multiple abiotic and biotic stresses [36]. Bees were collected in July and stored in the freezer (−20 °C) until dissection. Bees were taken out of the freezer and stored at room temperature (ca. 22 °C) prior to dissection. These nurse bees would have been exposed as larvae during blueberry bloom. Under a dissecting microscope at 60X, acini were photographed and then image analysis software was used to measure the surface area of the acini. The procedure was as follows: (1) secure nurse bee head in a wax lined dish filled with Ringer’s solution, remove the entire hypopharyngeal gland from behind the eyes and pipet the gland to a clean dish filled with Ringer’s solution. Under 60X magnification the gland was teased apart into free acini and 8 randomly selected acini were individually photographed. The digital images were then uploaded to a computer and the software, PhotoshopTM (version 12.0, Adobe Inc., San Jose CA, USA), was used to measure each of the 8 acini (2048 × 1536 pixels) by tracing the perimeter of each acinus and measuring the area within the perimeter. An average acinus size was calculating for each bee and then an average was estimated across all colonies in each treatment and year. Analysis of variance (a randomized complete block design, with year as a block) was used to determine gland acinus size due to treatment over the three years [31].
Honey bee forager activity rates (2011–2013). Honey bee forager activity was assessed by making 3-min counts of the number of worker bees returning to each colony and averaged over the colonies at each of the two experimental fields. This was performed three times during bloom each year, for more detail see [37]. Analysis of variance (RCB) was used to determine if there was any difference in forager daily activity rates due to treatment [31].
Varroa and tracheal mite infestations (2011–2013). At the end of the summer (August) in each year, Varroa destructor (Anderson and Trueman), and tracheal mite, Acarapis woodi (Rennie) infestations were estimated from each of the colonies in each treatment field. Approximately 250–300 workers were collected in a 250 mL polyethylene cup from brood areas in each hive using the methods suggested by Hendrickson [38]. Bees were preserved in 95% ETOH until processing. In the laboratory, the number of varroa mites and workers were counted. A ratio of the number Varroa mites per 100 bees was determined. The same worker bees used for Varroa mite assessments were then dissected for tracheal mite assessment using the technique developed by Sammataro [39]. Tracheal mite infestation was quantified as the percent of honey bee workers with tracheal mite detected by dissection for each colony. MANOVA (RCB) was used to determine if differences in mite infestation was due to treatment over the three years [31].
Pathogen association (2011–2013). Six honey bee viruses and 2 microsporidians were assessed using molecular markers. During late bloom (early June) in all three years, approximately 200 worker bees were collected from both brood and nectar and pollen containing frames in each hive. The collected honey bees were transported at the end of the day from the field to the laboratory at the University of Maine, Orono, ME, USA in insulated coolers containing ice packs. Once at the laboratory, samples were stored at −80 °C in an ultra-freezer. In 2014, bees were shipped on dry ice to the National Honey Bee laboratory in Beltsville, MD, USA, for molecular detection of pathogens using qRT-PCR analysis. Each sample was screened for six known honey bee viruses: Israeli acute paralysis virus (IAPV), black queen cell virus (BQCV), Kashmir bee virus (KBV), chronic bee paralysis virus (CBPV), sacbrood virus (SBV), and deformed wing virus (DWV). In addition, two common honey bee microsporidians were assessed: Nosema ceranae Fries, and the Trypanosome group of pathogens at the order level. Quantitative PCR was used to assess the presence of the pathogens and the intensity of infection (estimated number of viral copies). The normalized intensity of infection was logarithm (base 10) transformed for analysis. MANOVA (RCB) was used to determine if differences in pathogen occurrence and intensity of infection were due to treatment over the three years [31].
Overwintering colony losses (2011–2013). As stated previously, colonies were moved back to Orono after bloom (mid-June) and monitored throughout the rest of the summer and fall. In the fall all surviving hives were wrapped and fed with sugar syrup (1:1 volume, sugar: water) for overwintering. In the spring (March–April) colonies were evaluated for survival by visual; hive inspection. The proportion of colonies surviving due to treatment was assessed using logistic regression with year and treatment as fixed effects [31].

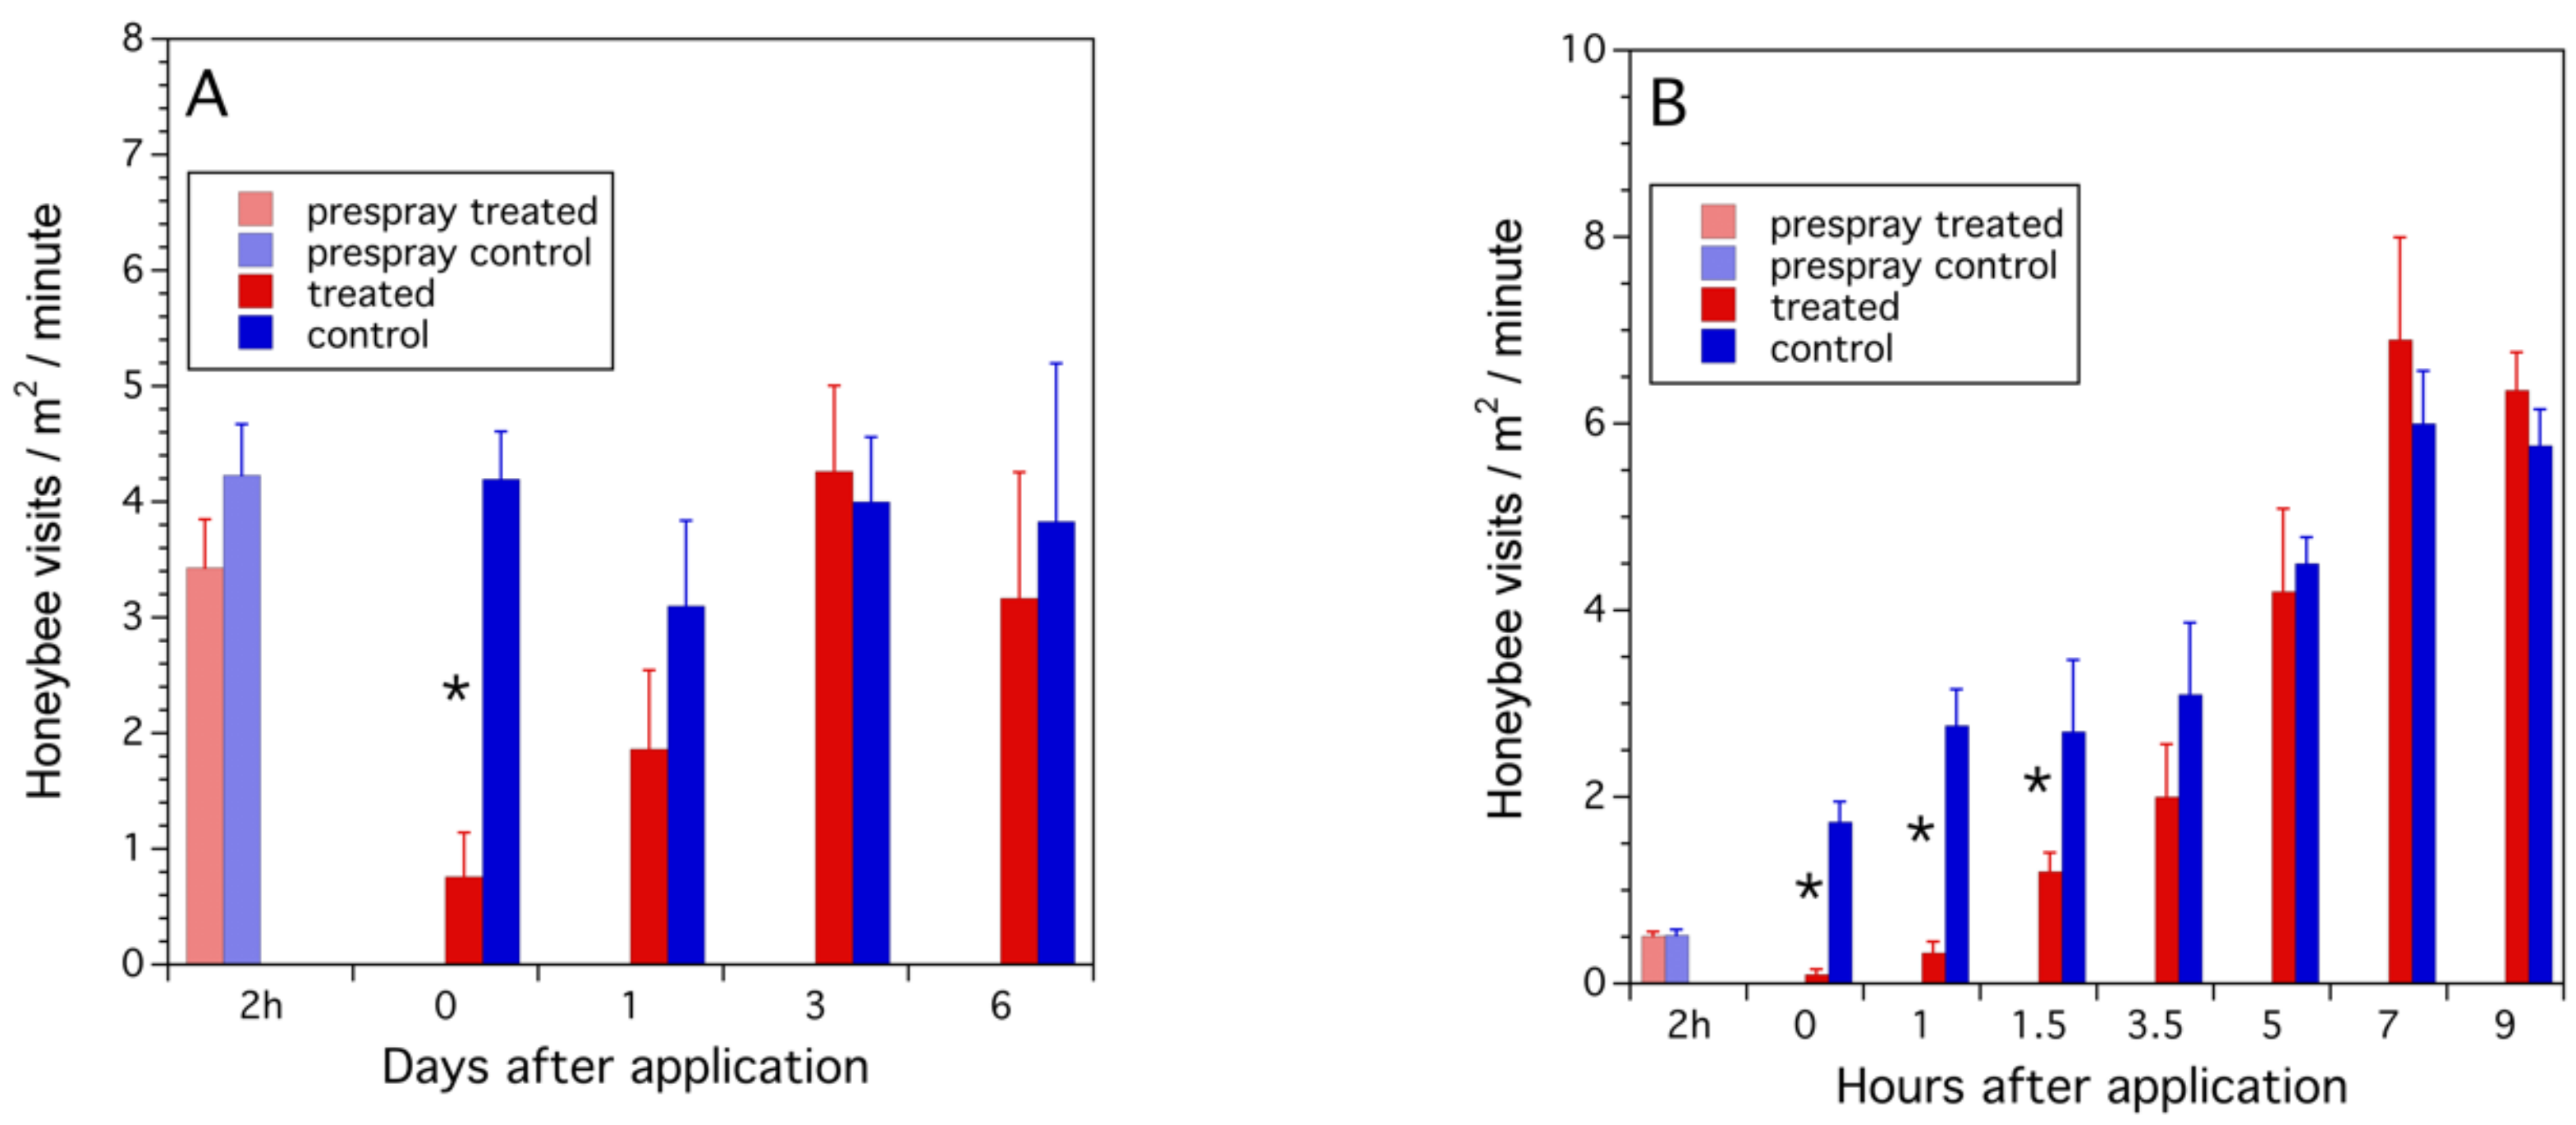
2.2.3. Repellency of Bloom Sprayed with Propiconazole (2013–2014)

A randomized complete block (RCB) design experiment was conducted in 2013 and 2014 at the University of Maine Blueberry Hill Experimental Farm (Jonesboro, ME, USA). In each year in a field in bloom, 6 square plots (7.6 × 7.6 m) were staked at the corners and the perimeters were lined with string. At the onset of lowbush blueberry bloom Orbit® fungicide was applied with a CO2-propelled backpack sprayer as described previously (see Section 2.1.2.: Degradation of propiconazole in the field from the time of application until the end of bloom). Fungicide was applied to a single plot in each of three replicate statistical blocks. The other plot in the blocks was not sprayed with fungicide, but were sprayed with uncontaminated well-water. In both years the numbers of honey bees foraging in a randomly placed 1 m2 quadrat in each plot were counted for 1.0 min. In 2013, the bee counts were made 2 h prior to the fungicide application and then 0 h (immediately after spraying), and then 1, 3, and 6 d post application. In 2014, the counts were made 2 h prior to the fungicide application and then 0 h (immediately after spraying), and 1, 1.5, 3.5, 5, 7, and 9 h post application. The sampling time interval occurred over a single day in 2014 since the repellency effect appeared to be of a short duration in 2013. Generalized linear models using a Poisson distribution and a log link function were used to evaluate differences in honey bee foraging density in the treated vs. control (non-treated) plots at each sampling time [31]. In addition, a time × treatment interaction was tested to determine if the difference between the two treatments changed over the course of the experiment. A second set of Poisson models was fit to each sampling time in order to estimate individual sampling time effects on honey bee foraging densities [31]. Because the sampling time intervals were different between years (days in 2013 and hours in 2014), each year was treated as a separate experiment for purposes of analysis.

3. Results

3.1. Propiconazole Exposure Experiments

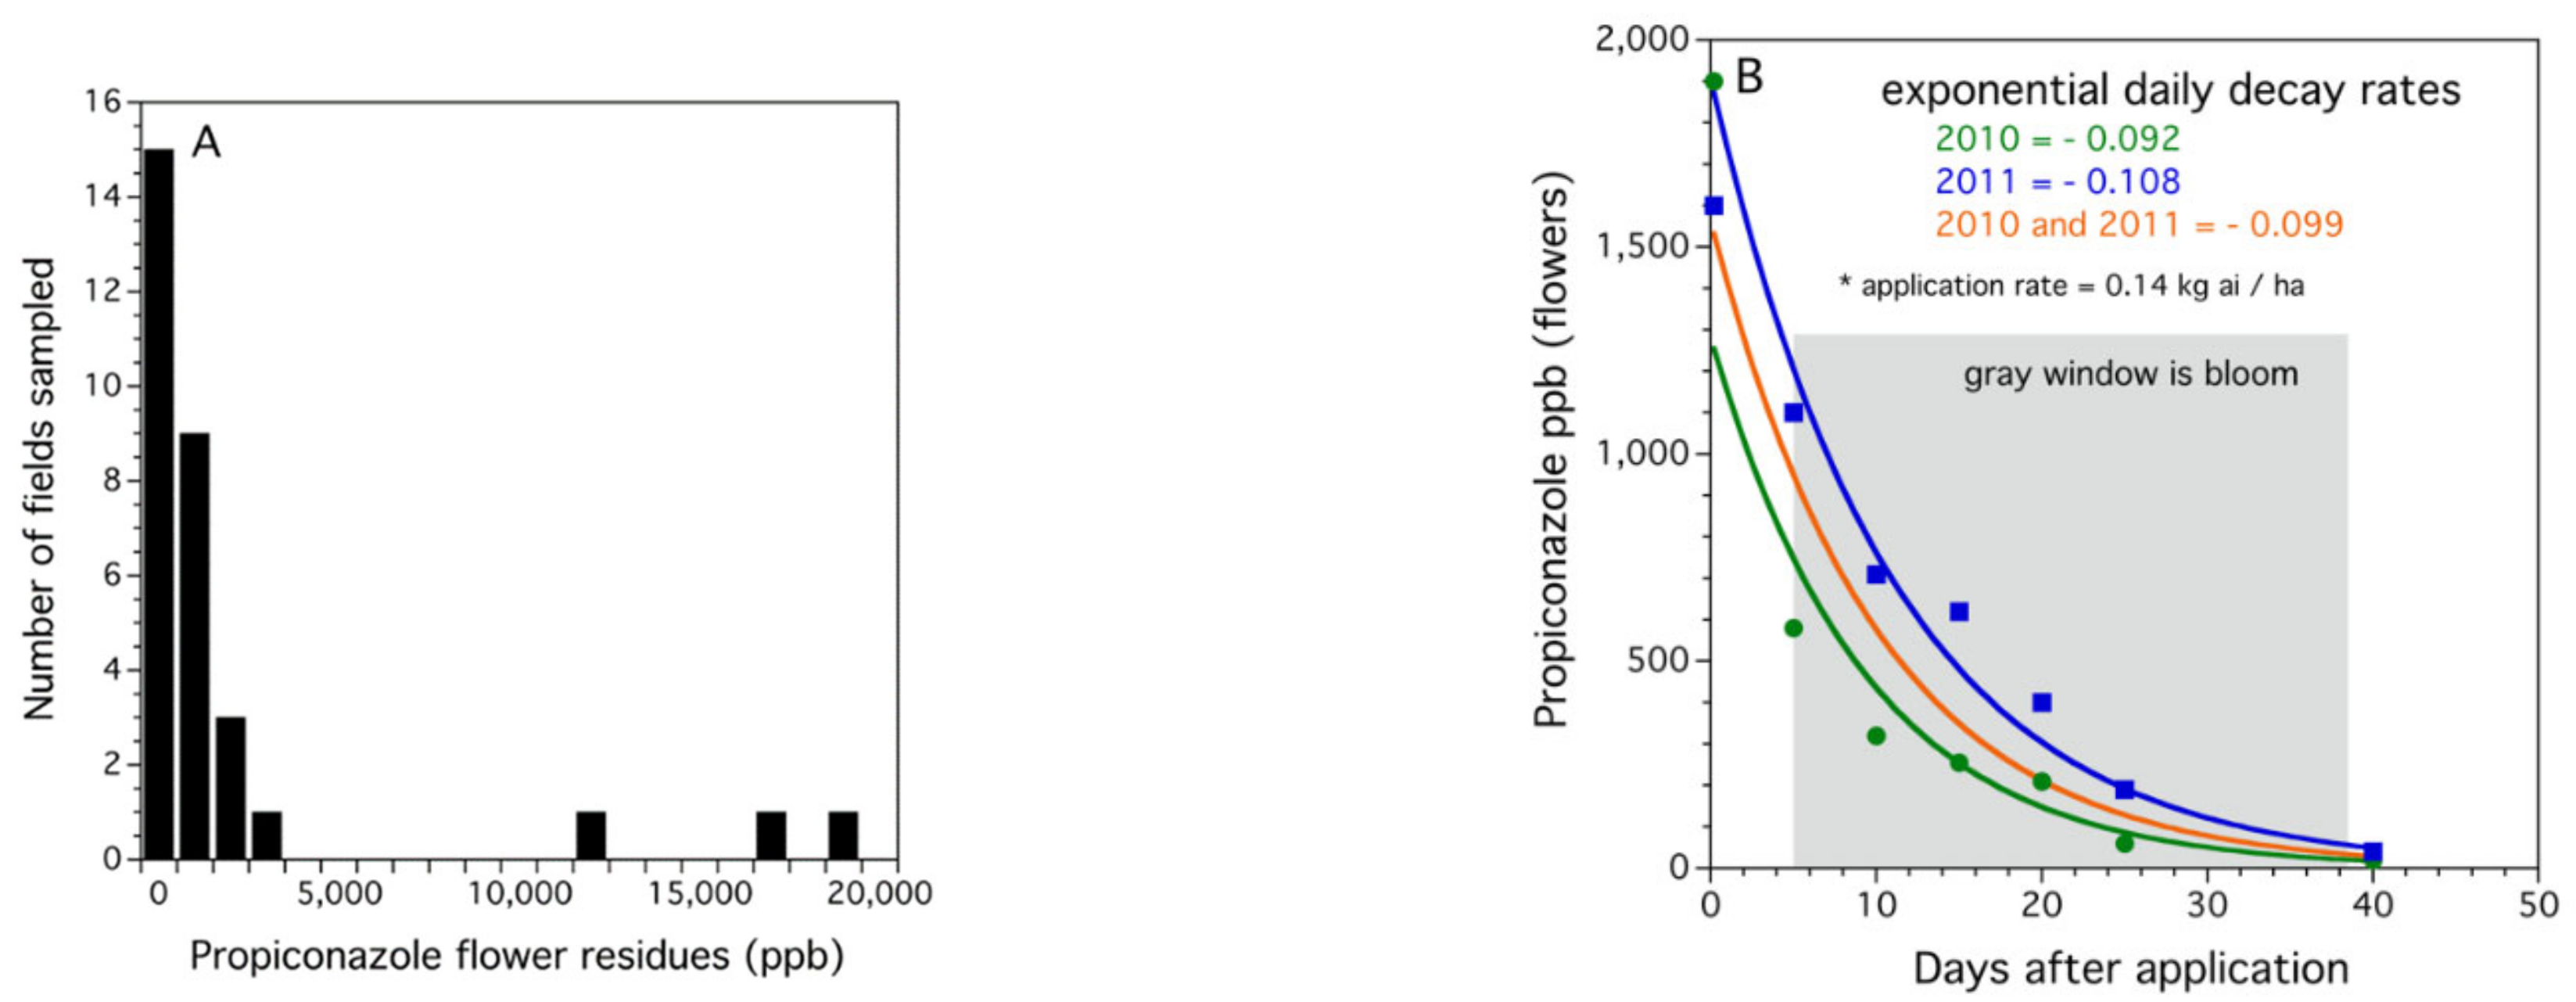
3.1.1. Propiconazole Residues on Lowbush Blueberry Flowers in Fields in Bloom

Sampling flowers during bloom revealed that flowers still had propiconazole residues on them despite being sprayed 1–2 weeks prior to sampling (Figure 4A). The frequency distribution of flower residue concentrations was best explained by a 3-parameter Gamma probability density function ( α = 0.306, σ = 6819.0, θ = 0.00). The Gamma probability density function was a good fit to the data (Cramer-von Mises W test: W2 = 0.148, p = 0.250). The expected median propiconazole concentration was 525.2 ppb based upon the estimated Gamma distribution. The mean concentration was 2083.8 ± 851.3 (standard error) ppb.

3.1.2. Degradation of Propiconazole in the Field from the Time of Application until the End of Bloom

Figure 4B shows the exponential decay of propiconazole residues on flowers during lowbush blueberry bloom. The figure suggests that exposure to foraging honey bees is possible throughout bloom with applications that are applied 5 d prior to bloom. The estimates of exponential decay were −0.092 ± 0.008 (r2 = 0.988, p < 0.0001) in 2010 and −0.108 ± 0.023 (r2 = 0.903, p = 0.012) in 2011. Analysis of variance did not provide evidence of a difference in decay rates between years (p = 0.18). The overall exponential decay for both years pooled was −0.099 ± 0.002 (r2 = 0.893, p = 0.018).

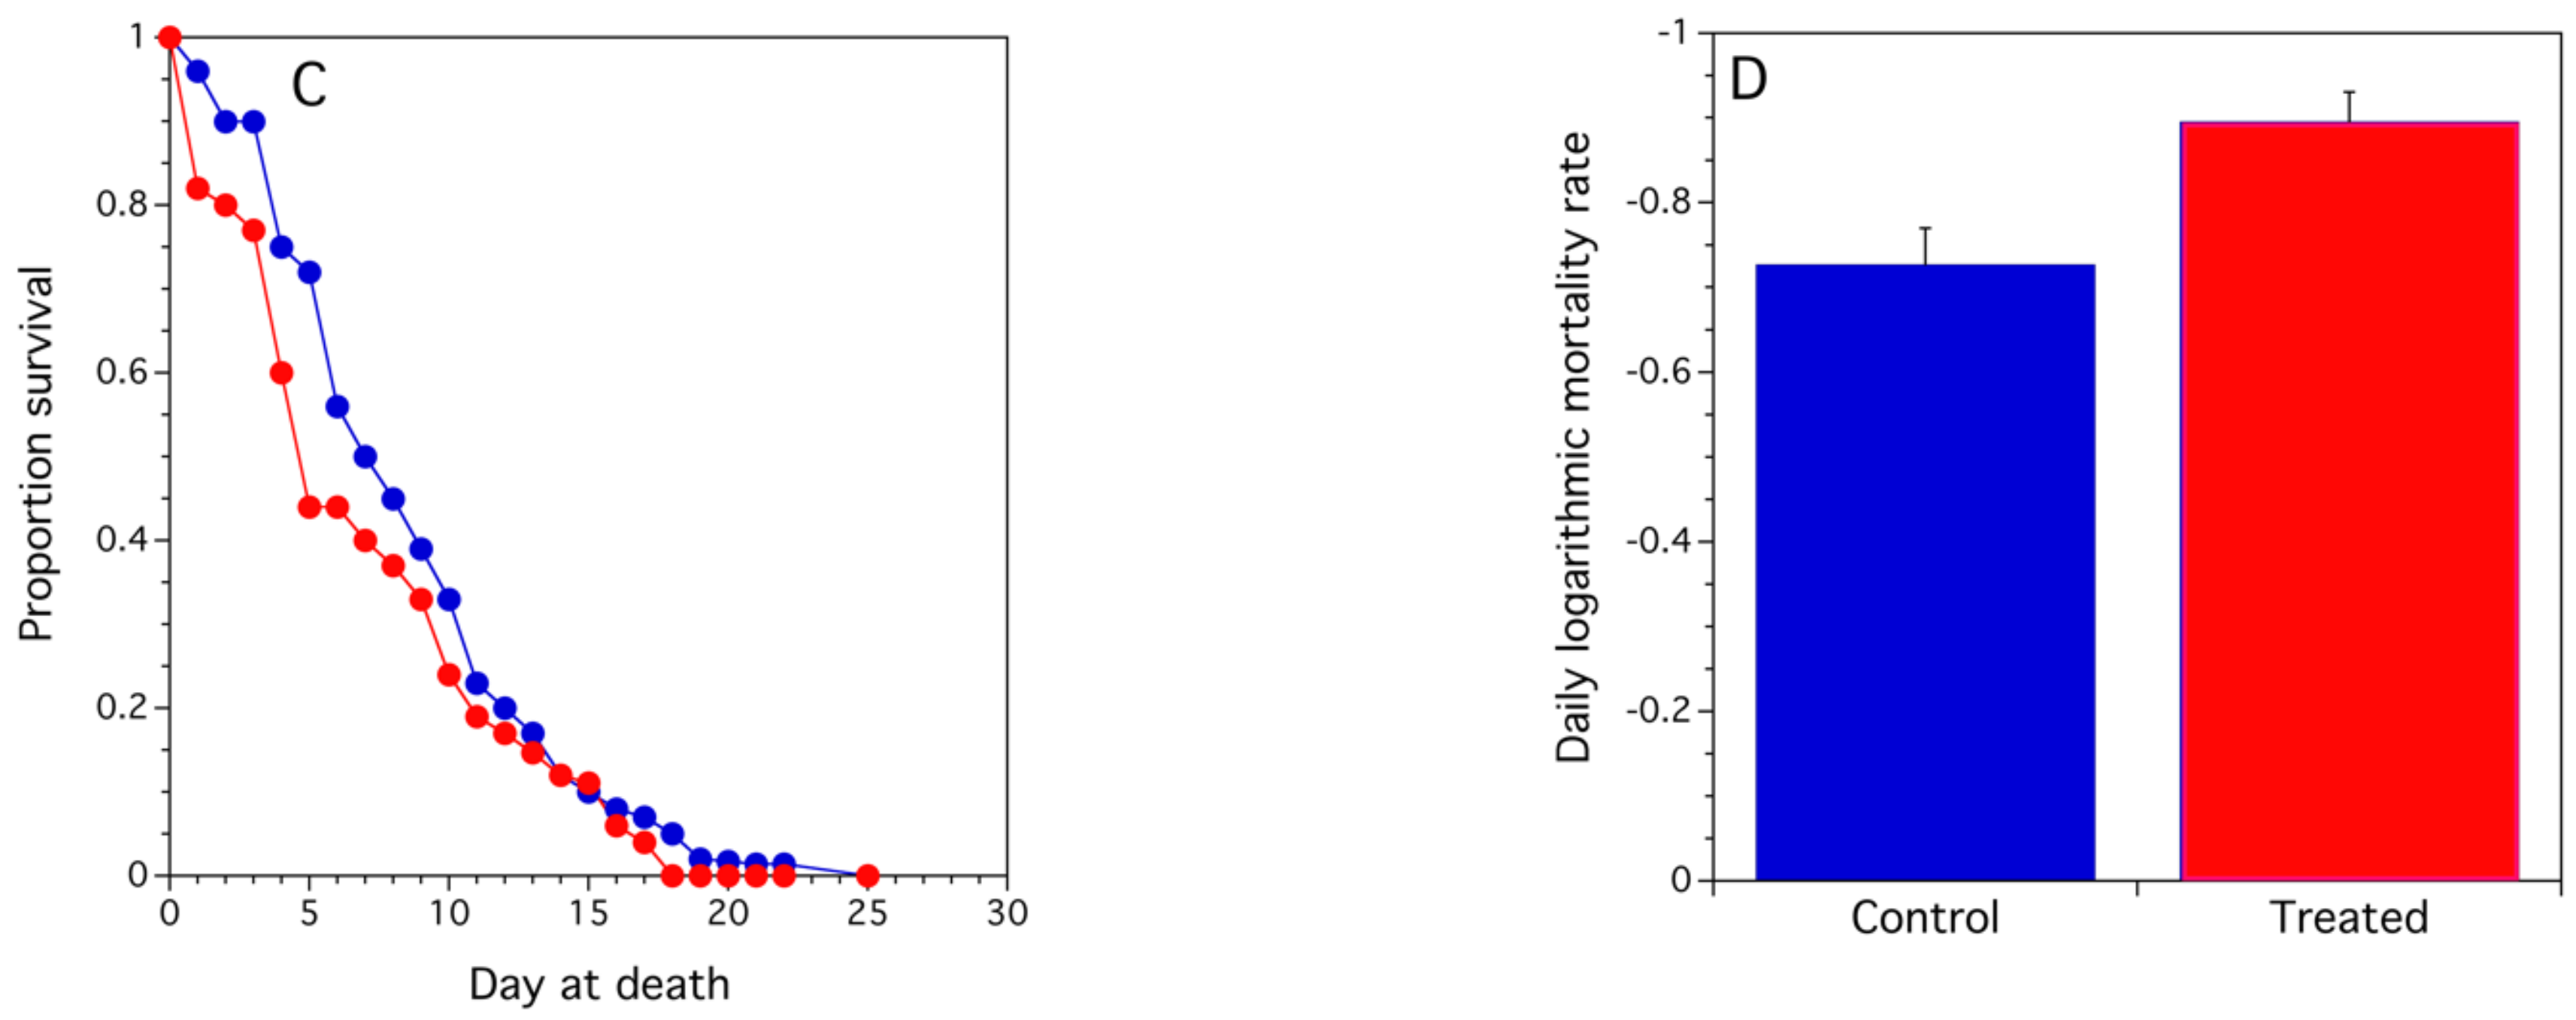
3.1.3. Bioassay for Estimating Acute Contact Mortality in Worker Honey Bees

Figure 5 shows the acute 24 h response in mortality to dose. There was a significant response of the proportion mortality (logistic regression) to logarithm transformed propiconazole dose (ppb) (Wald chi-square λ (1) = 97.045, p < 0.0001, generalized r2 = 0.68). There was no evidence for a replicate effect (p > 0.05). The estimated LD50 (lethal dose resulting in 50% mortality), based upon the logistic regression was 24,747 ppb. However, the 95% confidence interval about the LD50 was large, ranging from 16,944 to 35,109 ppb.

3.2. Experiment on the Detrimental Effects of Exposure to Propiconazole

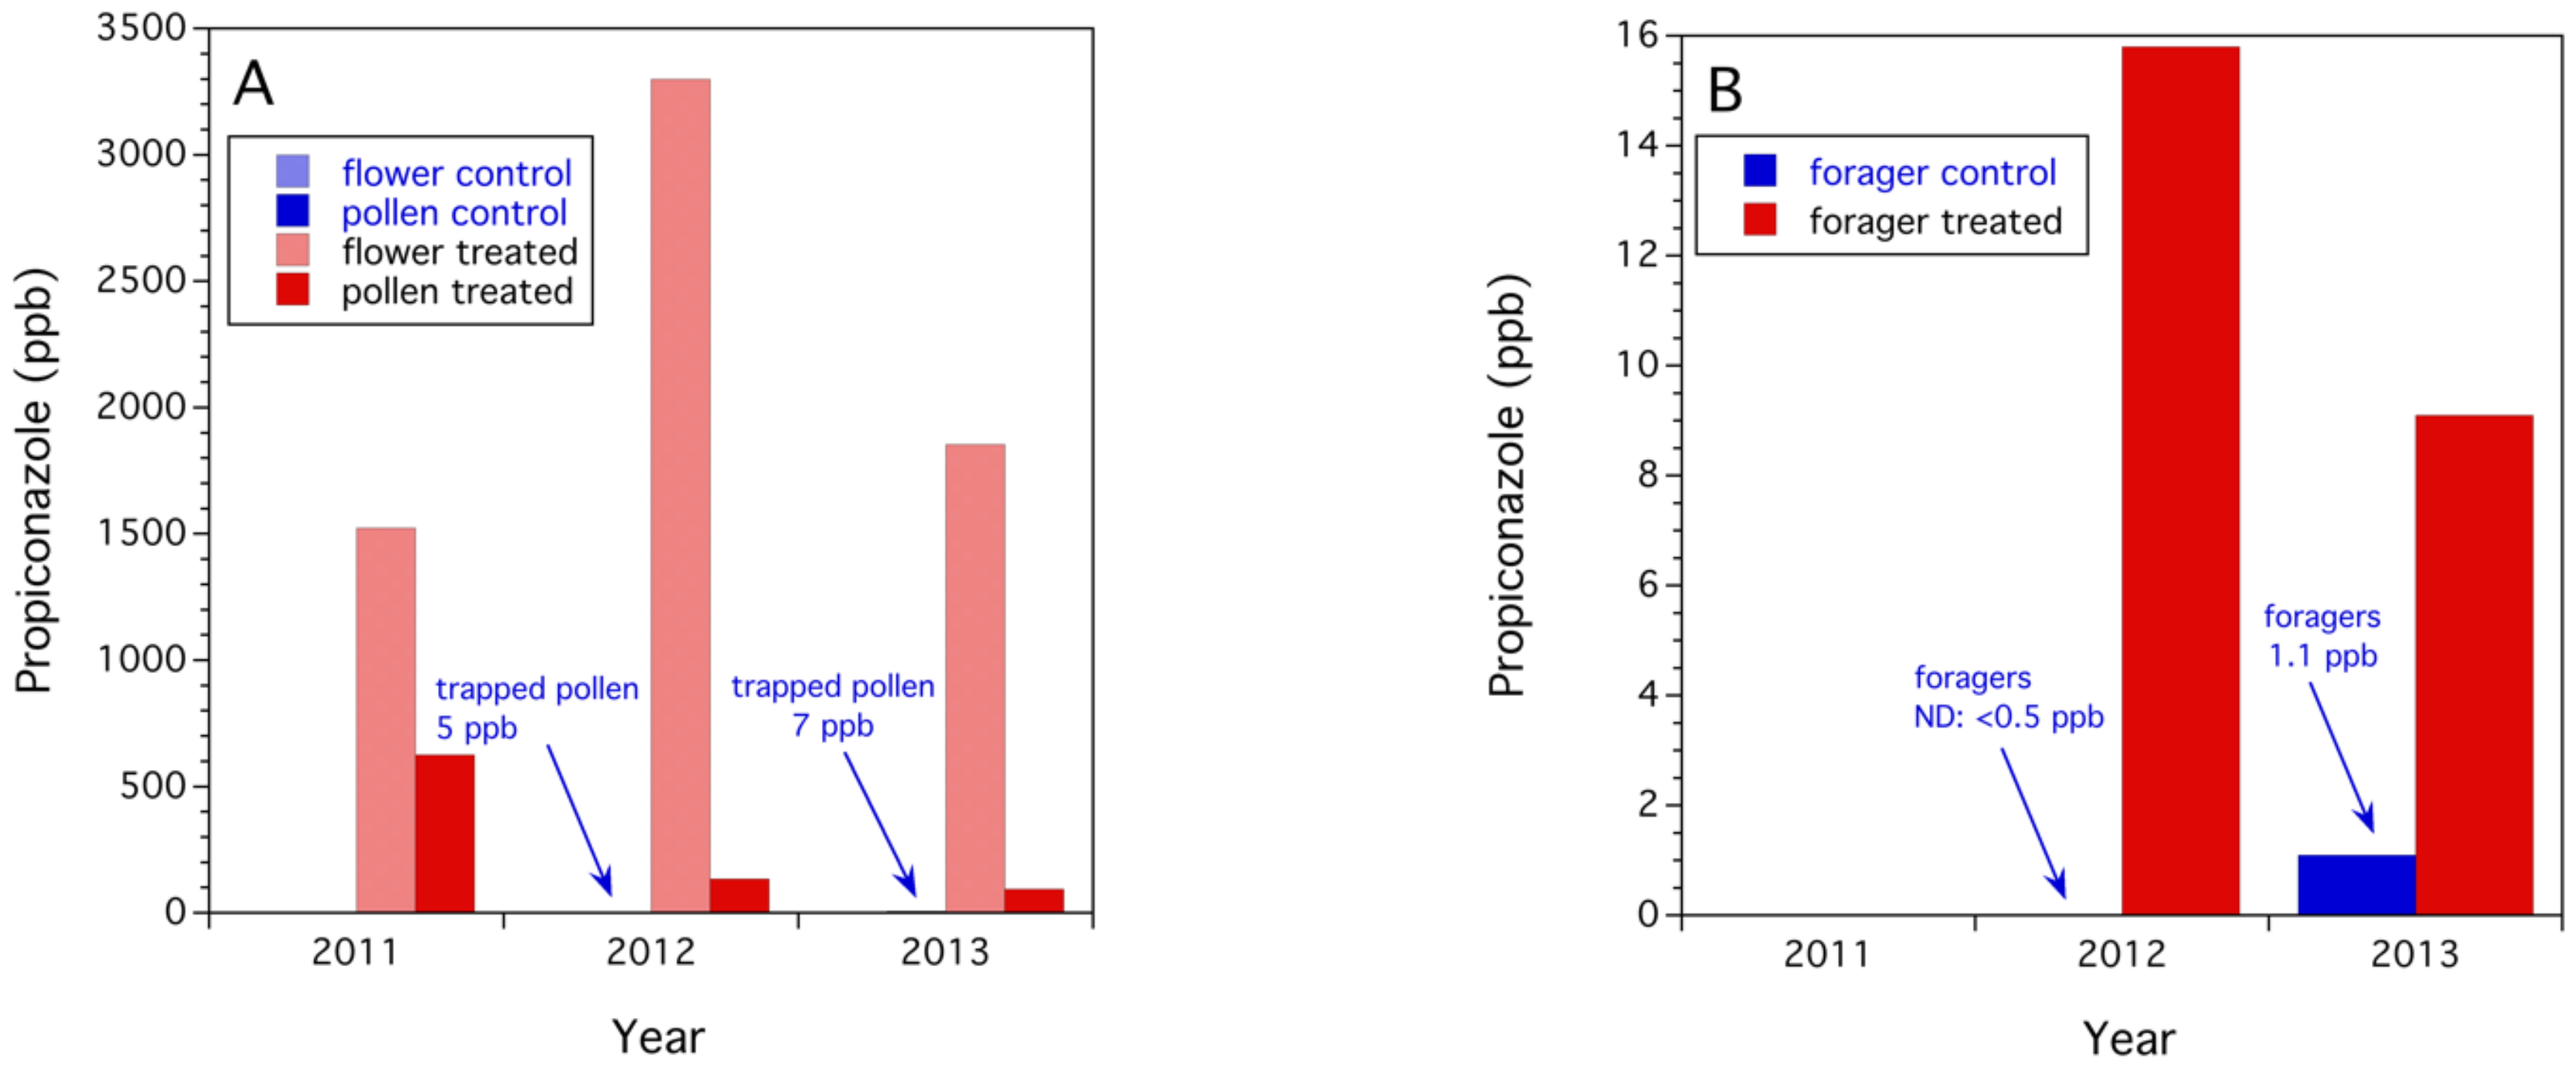
3.2.1. Propiconazole Residues on Flowers, Trapped Honey Bee Pollen, and Foraging Honey Bees

Figure 6A depicts the flower propiconazole contamination for each year in both the propiconazole treated fields and the non-sprayed control fields. A Poisson regression provided evidence that exposure of honey bee foragers to contacting propiconazole residues on flowers was significantly higher in treated fields than in control fields over the three years ( λ 2(1) = 74.23, p < 0.0001). The average propiconazole concentration on control flowers was < 1.0 ppb (LOD = 1.0 ppb), whereas, the average concentration in treated fields was 2226.0 ± 545.5 ppb. The propiconazole concentration on the treated flowers was similar (2083.8 ± 851.3 (s.e.) ppb) to that found in the large field survey conducted from 2009 to 2011, reported previously.
Control fields did exhibit a small amount of propiconazole contaminated trapped pollen in 2012 and 2013 (Figure 6B). Overall, there were significantly higher propiconazole concentrations on trapped pollen collected in treated fields (284.7 ±   170.6   ppb ) compared to control fields (4.0 ±   2.1   ppb ), λ 2(1) = 214.14, p < 0.0001. There was no contaminated pollen trapped in 2011, but in 2012 and 2013 there was 5 and 7 ppb, respectively (Figure 6A).
Propiconazole residues were not detected on honey bee foragers in 2012 control fields, but a low concentration, at the limit of detection, was detected on control foragers in 2013 (1.1 ppb, Figure 4B). Over the two years that foragers were sampled, significantly higher concentrations of propiconazole were associated with foragers in treated fields (12.5 ±   3.3   ppb ) than in control fields (<1.0   ppb ,   LOD = 1.0   ppb ), λ 2(1) = 10.21, p = 0.001. In treated fields, the results suggest that there is a dilution effect or decline in propiconazole residue concentration from flowers to collected pollen to foraging worker bees (Figure 6A,B). A Poisson regression showed that the concentrations of propiconazole in treated fields declined exponentially when the ranked (flowers = 1, trapped pollen = 2, foraging worker = 3) residue samples transitioned from flowers to trapped pollen to foraging workers ( λ 2(2) = 4238.9, p < 0.0001, β = −2.149, generalized r2 = 0.92).

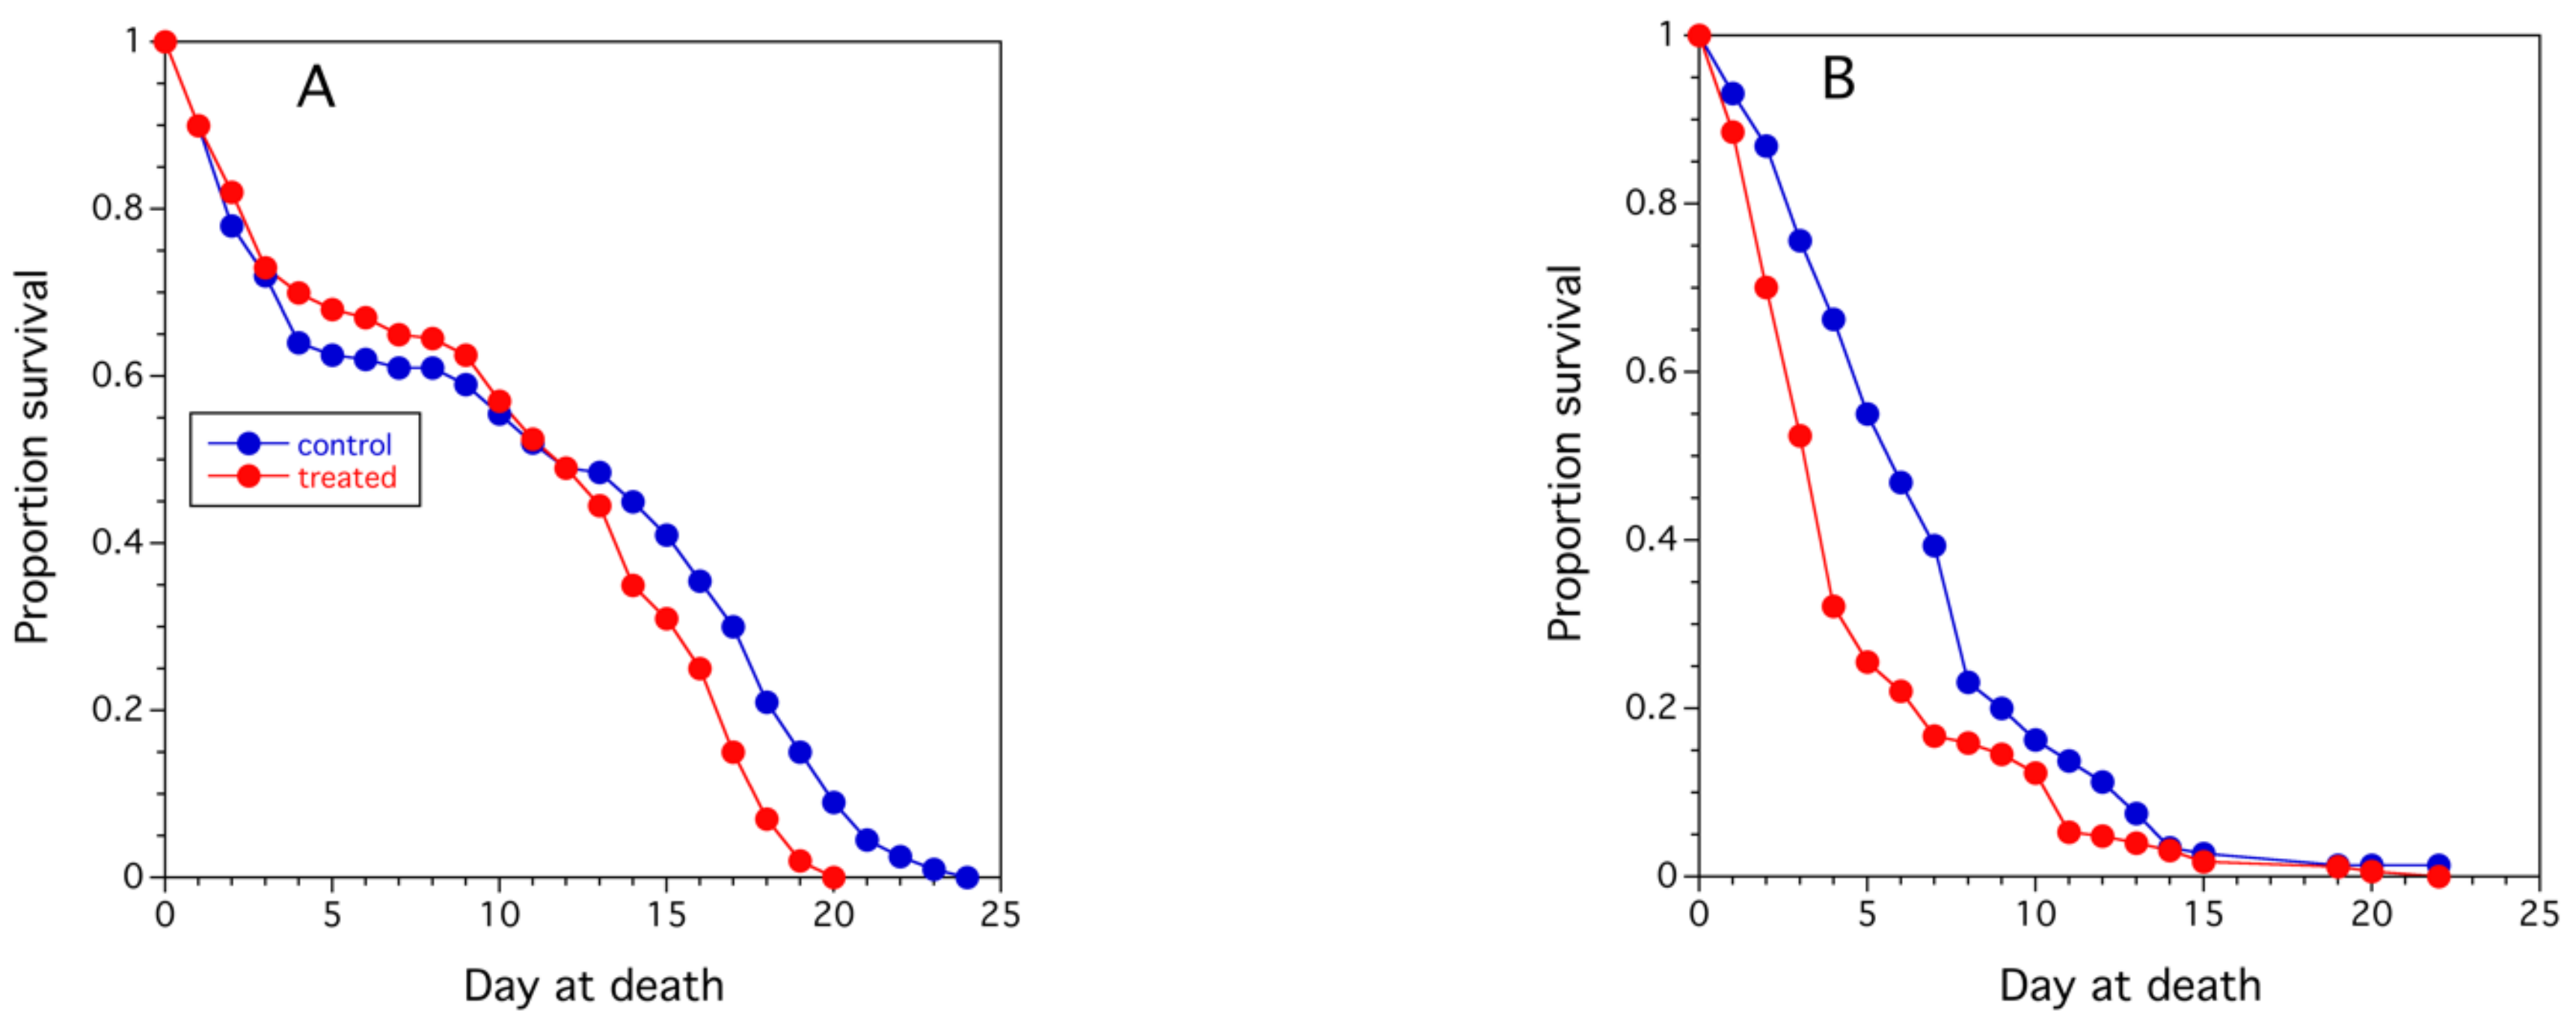
3.2.2. Assessment of Colony Health

We found no significant fungicide treatment effects (p > 0.05) over the three years on most of the colony health indices measured. These were proportion original queen presence (p = 0.506), proportion queen supersedure (p = 0.929), and queen oviposition rate. Queen egg-laying was not significantly affected by exposure to propiconazole in 2011 and 2013, and for the entire three-year period (mean ± se, egg laying rate per 2 d was 1426 ± 196.5 (fungicide treated) compared to 1449 ± 176.3 (control) (F(1,2) = 0.001, p = 0.998). However, I saw an unexpected result in 2012. Queens exposed to fungicides actually had a higher rate of oviposition than those not exposed (control = 1109 eggs/2 d and fungicide treated = 1765 eggs/2 d). I also looked at the mal-adapted behavior of workers laying multiple eggs in a cell in 2012. There was no difference in multiple egg laying (F(1,8) = 0.460, p = 0.348). In addition, in 2012 only, I measured worker deposition of nectar in cells in 3 frames in the brood area of every colony. There was no evidence to support a significant difference in nectar deposition ( λ 2(1) = 0.00004, p = 0.995) determined by Poisson regression.
Other measures that were not significantly affected by fungicide application prior to bloom were: proportion egg hatch in 2013 (control = 94.3 + 7.4% vs. treated 90.2 + 6.1%, intervals are 95% confidence intervals), brood and adult proportion survival (p = 0.311), sealed brood (p = 0.495) and worker (p = 0.843) population strengths (also MANOVA, p = 0.654) and differences in % rates of change for sealed brood and workers (p = 0.556 and p = 0.711), forager activity returning to the hive during bloom (p = 0.736), mite parasite proportion infestation (p = 0.382) intensity or pathogen intensity associated with workers (p = 0.752, see Appendix A for infestation and infection levels, Figure A1A,B), 2013 royal jelly deposition (control = 0.00185 ± 0.0003 mg/cell vs. treated = 0.00181 ± 0.0003 mg/cell), and fall or over-wintering colony survival proportions (p = 0.441).
Figure 7 shows the mean sealed brood and worker population colony strength over the three years by treatment. One can see that in 2011 (Figure 7A,D) and 2013 (Figure 7C,F) the populations of both sealed brood and workers were very similar among treated and control fields. In 2012 (Figure 7B,E); however, sealed brood populations were quite different. Fungicide treated fields had much less brood during and just after bloom than control fields. Although adjustment of the population levels by the before bloom population levels via covariance analysis suggest that part of this phenomenon is because of differences in initial population levels. Overall, treated and control populations were not significantly different (MANOVA, F(1,2) = 0.136, p = 0.654). A bee stage (sealed brood vs. worker) × year interaction was significant (MANOVA, F(2,2) = 601.462, p = 0.002) suggesting a significant deviation in the brood to worker ratio over years.
A more controlled laboratory experiment did show that worker honey bees reared as larvae in colonies during bloom in fungicide treated fields appeared to have a lower survival rate or longevity compared to those reared in control fields (Figure 8A–C). An analysis of variance of the daily logarithmic (base 10) mortality rate, derived from the survival curves, provided evidence of a 17.3% greater rate in treated fields than control fields (F(1,2) = 79.307, p = 0.012, Figure 8D). This suggests that exposure to propiconazole during brood rearing in bloom may have affected worker longevity.
A trend ( α = 0.10) in hypopharyngeal gland development was observed (Figure 9). The size of the hypopharyngeal gland acini in young 5 d old nurse bees exposed to propicon-azole during bloom when they were developing as larvae, were larger than acini of control nurse bees. On average over the three years of this study, the gland was 8.3% larger (F(1,2) = 13.444, p = 0.067), although as stated previously, in 2013 when the amount of royal jelly deposited in worker cells was estimated between control and treated bees, the amounts were highly similar, 2.2% different.

3.2.3. Repellency of Bloom Sprayed with Propiconazole

Foraging across all plots prior to fungicide application (2 h pre-application) was not different in either 2013 ( λ 2(1) = 0.251, p = 0.616) or 2014 ( λ 2(1) = 0.0005, p < 0982). In 2013, a treatment × sampling time effect was observed with foraging honey bees ( λ 2(3) = 8.228, p = 0.042. Figure 10A shows that there was a significant difference in forager density between treatments at 0 h immediately after fungicide application, ( λ 2(1) = 10.634, p = 0.001). A similar trend appears for the 1 d sampling time, but it was not significant (p = 0.347), Figure 7A. In 2014, a treatment × sampling time was also observed with the more frequent sampling within a single day ( λ 2(6) = 13.118, p = 0.041). Figure 10B shows that the decrease in forager abundance visiting fungicide treated plots was only significant at 0, 1, and 1.5 h (p < 0.05), although a trend toward decreased forager numbers appeared at 3.5 h, but this was not significant (p = 0.397).

4. Discussion

In the past, fungicide exposure was assumed to be harmless to bees. This was primarily due to the thinking that the target organisms for fungicides, fungi, differed morphologically, physiologically, and ecologically from insects. However, the thinking has changed on this topic, especially since 2009 when the number of published studies on the effects of fungicides increased geometrically [40]. The recent review paper by Cullen et al. [40] suggests that many of the documented effects of fungicides on bees have been sublethal effects such as reductions in food consumption, lowering of metabolic rate, and compromised immune responses, few if any acute toxic exposures. They also point out that our current knowledge comes mostly from lab studies on oral exposure.
Designing field studies addressing the effects of pesticide exposures to honey bees is challenging. Honey bees forage long distances (average of 1.5 km radius from the hive, although distances up to 6 km are not uncommon) [41] and so small multi-plot studies in a single field does not allow a researcher to have control over exposure to different pesticides applied to those plots. Small field cages are not a good option because honey bees do not forage well in cages, and it is difficult to maintain the health of large colonies in cages [42]. The approach used in this study was to find large fields surrounded by forest and isolated from other blueberry fields by 2–3 km. The propiconazole residue concentrations, or lack thereof, that were found on foraging worker bees and trapped pollen suggested that this experimental design worked fairly well and resulted in exposure to treated fields and none to limited low levels of exposure to colonies in control fields. Advantages of this design is that honey bee colonies are exposed to ‘real’ agricultural crop residue levels, but the disadvantages are one of logistics and statistical power. Finding farmers that will accurately follow research protocols on their fields and using colonies that do not have a history of previous exposure to pesticides is not always easy. The review by Cullen et al. [40] mentioned that as of 2019, only 12 of 96 research studies designed to determine potential effects of fungicide or herbicide exposure to bees was conducted as a full field study. This reflects how challenging full field studies are to conduct with honey bees. In the case of the study reported on in this manuscript, a non-replicated randomized complete block design has disadvantages. It does not allow one to test treatment * block interactions. Therefore, in this study, a year * treatment interaction could not be tested, only the main effects of year and treatment. One suggestion for future field studies of this scale is to attempt to have several treated and control fields each year so that this important interaction can be tested, a hypothesis of consistency.
Despite these limitations, this study was able to provide evidence of several sub-lethal effects of propiconazole exposure due to field-level applications. It is not surprising that acute lethal effects were not found given the high contact LD50 of 24,747 ppb estimated in this study and the residue concentrations found in fields during bloom both in the 2009–2011 survey and the 2011–2013 field study. All fields sampled were much less than the estimated LD50, most fields were characterized by propiconazole concentrations of less than several orders of magnitude than the LD50. The reason the propiconazole concen-trations in fields varied from ND to 18,788 ppb is probably due to the number of applications of fungicide that were made in a given field, the number of days the fungicide(s) were applied prior to the sampling date in bloom, and the weather conditions between the time of application and sampling. However, the frequency distribution provides a range of residue levels that honey bees may be exposed to.
The environmental decay rate of propiconazole that was quantified in this study being exponential in nature would contribute to the lower hazard to foraging honey bees during bloom in fields that had been sprayed prior to bloom. Because there was no propiconazole detected on flowers in control fields, the experimental design for evaluating exposure to honey bees in treated fields appeared appropriate. Control flowers showed no evidence of contamination, this suggests honey bee foragers flew outside the perimeters of the control fields and picked up a limited amount of propiconazole that was transferred to the pollen they collected, probably from flower surfaces.
In addition, this study found that propiconazole concentrations on flowers were much higher than concentrations on foraging workers and these concentrations were higher than concentrations of propiconazole on pollen being brought back to the colonies. So there appears to be not only a temporal decay of residues on flower buds/flowers, but also losses of residue concentration as bees contact flowers and then loss of residue concentration as pollen is handled by bees as it is placed in their corbiculae (or if there is some systemic activity of the fungicide to the pollen, see [43]. Piechowicz et al. [44] also found a loss of fungicide and insecticide residue concentrations from oil rapeseed flower surfaces to foraging honey bees and then a loss of concentrations from foragers to brood in the hive. Therefore, the residue concentrations on flower surfaces do not appear to be predictive of acute toxicity to honey bee colonies due to this dilution effect. This maybe in part, is why most of the documented deleterious effects of fungicides on honey bees are sublethal [40]. Although there is widespread evidence that propiconazole can synergize the lethal effects of some neonicotinoids [45]. As previously stated in the Introduction section of this paper, the mechanism for this appears to be propiconazoles high affinity for binding to cytochrome P450 which delays the breakdown of some insecticides, thus increasing the lethal exposure [27,28]. However, recent findings by Liao et al. [46] have documented specific phytochemicals preventing this synergy by propiconazole. To make our understanding of fungicide exposure to honey bees even more difficult to grasp, Almasri et al. [47] showed that previous exposure to low concentrations of the herbicide glyphosate, or the insecticide, imidacloprid, resulted in a delayed toxic response in honey bees to the fungicide, difenoconazole, usually a fungicide with low toxicity to honey bees.
Worldwide, propiconazole has been the most studied fungicide in regard to deleterious effects on bees [40]. Most of these studies have been conducted with honey bees, but some have focused on other bee taxa such as Osmia spp. and Bombus spp. (Cresson) [9,48,49,50,51,52,53]. The research summarized in this manuscript found no acute lethal effects, only more chronic sub-lethal effects.
Worker longevity, morphology of the hypopharyngeal gland, and attractiveness of treated flowers were found to be affected by exposure of larvae and workers to propiconazole formulated as the commercial fungicide, Orbit®. Liao et al. [46] also found a reduction in worker longevity when honey bees were exposed to low concentrations of propiconazole. However, their study involved honey bee workers consuming propiconazole in a sugar-based diet. It is not known what the mechanism might be to a shorter worker longevity upon exposure to low levels of propiconazole. Although, Ricke et al. [52], showed that contaminated pollen with a mixture of agricultural pesticide residues containing a low level of propiconazole, reduced the emergence and longevity of honey bee queens.
Research by Yoder et al. [53] showed that beneficial fungi in bee bread (larval food) were reduced in abundance and diversity when contaminated with several fungicides, propiconazole being one of them. It was suggested by the authors that this reduction in the microbial myco-flora in bee bread would likely reduce the nutritional quality of the bee bread. It might be the case that in our study, suboptimal larval diet was a result of propiconazole residue contamination of pollen and therefore, bee bread, resulting in a reduced longevity of those workers reared on this diet. Additionally, a recent study of the gut microflora has shown that beneficial microbes, such as the fungus Mucor bainieri Mehrotra and Baijal, has been isolated from the honey bee [54]. This fungus has demonstrated antimicrobial, antioxidant, and immune system activities. Exposure to propiconazole could result in compromised food consumption and digestion, metabolic rate, and immune response leading to reduced longevity in workers.
The marginal statistical difference (p = 0.067) in hypopharyngeal acini size, characterized by larger acini in propiconazole exposed nurse bees, either as larvae or young adults suggests another potential sub-lethal effect of propiconazole. However, the limited data that we had on royal jelly secretion into comb cells suggest that this hypertrophy of hypopharyngeal glands may not have affected the physiological function of these important glands. A recent study by Pearlstein [55] did not find any evidence of an effect on hypopharyngeal acini size or royal jelly deposition when the nurse bees were fed propiconazole. The author also did not find any effect on propiconazole exposed nurse bee behavior and time nursing. He did find a positive relationship between acini size and the amount of time bees spent nursing. However, Pearlstein [55] also did not show any effect on nurse bee exposure to the growth regulator diflubenzuron and the size of the hypopharyngeal acini, a compound that has previously been shown to affect acini size [56]. Something developmentally with the hypopharyngeal glands appears to be occurring, however, as Traynor et al. [14] observed atrophied hypopahryngeal glands in workers exposed to a mixture of chlorothalonil and propiconazole.
While several studies have looked at repellency of fungicide applied to flowers on the foraging activity of honey bees, fungicides have not been shown to be repellent at the application rates used [40]. The short-lived repellency reported in this study (<3.5 h) while significant (p < 0.05) is not suspected of being an important sub-lethal effect of exposure to propiconazole. This is mainly because in lowbush blueberry production propiconazole is applied prior to bloom and honey bee pollination and so a repellency of less than a day would not be of consequence when honey bees begin to visit open flowers. The results of the study reported in this manuscript were designed to look at a less common event, application of propiconazole at the commencement of bloom when threat to infection of mummy berry disease is high. However, even this scenario is most likely of little consequence considering the 7–10 day long individual flower longevity (stigma viability) and the month-long bloom time of lowbush blueberry flowers [29].

5. Conclusions

This research has shown that the estimated contact LD50 of propiconazole is very high relative to residue concentrations on flowers collected in fields during bloom. In addition, workers and pollen contamination is a small fraction of the residues that contaminate flowers. Overall, few consistent effects on honey bee health appeared to be due to exposure to the fungicide propiconazole (formulated as Orbit®) during this six-year study. Residues of the fungicide were found on both flowers, honey bees and pollen coming back to the hive. Hives in the control fields that were not sprayed with propiconazole had either no detectable or limited measurable exposure. This shows that even isolated fields can result in honey bees foraging onto treated fields. Not many colony-level honey bee health effects were found over the three years of the study, this includes brood population and worker population size, queen oviposition rate, parasitic mite and pathogen levels in colonies. However, there were a few colony-level effects found. Individual significant negative effects on worker longevity (those reared as larvae during blueberry bloom) and endocrine gland hypertrophy suggest that fungicide applications made several days prior to bloom are affecting honey bees in a small detrimental way. Queen oviposition rate was unexpectedly found to be higher in colonies deployed in propiconazole treated fields than in control fields. It is hard to explain these results, although sub-lethal exposures to toxins can sometimes stimulate an over-compensation in physiological and/or behavioral resp-onses, often referred to as hormesis [57]. It was also found that propiconazole can have short-term repellency effects on visitation to contaminated flowers. The increasing abundance of honey bee foragers across all plots over time (from −2 h to 9 h) was due to air temperatures being cool (12 °C) at the beginning of the experiment but increasing through the day until the end of the experiment (up to 23 °C). Thus, in both years evidence of repellency to freshly treated foliage and flowers with Orbit® fungicide was observed, but this was quite ephemeral, only lasting less than 3.5 h. This result would only be relevant to pollination if fungicide was sprayed during bloom.
Therefore, it is suggested that even though only limited significant sub-lethal colony effects resulted from forager exposure and pollen contamination of propiconazole, a targeted goal should be that blueberry growers try and minimize exposure to honey bees by only spraying prior to bloom for mummy berry control [17]. This is especially in light of the documented synergistic effect of propiconazole synergizing the lethal effects of a few neonicotinoid insecticides on honey bees.

Funding

Wyman’s Blueberries of Maine and the Maine Agricultural and Forest Experiment Station financially supported this research study. Wyman’s Blueberries of Maine; Cherryfield Foods Inc., Cherryfield, Maine; the town of Winterport, Maine; and Highland Blueberry Farm, Stockton Springs, Maine; provided fields and field manage-ment for the research.

Data Availability Statement

Data collected during this study may be available upon request from the author ([email protected]).

Acknowledgments

I appreciate the thoughtful comments from three reviewers. Their suggestions greatly improved this manuscript. I would like to thank Jennifer Lund for helping with all of the colony rearing, maintenance, and monitoring and Judy Collins for maintaining all the samples stored in the laboratory and supervising students to processed the samples. I would like to thank Everett Booth and Hillary Peterson for developing the protocol for hypopharyngeal acini measurement and for conducting dissections and measures of many of the initial acini. Thank you Brian Eitzer and Larry LeBlanc for conducting the quantitative chemistry analysis of propiconazole from matrices collected in the field. Jay Evans of the National Honey Bee laboratory in Beltsville, MD, USA, for molecular pathogen marker analysis of honey bees collected in colonies from 2011 to 2013.

Conflicts of Interest

The author declares no conflict of interest.

Appendix A

Figure A1. Pathogens (A) and mite parasite (B) intensity from 2011 to 2013. See methods for details on detection (molecular methods and collections) and quantification. Error bars are standard errors across years. Statistical effect tests were based upon MANOVA. Abbreviations for viruses in x-axis label (A) are defined as: BQCV: Black queen cell virus, DWV: Deformed wing virus, SBV: Sac brood virus, IAPV: Israeli acute paralysis virus, KBV: Kashmir bee virus, and CBV: Chronic bee paralysis virus.
Agronomy 12 03081 g0a1

References

  1. Penman, L.N.; Annis, S.L. Leaf and flower blight caused by Monilinia vaccinii-corymbosi on lowbush blueberry: Effects on yield and relationship to bud phenology. Phytopathology 2005, 95, 1174–1182. [Google Scholar] [CrossRef] [PubMed] [Green Version]
  2. Batra, L.R.; Batra, S.W. Floral mimicry induced by mummy-berry fungus exploits host’s pollinators as vectors. Science 1985, 228, 1011–1013. [Google Scholar] [CrossRef] [PubMed] [Green Version]
  3. Ngugi, H.K.; Scherm, H. Pollen mimicry during infection of blueberry flowers by conidia of Monilinia vaccinii-corymbosi. Physiol. Mol. Plant Pathol. 2004, 64, 113–123. [Google Scholar] [CrossRef]
  4. McGovern, K.B.; Annis, S.L.; Yarborough, D.E. Efficacy of organically acceptable materials for control of mummy berry disease on lowbush blueberries in Maine. Int. J. Fruit Sci. 2012, 12, 188–204. [Google Scholar] [CrossRef]
  5. Fisher II, A.; DeGrandi-Hoffman, G.; Smith, B.H.; Ozturk, C.; Kaftanoglu, O.; Fewell, J.H.; Harrison, J.F. Field cross-fostering and in vitro rearing demonstrate negative effects of both larval and adult exposure to a widely used fungicide in honey bees (Apis mellifera). Ecotoxicol. Environ. Saf. 2021, 217, 112251. [Google Scholar] [CrossRef]
  6. Ostiguy, N.; Drummond, F.A.; Aronstein, K.; Eitzer, B.; Ellis, J.D.; Spivak, M.; Shepherd, W.S. Pesticide exposure to honey bees in a four-year nationwide study. Insects 2019, 10, 13. [Google Scholar] [CrossRef] [Green Version]
  7. Mussen, E.C.; Lopez, J.E.; Peng, C.Y. Effects of selected fungicides on growth and development of larval honey bees, Apis mellifera L. (Hymenoptera: Apidae). Environ. Entomol. 2004, 33, 1151–1154. [Google Scholar] [CrossRef] [Green Version]
  8. Atkins, E.L.; Kellum, D. Comparative morphogenic and toxicity studies on the effect of pesticides on honeybee brood. J. Apic. Res. 1986, 25, 242–255. [Google Scholar] [CrossRef]
  9. Ladurner, E.; Bosch, J.; Kemp, W.P.; Maini, S. Assessing delayed and acute toxicity of five formulated fungicides to Osmia lignaria Say and Apis mellifera. Apidologie 2005, 36, 449–460. [Google Scholar] [CrossRef] [Green Version]
  10. Zhu, W.; Schmehl, D.R.; Mullin, C.A.; Frazier, J.L. Four common pesticides, their mixtures and a formulation solvent in the hive environment have high oral toxicity to honey bee larvae. PLoS ONE 2014, 9, 77547. [Google Scholar] [CrossRef]
  11. Mao, W.; Schuler, M.A.; Berenbaum, M.R. Disruption of quercetin metabolism by fungicide affects energy production in honey bees (Apis mellifera). Proc. Natl. Acad. Sci. USA 2017, 114, 2538–2543. [Google Scholar] [CrossRef] [Green Version]
  12. Belsky, J.; Joshi, N.K. Effects of fungicide and herbicide chemical exposure on Apis and non-Apis bees in agricultural landscape. Front. Environ. Sci. 2020, 8, 81. [Google Scholar] [CrossRef]
  13. Christen, V.; Krebs, J.; Fent, K. Fungicides chlorothanolin, azoxystrobin and folpet induce transcriptional alterations in genes encoding enzymes involved in oxidative phosphorylation and metabolism in honey bees (Apis mellifera) at sublethal concentrations. J. Hazard. Mater. 2019, 377, 215–226. [Google Scholar] [CrossRef]
  14. Traynor, K.S.; Van Englesdorp, D.; Lamas, Z.S. Social disruption: Sublethal pesticides in pollen lead to Apis mellifera queen events and brood loss. Ecotoxicol. Environ. Saf. 2021, 214, 112105. [Google Scholar] [CrossRef]
  15. Pettis, J.S.; Lichtenberg, E.M.; Andree, M.; Stitzinger, J.; Rose, R. Crop pollination exposes honey bees to pesticides which alters their susceptibility to the gut pathogen Nosema ceranae. PLoS ONE 2013, 8, e70182. [Google Scholar] [CrossRef]
  16. DesJardins, N.S.; Fisher II, A.; Ozturk, C.; Fewell, J.H.; DeGrandi-Hoffman, G.; Harrison, J.F.; Smith, B.H. A common fungicide, Pristine®, impairs olfactory associative learning performance in honey bees (Apis mellifera). Environ. Pollut. 2021, 288, 117720. [Google Scholar] [CrossRef]
  17. Annis, S.; Schwab, J.; Tooley, B.; Calderwood, L. 2022 Pest Management Guide: Disease. 2022. Available online: https://extension.umaine.edu/blueberries/wp-content/uploads/sites/41/2022/02/2022-fungicide-chart.pdf. (accessed on 31 October 2022).
  18. Jørgensen, L.N.; Heick, T.M. Azole use in agriculture, horticulture, and wood preservation–is it indispensable? Front. Cell Infect. Microbiol. 2021, 11, 730297. [Google Scholar] [CrossRef]
  19. Price, C.L.; Parker, J.E.; Warrilow, A.G.S.; Kelly, D.E.; Kelly, S.L. Azole fungicides-understanding resistance mechanisms in agricultural fungal pathogens. Pest Manag. Sci. 2015, 71, 1054–1058. [Google Scholar] [CrossRef]
  20. Siegel, M.R. Sterol-inhibiting fungicides: Effects on sterol biosynthesis and sites of action. Plant Dis. 1981, 65, 986–989. [Google Scholar] [CrossRef]
  21. Buchenhauer, H. Modern Selective Fungicides; Lyr, H., Ed.; VEB Gustav Fischer Verlag: Jena, Germany; Longman Group UK Ltd.: London, UK, 1987; pp. 205–232. [Google Scholar]
  22. Rutkowski, D.; Litsey, E.; Maalouf, I.; Vannette, R.L. Bee-associated fungi mediate effects of fungicides on bumble bees. Ecol. Entomol. 2022, 47, 411–422. [Google Scholar] [CrossRef]
  23. Chalvet-Monfray, K.; Sabatier, P.; Belzunces, L.P.; Colin, M.E.; Fléché, C. Synergy between deltamethrin and prochloraz in bees: A modeling approach. Environ. Toxicol. Chem. Int. J. 1996, 15, 525–534. [Google Scholar] [CrossRef]
  24. Vandame, R.; Belzunces, L.P. Joint actions of deltamethrin and azole fungicides on honey bee thermoregulation. Neurosci. Lett. 1998, 251, 57–60. [Google Scholar] [CrossRef] [PubMed]
  25. Papaefthimiou, C.; Theophilidis, G. The cardiotoxic action of the pyrethroid insecticide deltamethrin, the azole fungicide prochloraz, and their synergy on the semi-isolated heart of the bee Apis mellifera macedonica. Pestic. Biochem. Physiol. 2001, 69, 77–91. [Google Scholar] [CrossRef]
  26. Haas, J.; Nauen, R. Pesticide risk assessment at the molecular level using honey bee cytochrome P450 enzymes: A complementary approach. Environ. Int. 2021, 147, 106372. [Google Scholar] [CrossRef] [PubMed]
  27. Iwasa, T.; Motoyama, N.; Ambrose, J.T.; Roe, R.M. Mechanism for the differential toxicity of neonicotinoid insecticides in the honey bee, Apis mellifera. Crop Prot. 2004, 23, 371–378. [Google Scholar] [CrossRef]
  28. Bart, S.; Short, S.; Jager, T.; Eagles, E.J.; Robinson, A.; Badder, C.; Lahive, E.; Spurgeon, D.J.; Ashauer, R. How to analyse and account for interactions in mixture toxicity with toxicokinetic-toxicodynamic models. Sci. Total Environ. 2022, 843, 157048. [Google Scholar] [CrossRef]
  29. Drummond, F. Reproductive biology of wild blueberry (Vaccinium angustifolium Aiton). Agric. Spec. Issue N. Am. Nativ. Food Crops 2019, 9, 69–80. [Google Scholar] [CrossRef] [Green Version]
  30. Anastassiades, M.; Lehotay, S.J.; Stajnbaher, D.; Schenck, F.J. Fast and easy multiresidue method employing acetonitrile extraction/partitioning and “dispersive solid-phase extraction” for the determination of pesticide residues in produce. J. AOAC Int. 2003, 86, 412–431. [Google Scholar] [CrossRef] [Green Version]
  31. SAS Institute. JMP(R), Version 16; SAS Institute Inc.: Cary, NC, USA, 2022. [Google Scholar]
  32. Drummond, F.A.; Ballman, E.S.; Eitzer, B.D.; Du Clos, B.; Dill, J. Exposure of honeybee colonies to pesticides in pollen, a statewide survey in Maine. Environ. Entomolology 2018, 47, 378–387. [Google Scholar] [CrossRef] [Green Version]
  33. Delaplane, K.S.; Van der Steen, J.; Guzman-Novoa, E. Standard methods for estimating strength parameters of Apis mellifera colonies. J. Apic. Res. 2013, 52, 1–12. [Google Scholar] [CrossRef]
  34. Souza Cunha, A.E.; Rose, J.; Prior, J.; Aumann, H.; Emanetoglu, N.; Drummond, F.A. A novel non-invasive radar to monitor honey bee colony health. Comput. Electron. Agric. 2020, 170, 105241. [Google Scholar] [CrossRef]
  35. Miranda, M.A.; Bicout, D.; Bøtner, A.; Butterworth, A.; Calistri, P.; Depner, K.; Edwards, S.; Garin-Bastuji, B.; Good, M.; Gortazar Schmidt, C.; et al. EFSA Panel on Animal Health and Welfare (AHAW). Assessing the health status of managed honeybee colonies (HEALTHY-B): A toolbox to facilitate harmonised data collection. J. Eur. Food Saf. 2016, 14, e04578. Available online: https://efsa.onlinelibrary.wiley.com/doi/pdf/10.2903/j.efsa.2016.4578 (accessed on 27 October 2022).
  36. Ahmad, S.; Khan, S.A.; Khan, K.A.; Li, J. Novel insight into the development and function of hypopharyngeal glands in honey bees. Front. Physiol. 2021, 11, 615830. [Google Scholar] [CrossRef]
  37. Frazier, M.; Mullin, C.; Frazier, J.; Ashcraft, S.; Leslie, T.; Mussen, E.; Drummond, F. Assessing honey bee (Apis mellifera L.) foraging populations and the potential impact of pesticides on eight U.S. Crops. J. Econ. Entomol. 2015, 108, 2141–2152. [Google Scholar] [CrossRef] [Green Version]
  38. Hendrickson, R. Field alcohol wash provides a consistent sampling method for determining colony Varroa mite loads. Am. Bee J. 2009, 149, 55–56. [Google Scholar]
  39. Sammataro, D. An easy dissection technique for finding the tracheal mite, Acarapis woodi (Rennie)(Acari: Tarsonemidae), in honey bees, with video link. Int. J. Acarol. 2006, 32, 339–343. [Google Scholar] [CrossRef]
  40. Cullen, M.G.; Thompson, L.J.; Carolan, J.C.; Stout, J.C.; Stanley, D.A. Fungicides, herbicides and bees: A systematic review of existing research and methods. PLoS ONE 2019, 14, e0225743. [Google Scholar] [CrossRef] [Green Version]
  41. Steffan-Dewenter, I.; Kuhn, A. Honeybee foraging in differentially structured landscapes. Proc. R. Soc. London. Ser. B Biol. Sci. 2003, 270, 569–575. [Google Scholar] [CrossRef] [Green Version]
  42. Butler, C.G.; Haigh, J.C. A note on the use of honey-bees as pollinating agents in cages. J. Hortic. Sci. 1956, 31, 295–297. [Google Scholar] [CrossRef]
  43. Kubik, M.; Nowacki, J.; Pidek, A.; Warakomska, Z.; Michalczuk, L.; Goszczyñski, W. Pesticide residues in bee products collected from cherry trees protected during blooming period with contact and systemic fungicides. Apidologie 1999, 30, 521–532. [Google Scholar] [CrossRef] [Green Version]
  44. Piechowicz, B.; Woś, I.; Podbielska, M.; Grodzicki, P. The transfer of active ingredients of insecticides and fungicides from an orchard to beehives. J. Environ. Sci. Health Part B 2018, 53, 18–24. [Google Scholar] [CrossRef] [PubMed]
  45. Zhao, G.P.; Yang, F.W.; Li, J.W.; Xing, H.Z.; Ren, F.Z.; Pang, G.F.; Li, Y.X. Toxicities of neonicotinoid-containing pesticide mixtures on nontarget organisms. Environ. Toxicol. Chem. 2020, 39, 1884–1893. [Google Scholar] [CrossRef] [PubMed]
  46. Liao, L.H.; Pearlstein, D.J.; Wu, W.Y.; Kelley, A.G.; Montag, W.M.; Hsieh, E.M.; Berenbaum, M.R. Increase in longevity and amelioration of pesticide toxicity by natural levels of dietary phytochemicals in the honey bee, Apis mellifera. PLoS ONE 2020, 15, e0243364. [Google Scholar] [CrossRef] [PubMed]
  47. Almasri, H.; Tavares, A.D.; Tchamitchian, S.; Pélissier, M.; Sené, D.; Cousin, M.; Brunet, J.-L.; Belzunces, L.P. Toxicological status changes the susceptibility of the honey bee Apis mellifera to a single fungicidal spray application. Environ. Sci. Pollut. Res. 2021, 28, 42807–42820. [Google Scholar] [CrossRef] [PubMed]
  48. Elston, C.; Thompson, H.M.; Walters, K.F. Sub-lethal effects of thiamethoxam, a neonicotinoid pesticide, and propiconazole, a DMI fungicide, on colony initiation in bumblebee (Bombus terrestris) micro-colonies. Apidologie 2013, 44, 563–574. [Google Scholar] [CrossRef] [Green Version]
  49. Manning, P.; Ramanaidu, K.; Cutler, G.C. Honey bee survival is affected by interactions between field-relevant rates of fungicides and insecticides used in apple and blueberry production. Facets 2017, 2, 910–918. [Google Scholar] [CrossRef] [Green Version]
  50. Sgolastra, F.; Medrzycki, P.; Bortolotti, L.; Renzi, M.T.; Tosi, S.; Bogo, G.; Teper, D.; Porrini, C.; Molowny-Horas, R.; Bosch, J. Synergistic mortality between a neonicotinoid insecticide and an ergosterol-biosynthesis-inhibiting fungicide in three bee species. Pest Manag. Sci. 2017, 73, 1236–1243. [Google Scholar] [CrossRef]
  51. Chandler, A.J.; Drummond, F.A.; Collins, J.A.; Lund, J.; Alnajjar, G. Assessment of synergism between acetamiprid and propiconazole on the Common Eastern Bumble bee, Bombus impatiens (Cresson), in Wild Blueberry. J. Agric. Urban Entomol. 2020, 36, 1–23. [Google Scholar] [CrossRef]
  52. Ricke, D.F.; Lin, C.H.; Johnson, R.M. Pollen treated with a combination of agrochemicals commonly applied during almond bloom reduces the emergence rate and longevity of honey bee (Hymenoptera: Apidae) queens. J. Insect Sci. 2021, 21, 5. [Google Scholar] [CrossRef]
  53. Yoder, J.A.; Jajack, A.J.; Rosselot, A.E.; Smith, T.J.; Yerke, M.C.; Sammataro, D. Fungicide contamination reduces beneficial fungi in bee bread based on an area-wide field study in honey bee, Apis mellifera, colonies. J. Toxicol. Environ. Health Part A 2013, 76, 587–600. [Google Scholar] [CrossRef]
  54. Kalaba, M.H.; Sultan, M.H.; Elbahnasawy, M.A.; El-Didamony, S.E.; El Bakary, N.M.; Sharaf, M.H. First report on isolation of Mucor bainieri from honeybees, Apis mellifera: Characterization and biological activities. Biotechnol. Rep. 2022, 36, e00770. [Google Scholar] [CrossRef]
  55. Pearlstein, D.J. Effects of an Insecticide/Fungicide Mixture on Queen Rearing Behavior and Hypopharyngeal Gland Morphology in Honey Bees (Apis mellifera L.) (Hymenoptera: Apidae). Master’s Thesis, University of Illinois, Urbana, IL, USA, 2020. Available online: http://hdl.handle.net/2142/109329 (accessed on 31 October 2022).
  56. Gupta, P.R.; Chandel, R.S. Effects of diflubenzuron and penfluron on workers of Apis cerana indica F. and Apis mellifera L. Apidologie 1995, 26, 3–10. [Google Scholar] [CrossRef]
  57. Cutler, G.C.; Amichot, M.; Benelli, G.; Guedes, R.N.C.; Qu, Y.; Rix, R.R.; Ullah, F.; Desneux, N. Hormesis and insects: Effects and interactions in agroecosystems. Sci. Total Environ. 2022, 825, 153899. [Google Scholar] [CrossRef]
Figure 1. Orbit®(active ingredient: propiconazole) being applied with an air-blast sprayer to a lowbush blueberry field prior to bloom just after an infection period had been forecast (A). Honey bee hives deployed in clusters throughout a lowbush blueberry field in bloom (B), The results of mummy berry disease infection, shriveled hard white fruits are mummies (pseudosclerotia) (C).
Agronomy 12 03081 g001
Figure 2. Grid for assessing sealed brood and worker population on frames (A), Queen cage for assessing oviposition rate (B), and closeup of queen cage (C).
Agronomy 12 03081 g002
Figure 3. Mesh bag over frame of sealed brood (A), and cage and sugar syrup vials for holding newly emerged workers (B).
Agronomy 12 03081 g003
Figure 4. Frequency distribution of propiconazole residues on lowbush blueberry flowers during bloom (n = 31 fields) (A); and decay rate of propiconazole on flower buds and flowers during bloom (B).
Agronomy 12 03081 g004
Figure 5. The proportion mortality after 24 h contact exposure to logarithm transformed doses of propiconazole (ppb). The blue symbols with standard error bars are the estimates of mean proportion mortality at each dose and the smaller black symbols are the individual replicate estimates of proportion mortality (n = 3). The green line is the estimated logistic regression predictive response curve.
Agronomy 12 03081 g005
Figure 6. Propiconazole residues in treated and control fields, 2011–2013, on flowers and trapped pollen (A); and foraging workers returning to the hive (2012–2013) (B).
Agronomy 12 03081 g006
Figure 7. Sealed brood populations estimated over time from before bloom to early fall, 2011 (A), 2012 (B), 2013 (C). Worker bee populations estimated over time from before bloom to early fall, 2011 (D), 2012 (E), 2013 (F).
Agronomy 12 03081 g007
Figure 8. Longevity of worker honey bees measured in proportion bees surviving per day, 2011 (A), 2012 (B), 2013 (C). Average daily logarithmic (base 10) mortality rate, error bars are standard errors of the mean (D).
Agronomy 12 03081 g008aAgronomy 12 03081 g008b
Figure 9. Relative size (surface area) of hypopharyngeal acini over three years. Error bars are standard errors.
Agronomy 12 03081 g009
Figure 10. Field trial testing repellency of propiconazole to foraging honey bees, 2013 (A), and 2014 (B). Error bars are standard error of the mean and asterisks denote significant (p < 0.05) pairwise differences in mean foraging honey bee densities between the two treatments (fungicide application and water control) within sampling times.
Agronomy 12 03081 g010
Publisher’s Note: MDPI stays neutral with regard to jurisdictional claims in published maps and institutional affiliations.

