Review

Meta-Analysis for Quantifying Carbon Sequestration and Greenhouse Gas Emission in Paddy Soils One Year after Biochar Application

1
National Biochar Institute, Shenyang Agricultural University, Shenyang 110866, China
2
Key Laboratory of Biochar and Soil Improvement, Ministry of Agriculture and Rural Affairs, Shenyang 110866, China
3
Institute of Environment Pollution Control and Treatment, College of Environment and Resource Science, Zhejiang University, Hangzhou 310029, China
4
School of Agriculture and Environment, The University of Western Australia, Perth, WA 6001, Australia
5
The UWA Institute of Agriculture, The University of Western Australia, Perth, WA 6001, Australia
6
Future Industries Institute, University of South Australia, Mawson Lakes, SA 5095, Australia
7
School of Environmental and Chemical Engineering, Foshan University, Foshan 528000, China
8
Key Laboratory of Soil Contamination Bioremediation of Zhejiang Province, Zhejiang A&F University, Hangzhou 311300, China
*
Authors to whom correspondence should be addressed.
Agronomy 2022, 12(12), 3065; https://doi.org/10.3390/agronomy12123065
Submission received: 1 October 2022 / Revised: 10 November 2022 / Accepted: 28 November 2022 / Published: 3 December 2022
(This article belongs to the Special Issue Biochar for Sustainable Farming and Recultivation)

Abstract

:
The incorporation of biochar into soils has been recognized as a promising method to combat climate change. However, the full carbon reduction potential of biochar in paddy soils is still unclear. To give an overview of the quantified carbon reduction, a meta-analysis model of different carbon emission factors was established, and the life cycle-based carbon reduction of biochar was estimated. After one year of incorporation, biochar significantly increased the total soil carbon (by 27.2%) and rice production (by 11.3%); stimulated methane (CH4) and carbon dioxide (CO2) emissions by 13.6% and 1.41%, respectively, but having insignificant differences with no biochar amendment; and reduced nitrous oxide (N2O) emissions by 25.1%. The soil total carbon increase was mainly related to the biochar rate, whereas CH4 emissions were related to the nitrogen fertilizer application rate. Biochar pyrolysis temperature, soil type, and climate were the main factors to influence the rice yield. The total carbon reduction potential of biochar incorporation in Chinese paddy soils in 2020 ranged from 0.0066 to 2.0 Pg C using a biochar incorporation rate from 2 to 40 t ha−1. This study suggests that biochar application has high potential to reduce carbon emissions, thereby contributing to the carbon neutrality goal, but needs field-scale long-term trials to validate the predictions.

1. Introduction

To combat climate change, reaching carbon neutrality at an early date is the goal of the whole world. Different countries have worked together to curb the global temperature increase to less than 1.5 °C above the pre-industrial era in the Paris Agreement in 2015 [1]. China has accordingly set a 2060 carbon neutrality goal [2]. To achieve the goal, carbon dioxide (CO2) would be the first target greenhouse gas (GHG) to be removed from the atmosphere and likely to be stored in the soil and ocean. Furthermore, non-CO2 GHG reduction (e.g., methane (CH4) and nitrous oxide (N2O) have 86 and 300 times more global warming potential (GWP20) than CO2, respectively) is important for reaching carbon neutrality [3]. Hence, the reduction and storage of CO2, combined with CH4 and N2O mitigation are matters of great scientific interest worldwide. Accordingly, a number of negative carbon emission technologies (NCETs) have been conceived, including direct air capture, bioenergy with carbon capture and storage, afforestation, enhanced rock weathering, biomass pyrolysis (biochar production), and soil carbon sequestration [4].
Rice is the main staple food in China and several other Asian countries. In China alone, the rice planting area covered more than 30 million ha in 2020, according to FAOSTAT [5]. However, paddy (rice) soil is an important source of GHG emissions [6,7,8]. Paddy soils could contain a vast carbon stock, but also emit a significant amount of GHGs during rice growth stages if not properly managed [9]. Of the many NCETs, biochar incorporation into paddy soils has become increasingly popular for both soil carbon sequestration and GHGs reduction [10,11,12,13,14,15]. Biochar is a black carbon-rich product obtained by biomass pyrolysis under limited (or no) oxygen conditions [16]. Biochar is a stable recalcitrant C source and is difficult for soil microorganisms to degrade, owing to the material’s aromatic carbon structure [17]. Furthermore, biochar application has been shown to improve soil fertility and quality by increasing the nutrient supply to plants, neutralizing the soil reaction, enhancing microbiological activities, and improving soil structure and water retention ability [18], which consequently helps fix carbon from the atmosphere through the increased rate of photosynthesis and biomass production. If incorporated into paddy soils, biochar itself could lock up almost 40% of the carbon produced via photosynthesis [17,19], which would otherwise return to the atmosphere in the absence of biochar incorporation.
Biochar incorporation into paddy soils also holds great potential for CH4 and N2O mitigation. Nan et al. [20,21] reported that biochar incorporation both at low (2.8 t ha−1) and high (22.5 t ha−1) application rates significantly reduced CH4 emissions from paddy soils, owing to biochar’s positive effect on CH4 oxidation capacity. A prominent N2O mitigation effect was also achieved with biochar application due to biochar’s ability to raise soil pH and lower the available dissolved organic nitrogen content in the soil [22,23]. Since biochar can benefit rice yield promotion [20,21], soil carbon sequestration, and GHG mitigation [24,25], it becomes an ideal material to achieve carbon neutrality in paddy cultivation systems. On the contrary, some reports suggested that biochar incorporation into paddy soils could increase CH4 and N2O emissions [26,27,28,29], which were attributed mainly to the biochar-induced redox conditions. The variation in GHG mitigation outcomes of biochar might result from various soil types, climatic conditions, farm management practices, and water management in paddy cultivation, as well as biochar feedstocks, preparation conditions, and incorporation rates. Such complexity creates difficulty in estimating the real carbon reduction potential of biochar under a paddy cultivation system.
The Intergovernmental Panel on Climate Change (IPCC) [19] suggested a standard method to evaluate the carbon stock in paddy soils and to calculate the newly added carbon stock via biochar amendment [19]. However, the carbon reduction calculations were based on a global scale, making it difficult to distinguish biochar’s real potential for carbon reduction in paddy soils in different regions and countries. Although a standard method was suggested by IPCC, it also highlighted that a country-specific method for soil organic carbon stock calculation in tier 3 would be more desirable [19]. It is still hard to identify key factors for optimizing the carbon reduction potential in paddy soils with biochar amendment, warranting the development of specific and practical models to estimate biochar’s carbon reduction potential.
Meta-analysis could be an effective way to evaluate the overall biochar effects on GHG reduction and rice production enhancement and to unravel the key factors contributing to biochar-induced benefits in climate change mitigation. Through meta-analysis, the relevant effects of biochar on GHG mitigation and rice production could be quantified in a comparative manner using statistical methods. Furthermore, heterogeneity exploration could unravel key factors that would influence biochar’s effect on GHG reduction, rice yield increment, and soil carbon sequestration. However, to comprehensively understand biochar’s practical potential for carbon emission reduction, a method for carbon emission calculation from ‘cradle to grave’ based on the whole life cycle analysis (LCA) is needed [30].To date, no report is available for the estimation of biochar performance concerning carbon reduction from Chinese paddy soils via a whole life cycle assessment of biochar using meta-analysis.
This research aims to establish a model to estimate carbon reduction potential under different biochar amendment scenarios using a whole life cycle analysis of biochar. To make a specific and practical estimation of the carbon reduction potential of biochar, field experimental data reporting soil total carbon (TC) increase, rice yield promotion, and GHG emissions were collected, and a meta-analysis was conducted. The default value of carbon emission factors and correction coefficients of management practices were utilized in the adapted method. The model would make carbon reduction potential estimation more realistic and less laborious than the existing models, especially under paddy soil conditions.

2. Materials and Methods

2.1. Data Collection and Meta-Analysis

For the meta-analysis, a literature search was performed using Web of Science with the search terms ‘biochar’ AND ‘paddy’ AND ‘rice production’ OR ‘GHGs emission’, retrieving 53 research articles published before 1 November 2021. Only studies conducted at field scale were retained to reflect a more realistic effect of biochar in soil than lab-based studies. For studies continuing over multiple years, only the relevant data reported in the first year of the study were adopted to infer the pristine biochar’s effect on carbon reduction. After filtering the data mentioned above, 15 studies and 68 data points were available for the Supplementary Materials Table S1. Details about soil TC, rice yield, and GHG emissions were collected from these field studies. Environmental factors such as water management (e.g., continuous flooding and intermittent irrigation), climate, biochar incorporation rate, and fertilizer input were also recorded.
The natural log-transformed [31] ratio of the treatment and control values was used as the effect size (odds ratio) [32] by using the R software package (The R Project for Statistical Computing). A random-effects model was used to calculate the odds ratio. Before the meta-analysis, bias correction and normalization were performed to ensure the unbiased database. The effect size of biochar input on soil TC, rice yield, and GHG emissions was first evaluated as a basic quantified impact (categorical moderator ratio). Heterogeneity was calculated to find the key factors that would influence biochar-induced effect size on soil TC, rice yield, and GHG emissions. Categorical moderator variables were included in the model to explore the specific treatments that would lead to the heterogeneity and effect size ratio. As the biochar incorporation rate can be a continuous variable, the predication function in the metafor package was also used to calculate the effect size of the biochar incorporation rate on soil TC increase. The effect size of a specific treatment was used to calculate the correction coefficient based on the categorical moderator ratio of the specific treatment-induced heterogeneity. The function of correction coefficients was used to adjust the categorical moderator ratio to the effect size of the specific treatment that induced heterogeneity, making the evaluation of specific treatments more precise and accurate. Default values of the carbon emission factors (i.e., soil TC, rice yield and GHG emission) were calculated based on the average value, standard error, and sample quantity. The default values were classified by the categorical moderator variables which induced the heterogeneity most significantly. The default value and effect size ratio were then used for the carbon emission calculation.

2.2. Carbon Emission Calculation

The difference in carbon dynamics between paddy soils with and without biochar incorporation was calculated by considering five aspects: (1) increased carbon stock by rice yield increment (ΔCYield), (2) soil total carbon increase (ΔCsoil), (3) GHG mitigation after biochar incorporation (ΔCGHGs), (4) GHG emission offset due to the avoided fossil fuel with biochar incorporation (Coffset), and (5) carbon emissions during the biochar production process (Cproduction). Carbon emissions from paddy soils following biochar amendment were calculated using Equation (1).
ΔCpaddy = ΔCYield + ΔCsoil + ΔCGHGs + Coffset − Cproduction
where ΔCpaddy is the net carbon reduction amount (kg) during the rice growth cycle with biochar amendment, ΔCYield is the increased carbon (kg) through augmented rice yield with biochar amendment, ΔCGHGs is the direct reduced CO2 equivalent GHG carbon emissions with biochar amendment (kg), Coffset is the indirect carbon emission offset (kg) by renewable energy during biochar production process, and Cproduction is off-farm carbon emissions (kg) during the biochar production process.
It has been acknowledged internationally that biochar incorporation into paddy soils benefits rice yield increase [20,21]. Hence, the increased carbon content by an augmented rice yield would be part of the carbon sequestration with biochar application, as ΔCYield in Equation (1). Accompanied by a rice yield increase, the rice straw biomass will also increase. In the current study, biochar incorporation was considered only in the first year, and treatments without both rice straw and biochar incorporation were considered as the control scenarios. According to IPCC-2019 [15], the carbon content from the increased rice straw biomass would be returned to the atmosphere in the short term (less than 1 year) and will not contribute to the net carbon reduction. The ΔCYield was estimated using Equation (2).
ΔCYield = Aharvest ∗ ΔYrice ∗ Crice
where ΔCYield is the increased carbon (kg) through the augmented rice yield with biochar amendment, Aharvest is the harvest area of a paddy (ha), ΔYrice is the rice yield difference (dry biomass) between biochar and control scenarios (kg ha−1), and Crice is the carbon content of rice grain, the default being 0.4 kg kg−1 [19].
Biochar incorporation exerts a complex influence on the soil carbon cycle, including soil organic carbon increase brought by biochar carbon and negative priming effect [33]. Biochar carbon content could also experience a reduction due to the liable carbon mineralization [17]. Meanwhile, soil native carbon would be increased or decreased due to a negative or positive priming effect. Furthermore, the boosted root growth by nutrient supplements from biochar would also increase the soil organic carbon. Hence, the calculation of soil carbon change (ΔCsoil) from the total soil carbon difference after harvesting rice with or without biochar amendment would be a direct and accurate way. Hence, ΔCsoil was calculated according to Equation (3).
ΔCsoil = (TCbiochar − TCck) ∗ A harvest
where ΔCsoil is the net soil TC (kg) with biochar incorporation into paddy soil, TCbiochar is total carbon content (kg ha−1) with biochar incorporation after rice was harvested, and TCck is total carbon content (kg ha−1) in the control scenario after rice was harvested.
With the biochar incorporation scenario, three major GHGs were taken into consideration, i.e., CO2, CH4, and N2O. The global warming potential of CH4 and N2O emissions were converted into CO2-eq for a 20-year scenario (WGP20) by multiplying CH4 by 86 and N2O by 300. Changes in warming potential due to biochar addition were calculated as the difference from the control without biochar addition following Equation (4).
ΔCGHGs = (ΔCCO2 + 86 ∗ ΔCCH4+ 300 ∗ ΔCN2O) ∗ A harvest ∗ 12/44
where ΔCGHGs is the CO2-eq carbon reduction (kg) with biochar incorporation during rice growth cycle, ΔCCO2 is the carbon reduction (kg) from CO2 mitigation with biochar incorporation, ΔCCH4 is the carbon reduction (kg) from CH4 mitigation with biochar incorporation, ΔCN2O is the carbon reduction (kg) from N2O mitigation with biochar incorporation, and 12/44 is the molar fraction of carbon in CO2.
During the pyrolysis of biomass (biochar production), biofuel is produced and connected to power generation equipment to generate electricity for operating the carbonization equipment. In this case, the generated electricity could be regarded as carbon offset emissions (Coffset). Biofuel in the biochar production process was calculated according to the report by Patrick [34] and the EBC method [35]. One ton of biochar could generate 682.2 L of biofuel (density of 1.2 g cm−3). One kilogram of biofuel could produce 3.2 kg CO2-eq. Accordingly, the production of 1 ton biochar would generate 669.8 kg C (i.e., 669.8 kg C t−1 biochar).
Carbon emissions during the biochar preparation process will offset part of its carbon sequestration effect. Carbon emissions during the biochar production process are mainly caused by equipment power consumption, liquefied petroleum gas combustion during equipment preheating, and pyrolytic gas incineration. Related gases including CO2, CH4, and N2O are likely to be emitted during the process. Carbon emissions during the operation of biochar production equipment were calculated in accordance with the European Union’s biochar standards [35]. During the production of each ton of biochar, the electricity consumption emits 45 kg CO2-eq, the CH4 content in the pyrolysis gas is 0.138 kg (11.9 kg CO2-eq), and preheating the equipment produces 30 kg CO2-eq t−1 biochar. In summary, the production of 1 t biochar would produce 86.9 kg of CO2-eq or 23.7 kg of carbon (Cproduction = 23.7 kg C t−1 BC).

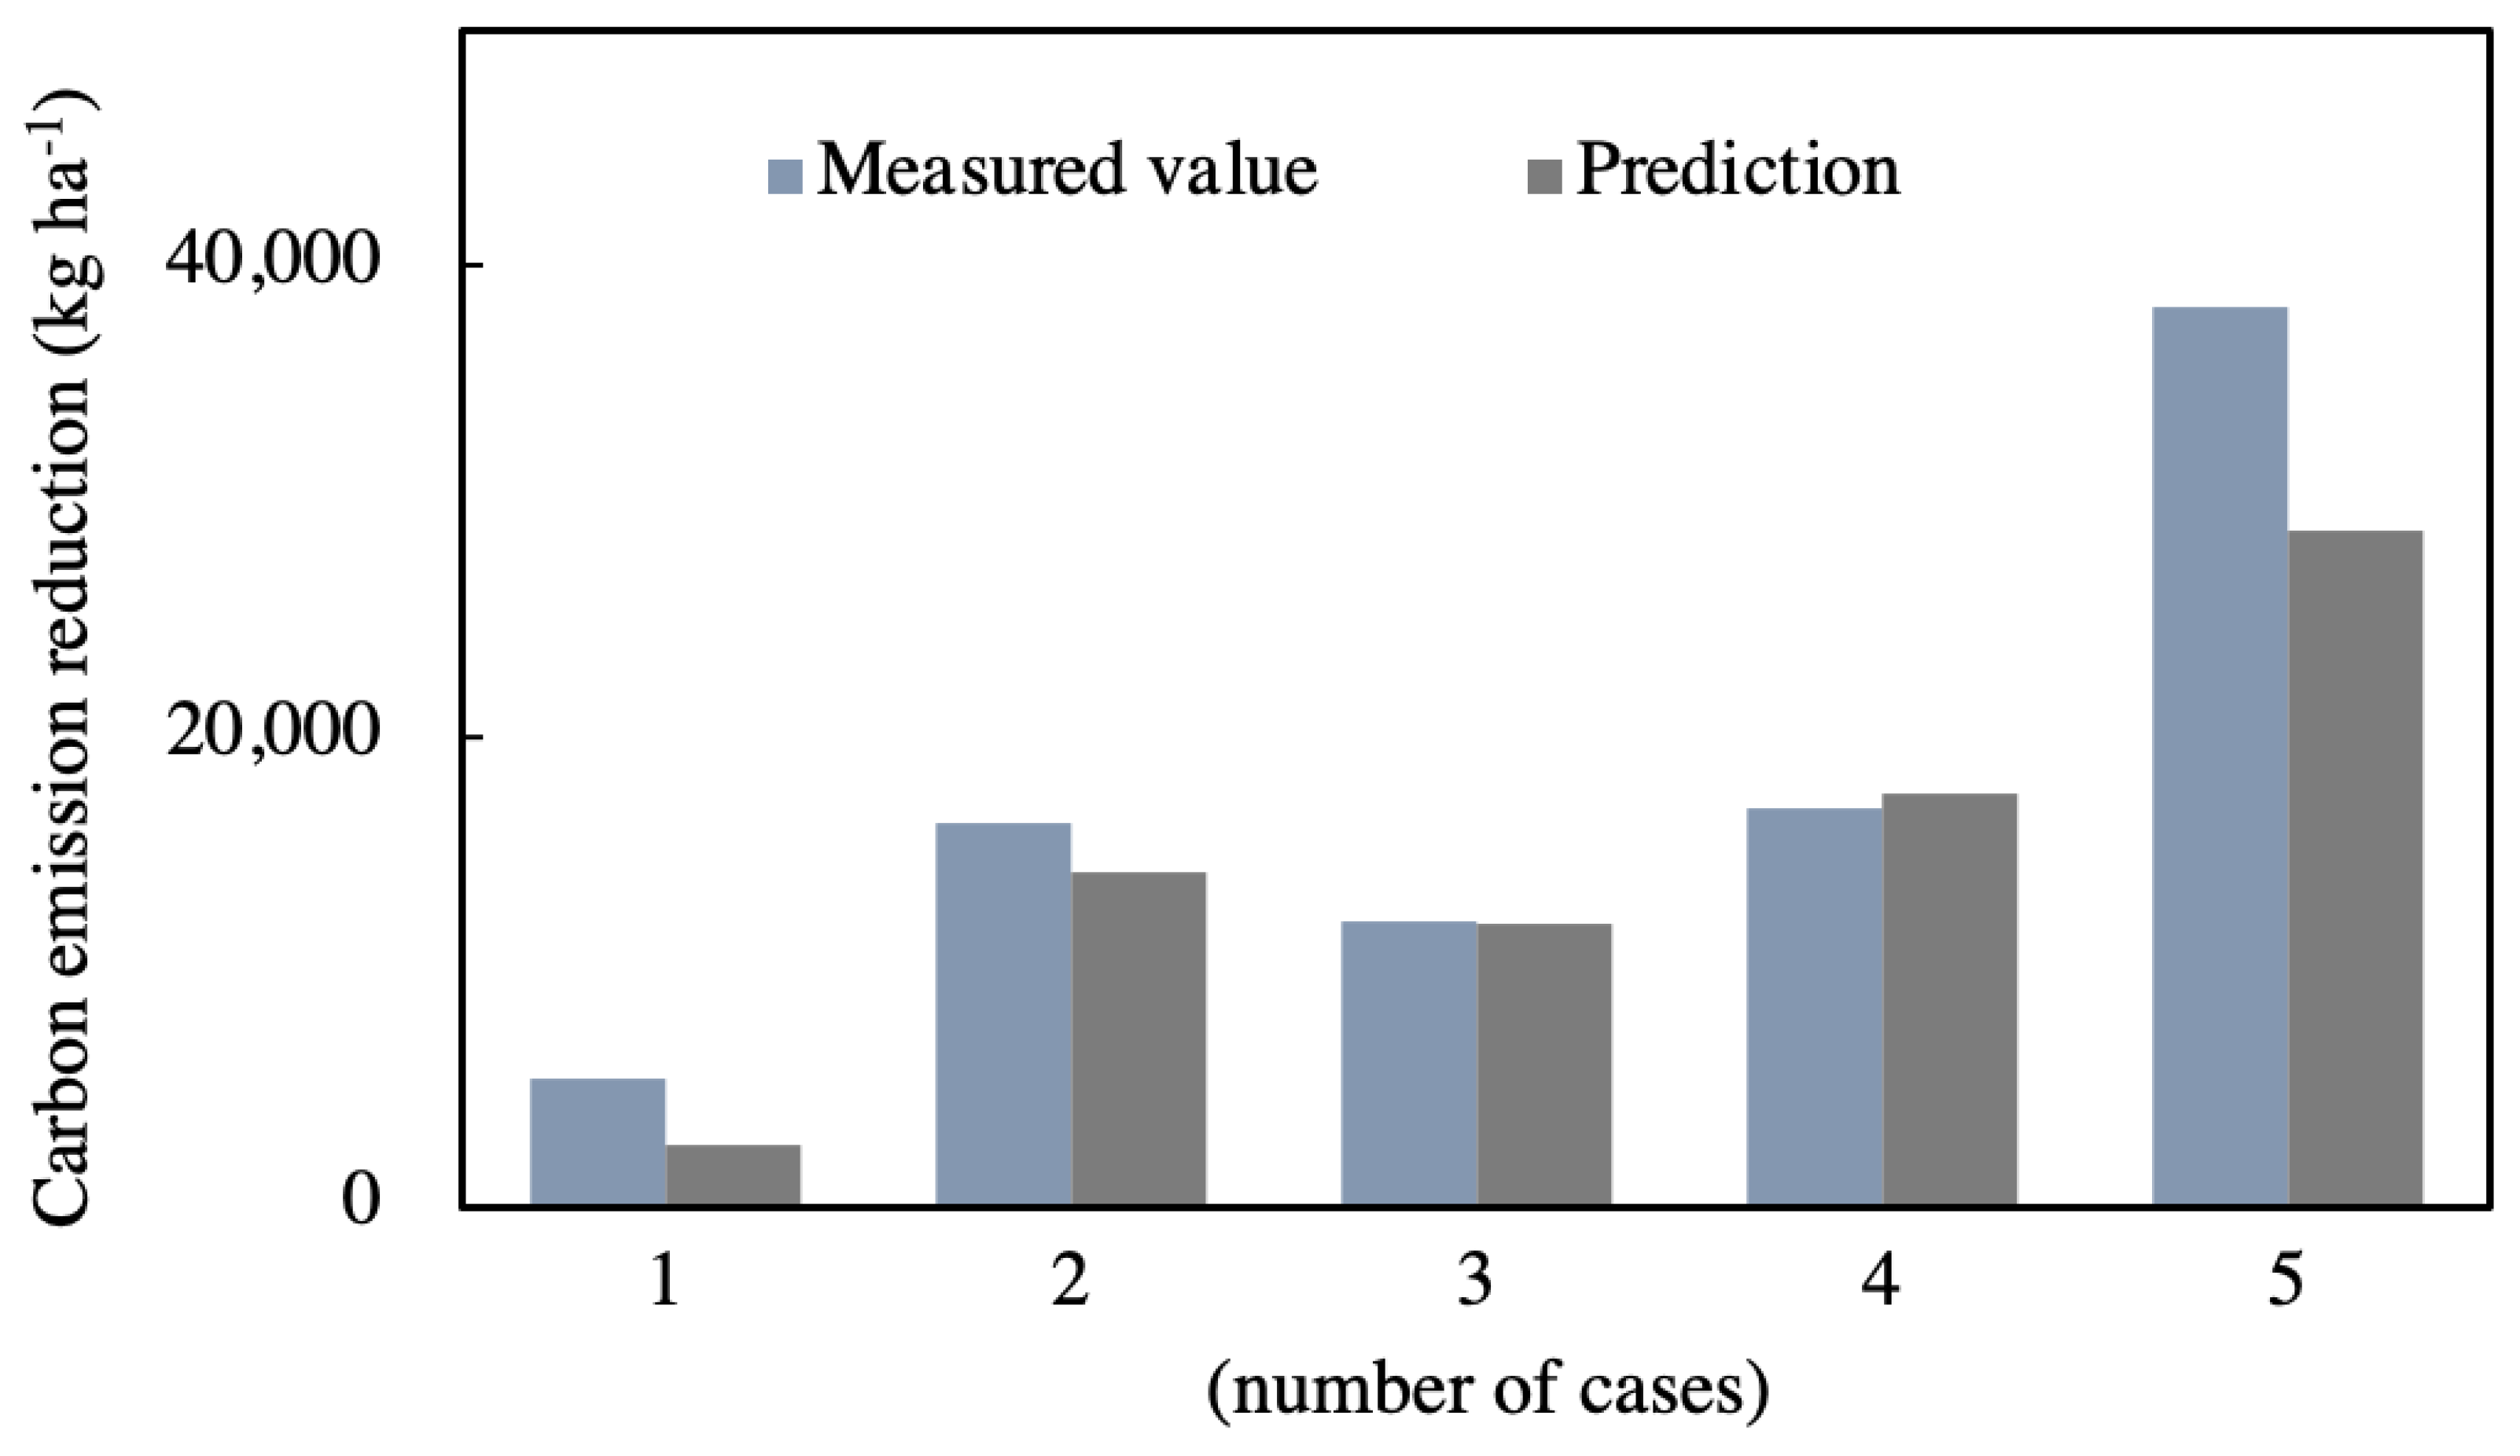
2.3. Uncertainty Analysis

Sources of uncertainty in the adapted meta-analysis model include default values and unexplored environmental factors that could induce heterogeneity of carbon emission factors, correction coefficients of different carbon emission factors, and increased soil TC induced by different biochar incorporation rates. The error of different carbon emission factors is likely to propagate during the calculation of net carbon emission reduction.

3. Results

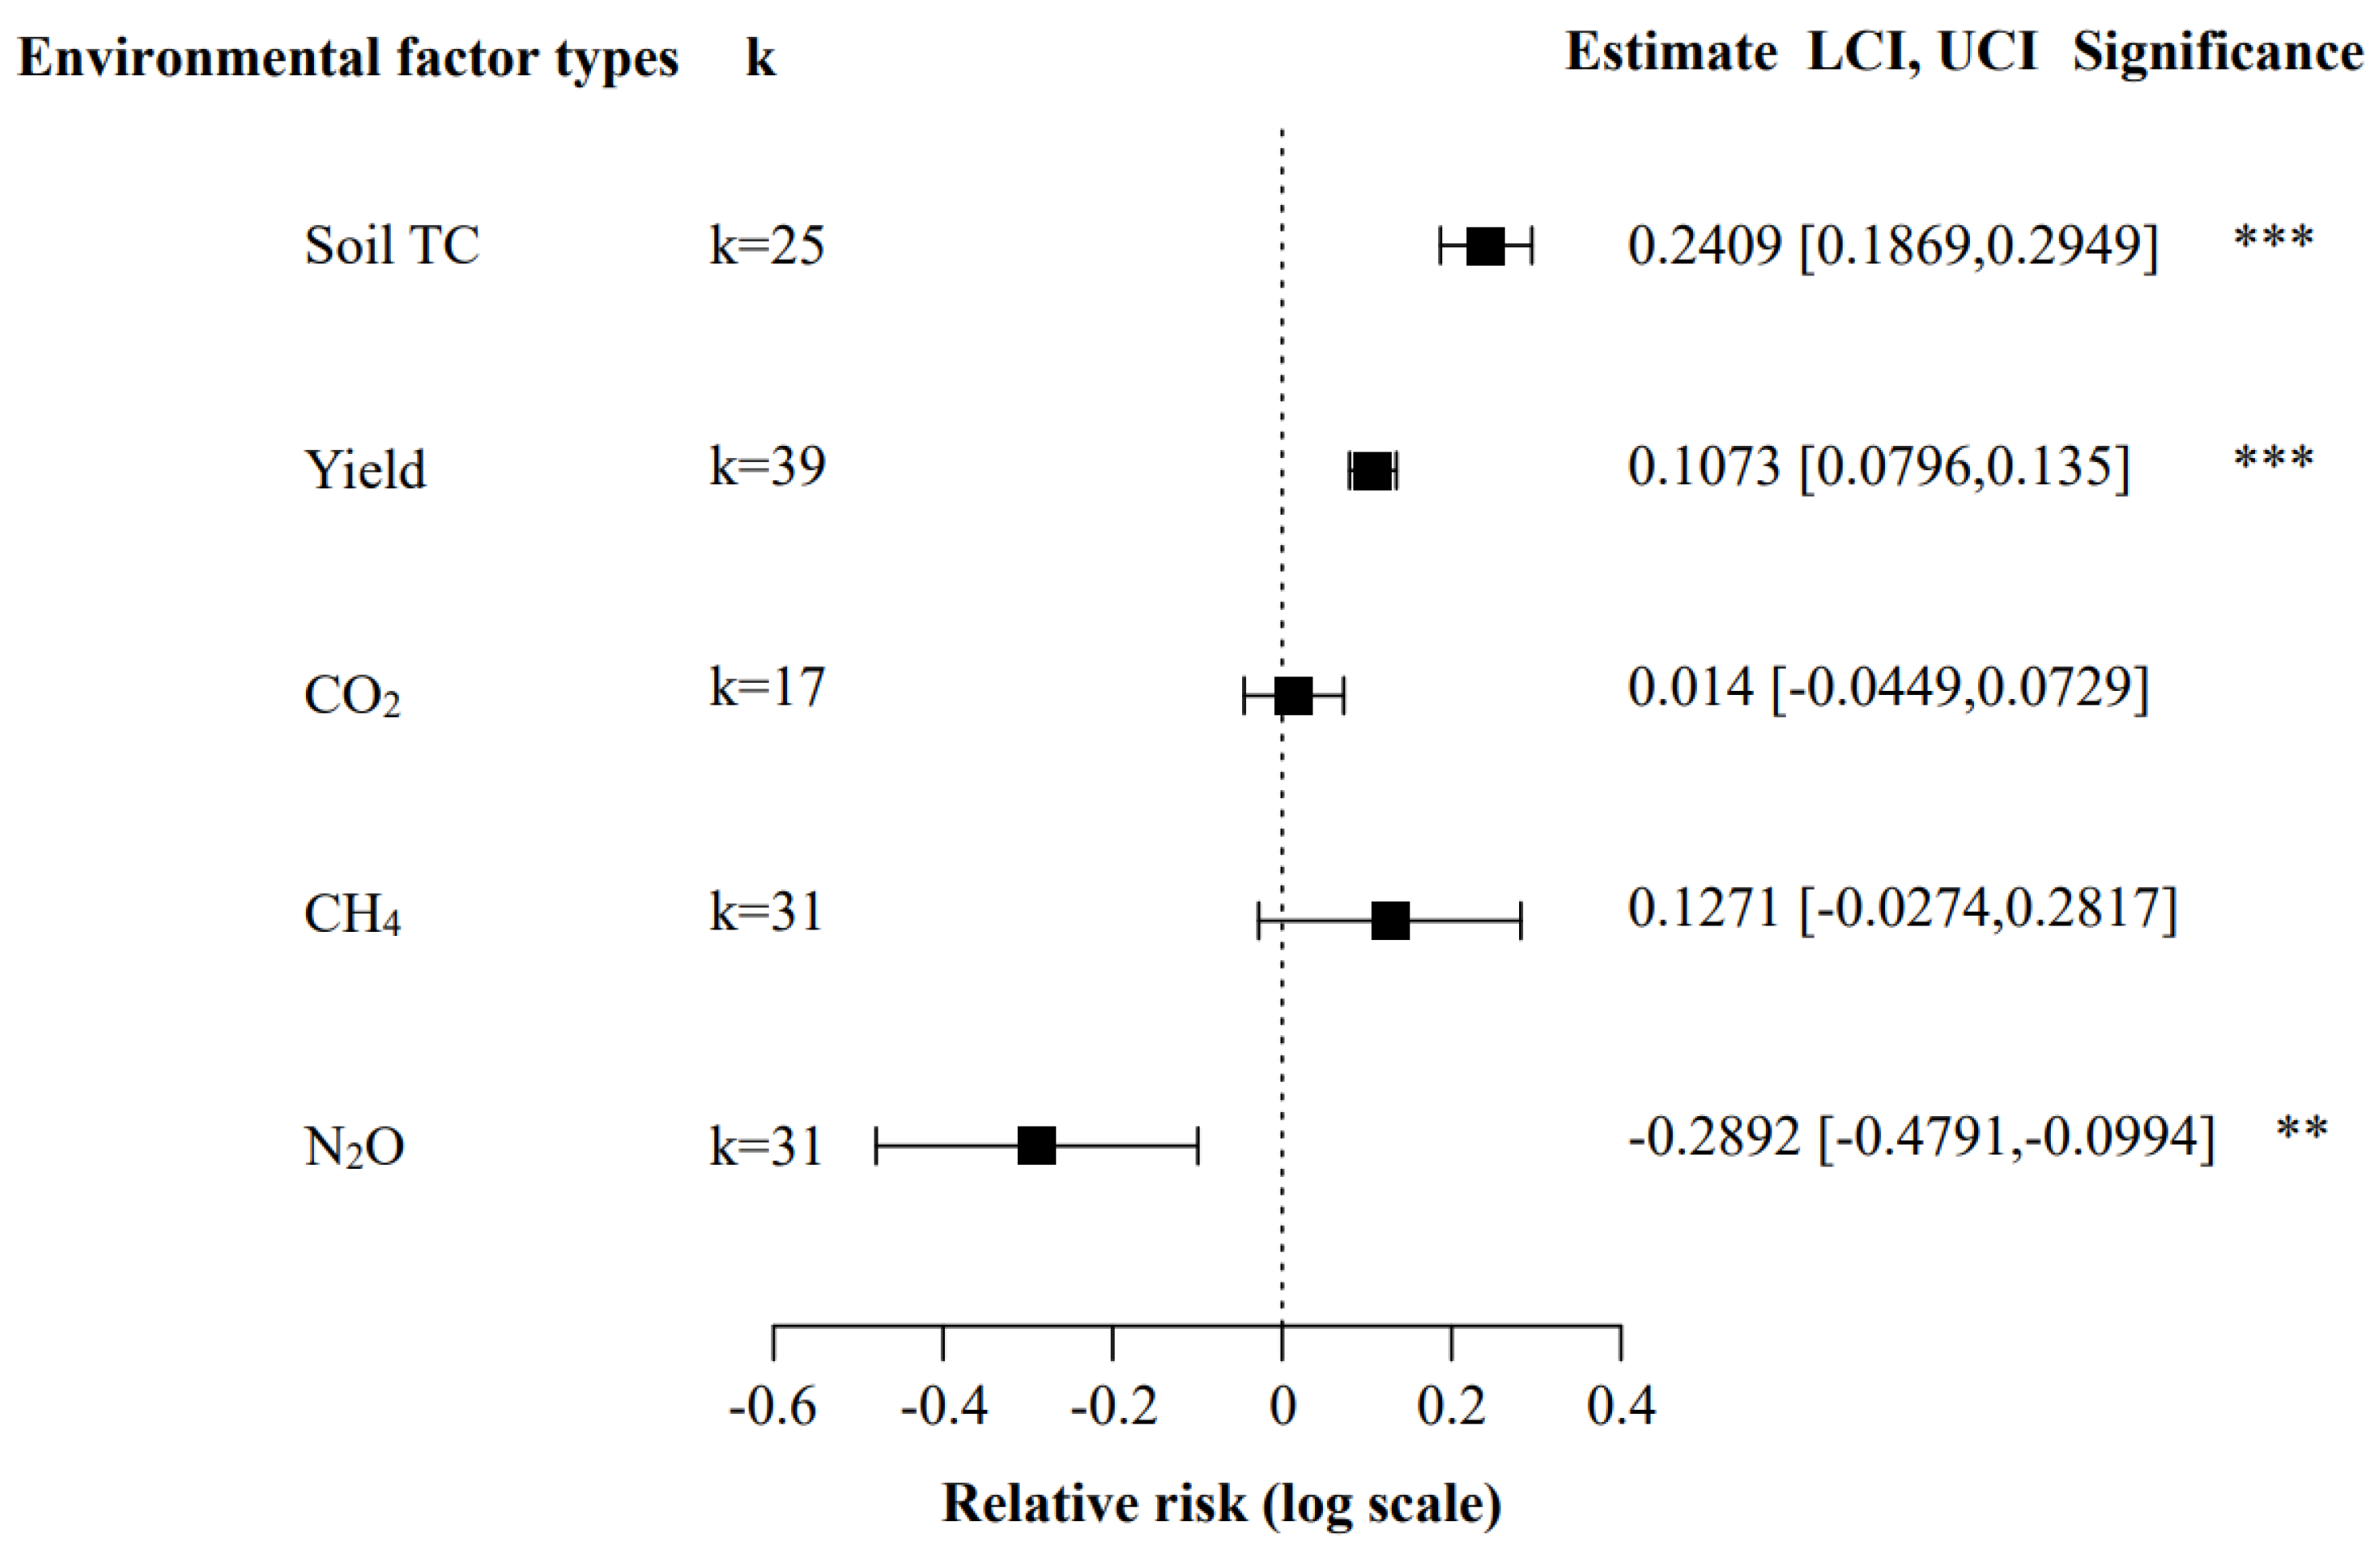
3.1. Impact of Biochar on Carbon Emission Factors

The categorical moderator ratios of different carbon emission factors with biochar incorporation into soil combined with confidence intervals and significance levels are shown in Figure 1. The categorical moderator ratio is expressed as the difference between the natural logarithm of the treatment group and the control group. The results showed that biochar incorporation increased soil carbon (27.2%), rice production (11.3%), CO2 emissions (1.41%), and CH4 emissions (13.6%), and reduced N2O emissions from rice fields by 25.1%. The heterogeneity test showed that the various carbon emission factors with biochar amendment had a strong heterogeneity (p < 0.0001). Therefore, environmental factor variables and treatments were introduced to explain the heterogeneity of each carbon emission factor.

3.2. Heterogeneity Analysis for Rice Yield Variation

Environmental factors causing the heterogeneity in rice yield are shown in Table 1. The results showed that biochar pyrolysis temperature, soil type, climatic conditions, and water management methods were all important factors to cause the heterogeneity of rice yield (p < 0.05) after biochar amendment. The biochar incorporation rate and feedstock for biochar production had an insignificant (p > 0.05) impact on rice yield.
Further sub-group analysis of biochar and environmental factor types causing heterogeneity of rice yield was carried out to obtain the key factors causing heterogeneity under specific treatments. Heterogeneity analyses of the impact of water management conditions, climatic conditions, soil types, and biochar pyrolysis temperatures on rice yield are shown in Figure 2; the results show that rice yield was significantly increased when biochar was pyrolyzed at 300~350 °C (13.6%), 450 °C (11.3%), 500 °C (11.3%), and 600 °C (19.3%), respectively. In Hydragric Anthrosols, Chloridic Solonchaks, and Stagnic Anthrosols, rice yield was increased by 13.3%, 27.1%, and 8.95%, respectively, with biochar application. Intermittent water management and subtropical monsoon climate also significantly increased the rice yield by 8.49% and 12.4%, respectively.

3.3. Heterogeneity Analysis of Soil Total Carbon Variation

Environmental factor types affecting the TC contents in paddy soils under biochar amendment are shown in Table 2. The results show that among the selected heterogeneity influencing factors, only the biochar incorporation rate caused a significant (p < 0.05) heterogeneity of the TC content in paddy soils. The feedstock for biochar production, biochar pyrolysis temperature, soil type, climate, and water management methods had no significant (p > 0.05) effect on soil TC. Furthermore, a predict function in the metafor package was used to predict soil TC increase when different biochar incorporation rates were used in paddy soils (Supplementary Materials Table S2).

3.4. Heterogeneity Analysis for CO2 Emission

Biochar application showed no significant effect on soil CO2 emissions (Table 3). It was found that climatic conditions rather significantly (p < 0.05) induced the heterogeneity of biochar performance on soil CO2 emissions. Biochar incorporation increased CO2 emissions significantly by 12.0% only in the temperate continental monsoon climate (Supplementary Materials Table S3).

3.5. Heterogeneity Analysis of CH4 Emission

Based on the published data, biochar incorporation showed a 13.6% increase in CH4 emissions, but with no significant difference with treatments without biochar application. However, heterogeneity analysis was still necessary to explore the key factors influencing paddy CH4 emissions (Table 4). Among the selected factors of heterogeneity, N fertilizer was the main source of heterogeneity for CH4 emissions from paddy soils (p = 0.0212). Although N fertilizer input at different levels was a key factor affecting CH4 emissions, 210 kg ha−1 N fertilizer could significantly reduce CH4 emissions from paddy soils. Except for 210 kg ha−1, the effect size of other levels of N fertilizer caused a statistically insignificant reduction in CH4 emissions (Supplementary Materials Figure S1). Therefore, in the subsequent calculation process, the effect value in Supplementary Materials Figure S1 was used for correction coefficient calculation with 210 kg ha−1 N fertilizer input. Other N fertilizer input levels were the overall effect size of CH4 emissions under the biochar input scenario in Table 1. As a 13.6% increase in CH4 emissions was not statistically significant, considering the 86-fold global warming potential of CH4 on a 20-year scale, a subgroup analysis was also conducted to explore the key factors that contribute to CH4 emissions. The analysis found that the phenomenon was mainly observed in Hydragric Anthrosols, with an N fertilizer level of 273 kg ha−1 and biochar prepared at 600 °C temperature (Supplementary Materials Figures S2 and S3).

3.6. Heterogeneity Analysis of N2O Emission

The effects of different environmental factor types on N2O emissions in paddy soils after biochar application are shown in Table 5. The heterogeneity analysis showed that the inputs of phosphate (P) and potassium (K) fertilizer unexpectedly affected N2O emissions from paddy soils (p <0.0001). P fertilizer application generally reduced N2O emissions, while K fertilizer application generally promoted N2O emissions from paddy soils. However, statistically, only 120 t ha−1 of P fertilizer input significantly reduced N2O emissions by 55% (Supplementary Materials Figure S4), and 63.5, 120, and 204 t ha−1 of K fertilizer input significantly increased N2O emissions by 121.9%, 224.6%, and 69.2%, respectively (Supplementary Materials Figure S5).

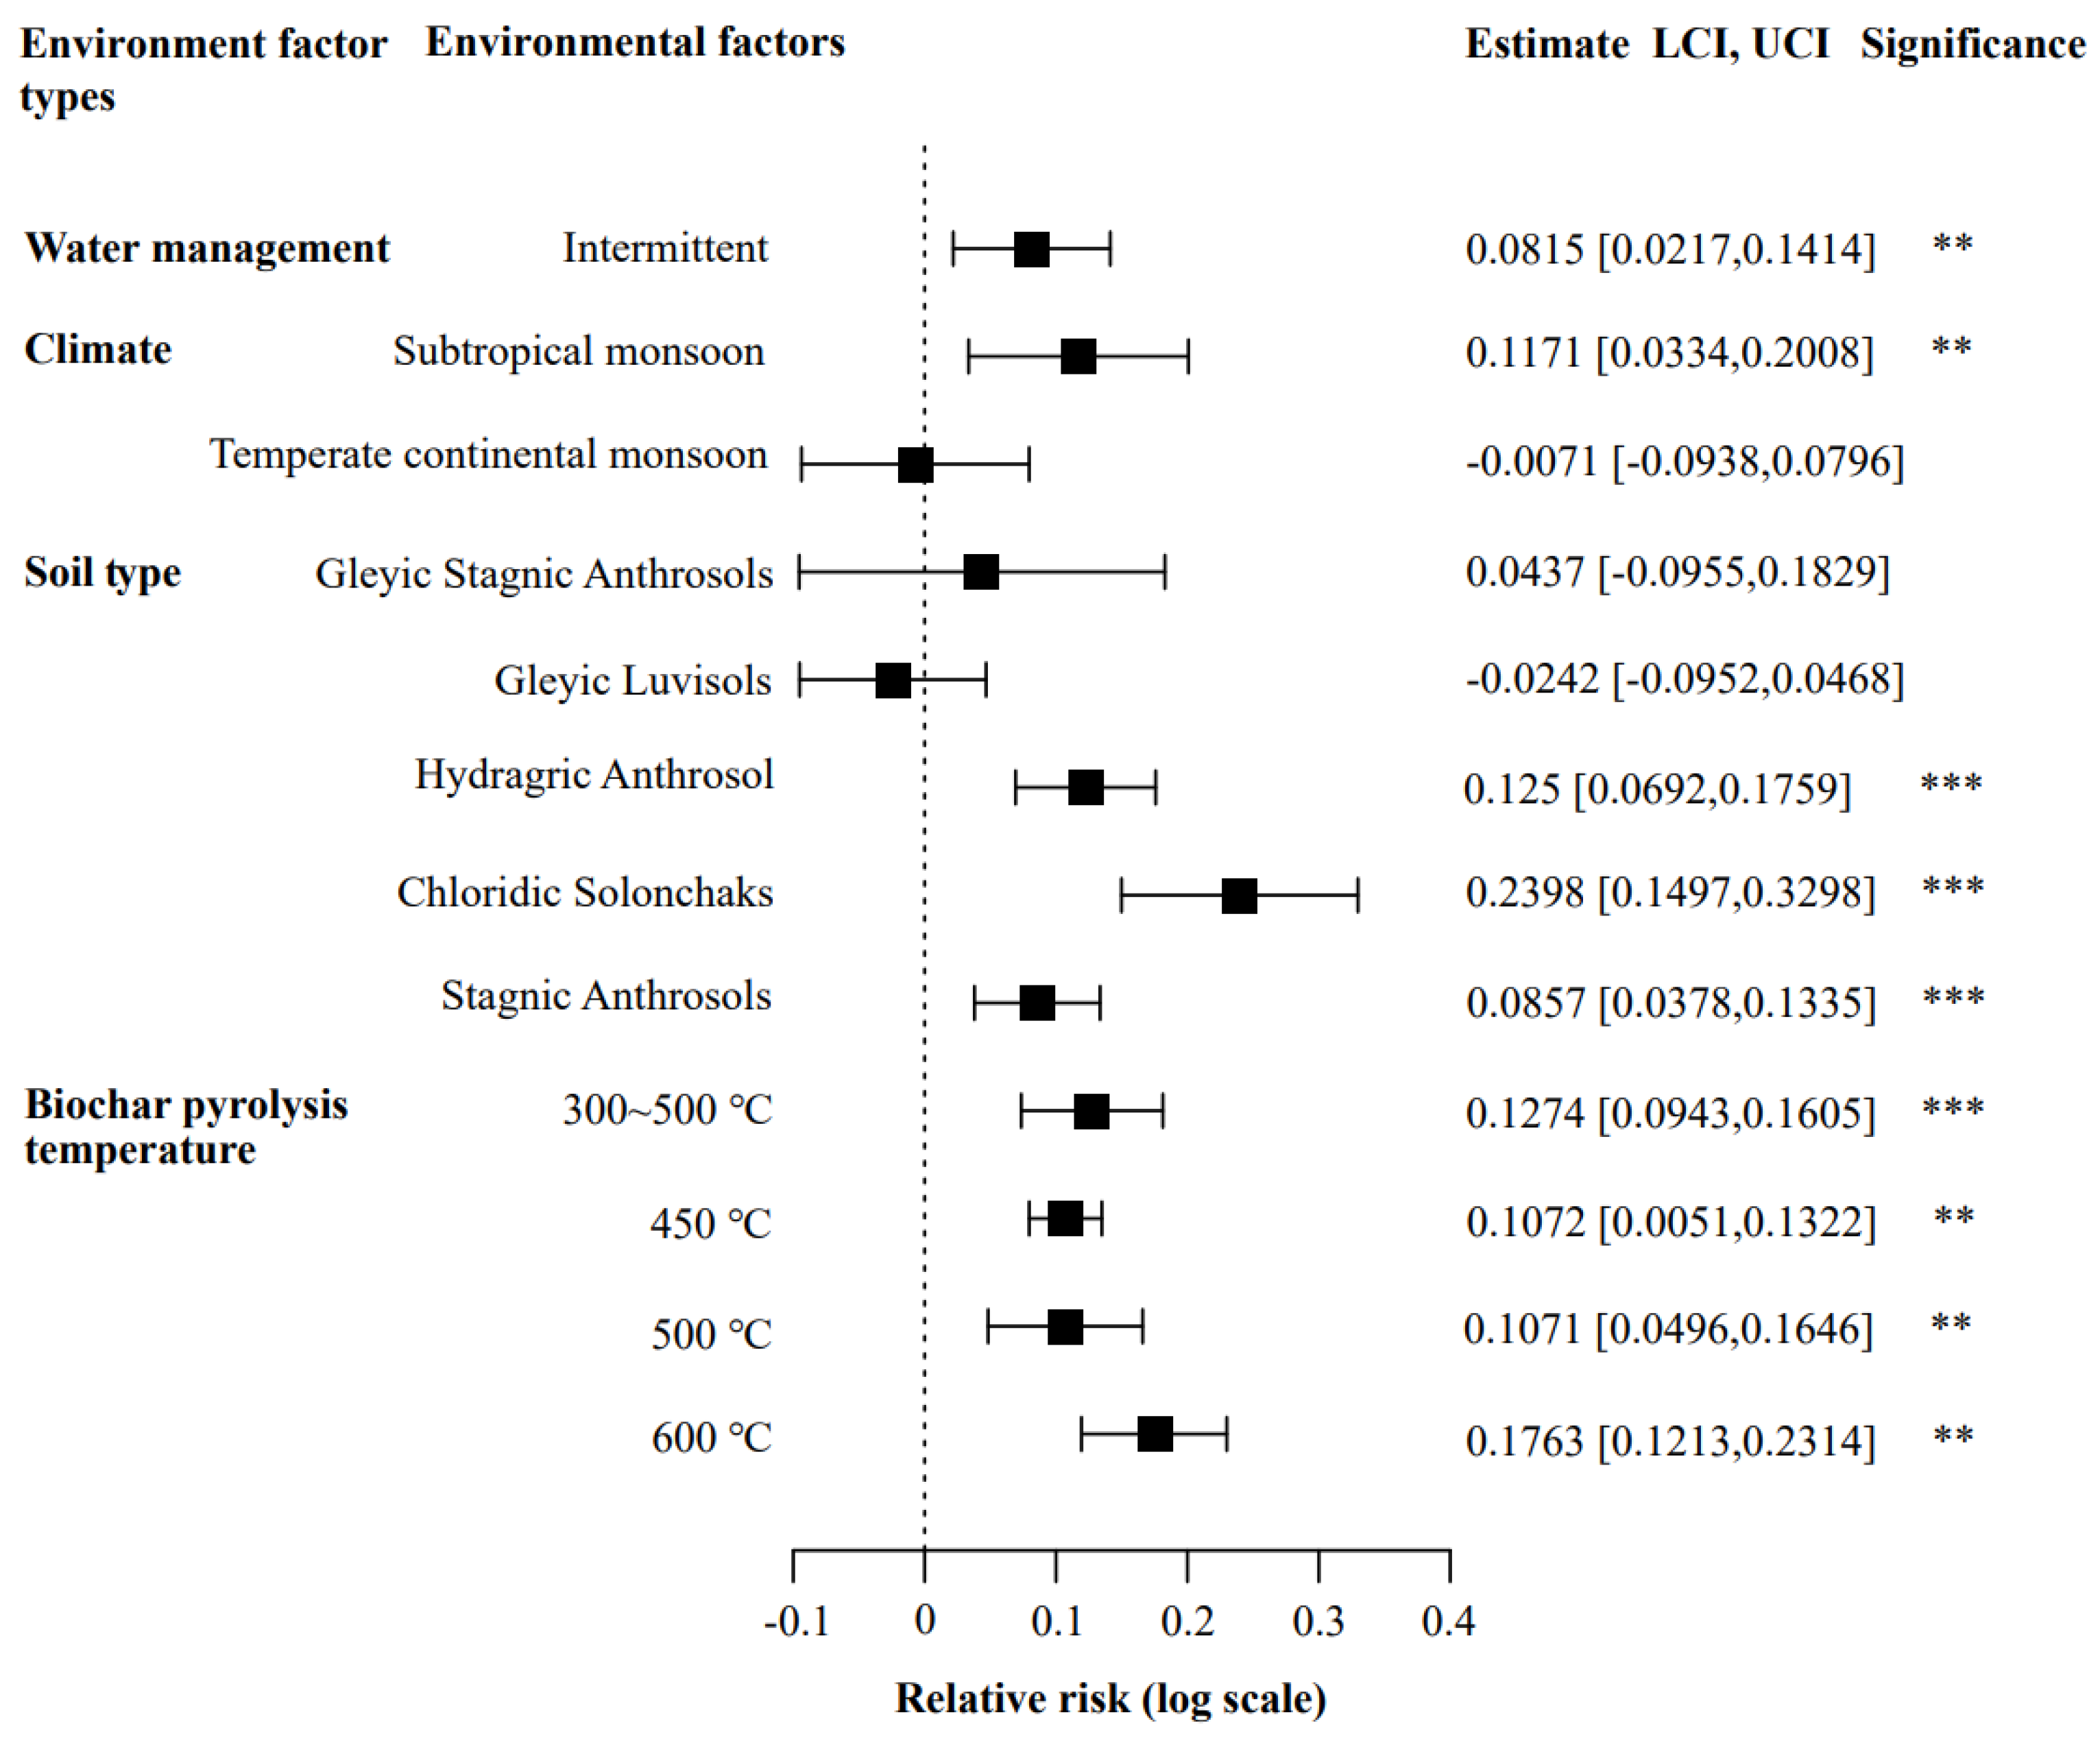
3.7. Carbon Emission Correction Factors

Based on the above heterogeneity analysis outcomes, some heterogeneity-sensitive specific treatments were listed for categorical estimation in Table 6. The effect size of environmental factor types and specific treatments inducing the heterogeneity and categorial moderate coefficients were used to calculate the correction factors (Table 6). If no correction coefficient was needed, or in other words, if no heterogeneity was induced by a specific treatment, the correction coefficient was given as 1 [19].

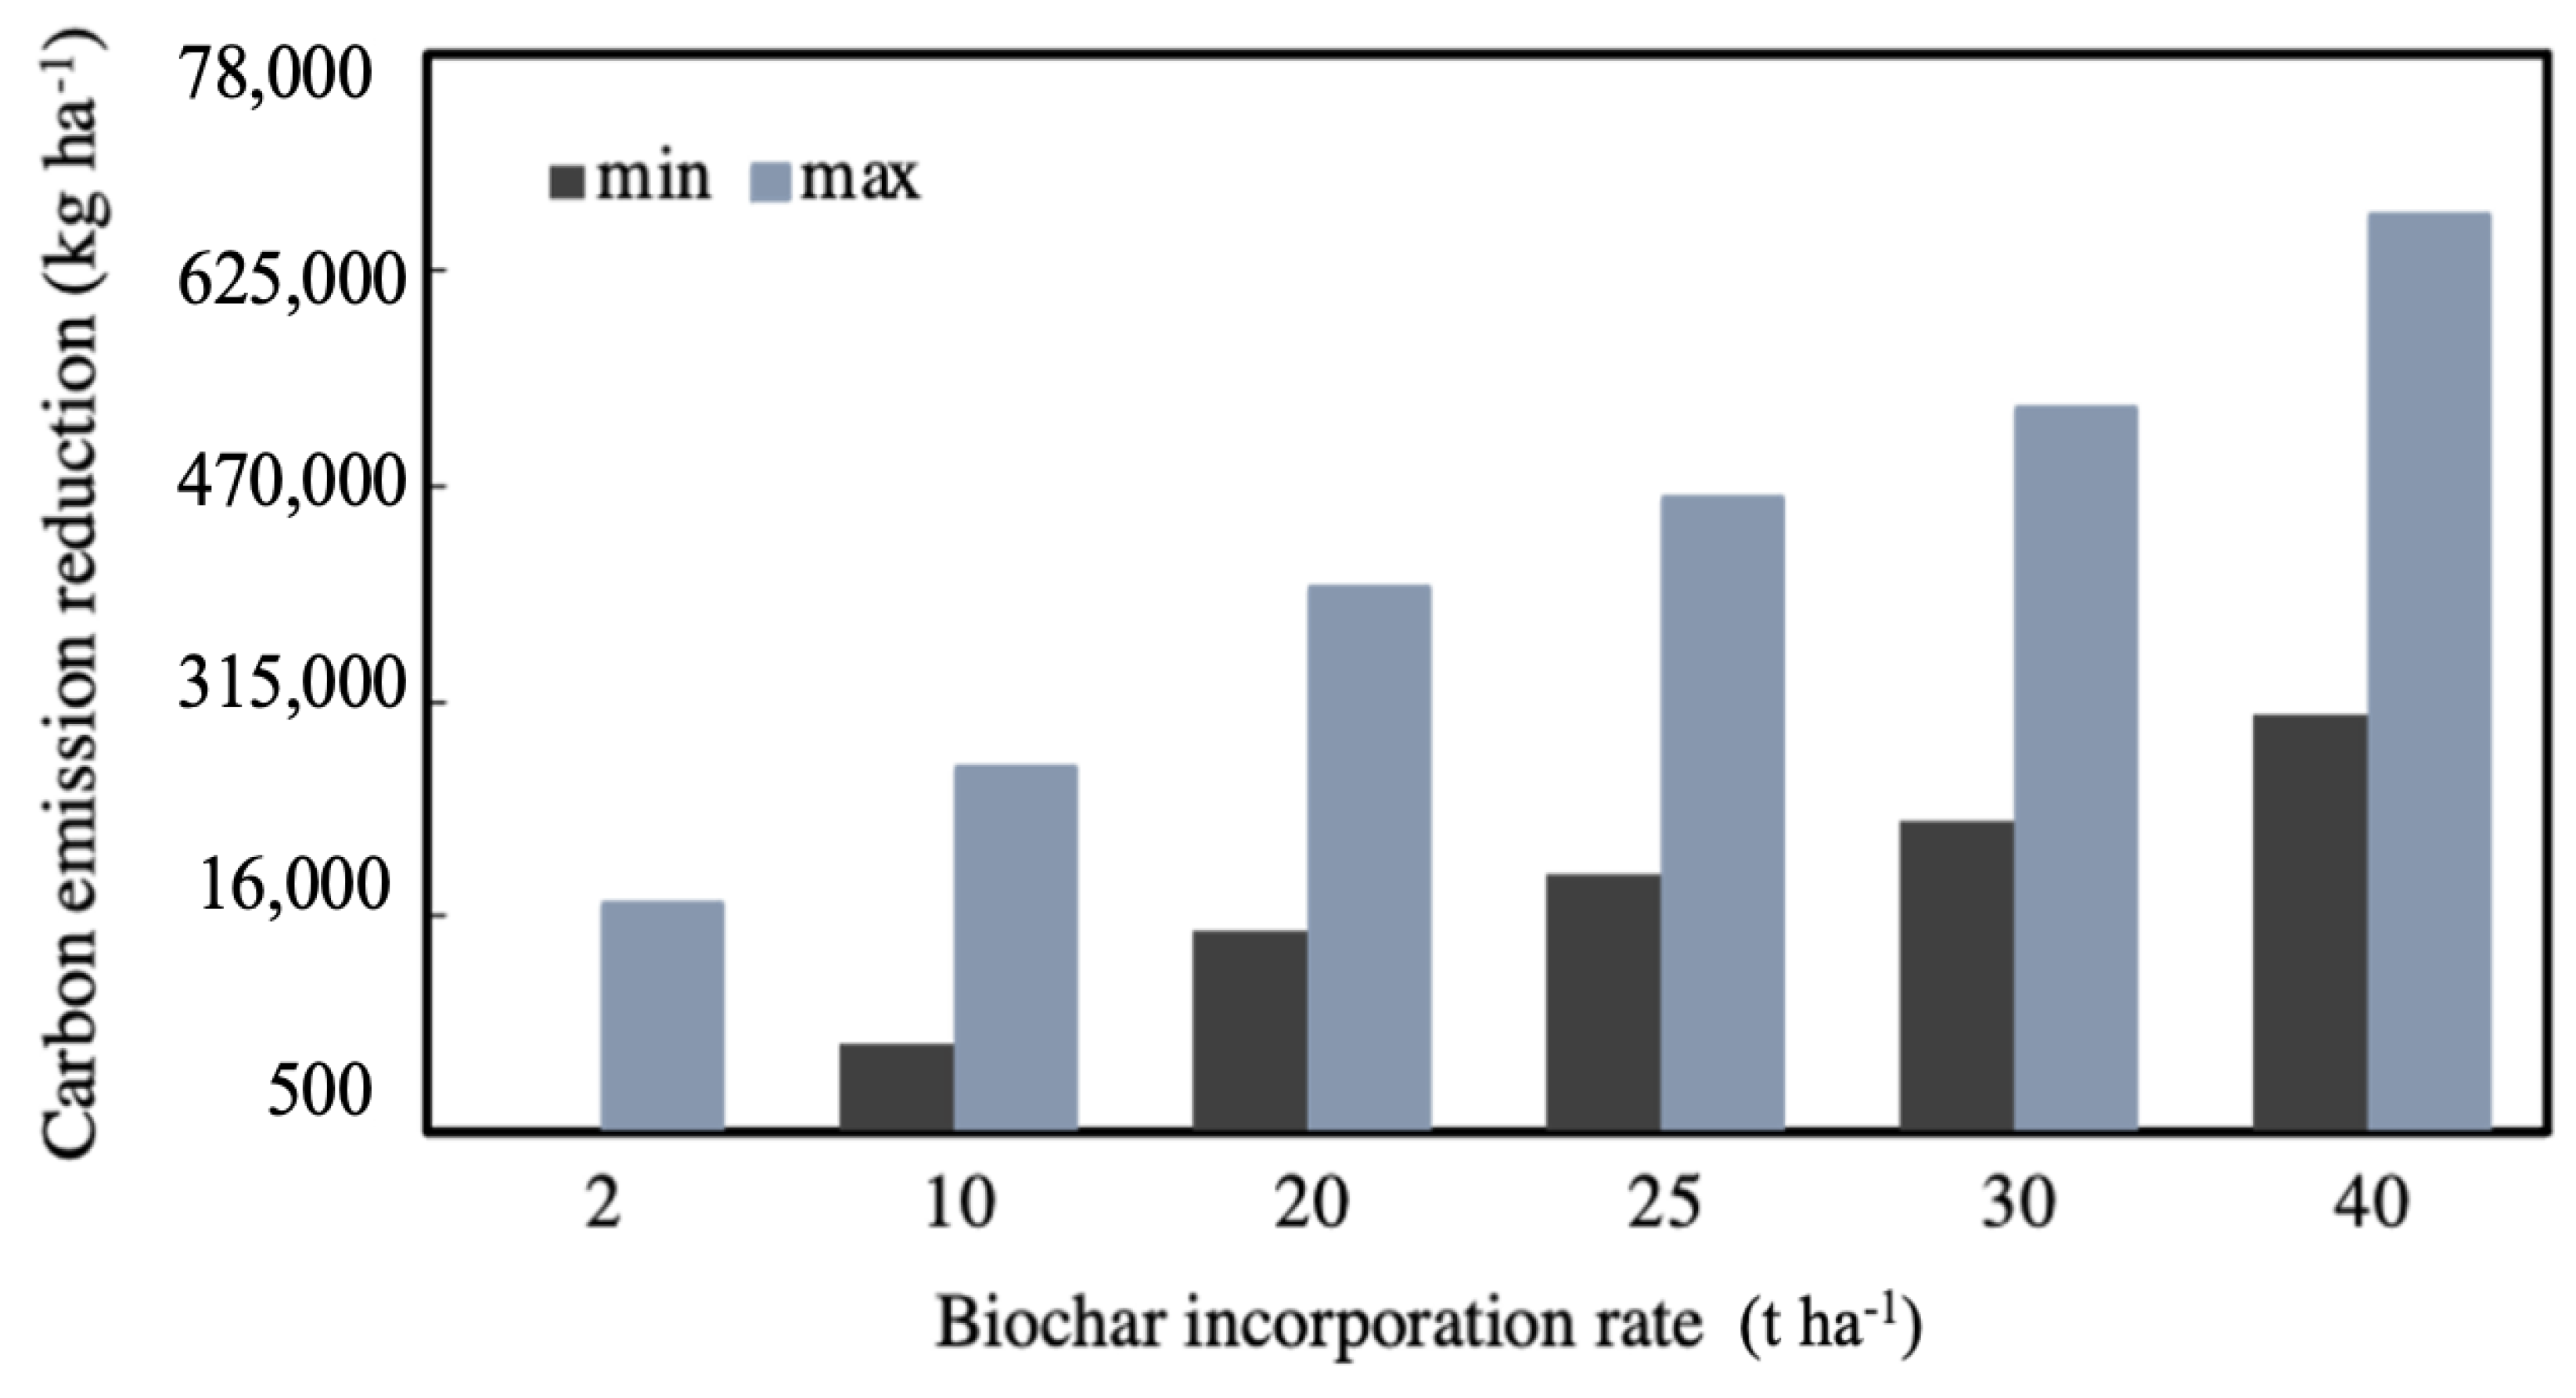
3.8. Calculation of Net Carbon Emissions from Biochar-Amended Paddy Soils

Variance and partial least square analyses were used to explore the key environmental variables that affected soil TC, rice yield, and GHG emissions, as impacted by Supplementary Materials Table S4. Then, the most significant difference induced by a specific environmental factor was selected to calculate the Supplementary Materials Table S5. The environmental variables that significantly affected the carbon emission factors are shown in Supplementary Materials Figure S1. The results showed that soil type was the main factor that induced most of the carbon emission factors impacted by biochar application (soil TC, rice yield, CH4 and N2O emissions). The climate was a key factor affecting CO2 emissions from paddy soils. The default values of carbon emission factors are shown in Supplementary Materials Figure S2.
The calculation formulas for each carbon emission factor were updated in Equations (5)–(9), considering treatment-induced heterogeneity.
ΔCYield = Aharvest ∗ Drice ∗ (eMES ∗ FWM ∗ FST ∗ FC ∗ FBT − 1) ∗ Crice
where Drice stands for default rice production under different scenarios, kg ha−1. MES stands for log transformation for odds ratios. FWM, FST, FC, and FBT stand for correction factors of water management, soil type, climate, and biochar pyrolysis temperature, respectively. Coffset = 132 kg C t−1 biochar. Cproduction = 23.7 kg C t−1 biochar.
ΔCGHGs = (ΔCCO2 + 86 ∗ ΔCCH4 + 300 ∗ ΔCN2O) ∗ 12/44
ΔCCO2 = Aharvest ∗ DCO2 ∗ (eMES ∗ FC − 1) ∗ D
ΔCCH4 = Aharvest ∗ DCH4 ∗ (eMES ∗ FN − 1) ∗ D
ΔCN2O = Aharvest ∗ DN2O ∗ (eMES ∗ FP ∗ FK − 1) ∗ D
where D is the rice growth duration (days); the default of D is 112 days according to IPCC [19]. DCO2, DCH4, and DN2O stand for default CO2, CH4, and N2O emissions under different scenarios, respectively, kg ha−1 d−1. FN, FP, and FK stand for correction factors of N fertilizer, P fertilizer, and K fertilizer, respectively.
The relative deviation from predicted and measured values for soil TC, rice yield, and GHG emissions was −3.7~52.5% (Figure 3). Obtaining an absolute rice harvest area was unrealistic according to the classification of environmental factor types (e.g., soil type, climate change, soil management, and biochar incorporation rate). Therefore, the potential of biochar for carbon reduction was calculated based on the whole life cycle (considering carbon emissions and byproduct offset during biochar production process) of biochar. As soil TC increase was significantly related to the biochar incorporation rate, carbon reduction potentials with a series of biochar carbon incorporation rates were calculated. The minimum carbon emission reduction potential with biochar incorporation rates of 2, 10, 20, 25, 30, and 40 t ha−1 ranged from 0.22 t C ha−1 to 30.51 t C ha−1. The maximum carbon reduction potentials with biochar incorporation rates of 2, 10, 20, 25, 30, and 40 t ha−1 ranged from 16.92 t C ha−1 to 66.34 t C ha−1 (Figure 4). With higher biochar application rate, the carbon emission reduction effect would mainly come from biochar carbon storage in soil (Supplementary Materials Figures S6 and S7). The paddy harvest area in China was estimated to be 30.1 million ha in 2020, according to the National Bureau of Statistics of China [36]. Correspondingly, the total carbon reduction potential of biochar incorporation in Chinese paddy soilss ranged from 0.0066 to 2.0 Pg C with biochar incorporation rates from 2 to 40 t ha−1.

4. Discussion

Biochar incorporation in paddy soils significantly increased soil TC by approximately 27.2%, being the main contributing factor to carbon emission reduction. The highly recalcitrant structure [20] makes it hard for soil microorganisms to metabolize biochar. According to Yi et al. [17], only 17% of the liable biochar carbon would be mineralized to CO2 and released into the atmosphere after two years of biochar incorporation into the soil. In addition, biochar incorporation might increase the soil carbon content through a negative priming effect [37,38], owing to mineral organic protection. All these reasons make biochar a promising material for carbon sequestration in paddy fields. However, recent research found that biochar stability in paddy soils was much weaker than in environments with less human interference [17]. This phenomenon could be attributed to the oxygen secretion by rice roots, which would enhance the biochar oxidation rate, an effect similar to plowing [11]. This indicates that more research should be conducted to strengthen the understanding on biochar stability in the soil in order to maintain a suitable carbon sequestration performance.
The effect of biochar on rice yield was affected by several environmental factors. Biochar amendment significantly increased rice yield by 11.3%, which is close to 11.8% reported by Awad et al. [39]. Biochar pyrolysis temperature, soil type, climate, and water management induced the heterogeneity of rice yield as impacted by biochar application. Soil type and climatic variation had the greatest influence on rice yield. This was probably because different climatic conditions created different soil types, which led to different nutrient availabilities and root proliferation patterns [40], hence different rice yields. Notably, the biochar incorporation rate had no effect on rice yield increase, but the former was related to biochar pyrolysis temperature. These results suggest that even a small amount of biochar (i.e., 2 t ha−1) could lead to an increase in rice yield. This result is consistent with the annual low-rate biochar incorporation concept (annual 2.8 t ha−1 biochar application) reported by Wu et al. [18,21]. The yield promotion effect of biochar prepared at 300~350 °C and 600 °C was better than that of biochar prepared at 500 °C. This is different from previous studies [41], and might be affected by climate and soil type variations. Therefore, the relationship between rice yield and biochar pyrolysis temperature under controlled environmental conditions warrants further investigations.
Biochar incorporation has almost no effect on soil CO2 emissions based on the collected data. This phenomenon is reasonable in that biochar contains a small amount of labile carbon that could be mineralized to CO2 within a relatively short period after soil incorporation. Nutrient elements carried with biochar would also increase the rate of microbial respiration for their growth [42], which could contribute to increased CO2 emissions. Even carbon emission reduction in terms of CO2 emissions was observed with biochar application; however, it should be noted that biochar incorporation would sequestrate a large amount of recalcitrant organic carbon in the soil and increase crop yield preserving more photosynthetic carbon. Furthermore, although the CO2 emission increase was not significant in general with biochar application, CO2 emissions would probably sustain a significant increase in a temperate continental monsoon climate.
Collected field data showed that biochar incorporation has no influence on CH4 emissions in paddy soils due to the significant heterogeneity of different scenarios compared to treatments without biochar amendment. The heterogeneity test showed that the nitrogen application level was the key factor causing the difference in CH4 emissions. Nitrogen plays an important role in CH4 emissions, mainly because methanogens and methanotrophs require nitrogen to obtain energy [43]. On the other hand, different concentrations of various nitrogen forms (e.g., nitrate, ammonium) exerted different influences on CH4 emissions [43,44,45]. A low concentration of ammonium nitrogen promoted CH4 oxidation activity, whereas a high concentration of ammonium nitrogen would inhibit CH4 oxidation due to a competitive mechanism [43,44,45]. Considering the small quantity of field data, the effect size evaluation under different N input levels was limited in this study. Nevertheless, to pursue a satisfactory CH4 mitigation effect, N fertilizer type and application rate could be important breakthrough strategies.
Soil types and P and K fertilizers were the key factors affecting N2O emissions from paddy soils. Soil type affecting N2O emissions was a reasonable finding because varied pH values, nutrient status, and textures would influence N2O emissions, and the K fertilizer application rate affected N utilization for the plant to grow, thus potentially changing the N2O emission response to N fertilizer [14,46,47]. Neutral to slightly acidic soil pH favored N2O emissions (Supplementary Materials Figure S10).Therefore, biochar might be more effective in mitigating N2O emissions in acid soil. However, many studies reported that different nitrogen fertilizer types and application rates could affect N2O emissions. The N fertilizer application rate could greatly affect nitrification and denitrification processes related to N2O production. Yue et al. indicated that 100 kg N ha−1 incorporation gave minimum N2O emissions of rice paddy in China [48]. However, in the present study, P and K fertilizers appeared to be the key factors that induced heterogeneity of N2O emissions. The effect of K fertilizer on GHG emissions was previously reported by Yang et al. [49]. The increase in N2O emissions might have resulted from the fact that P and K fertilizer application rates affected N utilization for the plant to grow, and thus potentially changed the N2O emission response to N fertilizer [50]. The relationship between N fertilizer and N2O emissions could not be established in this study, likely due to the small size of available field data.
A large relative deviation (52.5%) of total carbon emissions in the form of soil TC, rice yield, and GHGs occurred when biochar performed low for carbon reduction. The significant difference between measured carbon reduction values and predicated values in case 1 (Figure 3) occurred due to the inaccuracy of CH4 emission prediction. Therefore, a significant effect size ratio was not obtained. The model was more accurate in a high carbon reduction scenario. Xu et al. [51] reported a maximum of 12 t C reduction ha−1 when biochar was amended into paddy soil at a 20 t ha−1, which had a 20% difference from the minimum carbon reduction (15 t C ha−1) of the predicated one. These results are probably due to the soil carbon difference because they obtained soil SOC changes according to the 2006 IPCC guided method without considering biochar application. In this paper, a more practical soil TC change was used. Furthermore, it also should be noted that when calculating carbon reduction, GWP20 was used in this study rather GWP100 for CH4 and N2O calculations, which will also give a higher carbon reduction when CH4 is reduced. However, greater carbon reduction with biochar addition into paddy soils should be recorded and calculated to enhance the carbon reduction model accuracy.
Biochar carbon storage and CH4 mitigation contributed to the main reduction in carbon released into the atmosphere with biochar amendment in paddy soils. Biochar carbon storage increased with the biochar incorporation rate, while GHG mitigation and yield promotion were not related to the biochar incorporation rate. Generally, when the biochar incorporation rate was higher than 5 t ha−1, biochar carbon storage would account for the entire carbon reduction performance (Supplementary Materials Figures S6 and S7). CH4 mitigation performance was another important factor affecting the carbon reduction effect with biochar addition (Supplementary Materials Figures S8 and S9). Although CH4 emissions were the second highest (CO2 the highest and N2O the lowest), the biggest carbon emission contribution difference in CH4 emissions resulted from its 86-fold greater global warming potential than CO2 on a 20-year scale. Moreover, although the GWP of N2O is 300 times that of CO2, the emission amount is lower compared with CO2 and CH4. Therefore, to obtain a more promising performance in carbon reduction by biochar application, efforts to reduce CH4 emissions with biochar amendment are of great importance, as biochar carbon storage from recalcitrant composition is hard to increase but can be achieved by increasing the biochar incorporation rate. However, when considering economic feasibility, an optimum and practical biochar incorporation rate should be set to maximize carbon reduction potential.

5. Conclusions

A meta-analysis was conducted to calculate the carbon reduction potential of paddy soils with various biochar amendment scenarios one year after biochar application. The results showed that the effects of biochar on increasing the soil TC and rice yield and reducing GHG emissions were highly heterogenous. Soil type was the most influential environmental factor on the carbon emission factors. Rice yield increment was determined by multiple environmental factors such as soil type, climate, and biochar pyrolysis temperature. The N2O emission reduction was related to phosphate and potassium fertilizer application rates. Although biochar application had no significant effect on paddy soil CO2 emissions, climatic conditions did show a significant influence. The overall relative deviation of the predicted carbon reduction was −3.7~52.5% compared to the measured values. Only one-year carbon reduction performance under biochar amendment in paddy soils was considered in this study. The scarcity and inconsistency of long-term field experimental data make the long-term carbon reduction calculation with biochar application challenging. This should be further explored and calculated to give a clear understanding of the long-term carbon reduction potential of biochar when it is incorporated into paddy soils.

Supplementary Materials

The following supporting information can be downloaded at: https://www.mdpi.com/article/10.3390/agronomy12123065/s1, Table S1: References for meta-analysis; Table S2: Prediction of soil total carbon content in paddy field with different biochar incorporation; Table S3: Effect size of CO2 emission with biochar amendment strategy under temperate continental monsoon climate; Table S4: Key environmental factors affecting carbon emission; Table S5: Default value of carbon emission factors; Figure S1: Effect size of CH4 emission with nitrogen fertilizer under biochar amendment strategy; Figure S2: Effect size of CH4 stimulation with nitrogen fertilizer under biochar amendment strategy; Figure S3: CH4 emission promotion factor exploration; Figure S4: Effect size of N2O emission with phosphate fertilizer under biochar amendment strategy; Figure S5: Effect size of N2O emission with potassium fertilizer under biochar amendment strategy; Figure S6: The minimal carbon potential with biochar incorporation into paddy soils; Figure S7: The maximal carbon potential with biochar incorporation into paddy soils; Figure S8: The minimal carbon reduction induced by rice yield promotion and carbon emission from GHGs with biochar incorporation in paddy field; Figure S9: The maximal carbon reduction induced by rice yield promotion and GHGs mitigation with biochar incorporation in paddy field; Figure S10: The relationship of soil background pH and N2O difference with biochar amendment. Positive values represent for N2O stimulation and negative values represent for N2O reduction after biochar was incorporated.

Author Contributions

F.B. and J.M. conceived and designed the study. F.B. performed the experiments and analyzed the data. Q.N., W.L., N.B., B.S., J.M. and H.W. revised the manuscript and interpreted results. All authors have read and agreed to the published version of the manuscript.

Funding

This study was financially supported by the Earmarked Fund for Modern Agroindustry Technology Research System (No. CARS-01-51), the Project of Standardization Subsidy, Shenyang, China (2021-57), the Innovative Talents Promotion Plan of Ministry of Science and Technology of the People’s Republic of China (No. 2017RA2211), and the Shenyang Science and Technology Plan Project (22-317-2-08).

Institutional Review Board Statement

Not applicable.

Informed Consent Statement

Not applicable.

Data Availability Statement

The data presented during this study are available on reasonable request from the corresponding author.

Conflicts of Interest

The authors declare no conflict of interest.

References

  1. Wang, F.; Harindintwali, J.D.; Yuan, Z.; Wang, M.; Wang, F.; Li, S.; Yin, Z.; Huang, L.; Fu, Y.; Li, L.; et al. Technologies and perspectives for achieving carbon neutrality. Innovation 2021, 2, 100180. [Google Scholar] [CrossRef]
  2. Jia, Z.; Lin, B. How to achieve the first step of the carbon-neutrality 2060 target in China: The coal substitution perspective. Energy 2021, 233, 121179. [Google Scholar] [CrossRef]
  3. Zhao, X.; Ma, X.; Chen, B.; Shang, Y.; Song, M. Challenges toward carbon neutrality in China: Strategies and countermeasures. Resour. Conserv. Recycl. 2022, 176, 105959. [Google Scholar] [CrossRef]
  4. Smith, P. Soil carbon sequestration and biochar as negative emission technologies. Glob. Change Biol. 2016, 22, 1315–1324. [Google Scholar] [CrossRef]
  5. FAOSTAT Food and Agriculture Organization of the United Nations (FAO). Available online: http://www.fao.org/faostat/en/#data (accessed on 16 March 2020).
  6. Xiao, Y.; Yang, S.; Xu, J.; Ding, J.; Sun, X.; Jiang, Z. Effect of Biochar Amendment on Methane Emissions from Paddy Field under Water-Saving Irrigation. Sustainability 2018, 10, 1371. [Google Scholar] [CrossRef] [Green Version]
  7. Bridgham, S.D.; Cadillo-Quiroz, H.; Keller, J.K. Methane emissions from wetlands: Biogeochemical, microbial, and modeling perspectives from local to global scales. Glob. Change Biol. 2013, 19, 1325–1346. [Google Scholar] [CrossRef]
  8. Ma, K.E.; Qiu, Q.; Lu, Y. Microbial mechanism for rice variety control on methane emission from rice field soil. Glob. Change Biol. 2010, 16, 3085–3095. [Google Scholar] [CrossRef]
  9. Jiang, Y.; Qian, H.; Huang, S.; Zhang, X.; Wang, L.; Zhang, L.; Shen, M.; Xiao, X.; Chen, F.; Zhang, H.; et al. Acclimation of methane emissions from rice paddy fields to straw addition. Sci. Adv. 2019, 5, eaau9038. [Google Scholar] [CrossRef] [PubMed] [Green Version]
  10. Jeffery, S.; Verheijen, F.G.A.; Kammann, C.; Abalos, D. Biochar effects on methane emissions from soils: A meta-analysis. Soil Biol. Biochem. 2016, 101, 251–258. [Google Scholar] [CrossRef]
  11. Han, X.; Sun, X.; Wang, C.; Wu, M.; Dong, D.; Zhong, T.; Thies, J.E.; Wu, W. Mitigating methane emission from paddy soil with rice-straw biochar amendment under projected climate change. Sci. Rep. 2016, 6, 24731. [Google Scholar] [CrossRef]
  12. Wang, C.; Wang, W.; Sardans, J.; Singla, A.; Zeng, C.; Lai, D.Y.F.; Penuelas, J. Effects of steel slag and biochar amendments on CO2, CH4, and N2O flux, and rice productivity in a subtropical Chinese paddy field. Environ. Geochem. Health 2019, 41, 1419–1431. [Google Scholar] [CrossRef]
  13. Ji, C.; Jin, Y.; Li, C.; Chen, J.; Kong, D.; Yu, K.; Liu, S.; Zou, J. Variation in Soil Methane Release or Uptake Responses to Biochar Amendment: A Separate Meta-analysis. Ecosystems 2018, 21, 1692–1705. [Google Scholar] [CrossRef]
  14. Bouwman, A.F.; Boumans, L.J.M.; Batjes, N.H. Modeling global annual N2O and NO emissions from fertilized fields. Glob. Biogeochem. Cycles 2002, 16, 28-1–28-9. [Google Scholar] [CrossRef]
  15. Aamer, M.; Hassan, M.U.; Shaaban, M.; Rasul, F.; Haiying, T.; Qiaoying, M.; Batool, M.; Rasheed, A.; Chuan, Z.; Qitao, S.; et al. Rice straw biochar mitigates N2O emissions under alternate wetting and drying conditions in paddy soil. J. Saudi Chem. Soc. 2021, 25, 101172. [Google Scholar] [CrossRef]
  16. Xiao, L.; Feng, L.; Yuan, G.; Wei, J. Low-cost field production of biochars and their properties. Environ. Geochem. Health 2020, 42, 1569–1578. [Google Scholar] [CrossRef] [PubMed]
  17. Yi, Q.; Liang, B.; Nan, Q.; Wang, H.; Zhang, W.; Wu, W. Temporal physicochemical changes and transformation of biochar in a rice paddy: Insights from a 9-year field experiment. Sci. Total Environ. 2020, 721, 137670. [Google Scholar] [CrossRef] [PubMed]
  18. Nan, Q.; Wang, C.; Wang, H.; Yi, Q.; Liang, B.; Xu, J.; Wu, W. Biochar drives microbially-mediated rice production by increasing soil carbon. J. Hazard. Mater. 2020, 387, 121680. [Google Scholar] [CrossRef]
  19. IPCC. 2019 Refinement to the 2006 IPCC Guidelines for National Greenhouse Gas Inventories; IPCC: Geneva, Switzerland, 2019. [Google Scholar]
  20. Nan, Q.; Xin, L.; Qin, Y.; Waqas, M.; Wu, W. Exploring long-term effects of biochar on mitigating methane emissions from paddy soil: A review. Biochar 2021, 3, 125–134. [Google Scholar] [CrossRef]
  21. Nan, Q.; Wang, C.; Wang, H.; Yi, Q.; Wu, W. Mitigating methane emission via annual biochar amendment pyrolyzed with rice straw from the same paddy field. Sci. Total Environ. 2020, 746, 141351. [Google Scholar] [CrossRef]
  22. Yang, S.H.; Xiao, Y.N.; Sun, X.; Ding, J.; Jiang, Z.W.; Xu, J.Z. Biochar improved rice yield and mitigated CH4 and N2O emissions from paddy field under controlled irrigation in the Taihu Lake Region of China. At. Environ. 2019, 200, 69–77. [Google Scholar] [CrossRef]
  23. Xu, X.; He, C.; Yuan, X.; Zhang, Q.; Wang, S.; Wang, B.; Guo, X.; Zhang, L. Rice straw biochar mitigated more N2O emissions from fertilized paddy soil with higher water content than that derived from ex situ biowaste. Environ. Pollut. 2020, 263, 114477. [Google Scholar] [CrossRef]
  24. Cui, Y.; Meng, J.; Wang, Q.; Zhang, W.; Cheng, X.; Chen, W. Effects of straw and biochar addition on soil nitrogen, carbon, and super rice yield in cold waterlogged paddy soils of North China. J. Integr. Agric. 2017, 16, 1064–1074. [Google Scholar] [CrossRef]
  25. Chen, D.; Wang, C.; Shen, J.; Li, Y.; Wu, J. Response of CH4 emissions to straw and biochar applications in double-rice cropping systems: Insights from observations and modeling. Environ. Pollut. 2018, 235, 95–103. [Google Scholar] [CrossRef] [PubMed]
  26. Sun, L.; Deng, J.; Fan, C.; Li, J.; Liu, Y. Combined effects of nitrogen fertilizer and biochar on greenhouse gas emissions and net ecosystem economic budget from a coastal saline rice field in southeastern China. Environ. Sci. Pollut. Res. 2020, 27, 17013–17022. [Google Scholar] [CrossRef]
  27. Zhang, A.; Bian, R.; Hussain, Q.; Li, L.; Pan, G.; Zheng, J.; Zhang, X.; Zheng, J. Change in net global warming potential of a rice–wheat cropping system with biochar soil amendment in a rice paddy from China. Agric. Ecosyst. Environ. 2013, 173, 37–45. [Google Scholar] [CrossRef]
  28. Zhang, A.; Bian, R.; Pan, G.; Cui, L.; Hussain, Q.; Li, L.; Zheng, J.; Zheng, J.; Zhang, X.; Han, X.; et al. Effects of biochar amendment on soil quality, crop yield and greenhouse gas emission in a Chinese rice paddy: A field study of 2 consecutive rice growing cycles. Field Crops Res. 2012, 127, 153–160. [Google Scholar] [CrossRef]
  29. Zhang, A.; Cui, L.; Pan, G.; Li, L.; Hussain, Q.; Zhang, X.; Zheng, J.; Crowley, D. Effect of biochar amendment on yield and methane and nitrous oxide emissions from a rice paddy from Tai Lake plain, China. Agric. Ecosyst. Environ. 2010, 139, 469–475. [Google Scholar] [CrossRef]
  30. ISO 14044:2006; Environmental Management—Life Cycle Assessment—Requirements and Guidelines 2006. International Organization for Standardization: Geneva, Switzerland, 2006.
  31. Biederman, L.A.; Harpole, W.S. Biochar and its effects on plant productivity and nutrient cycling: A meta-analysis. GCB Bioenergy 2013, 5, 202–214. [Google Scholar] [CrossRef]
  32. Viechtbauer, W. Conducting Meta-Analyses in R with the metafor Package. J. Stat. Softw. 2010, 36, 1–48. [Google Scholar] [CrossRef] [Green Version]
  33. Chen, G.; Fang, Y.; Van Zwieten, L.; Xuan, Y.; Tavakkoli, E.; Wang, X.; Zhang, R. Priming, stabilization and temperature sensitivity of native SOC is controlled by microbial responses and physicochemical properties of biochar. Soil Biology Biochem. 2021, 154, 108139. [Google Scholar] [CrossRef]
  34. Brassard, P.; Godbout, S.; Pelletier, F.; Raghavan, V.; Palacios, J.H. Pyrolysis of switchgrass in an auger reactor for biochar production: A greenhouse gas and energy impacts assessment. Biomass Bioenergy 2018, 116, 99–105. [Google Scholar] [CrossRef]
  35. EBC. EBC-Guidelines for the Certification of Biochar Based Carbon Sinks Version 2.1 from 1 February 2021. 2020. Available online: http://European-biochar.org (accessed on 30 September 2022).
  36. China, National Bureau of Satistics of China. Available online: http://www.stats.gov.cn/tjsj/ndsj/2021/indexch.htm (accessed on 30 September 2022).
  37. Liu, Y.; Chen, Y.; Wang, Y.; Lu, H.; He, L.; Yang, S. Negative priming effect of three kinds of biochar on the mineralization of native soil organic carbon. Land Degrad. Dev. 2018, 29, 3985–3994. [Google Scholar] [CrossRef]
  38. Lu, W.; Ding, W.; Zhang, J.; Li, Y.; Luo, J.; Bolan, N.; Xie, Z. Biochar suppressed the decomposition of organic carbon in a cultivated sandy loam soil: A negative priming effect. Soil Biol. Biochem. 2014, 76, 12–21. [Google Scholar] [CrossRef]
  39. Awad, Y.M.; Wang, J.; Igalavithana, A.D.; Tsang, D.C.W.; Kim, K.-H.; Lee, S.S.; Ok, Y.S. Chapter One—Biochar Effects on Rice Paddy: Meta-analysis. In Advances in Agronomy; Sparks, D.L., Ed.; Academic Press: Cambridge, MA, USA, 2018; Volume 148, pp. 1–32. [Google Scholar]
  40. Liu, X.; Ma, Y.; Manevski, K.; Andersen, M.N.; Li, Y.; Wei, Z.; Liu, F. Biochar and alternate wetting-drying cycles improving rhizosphere soil nutrients availability and tobacco growth by altering root growth strategy in Ferralsol and Anthrosol. Sci. Total Environ. 2022, 806, 150513. [Google Scholar] [CrossRef] [PubMed]
  41. Wu, W.; Yang, M.; Feng, Q.; McGrouther, K.; Wang, H.; Lu, H.; Chen, Y. Chemical characterization of rice straw-derived biochar for soil amendment. Biomass Bioenergy 2012, 47, 268–276. [Google Scholar] [CrossRef]
  42. Khadem, A.; Raiesi, F.; Besharati, H.; Khalaj, M.A. The effects of biochar on soil nutrients status, microbial activity and carbon sequestration potential in two calcareous soils. Biochar 2021, 3, 105–116. [Google Scholar] [CrossRef]
  43. Wu, Z.; Song, Y.; Shen, H.; Jiang, X.; Li, B.; Xiong, Z. Biochar can mitigate methane emissions by improving methanotrophs for prolonged period in fertilized paddy soils. Environ. Pollut. 2019, 253, 1038–1046. [Google Scholar] [CrossRef]
  44. Nan, Q.; Fang, C.; Cheng, L.; Hao, W.; Wu, W. Elevation of NO3-N from biochar amendment facilitates mitigating paddy CH4 emission stably over seven years. Environ. Pollut. 2021, 295, 118707. [Google Scholar] [CrossRef]
  45. Luo, J.; Huang, J.; Zeng, D.; Peng, J.; Zhang, G.; Ma, H.; Guan, Y.; Yi, H.; Fu, Y.; Han, B.; et al. A defensin-like protein drives cadmium efflux and allocation in rice. Nat. Commun. 2018, 9, 645. [Google Scholar] [CrossRef] [Green Version]
  46. Ji, C.; Li, S.; Geng, Y.; Yuan, Y.; Zhi, J.; Yu, K.; Han, Z.; Wu, S.; Liu, S.; Zou, J. Decreased N2O and NO emissions associated with stimulated denitrification following biochar amendment in subtropical tea plantations. Geoderma 2020, 365, 114223. [Google Scholar] [CrossRef]
  47. Aamer, M.; Shaaban, M.; Hassan, M.U.; Ying, L.; Haiying, T.; Qiaoying, M.; Munir, H.; Rasheed, A.; Xinmei, L.; Ping, L.; et al. N2O Emissions Mitigation in Acidic Soil Following Biochar Application Under Different Moisture Regimes. J. Soil Sci. Plant Nutr. 2020, 20, 2454–2464. [Google Scholar] [CrossRef]
  48. Yue, Q.; Ledo, A.; Cheng, K.; Albanito, F.; Lebender, U.; Sapkota, T.B.; Brentrup, F.; Stirling, C.M.; Smith, P.; Sun, J.; et al. Re-assessing nitrous oxide emissions from croplands across Mainland China. Agric. Ecosyst. Environ. 2018, 268, 70–78. [Google Scholar] [CrossRef] [Green Version]
  49. Yang, Q.; Zhou, H.; Bartocci, P.; Fantozzi, F.; Mašek, O.; Agblevor, F.A.; Wei, Z.; Yang, H.; Chen, H.; Lu, X.; et al. Prospective contributions of biomass pyrolysis to China’s 2050 carbon reduction and renewable energy goals. Nat. Commun. 2021, 12, 1698. [Google Scholar] [CrossRef] [PubMed]
  50. van der Velde, M.; Folberth, C.; Balkovič, J.; Ciais, P.; Fritz, S.; Janssens, I.A.; Obersteiner, M.; See, L.; Skalský, R.; Xiong, W.; et al. African crop yield reductions due to increasingly unbalanced Nitrogen and Phosphorus consumption. Glob. Change Biol. 2014, 20, 1278–1288. [Google Scholar] [CrossRef]
  51. Xu, X.; Cheng, K.; Wu, H.; Sun, J.; Yue, Q.; Pan, G. Greenhouse gas mitigation potential in crop production with biochar soil amendment—A carbon footprint assessment for cross-site field experiments from China. GCB Bioenergy 2019, 11, 592–605. [Google Scholar] [CrossRef]
Figure 1. Analysis of the heterogeneity of carbon emission factors under the circumstances of applying biochar to paddy soils. Estimate stands for mean effect size; ** and *** indicate statistical significance levels at 0.01 and 0.001, respectively; k stands for number of samples; values in brackets mean LCI (the bottom of 95% confidence interval) and UCI (the ceiling of 95% confidence interval).
Agronomy 12 03065 g001
Figure 2. Estimated impact of key factors of heterogeneity on rice yield in biochar-amended soil. Estimate stands for mean effect size; ** and *** indicate statistical significance levels at 0.01 and 0.001, respectively, for the estimate; values in brackets mean LCI (the bottom of 95% confidence interval) and UCI (the ceiling of 95% confidence interval). Treatments explored but without appearance in this figure represent no effect size.
Agronomy 12 03065 g002
Figure 3. Measured and predicted values of carbon emission reduction from paddy soils under biochar incorporation.
Agronomy 12 03065 g003
Figure 4. Carbon reduction potentials with biochar amendment in paddy soils.
Agronomy 12 03065 g004
Table 1. Environmental factors affecting rice yield heterogeneity under biochar application scenarios.
Environmental Factor TypesQMPQMk
Biochar amount3.21390.07339
Biochar temperature10.82490.028637
Biochar material4.73970.093537
Soil type47.8961<0.000139
Climate40.4763<0.000137
Water management7.12690.007635
Note: QM for heterogeneity of estimated moderator; PQM for significance test of QM; k for number of samples.
Table 2. Factors affecting heterogeneity of soil TC in paddy soils amended with biochar.
Environmental Factor TypesQMPQMSignificancek
Biochar amount16.1367<0.0001***25
Raw material4.410.1103 25
Biochar temperature7.63710.1058 25
Soil type7.45620.1889 25
Climate0.60960.435 25
Water management0.00480.9448 23
Note: QM for heterogeneity of estimated moderator; PQM for significance test of QM; *** indicates statistical significance levels at 0.001 for QM; k for number of samples.
Table 3. Factors affecting CO2 emissions from paddy soils under biochar incorporation.
Environmental Factor TypesQMPQMk
Biochar amount1.82790.176417
Raw material5.3790.067915
Soil type4.01610.259717
Climate3.9970.045617
Water management3.24220.071813
Note: QM for heterogeneity of estimated moderator; PQM for significance test of QM; k for number of samples.
Table 4. Factors affecting CH4 emissions from paddy soils under biochar incorporation scenario.
Environmental Factor TypesQMPQMk
Biochar amount0.12710.281731
Raw material1.36560.505231
Soil type7.38510.286731
Climate3.18520.074331
Water management0.36980.543125
N18.00880.021231
P12.36970.135531
K12.79070.077431
Note: QM for heterogeneity of estimated moderator; PQM for significance test of QM; k for number of samples.
Table 5. Factors affecting N2O emissions from paddy soils under biochar incorporation.
Environmental Factor TypesQMPQMk
Biochar amount0.48010.488431
Raw material5.07670.07931
Climate0.1150.734631
Water management0.85170.356125
N2.30910.889231
P33.027< 0.000131
K31.1186< 0.000131
Note: QM for heterogeneity of estimated moderator; PQM for significance test of QM; k for number of samples.
Table 6. Environmental correction factors.
Items Environmental Factor TypesEnvironmental FactorsCorrection Coefficients
YieldWater management Intermittent0.98
ClimateSubtropical monsoon 1.02
Temperate continental monsoon 1
Soil typeGleyic Stagnic Anthrosols1
Gleyic Luvisols1
Hydragric Anthrosols1.02
Chloridic Solonchaks1.18
Stagnic Anthrosols0.98
Biochar temperature (°C)300~3501.03
4501.01
5001.01
6001.09
CO2Climate Temperate continental monsoon1.09
CH4N (kg ha−1)2001
2100.42
2501
2701
2731
292.81
3001
4561
N2OSoil typeGleyic Stagnic Anthrosols1
Gleyic Luvisols1
Hydragric Anthrosols1
Chloridic Solonchaks1
Stagnic Anthrosols1
P (kg ha−1)601
901
1200.6
1251
2041
8751
K (kg ha−1)63.52.96
1204.33
1251
2021
2042.26
Publisher’s Note: MDPI stays neutral with regard to jurisdictional claims in published maps and institutional affiliations.

