Article

Impacts of Climate Change on the Mean and Variance of Indica and Japonica Rice Yield in China

1
Rural Development Institute, Chinese Academy of Social Sciences, No. 5 Jianguomennei Street, Beijing 100732, China
2
China Center for Agricultural Policy, School of Advanced Agricultural Sciences, Peking University, No. 5 Yiheyuan Road, Haidian District, Beijing 100871, China
3
Hebei Coordinated Innovation Center for BTH Coordinated Development, Hebei University of Economics and Business, Shijiazhuang 050061, China
*
Author to whom correspondence should be addressed.
Agronomy 2022, 12(12), 3062; https://doi.org/10.3390/agronomy12123062
Submission received: 20 October 2022 / Revised: 28 November 2022 / Accepted: 30 November 2022 / Published: 3 December 2022
(This article belongs to the Special Issue Strategic Analysis of Sustainable Agriculture and Future Foods)

Abstract

:
The overall goal of this study was to examine the impacts of climate change on the mean and variance of rice yields in China by using historical climate and crop data. An econometric model was established to estimate Just–Pope stochastic production functions and identify the potential impacts of climate change on the mean and variance of rice yields by type, keeping other factors constant. Based on the estimated production functions, the contribution rate of climatic factors to rice yield was then assessed by conducting the growth accounting of yields over the past 30 years. The results showed that both the mean rice yield and the yield variability were influenced by changes in the mean climate conditions and climatic variance. In the future, the impacts of climate change on rice yields will depend on local regions’ present climatic conditions. The results have implications for improving the adaptation capacity of rice production.

1. Introduction

Rice plays an important role in China’s food security and agricultural production. Rice accounts for 9% of global crop production, and China produces more than 25% of the world’s output of rice [1]. Rice is always one of the most important food crop in China, irrespective of the cultivated area or the total output. During the period 1978–2021, the average planting area of rice in China was about 30.98 million hm2, accounting for 27.63% of the sown area of grain crops. Meanwhile, the average total output of rice in China was 0.19 billion tons, accounting for 37.67% of the total grain production in China (data source: National Bureau of Statistics of China, https://data.stats.gov.cn/easyquery.htm?cn=C01, accessed on 10 October 2022). Rice is not only the most important food crop in China and the world, but also plays an important role in the global carbon cycle [2].
However, a decrease in the proportion of rice’s sown area has been observed over the past 14 years in China, from 27.33% in 2007 to 25.44% in 2021. The sown area of corn began to surpass that of rice in 2007, and rice’s sown area dropped to the second largest among crops in China. The total rice output also moved to second place in 2012. The sustainable increase in total rice production is challenged by several trends and constrained by many factors in China [3,4]. Rice production is facing challenges from declining arable land, increasing water scarcity, global climate change, labor shortages, increasing consumer demand for high-quality rice, and other factors that limit the capacity of farmers to grow this crop [3,4,5,6,7,8,9].
The impact of climate change on major crops such as corn, wheat, and rice has received increasing attention [10,11]. Extensive studies have used crop models and several climate change scenarios to simulate the impact of climate change on rice production [5,12,13,14,15,16,17,18]. The conclusions are inconsistent due to differences in crops, regions, RCPs, timeframes, adaptation, and CO2 fertilization effects [11]. Climate change has caused regionally different—but mostly negative—impacts on rice yields [9,19,20,21,22,23,24,25,26]. Globally, warming trends from 1961 to 2017 had a negative effect of 4.2% on rice yield [9]. Even considering CO2 fertilization effects, an overall median per-decade effect of −0.7% for rice yields was projected without adaptation in the 21st century [21]. A 1.8% loss in rice yield has been reported due to global changes in precipitation between 1981 and 2010 [22]. The overall drought-driven loss of rice yield is projected to increase by 18.1% to 19.4% in the period of 2071–2100, relative to 1961–2016 (RCP8.5) [23]. Regionally, negative effects of climate change have been identified for rice in North Africa, sub-Saharan Africa, Western Asia, South Asia, Southeast Asia, and North America, while the effects are positive in Australia and New Zealand [21]. New research findings affirm that the impacts of climate change will continue to significantly affect rice production, mainly in a negative direction, in particular areas all over Asia [24].
The results on the effects of climate change on rice yields in China are quite mixed, being dependent on regional scale, analysis approaches, the time period, the assumption of the CO2 fertilization effect, the climate change scenarios, and whether considering adaptation and socioeconomic scenarios [17,18,19,27,28]. Based on the data of 30 Chinese provinces spanning 1998–2017, it was found that rice cultivation will decline by 0.66% if the mean temperature increases by 1% in the long term, but the average temperature in the short term is conducive to China’s rice production [18]. Rice yields will decrease by 5–25% after the 2060s due to climate change [27], but the average yields of both early rice and late rice will increase during the 2050s and 2070s compared to the 2000s [19]. Using data between 1980 and 2010 in Northeast China, a study has provided evidence that a 1% increase in the rice’s accumulated temperature significantly increases rice production by approximately 0.728% [28]. Most researchers believe that increased rainfall is beneficial to rice production in China. For example, a recent study found that in the long term, a 10% rise in mean rainfall would increase rice cultivation by 0.46% in China [18].
Despite the wide variety of findings that have arisen regarding the effects of climate change on crop yields [9,10,17,29,30], there are many limitations to the previous studies. Firstly, a majority of climate impact studies concern changes in the means of climate variables, while fewer studies consider climate variability and extreme events [30]. Second, previous studies have analyzed the effects of changes in climatic variables on the mean crop yields, while the impacts of climate change on fluctuations in crop yields have been studied to a much lesser extent [29,30,31]. Thirdly, existing studies on the impacts of climate change on crop yields focus on crop modeling or statistical analysis based on historical data [17,29,31]. One of the major shortcomings of these two methodologies is that factors other than climate—such as technological progress and production inputs—are not controlled [29]. Fourthly, there is much uncertainty in simulating the impacts of future climate change on crop yields based on coarse-resolution climate change scenarios from global climate models (GCMs) or scenarios assuming fixed increases in mean temperature or precipitation [13,32,33]. Fifthly, there are relatively few direct assessments of the impact of observed climate on past crop yields and growth employing econometric models to control for both the traditional factors and climate change—especially with respect to studies in China. Furthermore, the existing studies on rice in China are based on data aggregated over different types of rice; thus, little is known about the effects of climate change among varieties of rice. However, there are two main rice varieties according to the geographic distribution of rice production in China: indica rice and japonica rice. Indica rice can be further divided into early rice, middle rice, and late rice. Due to differences in growing regions, growing seasons, and variety characteristics, the effects of climate change on rice yields might vary between different types. Few researchers have analyzed the differences in responses to climate change between early and late rice [7,19], and there is no literature concerning the impacts of climate change on japonica and indica rice in China.
In order to address the limitations of existing studies, a great deal of interest exists in answering the following questions: What is the historical evidence on the impacts of climate change on rice yields in China after controlling for the influence of other factors? Specifically, what are the impacts of climate change (mean and variability) on the mean and the variance of indica (early, middle, and late rice) and japonica rice? The overall goal of this study was to examine the impacts of climate change and its variation on both the mean and the variance of rice yields in China. To achieve this goal, we set the following three specific objectives: The first was to gain a better understanding of the changes in climate over the past several decades in China and in the sample areas, as well as the changes in rice yields over the past 30 years. The second objective was to conduct an econometric analysis to identify the impacts of climate change and its variation on the mean and the variance of rice yields in China. The third objective was to quantify the contribution of climate change and its variation to the growth of rice yields in China. The final objective was to predict the possible effects of climate change on rice yields among different regions and different types in the future.
Given the limited empirical studies on the effects of climate change on rice yields, this study contributes to the literature in several ways: First, an econometric model is developed to determine the impacts of climatic variables on rice yields, so as well as climate variability, technological progress and production inputs are controlled in the empirical analysis. Second, in addition to the changes in the means of climate variables, the climate variability is also considered in this study. Third, this study not only examines the impacts of climatic factors on mean rice yields, but also investigates how climate factors affect the variability of rice yields. Finally, indica rice and japonica rice are separately analyzed to explore the different effects of climate change between various rice types.
The rest of this paper is organized as follows: In the next section, we briefly introduce the data used in this study and describe the changes in climate (i.e., temperature and precipitation) and rice yields in the sample area. Section 3 introduces the research methodology and the specification of the econometric models. Section 4 presents the econometric results on the impacts of climate change and its variability on rice yields, further discusses the contribution rates of climate and other factors to changes in rice yields, and predicts the future effects of climate change on rice yields in different regions and rice varieties. The final section concludes the paper.

2. Data and Description

2.1. Socioeconomic Data

The input and output data for rice production used in this study were obtained from the Farm Production Costs and Returns Survey (FPCRS). The FPCRS was initially designed by the State Planning Commission to collect information on costs and returns in farming, which was then used to set state procurement prices [34]. It is carried out annually by the State Planning Commission in conjunction with several other government institutions. The survey was interrupted several times during the 1960s and 1970s.
The basic sampling unit in the FPCRS for the pre-reform period was a production team, and at present it is a farm household [34]. The survey also covers some state farms in Northern China. In principle, the FPCRS uses a multistage sampling procedure. For a particular crop, major producing regions are first identified. Each of these regions is then divided into superior, average, and poor subregions in terms of production conditions and yields. Finally, sampling units are selected from these subregions. Sometimes, sample selection is based on the subjective judgment of the local implementing agencies. The selected units (households, production teams, or state farms) are required to keep records on the relevant information sought by the State Planning Commission. The information is then collected by local officials for processing and summary. Processed data are submitted to the State Planning Commission and other responsible state institutions via provincial agencies.
The survey data, available to the authors, only provide national and provincial averages on a per mu basis. We converted mu into hectares in this study. Rice yields are actual outputs from the sample plots (kg/ha), and production costs are classified as labor costs and material costs [34]. The latter consist of expenses on manufactured inputs and hired services, imputed values for non-traded inputs, and self-supplied services such as animal power and overheads [34]. In order to simplify the analysis, the value of fertilizer input (CNY/ha) and the value of other inputs (CNY/ha)—such as seeds, pesticides, plastic film, machinery, irrigation, livestock services, fuel, technology services, tools, maintenance, and repair—were selected to represent material costs. Although labor input is valued by wage rates that determined annually by the State Planning Commission with reference to rural living standards, the working days per hectare—including own workdays and rent-in labor workdays—were directly used in this study. Since land is contracted to households without direct charges, land rent does not appear in production cost accounting [34].
The input–output data for rice that were used in this paper cover the period from 1980 to 2010. The FPCRS panel data are not balanced, as some sample provinces did not conduct the survey in all years. While the FPCRS dataset is not flawless, it is the only dataset that possesses nationwide coverage and provides exact correspondence between inputs and outputs of individual crops [34].
In this study, rice is classified into indica rice and japonica rice, and indica rice is further divided into early rice, middle rice, and late rice according to the maturity time. Nine provinces—Zhejiang, Anhui, Fujian, Jiangxi, Hubei, Hunan, Guangdong, Guangxi, and Hainan—were selected as the study area of early rice. According to the statistics published on the website of the Ministry of Agriculture of China, these are among the main agricultural production regions in China, accounting for 99% of the total sown area and output of early rice in 2010. For middle rice, 10 main provinces were included: Jiangsu, Anhui, Fujian, Henan, Hubei, Hunan, Sichuan, Guizhou, Yunnan, and Shaanxi. These provinces accounted for about 64% of total production of middle rice in terms of both sown area and output in 2010. The study area of late rice was the same as that of early rice, contributing more than 99% of late rice production in 2010. The study area of japonica rice only included three main provinces in the northeast of China: Liaoning, Jilin, and Heilongjiang.

2.2. Climate Data

The basic climate data used in this study were obtained from the website of the National Meteorological Information Center in China (NMIC) (source: http://data.cma.cn/, accessed on 20 October 2022). Temperature and precipitation data were collected for each month from 1980 to 2010 at 753 national meteorological stations located throughout China [35]. In order to obtain the province-level climate variables used in this study, the average of meteorological stations located in each province was calculated.
The monthly average temperature and total precipitation over the rice-growing season at the province level were used in this study. Moreover, the standard deviation of monthly mean temperature and monthly precipitation over the rice-growing season were included. The definition of the rice-growing season varies between provinces and types, as presented in Table 1. Generally, the growing season for early rice is from February to July or from March to August. The growing season for middle rice predominantly starts in April and ends in September. Late rice is planted mainly in June and harvested in October or November. The growing season of japonica rice in this study is from April or May to September.

2.3. Climate and Rice Yield at the Sample Sites

Although the rate of warming is sensitive to the beginning and end dates, the annual mean temperature has displayed a clear warming trend in China over the past 60 years. During the period of 1951–2010, the annual mean temperature across China rose from 12.5 °C to 13.1 °C, with the largest increases after 1980 (Figure 1a). It has also been observed that the warming slowed down after reaching a peak value of 13.8 °C in 2007. Therefore, the annual mean temperature in China exhibits an obvious increasing trend, with fluctuations in several years. Unlike the pattern in annual mean temperature, the change in annual total precipitation does not show a clear trend, in addition to large fluctuations from year to year between 1951 and 2010 (Figure 1b).
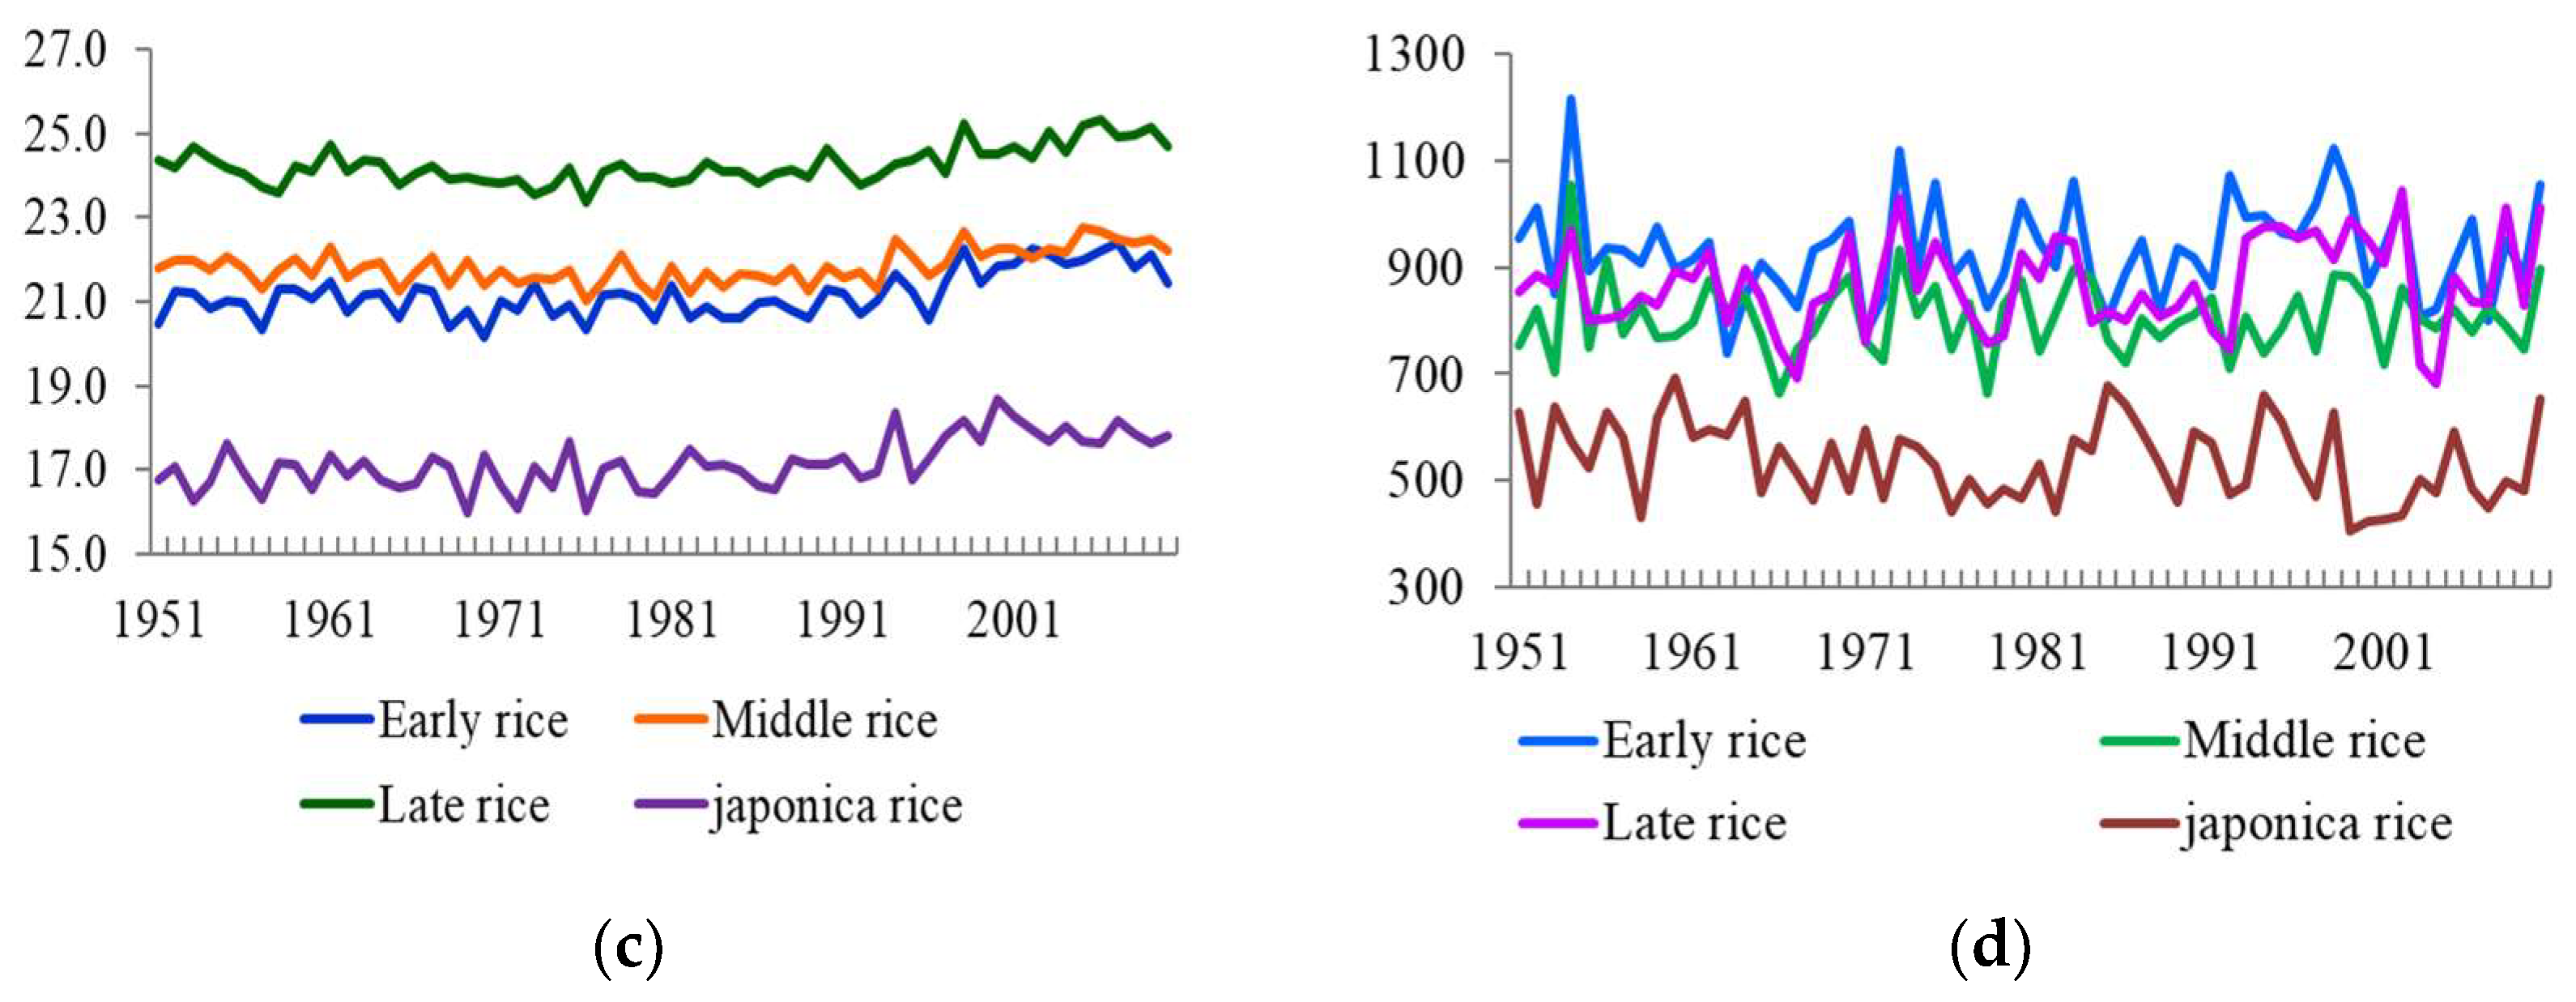
Similar to the changes in temperature at the national level, the annual mean temperature over the rice-growing season in the study area increased from 1951 to 2010—especially after 1980 (Figure 1c). The annual mean temperature rose from 20.5 °C to 21.5 °C in the early rice production sample area from 1951 to 2010, with a slightly higher rate of increase than at the national level. During the same period, the annual mean temperature increased from 21.8 °C to 22.2 °C and from 24.4 °C to 24.7 °C in the middle rice area and late rice area, respectively (Figure 1c). The japonica rice area also experienced a warming trend, with a rise from 16.8 °C to 17.8 °C (Figure 1c). Obviously, the rate of warming after 1980 was higher than that before 1980. Unlike the changes in temperature, the annual total precipitation over the rice-growing season in the study area did not show any clear trend, with dramatic fluctuations from year to year over the past 60 years (Figure 1d).
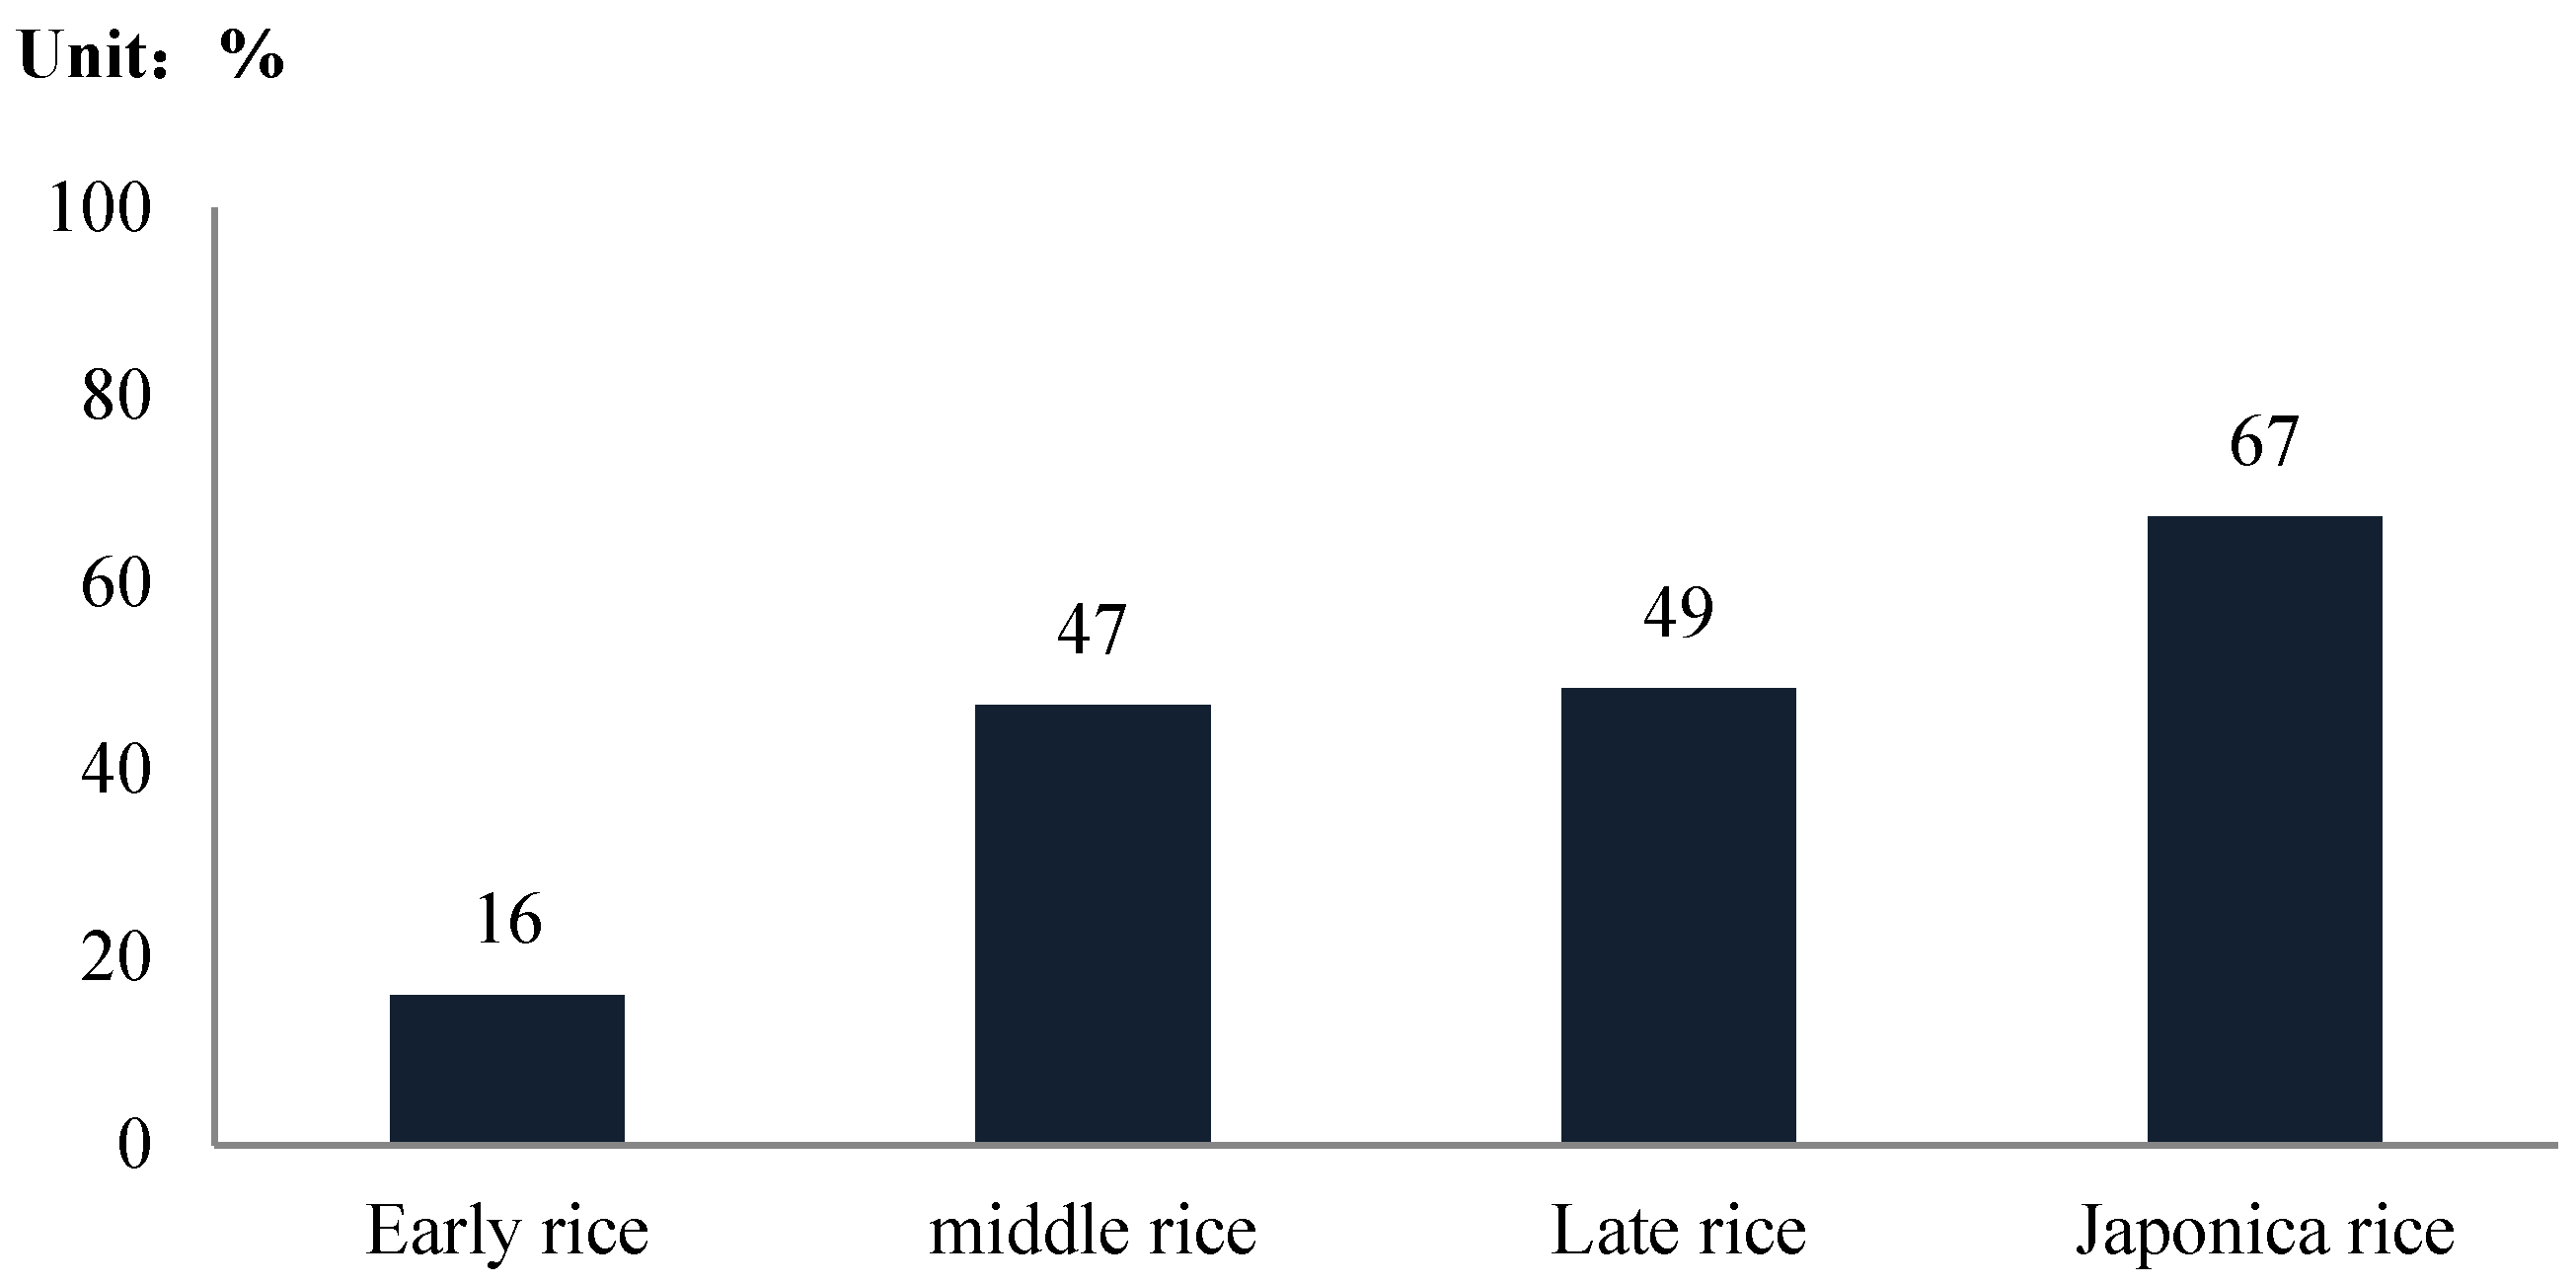
Over the past 30 years, rice yields have shown a significant increase. Figure 2 highlights the increase in indica and japonica rice yields throughout the sample areas for the period from 1980 to 2010. The early rice yield increased by 16% (from 5185 kg/ha to 6015 kg/ha) from 1980 to 2010. It can be seen that the middle rice yield increased by 47% (from 5072 kg/ha to 7450 kg/ha) in the same period. For late rice yields, an increase of 49 percent (from 4091 kg/ha to 6082 kg/ha) can be found in the past 30 years. Compared with indica rice, the yield of japonica rice has increased more, reaching to 78% in the sample area.

3. Research Methodology and Specification of Econometric Model

3.1. Research Methodology

Many methodologies and tools—such as mathematical modeling, statistical analysis, and scenario analysis—have been applied for assessing the impacts of climate change on agriculture [7,18,27,29,36,37,38,39,40,41,42,43,44,45,46,47,48,49,50,51]. However, crop modeling and statistical analysis cannot control factors other than climate, such as technological progress and production inputs. In order to determine the impacts of climatic and socioeconomic variables on both the mean and the variance of rice yield, the Just–Pope stochastic production function was used in this study. The general form of the Just–Pope production function is as follows [31,41,42]:
y     =     f ( X , β )   +   μ   =   f ( X , β )   +   h ( X , α ) 0.5 ε
where y is the crop yield, X is a vector of explanatory variables, and f ( X , β ) is the mean function (or deterministic component of production) relating X to the average yield, with β as the associated vector of estimated parameters; µ is a heteroscedastic disturbance term with a mean of zero [42]; h ( X , α ) is the variance function (or stochastic component of output) that relates X to the standard deviation of yield, with α as the corresponding vector of estimated parameters, and ε is a random error with zero mean and variance σ 2 . In this production function, the expected crop yield ( E ( y ) ) is f ( X , β ) ; thus, estimation of f ( X , β ) gives the effects of the independent variables on the mean crop yields. The variance of the crop yields ( V ( y ) ) is given by h ( X , α ) σ 2 ; therefore, estimation of h ( X , α ) gives the effects of the independent variables on the variance of crop yields [31,42].
The Just–Pope production function in Equation (1) can be estimated using maximum likelihood estimation (MLE) or a three-step estimation procedure involving feasible generalized least squares (FGLS) [42]. The FGLS method has been applied in a majority of the literature, but MLE is more consistent and efficient than FLGS estimation in the case of small samples [31,42,43]. In this study, the MLE approach was used to estimate the Just–Pope production function. As described in [31,43], the following log-likelihood function was applied in this study:
L n L   =       1 2 [ N     ln ( 2 π )   +   i   =   1 N ( y i t     f ( X i t , β ) ) 2 exp ( α X i t )   +   i   =   1 N α X i t ]
where N is the number of observations. The maximization of Equation (2) provides the maximum likelihood parameters of β and α .

3.2. Model Specification

To estimate the effects of climate variables on the mean yield and yield variability under heteroscedastic disturbances, the analytical challenge is to separate the non-climate effects on crop yields from the climate change effect. We hypothesized the crop yield as a function of crop inputs, technology, and climate factors, and set up the functional form as shown in Equation (3):
log ( y i t )   =   α 0   +   α 1 tem i t   +   α 2 tem i t 2   +   α 3 pre i t   +   α 4 pre i t 2   +   α 5 std _ tem i t   +   α 6 std _ pre i t   +   k   =   1 3 β k log ( input k i t )   +   ϕ T i   +   γ R i   +   ε i t
where y i t refers to the rice yield or yield variation (kg/ha) for province i at time t ( t = 1980,1981, …, 2010). The key explanatory variables of interest are the six climate variables on the right of Equation (3). The first two variables are the mean temperature ( tem i t ) and total precipitation ( pre i t ) in province i over the rice-growing season in year t . In order to capture concave relationships between rice yields and temperature and precipitation, as in many previous studies [44], the quadratic terms of mean temperature ( tem i t 2 ) and total precipitation ( pre i t 2 ) are included in Equation (3). Similar to some existing studies [29,45,46,47,48], two climate variables were included in the model to capture the variance of climate: the standard variation of monthly mean temperature during the rice-growing season ( std _ tem i t ), and the standard variation of monthly total precipitation during the rice-growing season ( std _ pre i t ). It is believed that climate change not only changes the mean climate conditions, but also affects climatic variability, and the greater the variance, the wider the dispersion of actual weather outcomes [45,47].
In addition to climate variables, production input variables ( input k i t ) are included in Equation (3), including fertilizer, labor, and other inputs (such as seeds, pesticides, plastic film, machinery, irrigation, livestock services, fuel, technology services, tools, maintenance and repair, etc.). In this study, the labor input was measured in terms of working days per hectare, including own workdays used and rent-in labor workdays. Fertilizer and other inputs are represented by real expenses per hectare of sown rice area. In this estimation, as in many other studies [30], T i is a year variable as a proxy for crop production technology, such as the development of new varieties and management practices. R i denotes provincial dummy variables and captures the effects of any province-specific factors that do not change over time. α 0     α 6 , β , ϕ , and γ are parameters to be estimated. εit is the error term that captures the uncertainty faced by farmers and satisfies E ( ε ) = 0. In order to identify the differences between early rice, middle rice, late rice, and japonica rice, we ran the models separately.

4. Estimation Results and Discussion

Table 2 and Table 3 present the estimation results of Equation (3). The basic descriptive statistics are presented in Table A1, Table A2, Table A3 and Table A4. Most of the estimated coefficients are statistically significant, with the expected signs in both the mean rice yield function and the rice yield variance function. In addition, the impacts of climate factors on the mean and variance of indica and japonica rice yields are summarized in Table 4 and Table 5, respectively.

4.1. Estimation Results

The sign and significance of the estimated coefficients for the temperature differ between rice types in both the mean yield and variance functions. The coefficient of temperature term is not significant in the mean yield function of early rice, but the quadratic term of temperature is negative and statistically significant (Table 2, column 1). The temperature does not have a significant effect on the variance of early rice (Table 3, column 1). These results imply that the rise in temperature will harm the mean yield of early rice in the study sites. This is consistent with the results of a previous study, which revealed that the observed warming trends significantly reduced rice yield by 3.7% for each 1 °C increase in growing-season temperature in Anhui Province, Eastern China, during the last two decades of the 20th century [7].
The estimated results for middle rice reveal a U-shaped relationship between temperature and mean yield (Table 2, column 2), as well as an inverted U-shaped relationship between temperature and yield variance (Table 3, column 2). The corresponding results for late rice show that the temperature has a U-shaped relationship with both the mean yield and the variance of late rice (Table 2 and Table 3, column 3). The nonlinear relationship between rice yield and temperature suggests heterogeneity in the effects of temperature. This is supported by relevant study [50], which found that negative responses of rice yield to temperature were concentrated in most provinces of Northern and Northwestern China, while positive responses were concentrated in Northeastern and Southern China.
Unlike the three types of indica rice, our estimated results show that there is an inverted U-shaped relationship between temperature and the mean yield of japonica rice (Table 2, column 4), but the temperature has no significant effect on the yield variance of japonica rice (Table 3, column 4). These results suggest that increases in temperatures do not always reduce rice yields [49]. As mentioned in Section 2.1, japonica rice is mainly planted in three provinces (Liaoning, Jilin, and Heilongjiang) in Northeast China. Positive correlations between rice yield and temperature were also obtained in previous studies concerning these provinces [32,50]. However, these studies did not account for the nonlinear effects of temperature on rice yield.
The precipitation has no significant effect on the mean yield of all kinds of rice, but it significantly influences the variance of yield. The estimation results of mean yield functions for indica and japonica rice show that the coefficients of both the precipitation term and the quadratic term of precipitation are not significant (Table 2). Similar results have been reported in another study using historical climate and crop data in China, where rice yield was not significantly correlated with precipitation in 20 of the 24 provinces [49].
However, the precipitation has a significant impact on the variance of yield for all rice varieties (Table 3). For example, the estimated coefficient on the quadratic term of the precipitation is positive and statistically significant (Table 3, column 1), implying that the increases in the precipitation will bring larger variability in early rice yields. For middle rice, an inverted U-shaped relationship exists between the precipitation and yield variance (column 2). Conversely, estimation results show that precipitation has a U-shaped relationship with the yield variance of late indica rice and japonica rice (columns 3 and 4). These findings are similar to those of previous studies for other countries [29] and provide further basis for the concerns that yield variability is likely to increase with a rise in the average temperature and total precipitation.
The effects of the standard deviation of temperature and precipitation on mean yield and yield variance also differ by rice type. The estimated coefficients on the standard deviation of temperature and precipitation are negative and statistically significant for the mean yield function of early rice (Table 2, column 1), but they are not significant for the yield variance function (Table 3, column 1). These results indicate that more variations in temperature and precipitation reduce the mean yield of early rice. This finding is consistent with results found in other literature, suggesting that increases in the variance of temperature and precipitation would be harmful to crop yield [7,29,45,47]. For example, based on data from agricultural experimental stations across China for the period 1981–2000, Tao et al. indicated that obvious variation in precipitation reduced early rice yields sharply [7].
However, both the mean and variance of middle rice yields are not influenced by the standard deviation of temperature and precipitation over the growing season. The effect of the standard deviation of temperature on the mean yield of late rice is negative and statistically significant, but the effect of the standard deviation of precipitation is positively significant (Table 2, column 3). The estimation results show that the mean yield of japonica rice is negatively influenced by the standard deviation of temperature, while it is not significantly affected by the standard deviation of precipitation (Table 2, column 4). These results indicate that temperature variance also increases the yield risks of late rice and japonica rice in China. In addition, the yield variance of japonica rice is positively correlated with the standard deviation of precipitation (Table 3, column 4), implying that higher volatility in precipitation increases the yield variability of japonica rice. Similar results were obtained by studies in India, Canada, and the United States, where increases in the variance of key climate variables—specifically, precipitation and temperature—increased the variability in crop yields [29,37,47].
In addition to climatic factors, the mean and variance of rice yields are correlated with production inputs and technological progress (Table 2 and Table 3). Considering the effects of production inputs on the mean and variability of rice yields, we found that higher fertilizer inputs increase the mean yield of indica rice, while they decrease the variation of late rice yields. The positive relationship between fertilizer inputs and mean trends of crop yields is consistent with the findings of other studies. [45,51]. The increase in labor inputs is likely to increase the mean yield of middle rice and decrease the variance of late rice yields. Higher inputs of other materials positively affect the mean yield of japonica rice and reduce the variation in japonica rice yields. Similar results have been found in other studies [45,51]. In addition, our estimation results reveal that the coefficient of the year variable is positive and statistically significant in the mean yield functions of indica rice (Table 2), implying that the technological progress contributes to the mean yield. This result is consistent with the findings of many previous studies [29,51]. However, the effect of the year variable on the mean yield of japonica rice is positive but not statistically significant. There exists a negative relationship between technological progress and the variance of indica rice yield, implying that increases in time decrease the variance of indica rice yields.

4.2. Contribution of Climate Factors to the Growth of Rice Yield

To assess the contribution of climatic factors to rice yield, the growth accounting of yield was conducted based on the estimates of the production function parameters. With reference to a previous study [51], the accounting for rice yield growth includes four steps: The first step is to evaluate the elasticity of the explanatory variables based on the estimated coefficients. The second step is to calculate the changes in yield and each explanatory variable that refers to percentage growth during the period of 1980 to 2010. In order to avoid the effects of atypical years, the average value for 1980–1982 was calculated to represent the level in 1980, and the average value for 2008–2010 was calculated to represent the level in 2010.The third step is to calculate the contribution to yield growth by multiplying the elasticity and the change rate of each climate variable. The last step is to calculate the percentage shares of contribution to total rice yield growth, with total yield growth set to 100.
Table 6 reports the results of the contribution rates for various types of rice. The results show that rising temperatures account for 27.05% of the decline in early rice yields—far larger than their negative contribution to the yield growth of middle rice (16.21%) and late rice (0.66%). However, the yield growth of japonica rice benefits slightly from rising temperatures. The precipitation has a positive contribution of 2.92% to early rice yield, while it has negative contributions of 0.01%, 2.49%, and 1.73% to the yields of middle rice, late rice, and japonica rice, respectively. The standard deviation of temperature and the standard deviation of precipitation have non-uniform contribution to yield growth across rice types. For example, the standard deviation of temperature has a positive contribution to both early rice yields and japonica rice yields, while it has a negative contribution to the yields of middle rice and late rice. In addition, it appears that physical inputs have the largest contribution to the yield growth of early rice (46.32%) and japonica rice (46%). More than 70% of yield growth comes from technical progress for early rice and middle rice—far larger than that for late rice and japonica rice.
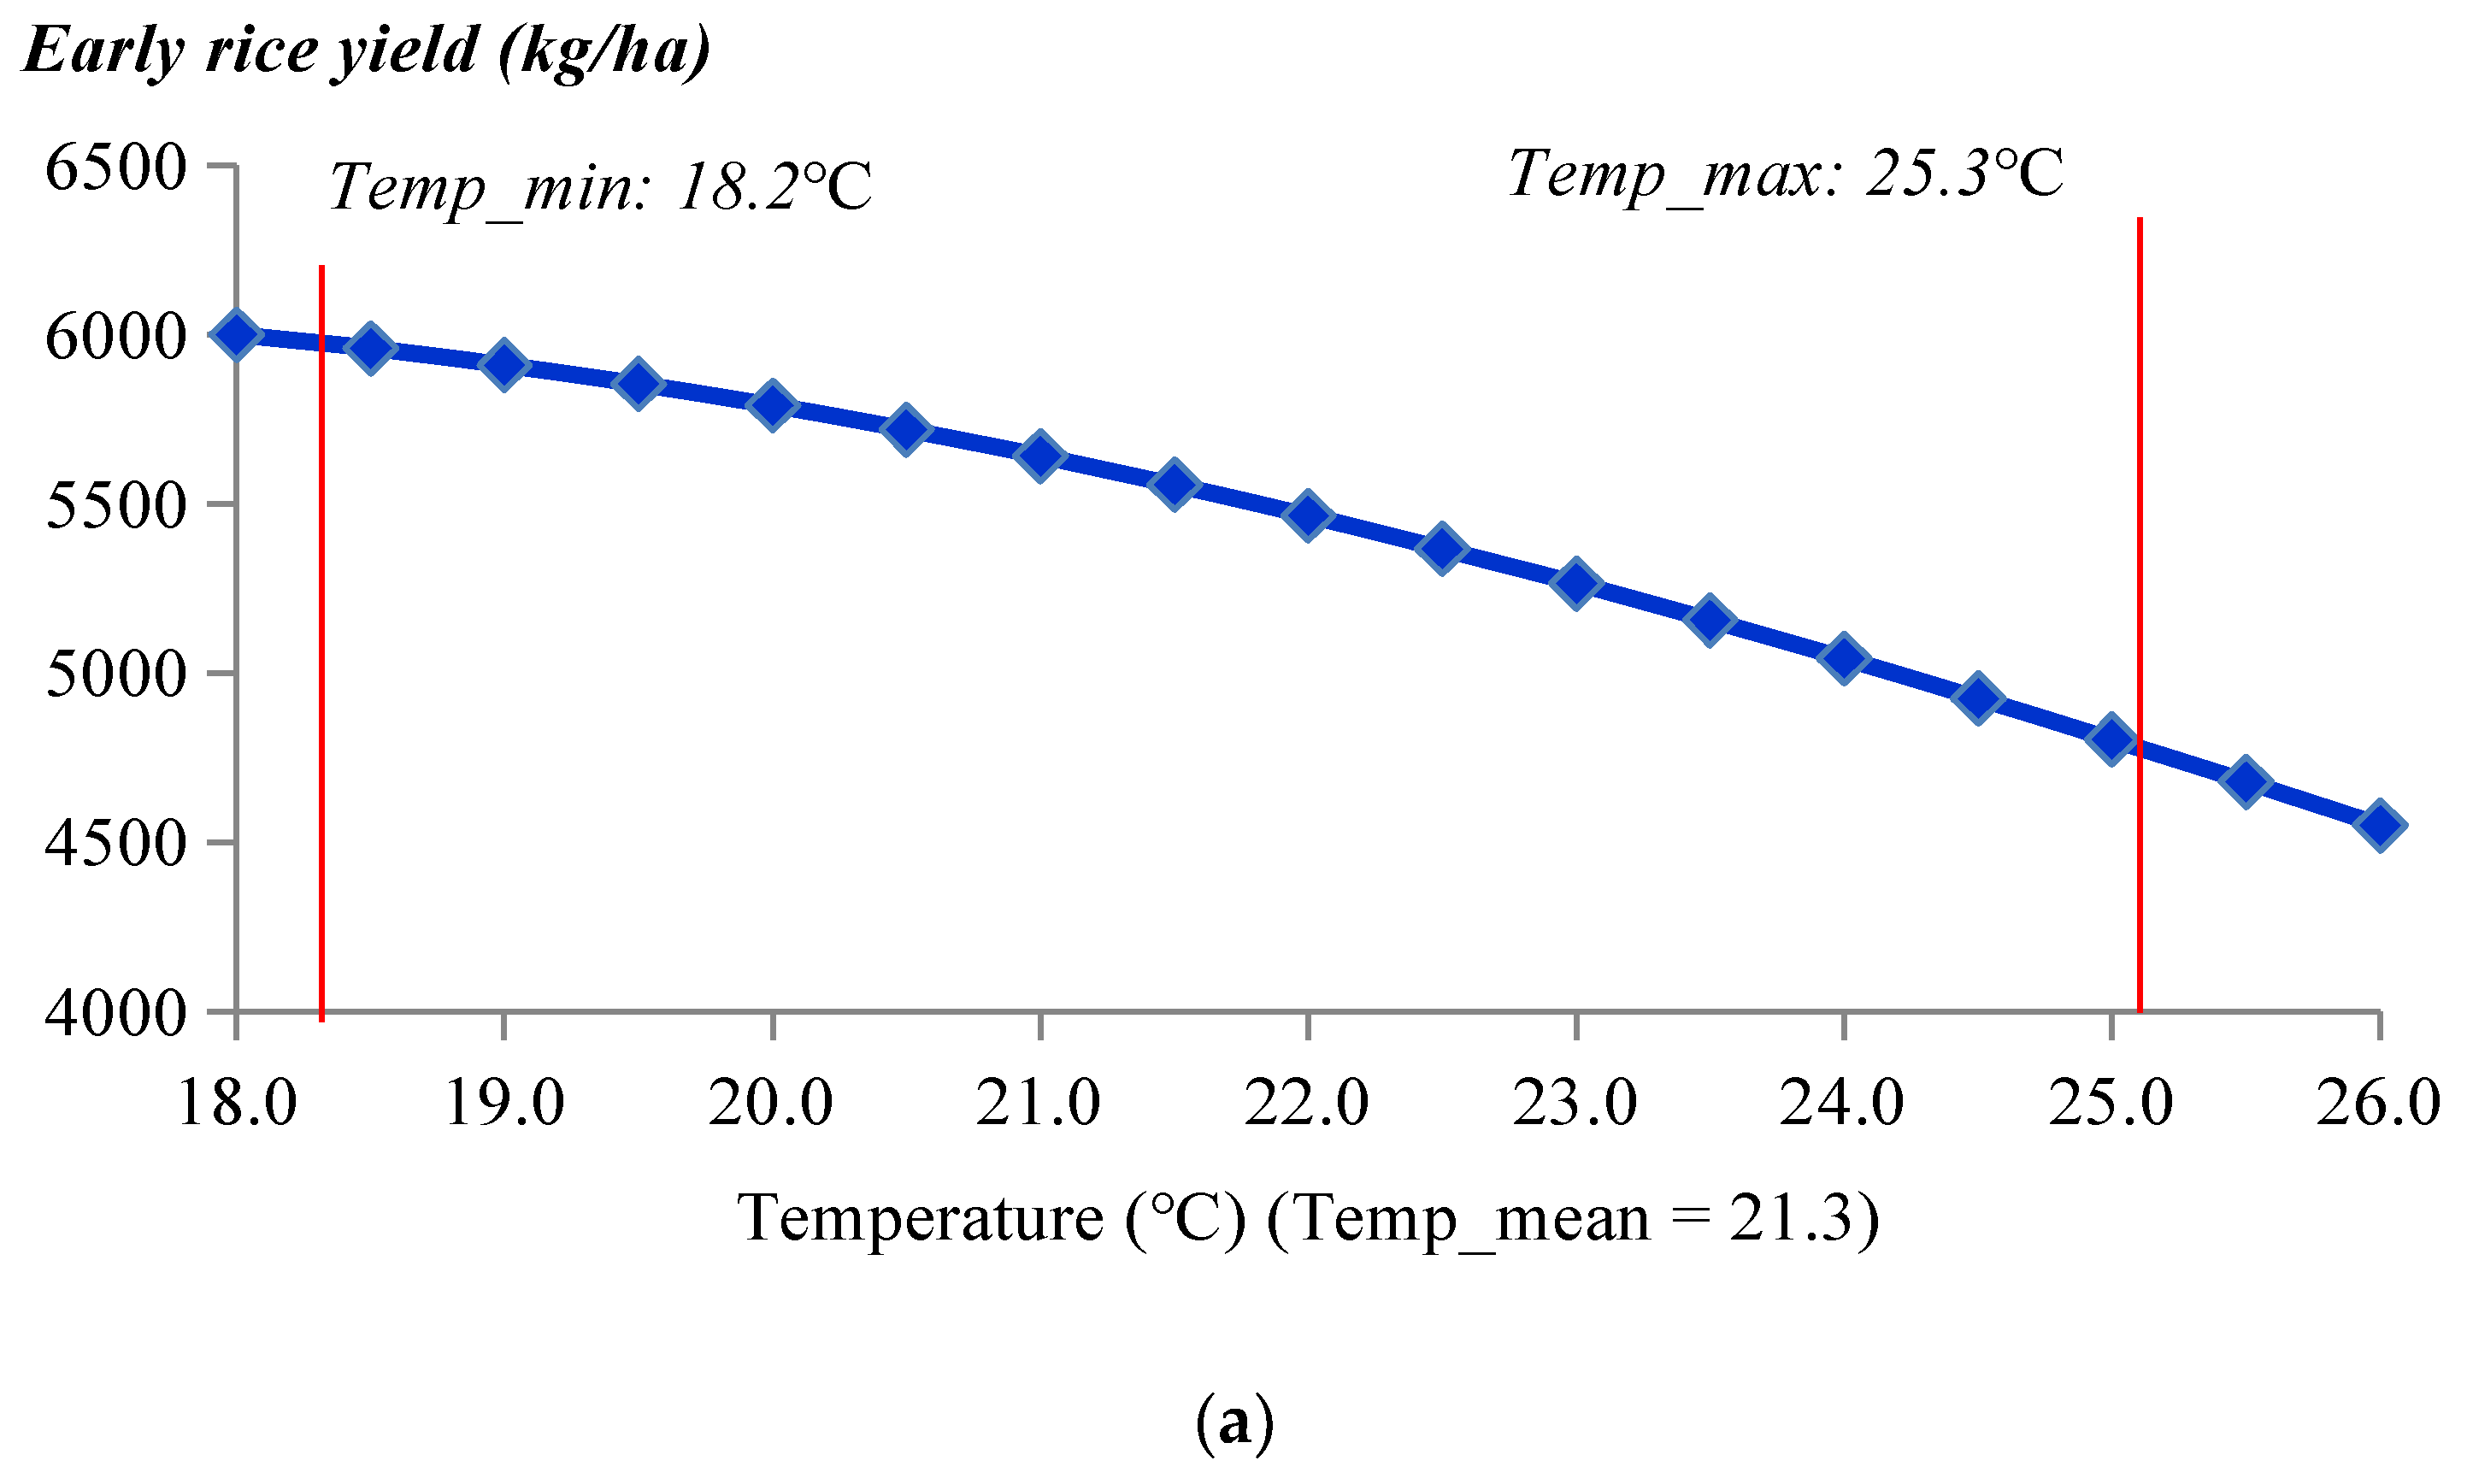
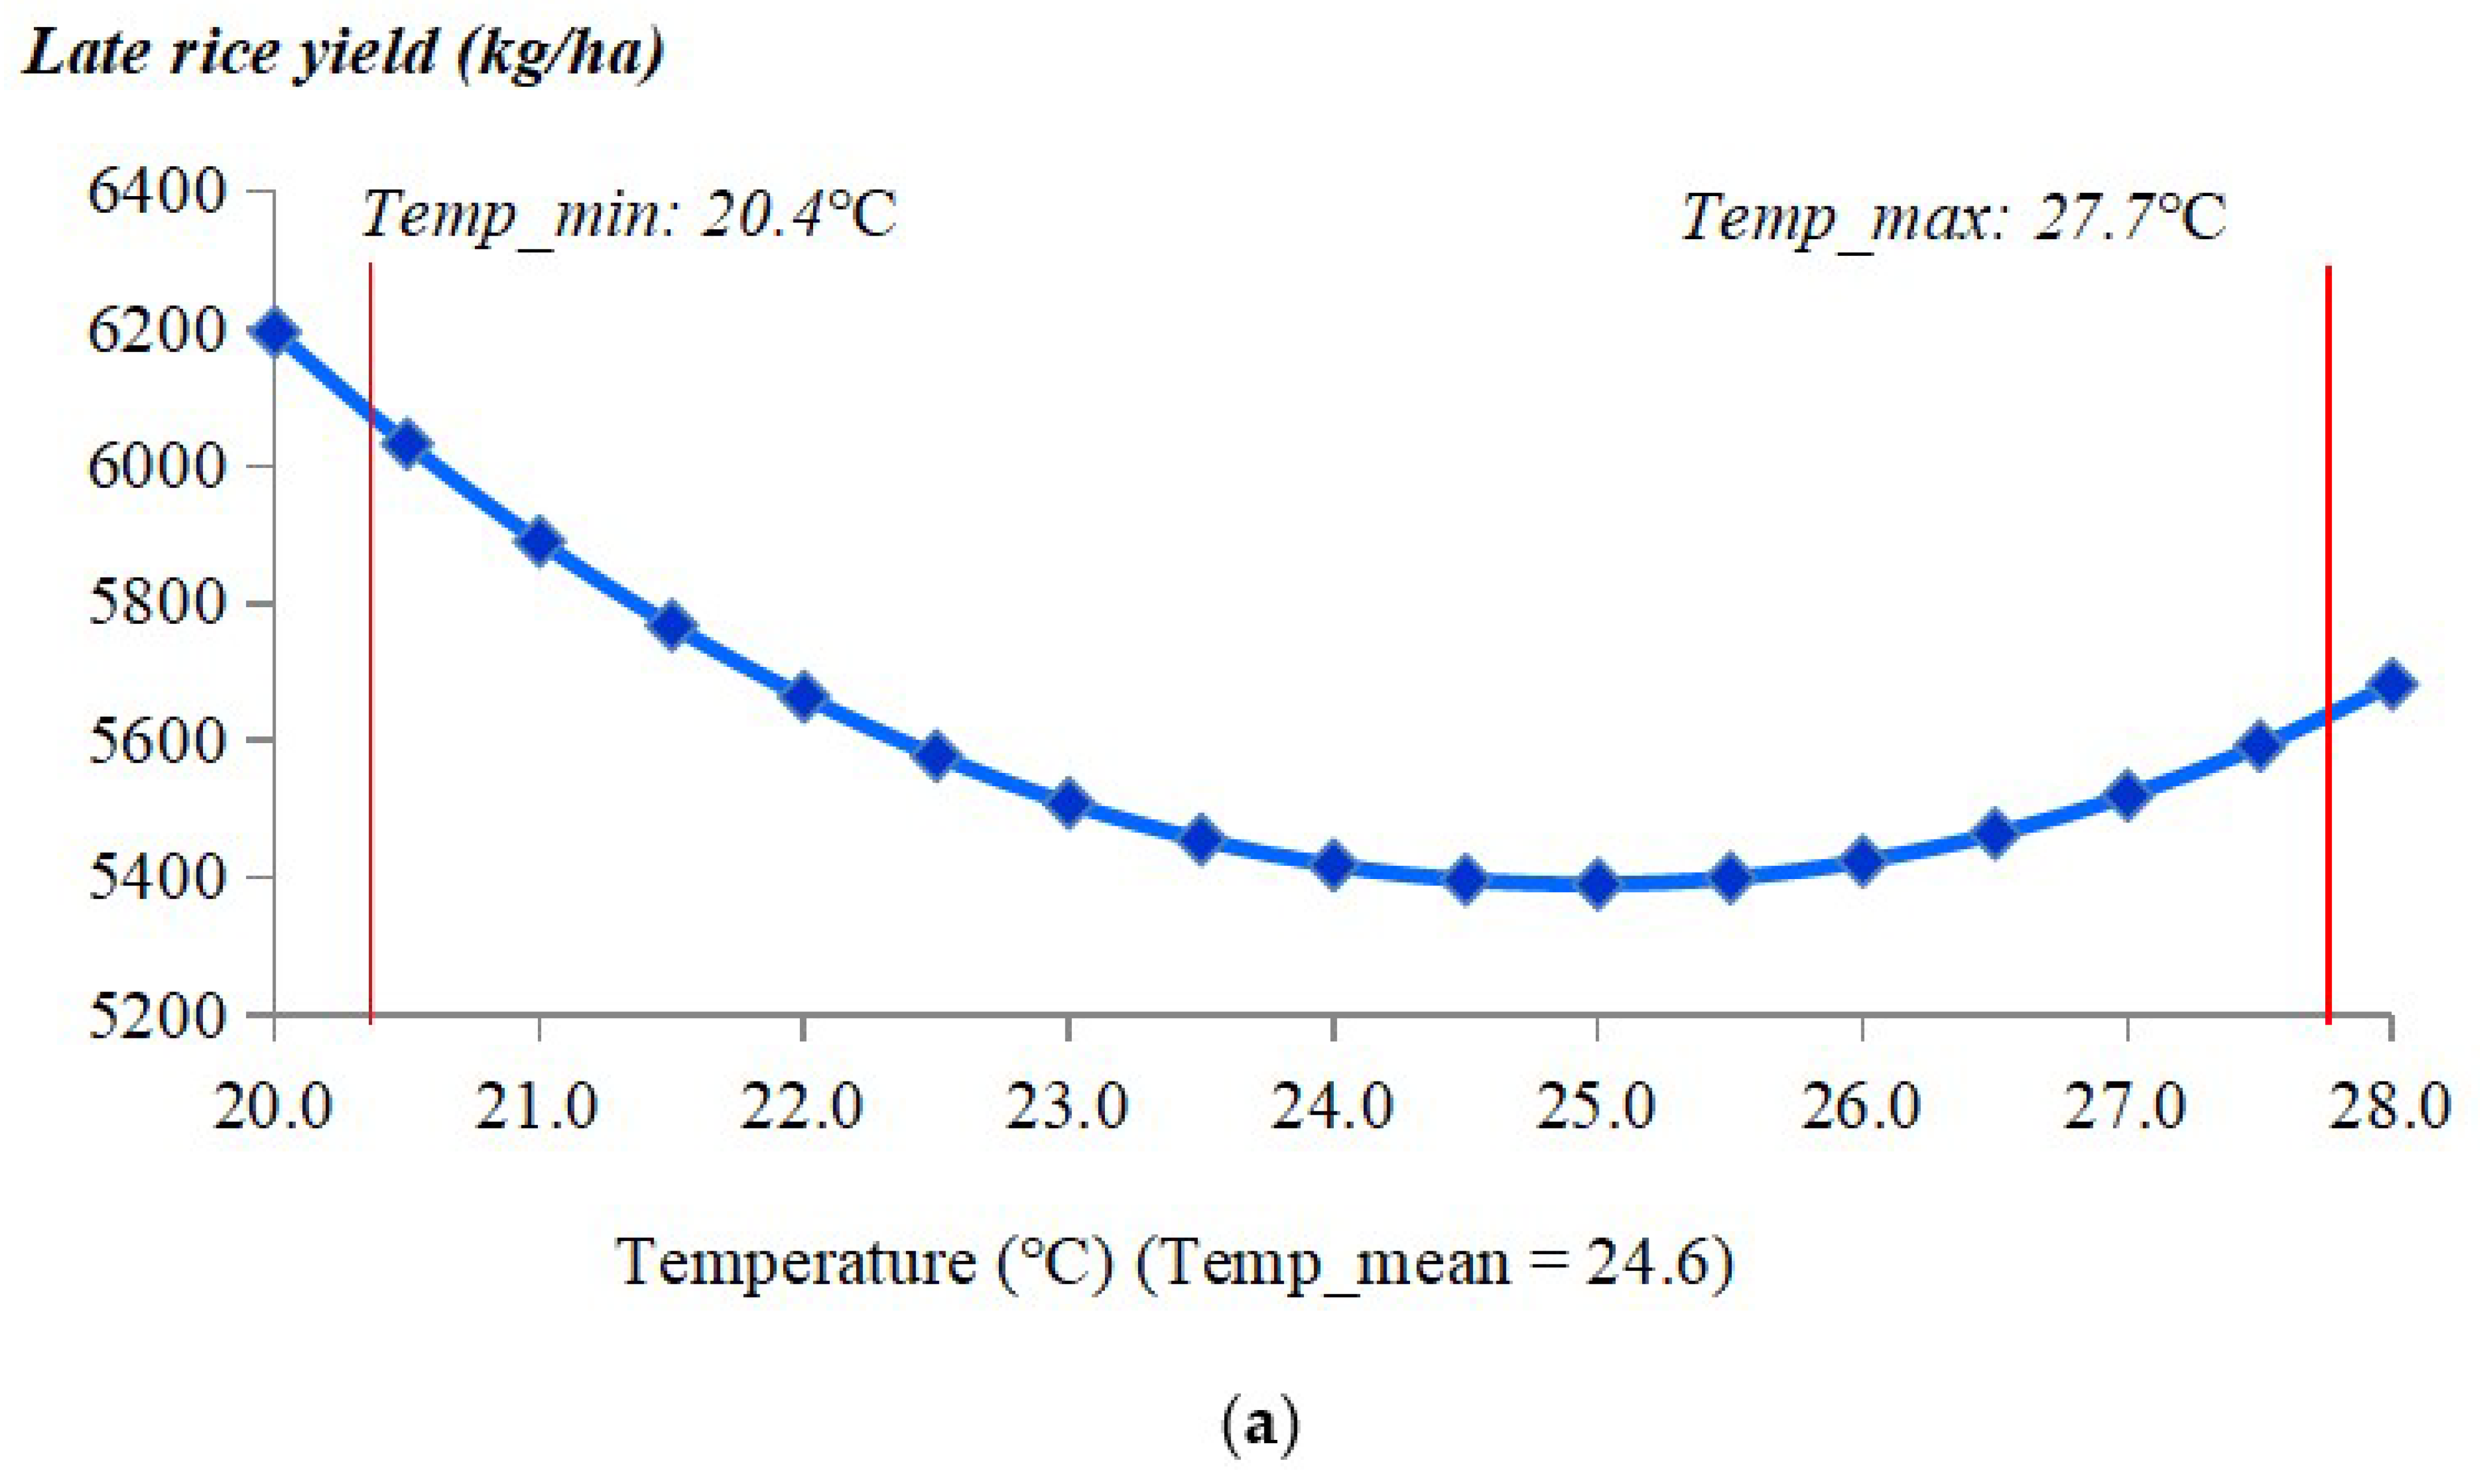
When keeping the constant of production inputs and technical progress, we can predict the separate impacts of temperature and precipitation over the growing season on future rice yields. Specifically, based on the estimated coefficients of Equation (3), the corresponding mean yield was calculated with annual temperature or precipitation changes at the sample mean, keeping other factors constant. This process is illustrated in Figure 3, Figure 4, Figure 5 and Figure 6, and the impacts of temperature and precipitation on rice yields are summarized in Table 7.
In the future, if the temperature over the growing season continues to increase, the yield of early rice will be reduced in all study regions (Figure 3). Similarly, increasing precipitation will result in a decrease in early rice yields (Figure 3). According to the estimated coefficients of the early rice production function, the turning point for temperature—where the positive relationship changes into a negative relationship—is 15.9 °C, which is lower than the minimum temperature in the study regions (18.2 °C). This means that the temperature values of all study regions are on the right side of the turning point of the curve, reflecting a perfect negative relationship between early rice yield and mean temperature over the growing season. Therefore, the rise in temperature over early rice’s growing season is likely to lead to lower yields for all study regions (Table 7). Similarly, in our study regions, the precipitation during early rice’s growing season reached a level where more precipitation would have negative effects on the mean yield of early rice (Table 7). This result is consistent with that found in another study, where average yields of early rice were predicted to decrease due to climate change during the 2030s in China, compared to the 2000s [19].
The rise in temperature will adversely impact the mean yield of middle rice before reaching certain level in the future for all of the study regions, while the effect of the increasing precipitation is not uniform across regions (Figure 4). The calculated turning point for the temperature is 28.3 °C, which is larger than the maximum monthly average temperature over the middle rice growing season in the study sites (25.2 °C). This means that higher temperatures over the middle rice growing season influence its yield negatively in the study sites before the temperature rises to 28.3 °C. Meanwhile, the turning point for the precipitation is about 958 mm—between the sample minimum (326 mm) and maximum (1543 mm). This implies that in the regions where the total precipitation over the middle rice growing season is less than 958 mm, the mean yield of middle rice will benefit from the increase in the precipitation (Table 6). However, the increase in precipitation over the middle rice growing season will reduce the middle rice yield for the regions where the total precipitation over the middle rice growing season is more than 958 mm (Table 7).
It appears that the yield of late rice in some regions will increase if the temperature rises in the future, while in other regions it will be negatively affected by rising temperatures. Figure 5 presents a U-shaped relationship between temperature over the growing season and the mean yield of late rice, with a turning point of 24.8 °C. For the late rice study site, the monthly mean temperature over the growing season is between 20.4 °C and 27.7 °C, implying that higher temperatures have positive effects on late rice yields in the regions with a monthly mean temperature lower than 24.8 °C, while rising temperatures will harm the yield of late rice in other regions (Table 7). Moreover, Figure 5 also shows that the precipitation level over the late rice growing season has been in the decline phase of the inverted U-shaped curve, because the minimum precipitation (426 mm) is far more than the turning point (143 mm). These results indicate that more precipitation over late rice’s growing season will reduce the mean yield of late rice for all of the study regions (Table 7).
For japonica rice, the impacts of rising temperatures on the mean yield also differ between regions. An inverted U-shaped curve is presented to describe the relationship between the temperature and the mean yield of japonica rice (Figure 6). The turning point (17.8 °C) is between the minimum (15.0 °C) and maximum (20.0 °C) values of the monthly mean temperature in japonica rice’s study regions. Therefore, in the regions where the mean temperature over the japonica rice growing season is higher than 17.8 °C, the rise in temperature will negatively affect the mean yield of japonica rice (Table 7). However, the rise in the mean temperature over japonica rice’s growing season will contribute to an increase in japonica rice yields for the regions where the mean temperature over japonica rice’s growing season is lower than 17.8 °C (Table 7). Compared to the non-uniform effect of temperature, the precipitation over japonica rice’s growing season has a negative effect on the mean yield of japonica rice for all of the study regions (Figure 6 and Table 7).

5. Conclusions and Policy Implications

This study used an econometric model to estimate Just–Pope stochastic production functions and identify the potential impacts of temperature and precipitation on the mean and variance of rice yields by rice type (indica rice and japonica rice). Based on the estimated production functions, the contribution rate of climatic factors to rice yields was then assessed by conducting the growth accounting of yields over the past 30 years. Finally, the relationship between the changes in the temperature and precipitation and the mean rice yields was further explored by region.
Based on the historical climate and rice yield data, the estimation results from the econometric models show that not only the mean rice yield, but also the yield variance, will be influenced by climate change. Moreover, not only the mean trend change of climate change, but also the climate variance, will significantly influence rice yields. This study also finds that the impacts of climate change on rice yield differ by rice type and by region.
In the past 30 years, rising temperatures have reduced the mean yield of indica rice, while they have contributed to the yield growth of japonica rice. Precipitation has a positive effect on the yield growth of early rice, while it has negative effects on the yield growth of middle rice, late rice, and japonica rice. The larger standard deviation of temperature over the growing season had a positive contribution to the yield growth of early rice and japonica rice, while it had a negative contribution to the yield growth of middle rice and late rice. The larger standard deviation of precipitation negatively influenced the mean yields of middle rice, late rice, and japonica rice, but it had a positive effect on the yield growth of early rice.
In the future, the impacts of climate change on rice yield will depend on local regions’ present climate condition. The rise in temperature and increased precipitation over the early rice growing season will have negative impacts on the mean yields for all study regions. Higher temperatures over the middle rice growing season will reduce the yield of middle rice before the temperature rises to 28.3 °C in the study regions. However, increased precipitation will increase the mean yield of middle rice in some regions and reduce it in other regions. For late rice and japonica rice, higher temperatures will have a positive effect on the mean yield in some regions, while having a negative effect in other regions. Increased precipitation will reduce the mean yields of late rice and japonica rice for all of the study regions. Therefore, improving the adaptation capacity of rice production requires full consideration of rice types and regional differences.

Author Contributions

L.Z. performed most of the data collection, data analysis, literature review, model operation, and draft writing; J.W. designed the model, provided the idea for the study, and participated in all of the data analysis; T.S. and X.W. participated in part of the data analysis and devoted much effort to the improvement of the manuscript. All authors have read and agreed to the published version of the manuscript.

Funding

This research was funded by the National Natural Science Foundation of China (41861124006; 71603247; 71903047) and the Natural Science Foundation of Hebei Province, China (G2020207002).

Data Availability Statement

Publicly available climate data were analyzed in this study. This data can be downloaded from here: [http://data.cma.cn, accessed on 29 November 2022]. The raw data of rice input and output came from secondary statistics published in each year, and the author team spent a lot of time collecting and calculating, so the final data are not publicly available.

Conflicts of Interest

The authors declare no conflict of interest.

Appendix A

Table A1. Descriptive statistics of major variables for early rice.
MeanMinimumMaximum
Yield (kg/ha)556640226713
Average temperature in growing season21.318.225.3
Average temperature in growing season (squared)456331640
Total precipitation in growing season9573201555
Total precipitation in growing season (squared)977,541102,6992,418,507
Standard deviation of temperature in growing season638
Standard deviation of precipitation in growing season8213248
Value of fertilizer input per area (CNY/ha)9264281505
Number of labor inputs per area (day/ha)24862554
Other material costs per area (CNY/ha)13826602464
Note: Observation is 261.
Table A2. Descriptive statistics of major variables for middle rice.
MeanMinimumMaximum
Yield (kg/ha)668932188890
Average temperature in growing season21.916.725.2
Average temperature in growing season (squared)484279636
Total precipitation in growing season7983261543
Total precipitation in growing season (squared)687,203106,4722,382,315
Standard deviation of temperature in growing season325
Standard deviation of precipitation in growing season6719153
Value of fertilizer input per area (CNY/ha)8232292092
Number of labor inputs per area (day/ha)29690738
Other material costs per area (CNY/ha)13634162737
Note: Observation is 266.
Table A3. Descriptive statistics of major variables for late rice.
MeanMinimumMaximum
Yield (kg/ha)546722057268
Average temperature in growing season24.620.427.7
Average temperature in growing season (squared)606418770
Total precipitation in growing season8744261860
Total precipitation in growing season (squared)831,554181,3683,457,823
Standard deviation of temperature in growing season428
Standard deviation of precipitation in growing season10010308
Value of fertilizer input per area (CNY/ha)9223841348
Number of labor inputs per area (day/ha)23178480
Other material costs per area (CNY/ha)14295962752
Note: Observation is 242.
Table A4. Descriptive statistics of major variables for japonica rice.
MeanMinimumMaximum
Yield (kg/ha)666424858578
Average temperature in growing season17.515.020.0
Average temperature in growing season (squared)307224400
Total precipitation in growing season527314870
Total precipitation in growing season (squared)290,55198,653756,441
Standard deviation of temperature in growing season537
Standard deviation of precipitation in growing season5915132
Value of fertilizer input per area (CNY/ha)8591751477
Number of labor inputs per area (day/ha)20257582
Other material costs per area (CNY/ha)237313934015
Note: Observation is 93.

References

  1. FAO. World Food and Agriculture-Statistical Yearbook 2020; FAO: Rome, Italy, 2020. [Google Scholar] [CrossRef]
  2. Liu, Y.; Ge, T.; van Groenigen, K.J.; Yang, Y.; Wang, P.; Cheng, K.; Zhu, Z.; Wang, J.; Li, Y.; Guggenberger, G.; et al. Rice Paddy Soils Are a Quantitatively Important Carbon Store According to a Global Synthesis. Commun. Earth Environ. 2021, 2, 154. [Google Scholar] [CrossRef]
  3. Peng, S.; Tang, Q.; Zou, Y. Current Status and Challenges of Rice Production in China. Plant. Prod. Sci. 2009, 12, 3–8. [Google Scholar] [CrossRef] [Green Version]
  4. Deng, N.; Grassini, P.; Yang, H.; Huang, J.; Cassman, K.G.; Peng, S. Closing Yield Gaps for Rice Self-Sufficiency in China. Nat. Commun. 2019, 10, 1725. [Google Scholar] [CrossRef] [PubMed] [Green Version]
  5. Ye, L.; Xiong, W.; Li, Z.; Yang, P.; Wu, W.; Yang, G.; Fu, Y.; Zou, J.; Chen, Z.; Ranst, E.; et al. Climate Change Impact on China Food Security in 2050. Agron. Sustain. Dev. 2012, 33, 363–374. [Google Scholar] [CrossRef] [Green Version]
  6. Tao, F.; Yokozawa, M.; Hayashi, Y.; Lin, E. Future Climate Change, the Agricultural Water Cycle, and Agricultural Production in China. Agric. Ecosyst. Environ. 2003, 95, 203–215. [Google Scholar] [CrossRef]
  7. Tao, F.; Yokozawa, M.; Xu, Y.; Hayashi, Y.; Zhang, Z. Climate Changes and Trends in Phenology and Yields of Field Crops in China, 1981–2000. Agric. Forest Meteorol. 2006, 138, 82–92. [Google Scholar] [CrossRef]
  8. Peng, S.B.; Huang, J.L.; Sheehy, J.E.; Laza, R.C.; Visperas, R.M.; Zhong, X.H.; Centeno, G.S.; Khush, G.S.; Cassman, K.G. Rice Yields Decline with Higher Night Temperature from Global Warming. Proc. Natl. Acad. Sci. USA 2004, 101, 9971–9975. [Google Scholar] [CrossRef] [Green Version]
  9. Moore, F. The Fingerprint of Anthropogenic Warming on Global Agriculture. EarthArXiv 2020. [Google Scholar] [CrossRef]
  10. IPCC. Climate Change 2014: Impacts, Adaptation, and Vulnerability. Part A: Global and Sectoral Aspects; Contribution of Working Group II to the Fifth Assessment Report of the Intergovernmental Panel on Climate Change; Cambridge University Press: Cambridge, UK; New York, NY, USA, 2014. [Google Scholar]
  11. IPCC. Climate Change 2022: Impacts, Adaptation, and Vulnerability; Contribution of Working Group II to the Sixth Assessment Report of the Intergovernmental Panel on Climate Change; Cambridge University Press: Cambridge, UK; New York, NY, USA, 2022. [Google Scholar] [CrossRef]
  12. Kropff, M.J.; Centeno, G.; Bachelet, D.; Lee, M.; Mohan, D.S.; Horie, T.; De Feng, S.; Singh, S.; Penning, D.V.F. Predicting the Impact of CO2 and Temperature on Rice Production, IRRI Seminar Series on Climate Change and Rice; International Rice Research Institute: Los Baños, Philippines, 1993. [Google Scholar]
  13. Matthews, R.B.; Kropff, M.J.; Horie, T.; Bachelet, D. Simulating the Impact of Climate Change on Rice Production in Asia and Evaluating Options for Adaptation. Agric. Syst. 1997, 54, 399–425. [Google Scholar] [CrossRef]
  14. Hayashi, Y.; Jung, Y.S. Paddy Rice Production under Possible Temperature Fluctuation in East Asia. Global Environ. Res. Engl. Ed. 2000, 3, 129–138. [Google Scholar]
  15. Lin, E.D.; Xiong, W.; Ju, H.; Xu, Y.L.; Li, Y.; Bai, L.P.; Xie, L.Y. Climate Change Impacts on Crop Yield and Quality with CO2 Fertilization in China. Philos. Trans. R. Soc. B-Biol. Sci. 2005, 360, 2149–2154. [Google Scholar] [CrossRef] [Green Version]
  16. Yao, F.; Xu, Y.; Lin, E.; Yokozawa, M.; Zhang, J. Assessing the Impacts of Climate Change on Rice Yields in the Main Rice Areas of China. Clim. Chang. 2007, 80, 395–409. [Google Scholar] [CrossRef]
  17. Wang, J.; Huang, J.; Yang, J. Overview of Impacts of Climate Change and Adaptation in China’s Agriculture. J. Integr. Agric. 2014, 13, 1–17. [Google Scholar] [CrossRef]
  18. Pickson, R.B.; He, G.; Boateng, E. Impacts of Climate Change on Rice Production: Evidence from 30 Chinese Provinces. Environ. Dev. Sustain. 2022, 24, 3907–3925. [Google Scholar] [CrossRef]
  19. Lv, Z.; Zhu, Y.; Liu, X.; Ye, H.; Tian, Y.; Li, F. Climate Change Impacts on Regional Rice Production in China. Clim. Change 2018, 147, 523–537. [Google Scholar] [CrossRef]
  20. Pranuthi, G.; Tripathi, S.K. Assessing the Climate Change and Its Impact on Rice Yields of Haridwar District Using PRECIS RCM Data. Clim. Change 2018, 148, 265–278. [Google Scholar] [CrossRef]
  21. Bezner Kerr, R.T.; Hasegawa, R.; Lasco, I.; Bhatt, D.; Deryng, A.; Farrell, H.; Gurney-Smith, H.; Ju, S.; Lluch-Cota, F.; Meza, G.; et al. 2022: Food, Fibre, and Other Ecosystem Products. In Climate Change 2022: Impacts, Adaptation, and Vulnerability; Pörtner, H.-O., Roberts, D.C., Tignor, M., Poloczanska, E.S., Mintenbeck, K., Alegría, A., Craig, M., Langsdorf, S., Löschke, S., Möller, V., et al., Eds.; Contribution of Working Group II to the Sixth Assessment Report of the Intergovernmental Panel on Climate Change; Cambridge University Press: Cambridge, UK; New York, NY, USA, 2022; pp. 713–906. [Google Scholar] [CrossRef]
  22. Caretta, M.A.A.; Mukherji, M.; Arfanuzzaman, R.A.; Betts, A.; Gelfan, Y.; Hirabayashi, T.K.; Lissner, J.; Liu, E.; Lopez Gunn, R.; Morgan, S.; et al. 2022: Water. In Climate Change 2022: Impacts, Adaptation, and Vulnerability; Contribution of Working Group II to the Sixth Assessment Report of the Intergovernmental Panel on Climate Change; Pörtner, H.-O., Roberts, D.C., Tignor, M., Poloczanska, E.S., Mintenbeck, K., Alegría, A., Craig, M., Langsdorf, S., Löschke, S., Möller, V., et al., Eds.; Cambridge University Press: Cambridge, UK; New York, NY, USA, 2022; pp. 551–712. [Google Scholar] [CrossRef]
  23. Leng, G.; Hall, J. Crop Yield Sensitivity of Global Major Agricultural Countries to Droughts and the Projected Changes in the Future. Sci. Total Environ. 2019, 654, 811–821. [Google Scholar] [CrossRef]
  24. Shaw, R.Y.; Luo, T.S.; Cheong, S.; Abdul Halim, S.; Chaturvedi, M.; Hashizume, G.E.; Insarov, Y.; Ishikawa, M.; Jafari, A.; Kitoh, J.; et al. 2022: Asia. In Climate Change 2022: Impacts, Adaptation, and Vulnerability; Contribution of Working Group II to the Sixth Assessment Report of the Intergovernmental Panel on Climate Change; Pörtner, H.-O., Roberts, D.C., Tignor, M., Poloczanska, E.S., Mintenbeck, K., Alegría, A., Craig, M., Langsdorf, S., Löschke, S., Möller, V., et al., Eds.; Cambridge University Press: Cambridge, UK; New York, NY, USA, 2022; pp. 1457–1579. [Google Scholar] [CrossRef]
  25. Prabnakorn, S.; Maskey, S.; Suryadi, F.X.; de Fraiture, C. Rice Yield in Response to Climate Trends and Drought Index in the Mun River Basin, Thailand. Sci. Total Environ. 2018, 621, 108–119. [Google Scholar] [CrossRef]
  26. Trisos, C.H.I.O.; Adelekan, E.; Totin, A.; Ayanlade, J.; Efitre, A.; Gemeda, K.; Kalaba, C.; Lennard, C.; Masao, Y.; Mgaya, G.; et al. 2022: Africa. In Climate Change 2022: Impacts, Adaptation, and Vulnerability; Contribution of Working Group II to the Sixth Assessment Report of the Intergovernmental Panel on Climate Change; Pörtner, H.-O., Roberts, D.C., Tignor, M., Poloczanska, E.S., Mintenbeck, K., Alegría, A., Craig, M., Langsdorf, S., Löschke, S., Möller, V., et al., Eds.; Cambridge University Press: Cambridge, UK; New York, NY, USA, 2022; pp. 1285–1455. [Google Scholar] [CrossRef]
  27. Huang, C.; Li, N.; Zhang, Z.; Liu, Y.; Chen, X.; Wang, F.; Chen, Q. What Is the Consensus from Multiple Conclusions of Future Crop Yield Changes Affected by Climate Change in China? Int. J. Environ. Res. Public Health 2020, 17, 9241. [Google Scholar] [CrossRef]
  28. Hu, Y.; Fan, L.; Liu, Z.; Yu, Q.; Liang, S.; Chen, S.; You, L.; Wu, W.; Yang, P. Rice Production and Climate Change in Northeast China: Evidence of Adaptation through Land Use Shifts. Environ. Res. Lett. 2019, 14, 024014. [Google Scholar] [CrossRef]
  29. Barnwal, P.; Kotani, K. Impact of Variation in Climatic Factors on Crop Yield: A Case of Rice Crop in Andhra Pradesh, India; Working Papers; Research Institute, International University of Japan: Minamiuonuma, Japan, 2010. [Google Scholar]
  30. Attavanich, W.; McCarl, B. The Effect of Climate Change, CO2 Fertilization, and Crop Production Technology on Crop Yields and Its Economic Implications on Market Outcomes and Welfare Distribution; Agricultural & Applied Economics Association’s: Pittsburgh, PA, USA, 2011. [Google Scholar]
  31. Isik, M.; Devadoss, S. An Analysis of the Impact of Climate Change on Crop Yields and Yield Variability. Appl. Econ. 2006, 38, 835–844. [Google Scholar] [CrossRef]
  32. Saseendran, S.A.; Singh, K.K.; Rathore, L.S.; Singh, S.V.; Sinha, S.K. Effects of Climate Change on Rice Production in the Tropical Humid Climate of Kerala, India. Clim. Chang. 2000, 44, 495–514. [Google Scholar] [CrossRef]
  33. Tao, F.; Yokozawa, M.; Liu, J.; Zhang, Z. Climate–Crop Yield Relationships at Provincial Scales in China and the Impacts of Recent Climate Trends. Clim. Res. 2008, 38, 83–94. [Google Scholar] [CrossRef]
  34. Tian, W.; Wan, G.H. Technical Efficiency and Its Determinants in China’s Grain Production. J. Prod. Anal. 2000, 13, 159–174. [Google Scholar] [CrossRef]
  35. Wang, J.; Mendelsohn, R.; Dinar, A.; Huang, J.; Rozelle, S.; Zhang, L. The Impact of Climate Change on China’s Agriculture. Agric. Econ. 2009, 40, 323–337. [Google Scholar] [CrossRef]
  36. Bournaris, T.; Moulogianni, C.; Vlontzos, G.; Georgilas, I. Methodologies Used to Assess the Impacts of Climate Change in Agricultural Economics: A Rapid Review. Int. J. Sustain. Agric. Manag. Inf. 2021, 7, 253–269. [Google Scholar] [CrossRef]
  37. Arimi, K.; Olooto, F.M. Precision Farming and Climate Change Adaptation Strategies Used Among Cowpea Farmers. Int. J. Sustain. Agric. Manag. Inf. 2020, 6, 401–415. [Google Scholar] [CrossRef]
  38. Mohammed, E.; Ahlem, H.; Meryem, A.; Emilia, R.M.; Catalina, E.-G.; Emilia, C.C.M. Modelling Potential Impacts of Climate Change on the Geospatial Distribution of Phytopathogenic Telluric Fungi. Int. J. Sustain. Agric. Manag. Inf. 2019, 5, 158–167. [Google Scholar] [CrossRef]
  39. Ezziyyani, M.; Hamdache, A.; Ezziyyani, M.; Cherrat, L. Predictable Consequences of Climate Change for Varieties of Strawberry Plants Grown in Morocco. Int. J. Sustain. Agric. Manag. Inf. 2019, 5, 97–111. [Google Scholar] [CrossRef]
  40. Fathi, M.T.; Ezziyyani, M. How Can Data Mining Help Us to Predict the Influence of Climate Change on Mediterranean Agriculture? Int. J. Sustain. Agric. Manag. Inf. 2019, 5, 168–180. [Google Scholar] [CrossRef]
  41. Just, R.E.; Pope, R.D. Stochastic Specification of Production Functions and Economic Implications. J. Econ. 1978, 7, 67–86. [Google Scholar] [CrossRef]
  42. Cabas, J.; Weersink, A.; Olale, E. Crop Yield Response to Economic, Site and Climatic Variables. Clim. Chang. 2010, 101, 599–616. [Google Scholar] [CrossRef]
  43. Saha, A.; Havenner, A.; Talpaz, H. Stochastic Production Function Estimation: Small Sample Properties of ML versus FGLS. Appl. Econ. 1997, 29, 459–469. [Google Scholar] [CrossRef]
  44. Blanc, E. The Impact of Climate Change on Crop Yields in Sub-Saharan Africa. Am. J. Clim. Chang. 2012, 1, 1–13. [Google Scholar] [CrossRef] [Green Version]
  45. Holst, R.; Yu, X.; Grün, C. Climate Change, Risk and Grain Yields in China. J. Integr. Agric. 2013, 12, 1279–1291. [Google Scholar] [CrossRef]
  46. Huang, H.; Khanna, M. An Econometric Analysis of U.S. Crop Yield and Cropland Acreage: Implications for the Impact of Climate Change. SSRN Electron. J. 2012. [Google Scholar] [CrossRef]
  47. Mendelsohn, R. What Causes Crop Failure. Clim. Chang. 2007, 81, 61–70. [Google Scholar] [CrossRef]
  48. McCarl, B.A.; Villavicencio, X.; Wu, X. Climate Change and Future Analysis: Is Stationarity Dying? Amer. J. Agr. Econ. 2008, 90, 1241–1247. [Google Scholar] [CrossRef]
  49. Zhang, T.; Huang, Y. Impacts of Climate Change and Inter-Annual Variability on Cereal Crops in China from 1980 to 2008. J. Sci. Food Agric. 2012, 92, 1643–1652. [Google Scholar] [CrossRef]
  50. Zhang, T.; Zhu, J.; Wassmann, R. Responses of Rice Yields to Recent Climate Change in China: An Empirical Assessment Based on Long-Term Observations at Different Spatial Scales (1981–2005). Agric. For. Meteorol. 2010, 150, 1128–1137. [Google Scholar] [CrossRef]
  51. You, L.; Rosegrant, M.W.; Wood, S.; Sun, D. Impact of Growing Season Temperature on Wheat Productivity in China. Agric. For. Meteorol. 2009, 149, 1009–1014. [Google Scholar] [CrossRef]
Figure 1. Long-term changes in temperature and precipitation in China from 1951 to 2012, and changes over the rice-growing season at the sample sites from 1951 to 2010: (a) Long-term changes in temperature in China (°C). The red line is the trend line for temperature change. (b) Long-term changes in precipitation in China (mm). The red line is the trend line for precipitation change. (c) Long-term changes in temperature over the rice-growing season at the sample sites (°C). (d) Long-term changes in precipitation over the rice-growing season at the sample sites (mm).
Agronomy 12 03062 g001aAgronomy 12 03062 g001b
Figure 2. Change rate of rice yields over the past 30 years (%).
Agronomy 12 03062 g002
Figure 3. Relationships between climate change and the mean yield of early rice: (a) Relationship between temperature and the mean yield of early rice. (b) Relationship between precipitation and the mean yield of early rice.
Agronomy 12 03062 g003aAgronomy 12 03062 g003b
Figure 4. Relationships between climate change and the mean yield of middle rice: (a) Relationship between temperature and the mean yield of middle rice. (b) Relationship between precipitation and the mean yield of middle rice.
Agronomy 12 03062 g004aAgronomy 12 03062 g004b
Figure 5. Relationships between climate change and the mean yield of late rice: (a) Relationship between temperature and the mean yield of late rice. (b) Relationship between precipitation and the mean yield of late rice.
Agronomy 12 03062 g005aAgronomy 12 03062 g005b
Figure 6. Relationships between climate change and the mean yield of japonica rice: (a) Relationship between temperature and the mean yield of japonica rice. (b) Relationship between precipitation and the mean yield of japonica rice.
Agronomy 12 03062 g006aAgronomy 12 03062 g006b
Table 1. Growing seasons of rice by province.
ProvinceEarly RiceMiddle RiceLate RiceJaponica Rice
Liaoning April–September
Jilin April–September
Heilongjiang May–September
Jiangsu May–September
ZhejiangMarch–August June–November
AnhuiMarch–AugustApril–SeptemberJune–November
FujianFebruary–JulyApril–SeptemberJune–October
Jiangxi March–July June–October
Henan May–SeptemberJune–October
HubeiMarch–JulyApril–SeptemberJune–October
HunanMarch–AugustApril–SeptemberJune–October
GuangdongFebruary–July June–November
GuangxiFebruary–July June–November
HainanDecember–June June–November
Sichuan April–August
Guizhou April–September
Yunnan March–September
Shaanxi April–September
Table 2. Regression results for the determinants of mean rice yield.
Mean Yield (log)
Indica RiceJaponica Rice
Early Rice Middle RiceLate Rice
Climate during growing season
Temperature 0.0892−0.2599 **−0.2830 **0.4235 **
(1.32)(2.04)(1.97)(2.46)
Temperature squared−0.0028 *0.0046 *0.0057 *−0.0119 **
(1.80)(1.66)(1.93)(2.44)
Precipitation−0.00010.00010.0000−0.0000
(0.48)(0.49)(0.18)(0.01)
Precipitation squared−0.0000−0.0000−0.0000−0.0000
(0.53)(0.49)(1.25)(0.22)
Climate variation in growing season
Standard deviation of temperature−0.0235 ***−0.0088−0.0155 **−0.0193 ***
(3.93)(0.74)(2.12)(2.68)
Standard deviation of precipitation−0.0004 ***−0.00050.0003 *0.0001
(3.41)(1.63)(1.96)(0.27)
Production inputs
Fertilizer (CNY/ha) (log)0.0955 ***0.0612 *0.1638 ***0.2777
(3.19) (1.70)(4.00)(0.0001)
Labor days (days/ha) (log)0.00310.0835 ***0.0005−0.0217
(0.12)(2.84) ***(0.02)(0.59)
Other material inputs (CNY/ha) (log)0.02750.02980.02400.1386 ***
(1.021)(0.82)(0.72)(2.72)
Technological progress
Year0.0045 ***0.0120 ***0.0056 ***0.0023
(3.23)(7.39)(4.17)(1.06)
Province dummyNot reportedNot reportedNot reportedNot reported
Constant−1.5979−12.5611−0.1748−2.2140
(0.63)(4.00) ***(0.05)(0.48)
Wald chi25094061217370
Observations26126624293
Absolute t statistics in parentheses. Significance of t statistics: * p < 0.10, ** p < 0.05, *** p < 0.01.
Table 3. Regression results for the determinants of variance of rice yield.
Variance of Yield (Log)
Indica RiceJaponica Rice
Early RiceMiddle RiceLate Rice
Climate during growing season
Temperature 2.68134.3153 **−8.1446 **−6.0456
(1.02)(1.98)(2.24)(1.25)
Temperature squared−0.0752−0.0965 *0.1638 **0.1272
(1.20)(−1.95)(2.14)(0.91)
Precipitation−0.00570.0143 ***−0.0066 **−0.0406 **
(1.43)(3.59)(2.57)(2.41)
Precipitation squared0.0000004 **−5.95 × 10⁻⁶ ***4.09 × 10⁻⁶ ***0.00003 **
(2.12)(2.96)(3.12)(2.12)
Climate variation in growing season
Standard deviation of temperature−0.0918−0.21710.0547−0.3667
(0.46)(0.71)(0.22)(1.04)
Standard deviation of precipitation0.0043−0.0010−0.00370.0324 **
(0.86)(0.17)(0.83)(1.89)
Production inputs
Fertilizer (CNY/ha) (log)0.5244−0.2165−1.7125 *−0.1814
(0.57)(0.40)(1.96)(0.20)
Labor days (days/ha) (log)−0.5579−0.6235−1.3058 *2.3804
(0.76)(1.22)(1.75)(1.34)
Other material input (CNY/ha) (log)0.08880.66361.0250−5.0666 ***
(0.11)(0.76)(1.28)(3.51)
Technological progress
Year−0.0753 **−0.0964 ***−0.1795 ***0.0818
(−1.96)(−2.94)(−4.33)(0.87)
Province dummyNot reportedNot reportedNot reportedNot reported
Constant122.0343 *132.6428 **466.6886 ***−59.2032
(1.65)(2.17)(4.72)(0.30)
Wald chi25094061211339
Observations26126624293
Absolute z statistics in parentheses. Significance of t statistics: * p < 0.10, ** p < 0.05, *** p < 0.01.
Table 4. Summary: Impacts of climate change on the mean of rice yield.
Mean of Climate Variables Standard Deviation of Climate Variable
TemperatureTemperature2PrecipitationPrecipitation2TemperaturePrecipitation
Early rice
Middle rice +
Late rice + +
Japonica rice +
Table 5. Summary: Impacts of climate change on the variance of rice yield.
Mean of Climate Variables Standard Deviation of Climate Variable
Temperature Temperature2PrecipitationPrecipitation2Temperature Precipitation
Early rice +
Middle rice ++
Late rice ++
Japonica rice + +
Table 6. Contribution of climate factors and other factors to the growth of rice yields (%).
Indica RiceJaponica Rice
Early RiceMiddle RiceLate Rice
Climate during growing season
Temperature−27.05−16.21−0.660.63
Precipitation2.92−0.01−2.49−1.73
Climate variation in growing season
Standard deviation of temperature8.65−0.07−0.681.10
Standard deviation of precipitation−3.340.172.680.14
Production inputs
Fertilizer (CNY/ha) (log)27.577.8221.2635.67
Labor days (days/ha) (log)−1.39−11.83−0.072.42
CNY20.146.767.137.91
Technological progress
Year79.7872.0932.559.79
Others−7.2741.2740.2844.07
Total100100100100
Table 7. Summary: Impacts of temperature and precipitation on rice yields.
Temperature IncreasePrecipitation Increase
Indica rice
Early rice All regions (−)All regions (−)
Middle riceAll regions (−) if mean temperature < 28.3Regions < 958 mm (+)
Regions > 958 mm (−)
Late riceRegions < 24.8 (−)
Regions > 24.8 (+)
All regions (−)
Japonica riceRegions< 17.8 (+)
Regions > 17.8 (−)
All regions (−)
Publisher’s Note: MDPI stays neutral with regard to jurisdictional claims in published maps and institutional affiliations.