Article

Sustainability of Small Farms in Serbia: A Comparative Analysis with the European Union

Department of Agricultural Economics and Agribusiness, Faculty of Economics in Subotica, University of Novi Sad, 24000 Subotica, Serbia
*
Author to whom correspondence should be addressed.
Agronomy 2022, 12(11), 2726; https://doi.org/10.3390/agronomy12112726
Submission received: 10 September 2022 / Revised: 26 October 2022 / Accepted: 1 November 2022 / Published: 3 November 2022
(This article belongs to the Special Issue Strategic Analysis of Sustainable Agriculture and Future Foods)

Abstract

:
Throughout the EU, small farms have varying degrees of importance, which points to the need to analyse the role of small farms. This study, in addition to EU countries, includes Serbia, a candidate country for EU membership. This study aims to provide an overview of agriculture’s structural characteristics by creating an Index of Agricultural Structural Characteristics (ASC Index). The analysis was carried out at the regional level, which provides a more detailed overview of the structural characteristics of agriculture in the EU and Serbia. The results indicate several regional differences in the EU along north–south and west–east divisions. Serbian agriculture is predominantly made up of small farms and corresponds to the southern model of European agriculture. In terms of the west–east division, Serbian agriculture also corresponds to the structure of Central and Eastern Europe countries (CEEC), with which it shares a historical heritage of a centrally planned economy. Changes in Serbian agricultural policy must be directed toward regions with unfavourable structural characteristics. Special attention should be given to small farms in cases where there is potential to improve competitiveness and where there is a good basis for improving the social sustainability of rural areas.

1. Introduction

European agriculture includes a unique combination of both universal and very specific characteristics. Structural changes in agriculture within the European Union (EU) are characterized by constant processes involving the concentration of capital, with a decrease in the number of farms but an increase in average farm size, whereas the area of agricultural land is almost the same [1]. However, small farms continue to survive as part of European agriculture, even though the distribution of CAP funds does not primarily target small farms, given that farm income payment is largely area-based [2]. The impact on the agricultural sector of various trends such as globalization indicates the need to analyse small farms, which is agriculture’s most sensitive element. There is, however, no fixed definition of a small or a large farm. Khalil et al. (2017) [3] identified different criteria in determining the size of farms: land size, labour input, type of management (family farming), market orientation, economic size (standard value of production or standard output), and multiple criteria (combination of criteria). In the EU, two main criteria have been used to delineate farm size: a classification of farms in economic terms based on their Standard Output (SO) or on a Utilised Agricultural Area (UAA) [4].
Several characteristics create limitations for small farms. For instance, although land is often not a scarce resource for small farms, cash or seasonal labour may be limiting [5]. Furthermore, the skills required to manage new technologies are beyond the scope of many small farmers, who pay more for inputs and receive less for outputs than large farms, and new commodity chains impose quality and timeliness requirements that small farmers find hard to meet [5]. Small farms also exploit labour using technologies that increase yields, and thus land productivity, and use labour-intensive methods rather than capital-intensive machines, which causes labour productivity to be lower than that of large farms [6]. According to Jurjević et al. (2019) [7], large farms, which are market-oriented, invest in new technologies to adequately respond to rapid changes in market liberalization and increases in foreign competition, whereas small farms are limited due to traditional production technologies.
Despite competition and major challenges, small farms in rural areas have an important role in employing a large share of the population and caring for environmental and social demands [8]. For poorer, land-scarce countries, small farms have several advantages over large farms, including contributing to job creation, reducing poverty, and improving food security. They also have consumption patterns that help vitalize the rural non-farm economy [9]. The importance of the agricultural sector as a whole, and small farms in particular, in ensuring food security, employment, and the viability of rural areas, means it is necessary to support the agricultural sector and small farms in particular [10]. Small farms are a significant factor in achieving and improving food security [11]. They support rural employment and can considerably contribute to territorial development [4]. On the other hand, the presence of small family farms, in combination with the extensive structure of agriculture production and present rural poverty, could be a significant limitation in developing agricultural production [12].
The major structural problem is that agriculture in rural areas cannot provide a single basis for dynamic rural development. Economically strong regions, which rely on the secondary and tertiary sectors, base agricultural development on linking it to the non-agricultural sector. As Senger et al. (2017) [13] indicate, political and academic debate about small farms and rural development has broadened in recent years. One of the most important issues being discussed is the diversification of agricultural and non-agricultural activities, as this can reduce poverty in rural areas. Multifunctionality of farming systems has been adopted as one livelihood strategy to keep rural practices alive among small-scale farmers without necessarily increasing productivity [8]. Chaplin et al. (2007) [14], using rural Poland as an example, showed that structural change has been remarkably slow, and the underlying problem of a weak rural non-farm economy (RNFE) and overdependence on agriculture has its origins in the Socialist era policy of “repressive tolerance” towards small-scale family farms. Thus, further rural economic diversification is essential.
The group of countries classified as Central and Eastern European countries (CEEC), with most joining the EU in 2004 (Romania and Bulgaria in 2007 and Croatia in 2013), are former socialist states that have undergone a process of transformation from a centrally planned economy to a market-based economy. Historical heritage, unlike the pre-2004 EU member states (EU-15), has had a long-term impact on agriculture, and CEEC primarily have small farms. Serbia, which has been a candidate for EU membership since 2012, also shares this historical legacy of a centrally planned economy. Therefore, the farm structure in Serbia is also primarily made up of small farms, with an average size of 5.4 hectares per farm [15]. Furthermore, rural areas in Serbia have specific importance in the overall economy, where they cover the majority of the territory of Serbia. Accordingly, it is very important to point out the importance of small farms in rural areas.
The scope of the research includes the regional and territorial distribution of the structure of farms in the EU, including Serbia as a candidate country for EU membership. This research aims to create a regional typology that provides an overview of the structural characteristics of agriculture in EU countries and Serbia, identifying regions where small farms are of great importance in the context of agriculture. To accomplish this, an Index of Agricultural Structural Characteristics (ASC Index) was created. In addition, regional typology is visualized with a map in order to understand the spatial aspect. Based on the ASC Index, a regional typology was created, for which importance is reflected in the lack of created regional typologies that include both the EU and Serbia; a new understanding of the role and importance of small farms in Serbia; and the need to harmonize Serbia’s agricultural policy with the CAP in terms of an adequate model of support for small farms. This study also aims to investigate the correlation of socio-economic conditions to an index of structural characteristics of agriculture.
There are few studies on the typology of regions in the literature regarding farm size. Guiomar et al. (2018) [16] found that, at the European level, typologies usually focus on farming systems or on rural types. The multiple dimensions of rural development often lead to rural typologies that include variables connected to agriculture, including farm structure, agricultural land, labour and land productivity, resource structure, and so on. Since agriculture is the most common activity in rural areas, a better understanding of the structural characteristics of agriculture allows for future rural development strategies to be more adequately defined. Identifying regional disparities and the position of Serbia in relation to EU countries is significant for harmonizing agricultural policies and for determining a benchmark on which a template can be based for the future development of both agriculture and rural areas in Serbia.
In recent years, there has been an agreed direction about new challenges of agriculture, such as the production of more healthy food, adaption on climate change, protection of natural resources, and landscape conservation [17], and the CAP reform for 2014–2020, introduced in 2013, gave more importance to the environment and the position of farmers in the food chain. More equitable distribution of direct payments between the member states was sought by abolishing payments based on “historical right” [18]. This reform also leads to the further rebalancing of payments between the CAP’s two pillars by redistributing funds from the first to the second through rural development policy [19]. This reform also introduced the Small Farmers Scheme (SFS) to support small farms, which make up a significant part of the rural economy. SFS simplified administrative procedures by removing conditionality from greening obligations and from cross-compliance penalties. These measures should improve the competitiveness of small farms by encouraging market integration [20]. One of the future focuses of the CAP, as defined in the next programming period 2021–2027, will be on small farms and the environment by setting a goal for small and medium-sized households to maintain a certain level of income in rural areas, along with sustainable resource management [21]. Despite these changes in CAP, previous research showed that CAP support in the previous period increased the income disparity between small, medium-sized, and large farms in the EU in favour of larger farms [22].
Serbia’s strategic goal is EU accession, and harmonizing Serbia’s agricultural policy and the CAP is a prerequisite for this. In the early 1990s, significant changes began in Serbia in the direction of establishing an economic system built on principles of an open-type economy based on market principles. Agricultural policy in Serbia had for years favoured large state farms, which were considered to be the bearers of extended reproduction in agriculture, whereas family farms (usually small farms) were neglected. This model of development resulted in Serbia being less competitive than EU countries due to lower agricultural productivity [23]. Moreover, previous studies have shown lower technical efficiency in the Western Balkan’s [24] and Serbia’s [25] agriculture relative to EU countries. The main reason for this is a fragmented farm structure, which further leads to lower productivity and especially labour productivity. The transition in Serbia followed a similar path to other CEEC, but this process was much slower and was strongly influenced by a complex economic, social, and political environment that resulted in war, hyperinflation, and UN sanctions, as well as a host of other issues. However, in contrast to most CEEC, Serbia’s transition process and land privatization did not significantly affect farm structure, since private farms already existed in the pre-transfer period, and land reforms from the transitional period did not contribute to an increase in farm size [26]. Today, Serbia’s agricultural policy is geared towards supporting small, commercially oriented family farms due to these farms’ significant capacities and the fact that they create a very significant part of the total agricultural production. Namely, a long-term policy should be oriented toward the creation of a better market and good economic position for agricultural producers [27]. In order to achieve the goals of the Strategy of Agriculture and Rural Development for 2014–2024 [28], one of the priorities defined was strengthening the social structure and social capital in rural areas, which is directly related to small farms.
Since 2000, Serbian agricultural policy has focused on resolving issues involving agriculture and the situation that arose as a result of the crisis of the 1990s. Initially, the basic direction of development was support for family farms in order to alter production structure. A shift in Serbian agricultural policy came in 2004, when there was a systemic change in how state support was directed and which has since been intended exclusively for registered agricultural farms. The goal of this reformed agricultural policy was to increase the competitiveness of commercial family farms through a shift in support mechanisms from a policy of price and income stimulation to one of investment stimulation. Since 2007, the system of direct payments per livestock unit or hectare of area sown have been expanded, and input subsidies and support for investments in modernizing agriculture have increased [29]. Although direct payments are the predominant form of agricultural support in Serbia, the mechanism, procedures, and criteria for implementation change frequently and there is a lack of a clear vision for agriculture, which leads to the policy only partially impacting agricultural development. Overall, the share of support for rural development, as well as the share of support for general services, is generally low. Support for rural development was mainly related to the first pillar, i.e., improving competitiveness, whereas agro-ecological measures were focused on promoting organic food production and preserving plant and genetic resources [30]. This strong orientation toward direct payments and input subsidies has resulted in an unbalanced distribution of funding among different sectors and regions, and a consequence of this has been low levels of investments in small- and medium-sized farms, particularly in lagging regions [31].
Serbian agricultural policy reforms are carried out in accordance with existing EU integration processes; however, progress in implementing requirements related to harmonization with the CAP has been limited [26]. There has been progress in setting up institutional structures to implement the Instrument for Pre-Accession Assistance for Rural Development (IPARD) [31], but the IPARD II program for Serbia is focused on medium and large farms, so its impact on agricultural development is likely to be limited. Furthermore, funds from this program are insufficient for any significant improvement, in both agricultural production and the quality of life of the rural population [32].
In Serbia, sectors such as milk production are relatively highly dependent on production coming from small farms. In this context, the question arises as to how the growth of production will be ensured in the conditions of reducing the number of such farms in the future [33]. In addition, such farms are important from the aspect of socio-economic sustainability of rural areas. Considering the importance of small farms, it is necessary to also direct national programs towards rural development measures that can contribute to developing small farms through improving competitiveness and the possibility of diversification. The issue of small farms in Serbia is primarily a social issue, i.e., the demographic sustainability of rural areas in large parts of the country. For this reason, the traditional model of agricultural policy based on coupled payments is not suitable for all types of farms. There is a need to respect the spatial approach, which would include, among other things, the regionalization of agricultural policy and assigning greater importance to institutional support measures. Regionalization is necessary not only in agricultural policy but also in overall economic policy.
This paper is divided into several segments. Together with the introduction, a theoretical review provides an overview of the evolution of EU and Serbian agricultural policies and focuses on small farms. This is followed by a methodological segment and then the results and discussion. In the end, we will present concluding considerations and recommendations for future development strategies.

2. Material and Methods

This study includes Serbia and EU. In order to create a map that provides a regional distribution of small farms, the total number of units included in the analysis is 691, of which 667 are at NUTS 3 and 24 at NUTS 2 (for Germany, due to a lack of lower-level data), with all areas defined as intermediate and predominantly rural according to EU urban–rural typology as defined by the Tercet regulation (Regulation (EU) 2017/2391) [34]. The NUTS classification (Nomenclature of Territorial Units for Statistics) is a hierarchical system subdividing the territory of the European Union into regions at three levels (NUTS 1, 2, and 3), as well as for countries that are candidates for EU membership. The NUTS 3 level corresponds to the smaller territorial units for specific socio-economic diagnoses [16], which allows for regional analysis. According to this typology, we did not include primarily urban regions (≥80% live in urban clusters) in the analysis because agriculture is not a predominant activity in these areas. Although classified as intermediate or predominantly rural, certain areas were excluded from the analysis due to insufficient data resulting from being newly classified as NUTS 3 areas or because they are located outside of the European continent. We used Eurostat [35] as the basic database for the EU agricultural segment (some supplemental data was taken from Member States’ national databases), and we included data obtained from Farm Structure Surveys (FSS) and the EU’s Agricultural Census. All EU Member States are obliged to carry out an FSS, which enables comparisons between countries as well as regions, since it is conducted up to the NUTS 3 level. These surveys are conducted as pilot surveys every 3 or 4 years and once every 10 years as part of a Census of Agriculture [4]. Available data for NUTS 3 for all EU Member States is compiled in the Agriculture Census 2010 (or 2009), with the exceptions of France, Poland, the United Kingdom (Farm Structure Surveys 2003–2007) [35], and Croatia (2003 Agriculture Census) [36]. Data from Serbia was taken from the 2012 Census of Agriculture [15]. It is necessary to mention the issue of lack of synchronization of data for Serbia and the EU, primarily at the regional level, which is the key reason for the lack of more detailed studies comparing the regions of Serbia and the EU. The Statistical Package for the Social Sciences program—SPSS Statistics 20.0—was used for the purposes of this paper.
This research is part of wider research in which, using Factor Analysis (FA), a model of the rurality of the EU and Serbia regions was created (the model is given in Appendix ATable A1). The second factor within the given model is the created ASC Index. Two variables that indicate the structural characteristics of agriculture are as follows:
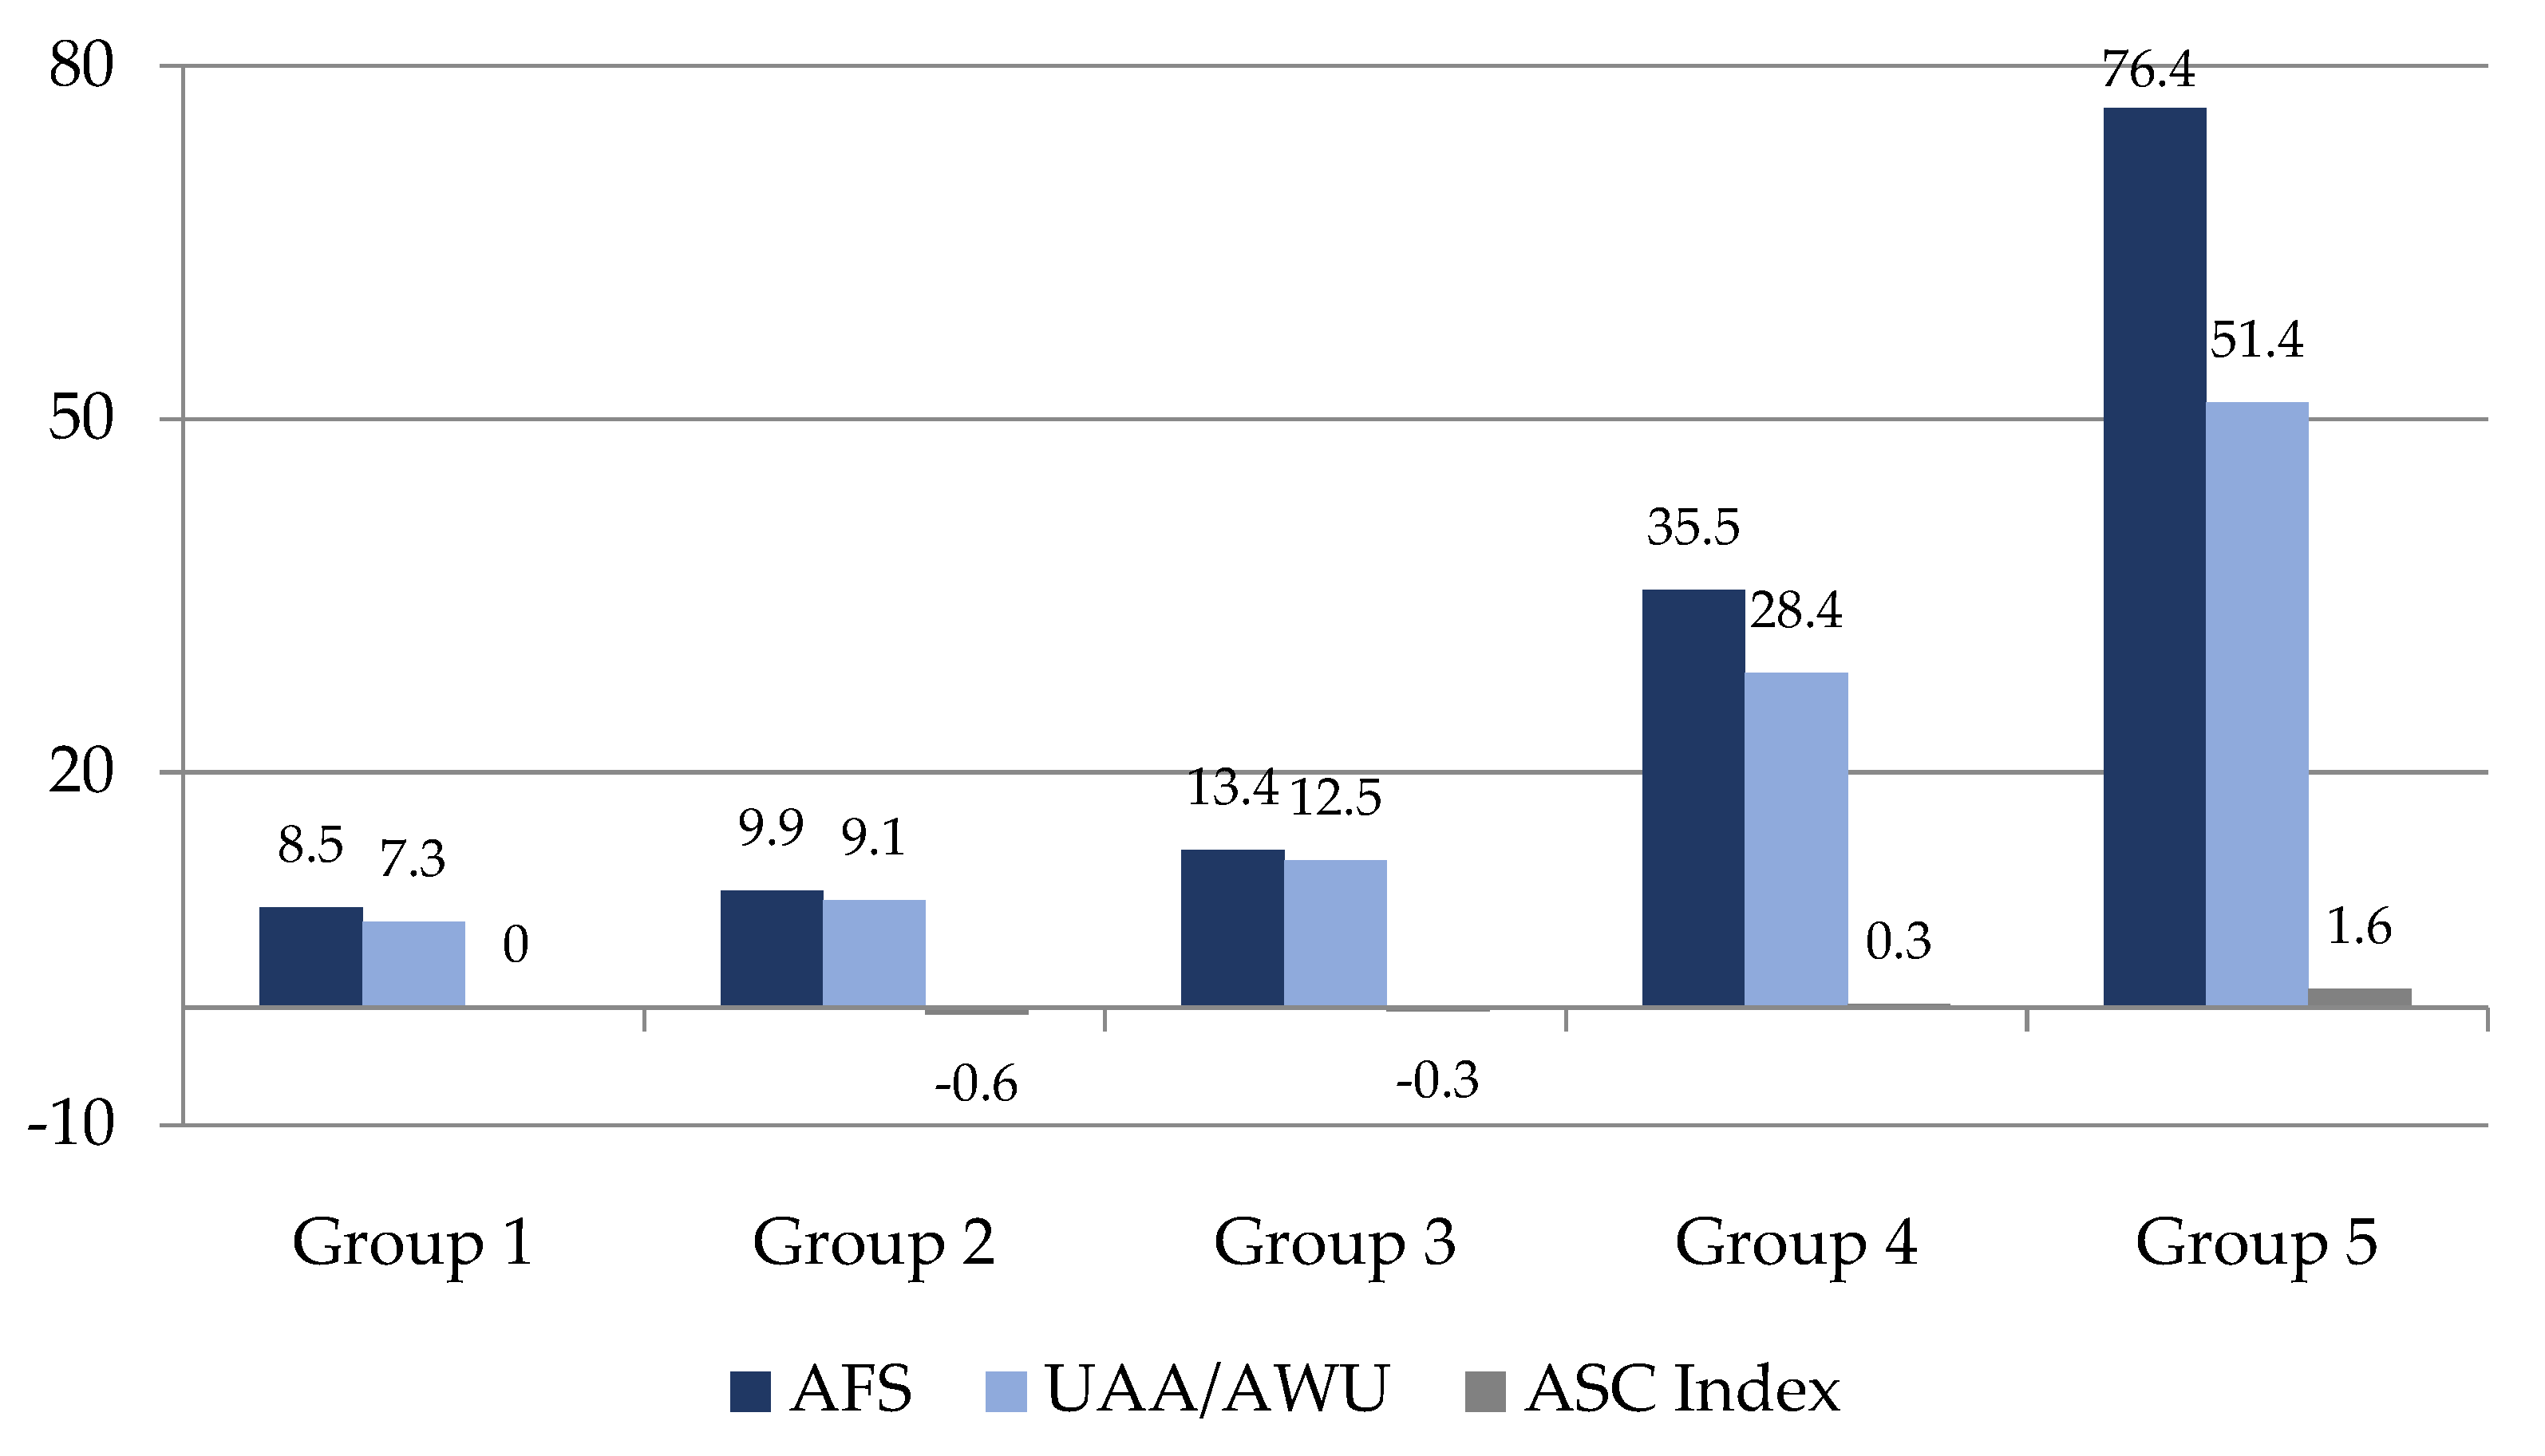
  • Average farm size (AFS) expressed in hectares per holding;
  • Resource structure as a land/labour relationship: Utilised Agricultural Area (UAA) by Annual Work Unit (AWU).
In order to create an Index of Agricultural Structural Characteristics (abbreviation ASC Index), Factor Analysis was used. The Basic FA equation can be represented in a matrix form as:
Z px 1 = λ p x m F mx 1 +   ε px 1
where Z is a p-vector of variables, λ is a p x m matrix of factor loadings, F is an m-vector of factors, and ε is a p-vector of error (unique or specific) factors [37]. Factor loadings represent the correlation between the original variables and a factor, which indicates how much of the variation in the original variable is explained by the factor [38]. Factor Analysis provides a basis for creating a new set of variables that include the character and nature of the original variables in the form of factor scores. Factor scores are standardized to have a mean of 0 and a standard deviation of 1. The factor scores of the second factor within the Table A1 model represent the ASC Index. To compare the structural patterns of NUTS 3, quintiles were constructed, and 691 NUTS 3 were classified into five categories of approximately equal numbers of NUTS 3, creating a regional typology presented through a map. The Kaiser–Meyer–Olkin (KMO) test (a general rule to agree to a value greater than 0.5 in this test) and the Bartlett’s test were used to verify the model.
In addition to local agro-ecology, farm size depends on socio-economic conditions. Accordingly, a correlation analysis (the Pearson correlation matrix) of the ASC Index and the selected four variables was performed. The variables included in the correlation are shown in Table 1. Eurostat [35] was also used.
As one of the basic limitations of this paper, it is necessary to mention that the economic size of farms (SO) for the comparative analysis of Serbia and the EU was not used. Instead, this research uses the UAA and numerous papers presented in the Introduction section. Namely, in Serbia, there is a strong correlation between UAA and SO measures, but it is necessary to mention that the general conclusion for EU countries cannot be drawn from the example of Serbia, considering the extensive character of agricultural production in Serbia. Because of that, future research will be oriented to a more detailed comparative analysis using the measure of the economic size of farms.

3. Results and Discussion

Table 2 shows the farm structure in Serbia and the EU. There are more than 631 thousand agricultural holdings in Serbia, but despite reaching utilized agricultural area of 3.5 million ha, the average farm size is only 5.4 ha [15]. Contrary to this, in the EU, the average farm size is about 16.1 ha. In addition, the share of UAA farmed farms up to 2 ha and over 10 ha in Serbia is significant, so middle-sized farms are concentrated in Serbia.
In order to examine the structural characteristics of agriculture NUTS 3 observation units, we created an ASC Index based on two indicators: average farm size (expressed in hectares per farm) and resource structure (UAA/AWU). The result of the Kaiser–Meyer–Olkin test (0.53) was adequate and Bartlett’s Test of Sphericity (sig. 0.000) was significant. The total variance explained was 88,868%, with eigenvalues of 1.77. We used Principal Component Analysis (PCA) as the extraction method. Each NUTS 3 was evaluated with respect to these two indicators, wherein the factor scores are in the range of −2 to 4. The results are shown in Scheme 1. The group with the highest average farm size as well as a larger number of hectares per AWU in agriculture is the group with the darkest colour. This is a group with favourable structural characteristics of agriculture (Group 5).
It should be noted that in Group 1, there are regions with small farms averaging 8.5 hectares per holding and an unfavourable agricultural resource structure averaging 7.3 hectares per AWU (Figure 1). The unfavourable agricultural resource structure is primarily indicative of over-employment in this sector, which, from a development perspective, is an unfavourable trend. Moreover, resource structure influences the predominant use of mechanical or bio-chemical technology, which defines agricultural growth and the level of partial productivity (labour and land). The average farm size and resource structure are increasing, starting from Group 1. Lastly, Group 5 has an average of 76.4 hectares per farm and 51.4 hectares per AWU. Regions dominated by large farms usually have a favourable land to labour ratio or resource structure, which also affects agricultural productivity. Here, we focused on several regional inequalities within the structural characteristics of agriculture (Scheme 1).
(I)
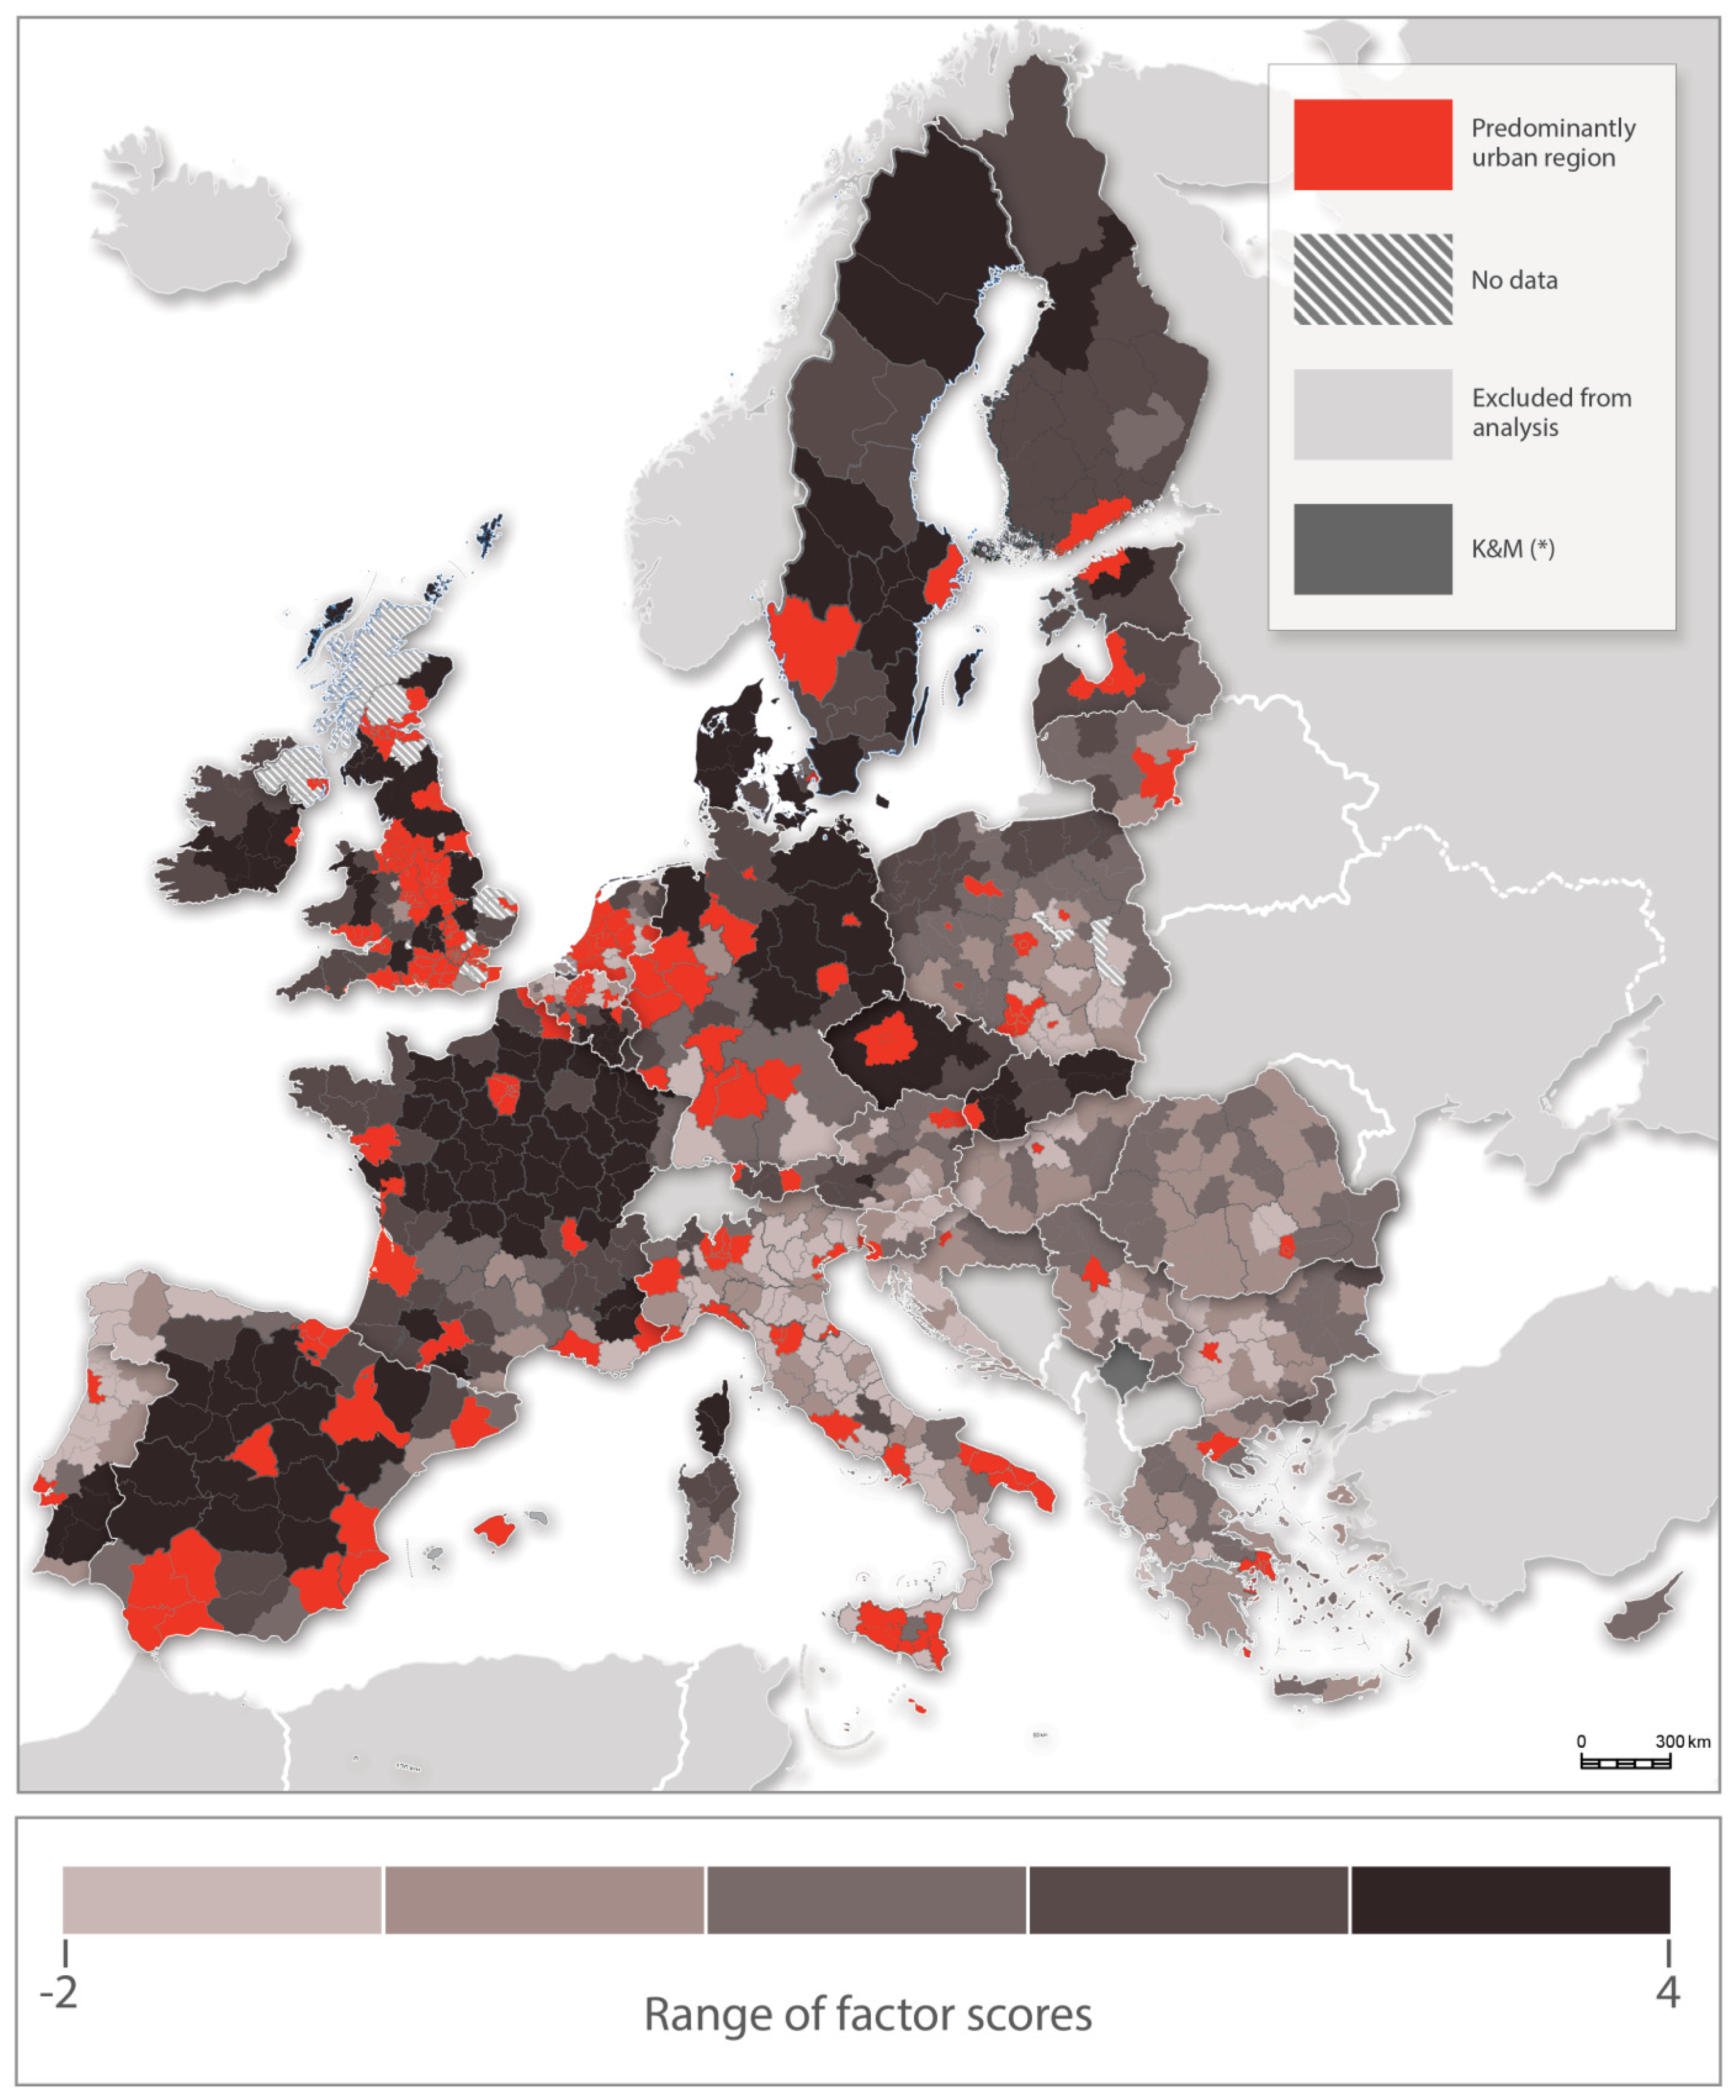
According to the agricultural models, there is a noticeable difference between the northern and southern models. In the 1990s, EU agricultural policy makers officially recognized two models of European agriculture—one southern, one northern. The main representatives of the southern model of agriculture are the Mediterranean countries (primarily Italy, and later Greece and Portugal). One of the main features of this model is small farms (size of holdings expressed in the number of hectares per holding). However, agricultural farms in Spain, and especially large farms in the middle of the country, have begun to deviate from the standard characteristics of the EU’s southern model. Differences in the average size of Spanish farms indicate a dual character in Spanish agriculture, which is characterized not only by small farms that have elements of Mediterranean farms, but also by extremely large farms that are similar to the northern model [39]. As illustrated in Scheme 1, the central part of Spain and one segment of Portugal contain large holdings and a favourable resource structure (Group 5). Although European agriculture is generally considered to be experiencing a steady decline in the number of farms with a trend of growth in average farm size, the Mediterranean countries (Portugal, Italy, Greece, and Cyprus), i.e., the countries most severely hit by the 2008 economic crisis, have relatively low rates of decline in the number of farms, which can be explained by the workforce being unable to be employed in the secondary or tertiary sector [40]. This is one of the main causes of this unfavourable agricultural resource structure.
Unlike the southern model, the northern model is essentially a north-central model and involves large farms mainly located in the northern and central parts of the EU (e.g., the UK, Ireland, France, Germany, and Denmark). The countries that acceded to the EU in 1995, and Sweden and Finland in particular are part of the northern model of European agriculture according to their average farm size, even though the Scandinavian model has specific characteristics mostly related to different climate conditions. Within the northern model, the law of concentration and centralization of capital is stronger. France is also representative of the northern type, even though one part of the country has agronomic conditions similar to other Mediterranean countries. Nevertheless, there are different characteristics of agriculture within the northern model. For example, according to Arnalte-Alegre and Ortiz-Miranda (2013) [39], the northern model of European agriculture can be expanded to include the Danish model, which has farms that have been modernized with appropriate institutional support, and a UK-based model, which has different agrarian systems, including large estates dating back to the 18th century and had an early diffusion of technology. The EU’s most modernized agriculture is in the Netherlands and Denmark [41], and this significantly contributes to their agricultural productivity. The model of agriculture across the EU is not homogeneous due to numerous differences in farm size and agricultural production opportunities, which strongly influence the goals defined within the CAP. Due to the consistent implementation of the CAP, the agricultural sectors in the oldest EU member states have made significant progress, primarily through the use of new machinery and technology, which has further led to increased production and labour productivity [42].
(II)
Expansion to the south revealed a mismatch between the founding states of the EU and the new southern members. According to the same principle, eastern enlargement into the former socialist states deepened differences in the EU concerning the structure of agriculture. This was demonstrated by Giannakis and Bruggeman (2015) [40] who, based on indicators of Gross Value Added (GVA) by the economy, labour, and land productivity, classified EU countries according to the level of economic performance achieved by their agricultural sectors. They found high levels in the Benelux, Denmark, Germany, France, and the UK, and recorded the lowest levels in the CEEC, with the exception of the Czech Republic. The Czech Republic has proven to be a country with a high level of agricultural economic performance, and this may be due to the restructuring of Czech agriculture, within which large farms continue to exist. As Guiomar et al. (2018) [16] found, approximately 10% of the largest Czech farms occupy about 80% of agricultural land, whereas in other former socialist countries such as Slovenia, Poland, and Romania, about 10% of the largest farms occupy approximately 40% of the agricultural area.
Our results also coincide with the typology from Giannakis and Bruggeman (2015) [40], because larger farms and a favourable resource structure are prerequisites for achieving better economic performance in agriculture (higher labour and land productivity). According to the structural characteristics of CEEC in Scheme 1, most of the regions in these countries belong to the southern model of agriculture, with some discrepancies (former Czechoslovakia). The pace of change in the CEEC’ agriculture depended on the impact of labour-saving technology, macroeconomic environment, farm structure, socio-economic characteristics of farmers and workers, and policy intervention in the sector [43]. Across the former Soviet bloc, agricultural land was collectivized, which changed rural areas and created large state or collective farms, whereas considerable investment in industrialization strategies left infrastructure, particularly in border areas, rather undeveloped [44]. This meant that pre-transition agriculture of these states functioned according to the Soviet model of collective agriculture. As a result, most small farms disappeared due to nationalization and collectivization [16]. Poland, however, was an exception. In Poland, as in the former Socialist Federal Republic of Yugoslavia (SFRY), a large proportion of small, private farms known as agro-industrial complexes continued to exist in addition to large-state farms, which was indicative of the dual character of agriculture and agricultural policies in these countries. Farms in most regions in Poland have a small average size and resource structure, and larger farms are only found in to the north and west (Scheme 1). Wiśniewski and Rudnicki (2016) [45] indicate that over-employment in agriculture, i.e., hidden unemployment, is a major disadvantage for Polish agriculture. Their study pointed to a large gap between Poland and Western Europe in terms of labour force participation in agriculture, where the problem can be effectively addressed through job creation in the non-agricultural sector.
(III)
According to the 2012 Census of Agriculture [15], there are 631,552 farms in Serbia, of which 99.5% are classified as family farms with an average size of 4.5 hectares per farm, and they cover about 66% of farmland. The remainder belongs to legal entities and entrepreneurs with an average of 204.1 hectares per farm. This dual structure dates back to the period of central planning, in which large, state-owned farms or enterprises were created, but small, private, mostly family farms remained alongside the Yugoslav agro-industrial complex. In the EU, however, family farms with an average size of 10 hectares account for about 69% of farmland, as opposed to corporate farms, which are on average 15 times larger (152 hectares) [46]. Support for family farms is important for the vitality of rural areas. One of the important goals of rural development policy is to enable young farmers and their families to remain in rural areas. The problem posed when analysing family farms, both in the EU and especially in Serbia, is farm managers’ age and low level of education. Namely, the average age of farmers from family agricultural holdings in Serbia is about 59 years old [15]. According to the first two identified regional differences, Serbian agriculture corresponds to the southern model of European agriculture, in which small farms predominate and the resource structure is unfavourable. Moreover, given the similar historical heritage of a centrally planned economy, Serbian agriculture also corresponds to the structure of agriculture in most CEEC.
According to Scheme 1, the Serbian region of Vojvodina (part of Serbia-North), in comparison to other regions (with some exceptions), stands out in relation to the structural characteristics of agriculture included in our analysis. The average farm size in Vojvodina is 16.1 hectares per holding, whereas there are 12.2 hectares per AWU in agriculture. In Vojvodina, 1646 million hectares of soil are arable, the soil is some of the most fertile in Europe, and the agro-ecological conditions are optimal for economic production [47]. On the other hand, Serbia-South, as a NUTS 1 observation unit, covers all other districts and the average farm size is 11.3 hectares per farm with 3.7 hectares per AWU. It is also necessary to consider the geographical or natural conditions of farming. For example, unlike the lowland areas in Vojvodina, there are smaller farms in the hilly/mountainous regions in Serbia-South. These differences are confirmed by the analysis of the economic size of the farm measured by SO at NUTS 3 level in Serbia (Table A2). There is a strong correlation between the size of farms measured by SO and UAA (0.933 at the 0.00 level), which indicates no significant differences in drawing conclusions concerning observing the size of farms when it comes to Serbia. Of course, it is important to note that a general conclusion cannot be drawn from this, especially for developed EU countries. Nevertheless, these results are another indicator of the extensiveness of Serbian agriculture. Furthermore, when it comes to the size of the farm measured by the SO, it is even four times lower in Serbia than is the case of the average for EU countries [48].
Correlation analysis (Table 3) indicates a statistically significant (at the 0.01 level) correlation between the ASC Index and four variables: GDP per capita, labour productivity, population density, and a binary variable indicating whether NUTS 3 was once under a centrally planned system. Looking first at the direction of correlation, the ASC Index is negatively correlated with the population density and the binary variable. A negative correlation with CP_regime indicates that regions with a centrally planned system in the past make up the majority of those with poor resource structures and smaller average farm sizes. There is a positive relationship between economic variables (GDP and labour productivity), indicating that economically stronger regions have more favourable structural characteristics of agriculture as viewed through the ASC Index. However, farm size and the process of structural change are influenced by many factors, which does not necessarily mean that economically strong regions have larger farms and a more favourable resource structure. Examples of this are some of the regions in the Netherlands, Belgium, northern Italy, etc. Economically strong regions, which rely on secondary and tertiary sectors and have average small or medium farms, base agricultural development on linking it to the non-agricultural sector through diversification of activities or through additional employment in the non-agricultural sector. In Italy, about 25% of farmers are employed in the non-agricultural sector in addition to farming, with non-agricultural income contributing around EUR 18 billion to Italian agriculture, meaning income from the non-agricultural sector goes to farms [41]. Meraner et al. (2015) [49] found that farms are more likely to diversify in areas with high population density by engaging in additional activities such as agro-tourism, direct sale of farm products, etc. This model of the rural non-agricultural economy is becoming increasingly prevalent in rural areas of the Netherlands, Belgium, Germany, and France. It should be noted that the correlation of ASC Index and CP_regime is the only medium strong correlation (greater than 0.3), whereas other correlations are weak.
Giannakis and Bruggeman (2015) [40] identify low levels of investment in agriculture as a serious issue in Mediterranean and Eastern European countries, which explains the adoption of measures that are directly aimed at improving the competitiveness of agricultural holdings, as opposed to northern and central Europe, where the policy focus is on improving the environment and quality of life in rural areas. This issue is also present in Serbia’s agriculture, which has a structure approximate to other CEEC [50]. Thus, Serbia’s unfavourable farm and resource structures significantly limit the development of agriculture.

4. Conclusions

Based on the obtained results, it is possible to summarize the following conclusions:
  • In the context of structural characteristics, there is still a noticeable difference between the northern and southern models of agriculture. EU agricultural policymakers officially recognized these models in the 1990s. Thus, it could be concluded that the CAP reforms did not significantly reduce these regional disparities. Furthermore, there is a mismatch between the old member states and the new member states within the EU. According to the same principle, eastern enlargement into the former socialist states deepens differences in the EU concerning the structure of agriculture.
  • There is a positive relationship between economic variables (GDP and labour productivity), indicating that economically stronger regions have more favourable structural characteristics of agriculture as viewed through the ASC Index. A negative correlation with the CP regime indicates that regions with a centrally planned system in the past make up the majority of those with poor resource structures and smaller average farm sizes.
  • According to the results of the ASC Index, most regions in Serbia belong to the first two groups, and its agriculture corresponds to the southern model of European agriculture, in which small farms predominate, and the resource structure is unfavourable. This represents a significant obstacle to further agricultural development. In addition, excessive labour supply in agriculture and low labour productivity are changing the direction of development strategy, and diversification should be one of the new goals. Diversification provides alternative sources of income, reduces unemployment, encourages the outflow of labour from agriculture, and increases the profitability of farms which would significantly contribute to agricultural competitiveness. Furthermore, farmers’ associations can also make meaningful contributions. Such development strategies should be a benchmark for future directions in Serbian agricultural development. An adequate agricultural policy is needed to reduce regional disparities. In this case, the regionalization of agricultural policy would potentially solve the problem of less favourable regions. In addition to thegreat potential for improving agriculture and farming in Serbia, agricultural policymakers should pay special attention to small farms in regions that have the potential to be competitive and farms that are particularly important for the social sustainability of rural areas.

Author Contributions

Conceptualization, Ž.J. and S.Z.; methodology and investigation, Ž.J., B.M. and S.Z.; writing—original draft preparation, review and editing, Ž.J., S.Z., B.M. and D.Đ.; visualization, Ž.J. and B.M.; supervision, S.Z., B.M. and D.Đ. All authors have read and agreed to the published version of the manuscript.

Funding

This research received no external funding.

Institutional Review Board Statement

Not applicable.

Informed Consent Statement

Not applicable.

Data Availability Statement

The datasets generated for this study are available on request to the corresponding author.

Acknowledgments

This research was supported by the Science Fund of the Republic of Serbia, Program DIASPORA, #GRANT No 6406679, AgriNET.

Conflicts of Interest

The authors declare no conflict of interest.

Appendix A

Table A1. Defined model on the NUTS 3 level: Serbia and EU.
VariableFactor
1234
Share of employees in the primary sector0.819−0.2280.002−0.022
GDP per capita0.8720.1280.0400.133
Share of primary sector in GVA0.788−0.1010.210−0.008
Total labor productivity0.8610.2850.2230.069
Labor productivity in the primary sector0.6920.2780.403−0.107
Average farm size0.2240.8670.053−0.145
Resource structure of agriculture0.2870.8920.1100.038
Aging coefficient0.0010.0650.8200.076
Coefficient of total dependence0.1230.1410.680−0.043
Natural increase rate0.4640.2500.623−0.068
Population density0.397−0.385−0.1600.576
Share of forests in the total area0.138−0.1320.0050.934
Factor extraction method: Principal component analysis.
Factor rotation method: VARIMAX with Kaiser normalization.
Rotation achieved after 5 iterations.
Source: the authors’ calculations.
Table A2. Farm structure in the Republic of Serbia on the NUTS 3 level.
UAA per Farm in haSO per Farm in EUR
REPUBLIC OF SERBIA6.168,642
Zapadnobačka oblast10.5814,651
Južnobanatska oblast13.5715,352
Južnobačka oblast10.4115,363
Severnobanatska oblast14.0017,035
Severnobačka oblast13.6020,595
Srednjobanatska oblast17.8118,862
Sremska oblast9.9215,830
Zlatiborska oblast4.616,115
Kolubarska oblast5.278,700
Mačvanska oblast4.228,717
Moravička oblast3.896,090
Pomoravska oblast4.686,320
Rasinska oblast3.016,433
Raška oblast3.945,169
Šumadijska oblast4.766,705
Borska oblast6.976,114
Braničevska oblast6.537,266
Zaječarska oblast5.906,411
Jablanička oblast2.664,799
Nišavska oblast3.034,182
Pirotska oblast5.364,145
Podunavska oblast4.806,568
Pčinjska oblast3.034,396
Toplička oblast3.665,979
Source: the authors’ calculations on basis of [51].

References

  1. Jürgenson, E.; Rasva, M. The Changing Structure and Concentration of Agricultural Land Holdings in Estonia and Possible Threat for Rural Areas. Land 2020, 9, 41. [Google Scholar] [CrossRef] [Green Version]
  2. Rachele, R. Small Farms’ Role in the EU Food System. European Parliamentary Research Service. Available online: https://www.europarl.europa.eu/RegData/etudes/BRIE/2022/733630/EPRS_BRI(2022)733630_EN.pdf (accessed on 28 September 2022).
  3. Khalil, C.A.; Conforti, P.; Ergin, I.; Gennari, P. Defining Small Scale Food Producers to Monitor Target 2.3 of the 2030 Agenda for Sustainable Development; FAO Statistics Division Working Paper Series ESS/17-12; Food and Agriculture Organization of the United Nations (FAO): Rome, Italy, 2017; 51p, Available online: www.fao.org/3/a-i6858e.pdf (accessed on 10 November 2021).
  4. European Commission. Small and Large Farms in the EU—Statistics from the Farm Structure Survey. Source: Statistics Explained. 2018. Available online: http://ec.europa.eu/eurostat/statisticsexplained/ (accessed on 10 November 2021).
  5. Ashley, C.; Maxwell, S. Rethinking Rural Development. Dev. Policy Rev. 2001, 19, 395–425. [Google Scholar] [CrossRef]
  6. Hazell, P.B.R. Is there a future for small farms? Agric. Econ. 2005, 32, 93–101. [Google Scholar] [CrossRef] [Green Version]
  7. Jurjević, Ž.; Bogićević, I.; Đokić, D.; Matkovski, B. Information technology as a factor of sustainable development of Serbian agriculture. Strateg. Manag. 2019, 24, 41–46. [Google Scholar] [CrossRef]
  8. Rocha, R.R. Success factors for rural resilience: The case of small scale farms in Italy. In Proceedings of the International Conference on Food Quality, Safety and Security, Colombo, Sri Lanka, 24–25 October 2017; Volume 1, pp. 9–17, ISSN 2602-859X. [Google Scholar] [CrossRef]
  9. Hazell, P.B.R. Five big questions about five hundred million small farms. In Proceedings of the Conference on New Directions for Smallholder Agriculture, Rome, Italy, 24–25 January 2011; pp. 24–25. [Google Scholar]
  10. Volkov, A.; Balezentis, T.; Morkunas, M.; Streimikiene, D. Who Benefits from CAP? The Way the Direct Payments System Impacts Socioeconomic Sustainability of Small Farms. Sustainability 2019, 11, 2112. [Google Scholar] [CrossRef] [Green Version]
  11. Ardakani, Z.; Bartolini, F.; Brunori, G. New Evaluation of Small Farms: Implication for an Analysis of Food Security. Agriculture 2020, 10, 74. [Google Scholar] [CrossRef] [Green Version]
  12. Matkovski, B.; Đokić, D.; Zekić, S.; Jurjević, Ž. Determining Food Security in Crisis Conditions: A Comparative Analysis of the Western Balkans and the EU. Sustainability 2020, 12, 9924. [Google Scholar] [CrossRef]
  13. Senger, I.; Borges, J.A.R.; Machado, J.A.D. Using the theory of planned behavior to understand the intention of small farmers in diversifying their agricultural production. J. Rural Stud. 2017, 49, 32–40. [Google Scholar] [CrossRef]
  14. Chaplin, H.; Gorton, M.; Davidova, S. Impediments to the Diversification of Rural Economies in Central and Eastern Europe: Evidence from Small-scale Farms in Poland. Reg. Stud. 2007, 41, 361–376. [Google Scholar] [CrossRef]
  15. Statistical Office of the Republic of Serbia. Census of Agriculture. 2012. Available online: http://popispoljoprivrede.stat.rs/?lang=en (accessed on 10 November 2021).
  16. Guiomar, N.; Godinho, S.; Pinto-Correia, T.; Almeida, M.; Bartolini, F.; Bezak, P.; Biró, M.; Bjørkhaug, H.; Bojnec, Š.; Brunori, G.; et al. Typology and distribution of small farms in Europe: Towards a better picture. Land Use Policy 2018, 75, 784–798. [Google Scholar] [CrossRef]
  17. Raimondo, M.; Caracciolo, F.; Nazzaro, C.; Marotta, G. Organic Farming Increases the Technical Efficiency of Olive Farms in Italy. Agriculture 2021, 11, 209. [Google Scholar] [CrossRef]
  18. European Commission. Overview of CAP Reform 2014–2020. 2013. Available online: http://ec.europa.eu/agriculture/policy-perspectives/policy-briefs/05_en.pdf (accessed on 10 November 2021).
  19. Matthews, A. Greening CAP Payments; The Institute of International and European Affairs: Dublin, Ireland, 2013. [Google Scholar]
  20. European Commission. The Small Farmers Scheme. 2017. Available online: https://ec.europa.eu/info/sites/info/files/food-farming-fisheries/key_policies/documents/small-farmers-scheme_en.pdf (accessed on 10 November 2021).
  21. Matthews, A. The EU’s Common Agricultural Policy Post 2020: Directions of Change and Potential Trade and Market Effects; International Centre for Trade and Sustainable Development (ICTSD): Geneva, Switzerland, 2018. [Google Scholar]
  22. Guth, M.; Smędzik-Ambroży, K.; Czyżewski, B.; Stępień, S. The Economic Sustainability of Farms under Common Agricultural Policy in the European Union Countries. Agriculture 2020, 10, 34. [Google Scholar] [CrossRef] [Green Version]
  23. Erjavec, E.; Mortensen, K.; Volk, T.; Rednak, M.; Eberlin, R.; Ludvig, K. Gap analysis and recommendations. In Agricultural Policy and European Integration in Southeastern Europe; Volk, T., Erjavec, E., Mortensen, K., Eds.; Food and Agricultural Organization of the United Nations: Budapest, Hungary, 2014; pp. 39–60. [Google Scholar]
  24. Đokić, D.; Zekić, S.; Jurjević, Ž.; Matkovski, B. Drivers of technical efficiency in agriculture in the Western Balkans and New EU Memeber States. Custos E @Gronegócio 2020, 16, 2–15. [Google Scholar]
  25. Marcikić Horvat, A.; Matkovski, B.; Zekić, S.; Radovanov, B. Technical efficiency of agriculture in Western Balkan countries undergoing the process of EU integration. Agric. Econ. 2020, 66, 65–73. [Google Scholar] [CrossRef]
  26. Bogdanov, N.; Rodić, V.; Vittuari, M. Structural change and transition in the agricultural sector: Experience of Serbia. Communist Post-Communist 2017, 50, 319–320. [Google Scholar] [CrossRef]
  27. Matkovski, B.; Radovanov, B.; Zekić, S. The Effects of Foreign Agri-food trade Liberalization in South East Europe. Econ. Cas. 2018, 66, 945–966. [Google Scholar]
  28. Government of the Republic of Serbia. Strategy for Agriculture and Rural Development of Republic of Serbia 2014–2024; Government of the Republic of Serbia: Belgrade, Serbia, 2014. [Google Scholar]
  29. Bogdanov, N.; Božić, D. Review of Agriculture and Agricultural Policy in Serbia. In Agriculture in the Western Balkan Countries; Volk, T., Ed.; Leibniz Institute of Agricultural Development in Central and Eastern Europe (IAMO): Halle, Germany, 2010; pp. 189–218. ISSN 1436-221X. ISBN 978-3-938584-51-4. [Google Scholar]
  30. Bogdanov, N.; Rodić, V. Agriculture and Agricultural Policy in Serbia. In Agricultural Policy and European Integration in Southeastern Europe; Volk, T., Erjavec, E., Mortensen, K., Eds.; Food and Agricultural Organization of the United Nations: Budapest, Hungary, 2014; pp. 153–171. [Google Scholar]
  31. FAO. Smallholders and Family Farms in Serbia; Country Study Report 2019; FAO: Budapest, Hungary, 2020. [Google Scholar] [CrossRef]
  32. Zekić, S.; Matkovski, B.; Kleut, Ž. IPARD funds in the function of the development of the rural areas of the Republic of Serbia. Econ. Horiz. 2016, 18, 169–180. [Google Scholar] [CrossRef] [Green Version]
  33. SEEDEV. Sektorska Analiza Proizvodnje i Prerade Mleka u Republici Srbiji. (eng. Sector Analysis of Milk Production and Pro-cessing in the Republic of Serbia). 2021. Available online: http://www.minpolj.gov.rs/wp-content/uploads/datoteke/IPARD/Sektorska%20analiza%20MLEKO.pdf (accessed on 10 November 2021).
  34. Tercet. Regulation (EU) 2017/2391 of the European Parliament and of the Council of 12 December 2017 Amending Regulation (EC) No 1059/2003 as Regards the Territorial Typologies. Off. J. Eur. Union. 2017. Available online: https://eur-lex.europa.eu/legal-content/EN/TXT/?uri=celex:32017R2391 (accessed on 10 November 2021).
  35. Eurostat. Database. 2021. Available online: https://ec.europa.eu/eurostat/data/database (accessed on 10 November 2021).
  36. Croatian Bureau of Statistics. 2003 Agriculture Census. 2021. Available online: https://www.dzs.hr/PXWeb/Menu.aspx?px_db=Popis%20poljoprivrede%202003&px_language=hr (accessed on 10 November 2021).
  37. Sharma, S. Applied Multivariate Techniques; John Wiley and Sons, Inc.: New York, NY, USA, 1996; ISBN 978-0-471-31064-8. [Google Scholar]
  38. Tabachnick, B.G.; Fidell, L.S. Using Multivariate Statistics, 6th ed.; Pearson: Boston, MA, USA, 2013; ISBN-10 0-205-89081-4, ISBN-13 978-0-205-89081-1. [Google Scholar]
  39. Arnalte-Alegre, E.; Ortiz-Miranda, D. Chapter 3 The ‘Southern Model’of European Agriculture Revisited: Continuities and Dynamics. In Agriculture in Mediterranean Europe: Between Old and New Paradigms; Research in Rural Sociology and Development; Emerald Group Publishing Limited: Bingley, UK, 2013; Volume 19, pp. 37–74. [Google Scholar] [CrossRef]
  40. Giannakis, E.; Bruggeman, A. The highly variable economic performance of European agriculture. Land Use Policy 2015, 45, 26–35. [Google Scholar] [CrossRef]
  41. Van der Ploeg, J.D.; Ventura, F.; Milone, P. Research for Agri Commitee-Structural Change in EU Farming: How can the Cap Support a 21st Century European Model of Agriculture? Research for Agri Commitee-Farm Structural Change in Western Europe and The CAP. 2016. Available online: https://www.europarl.europa.eu/RegData/etudes/STUD/2016/573428/IPOL_STU(2016)573428_EN.pdf (accessed on 10 November 2021).
  42. Nowak, A.; Janulewicz, P.; Krukowski, A.; Bujanowicz-Haraś, B. Diversification of the level of agricultural development in the member states of the European Union. Cah. Agric. 2016, 25, 55004. [Google Scholar] [CrossRef]
  43. The European Network for Rural Development. Employment and Social Inclusion. 2010. Available online: https://enrd.ec.europa.eu/sites/enrd/files/09AED062-D99D-0744-062C-2B6F6E4785FB.pdf (accessed on 10 November 2021).
  44. Gorzelak, G. Regional Policies in East-Central Europe. In Handbook of Regional Science; Fischer, M., Nijkamp, P., Eds.; Springer: Berlin/Heidelberg, Germany, 2020. [Google Scholar] [CrossRef]
  45. Wiśniewski, Ł.; Rudnicki, R. Labour input in Polish agriculture against size of agricultural holdings–spatial analysis. J. Agribus. Rural Dev. 2016, 3, 413–424. [Google Scholar] [CrossRef]
  46. The European Network for Rural Development. Family Farming. 2013. Available online: https://enrd.ec.europa.eu/sites/enrd/files/PublicationENRDperiodical-17_en.pdf (accessed on 10 November 2021).
  47. Gabrić-Molnar, I.; Teréz, K. Support to the economic development of Vojvodina from Hungary. Anal. Ekon. Fak. U Subotici (Eng. Ann. Fac. Econ. Subot.) 2019, 55, 3–15. [Google Scholar] [CrossRef]
  48. Paraušić, V.; Roljević Nikolić, S.; Subić, J. Anketa o Strukturi Poljoprivrednih Gazdinstava, Poljoprivredna Gazdinstva Prema Tipu Proizvodnje i Ekonomskoj Veličini; Republički Zavod za Statistiku: Beograd, Srbija, 2019. [Google Scholar]
  49. Meraner, M.; Heijman, W.; Kuhlman, T.; Finger, R. Determinants of farm diversification in the Netherlands. Land Use Policy 2015, 42, 767–780. [Google Scholar] [CrossRef]
  50. Zekić, S.; Kleut, Ž.; Matkovski, B.; Đokić, D. Determining agricultural impact on environment: Evidence for EU-28 and Serbia. Outlook Agric. 2018, 47, 116–124. [Google Scholar] [CrossRef]
  51. Statistical Office of the Republic of Serbia. Farm Structure 2018. Available online: https://data.stat.gov.rs/?caller=130002&languageCode=sr-Latn (accessed on 10 November 2021).
Figure 1. Mean by quintile. Source: the authors’ calculations. Note: AFS is expressed in hectares per holding; UAA/AWU is Utilised Agricultural Area by Annual Work Unit (resource structure as a land/labour relationship; ASC is an index.
Agronomy 12 02726 g001
Scheme 1. Territorial representation of ASC index across the EU including Serbia. Source: Author processing based on Factor Analysis results. Note: The specific status of Kosovo and Metohija (K and M) excluded it from the analysis. Adobe Photoshop CC 2015 and NUTS 3 maps of the European Commission were used.
Agronomy 12 02726 sch001
Table 1. Variables included in the correlation analysis.
VariableAbbreviationData Range
(Mean ± SD; Min–Max)
Gross Domestic Product (per capita in PPS)GDP(21,035.5 ± 8372.8; 4875–73,833)
Total labour productivity (Gross Value Added (GVA) of all activities per employee) (EUR perperson)Labour_total(43,343.9 ± 22,010.5; 5463.5–111,623.2)
Population Density (people/km2)Pop_density(111.4 ± 129.04; 1.97–721)
Centrally planned regimeCP_regime(Yes = 1; No = 0)
Source: the authors’ calculations.
Table 2. Farm structure in Serbia and the EU.
SerbiaEU
Number of holdings (1000)631.610,841.0
Utilized agricultural area—UAA (1000 ha)3437.0174,351.0
Average area of holdings (ha)5.416.1
% of holdings with up to 2 ha48.145.0
% of UAA on farms up to 2 ha7.72.0
% of holdings with over 10 ha8.322.0
% of UAA on farms over 10 ha56.988.6
% of holdings with over 100 ha0.33.1
% of UAA on farms over 100 ha23.852.1
Source: [26] on basis of [15,35].
Table 3. Correlation Matrix.
ASC IndexGDPLabour_TotalPop_DensityCP_Regime
ASC Index1.000
GDP0.128 **1.000
Labour_total0.286 **0.848 **1.000
Pop_density−0.181 **0.284 **0.168 **1.000
CP_regime−0.318 **−0.616 **−0.828 **−0.0731.000
ASC Index
GDP0.001
Employ_tertiary0.0000.000
Pop_density0.0000.0000.000
CP_regime0.0000.0000.0000.054
Source: the authors’ calculations. Note: ** Correlation is significant at the 0.01 level (2-tailed).
Publisher’s Note: MDPI stays neutral with regard to jurisdictional claims in published maps and institutional affiliations.

