
Nitrogen Fertilization Effects on Soil Nitrate, Water Use, Growth Attributes and Yield of Winter Wheat under Shallow Groundwater Table Condition


Abstract
:1. Introduction
2. Materials and Methods
2.1. Experimental Site
2.2. Experimental Design
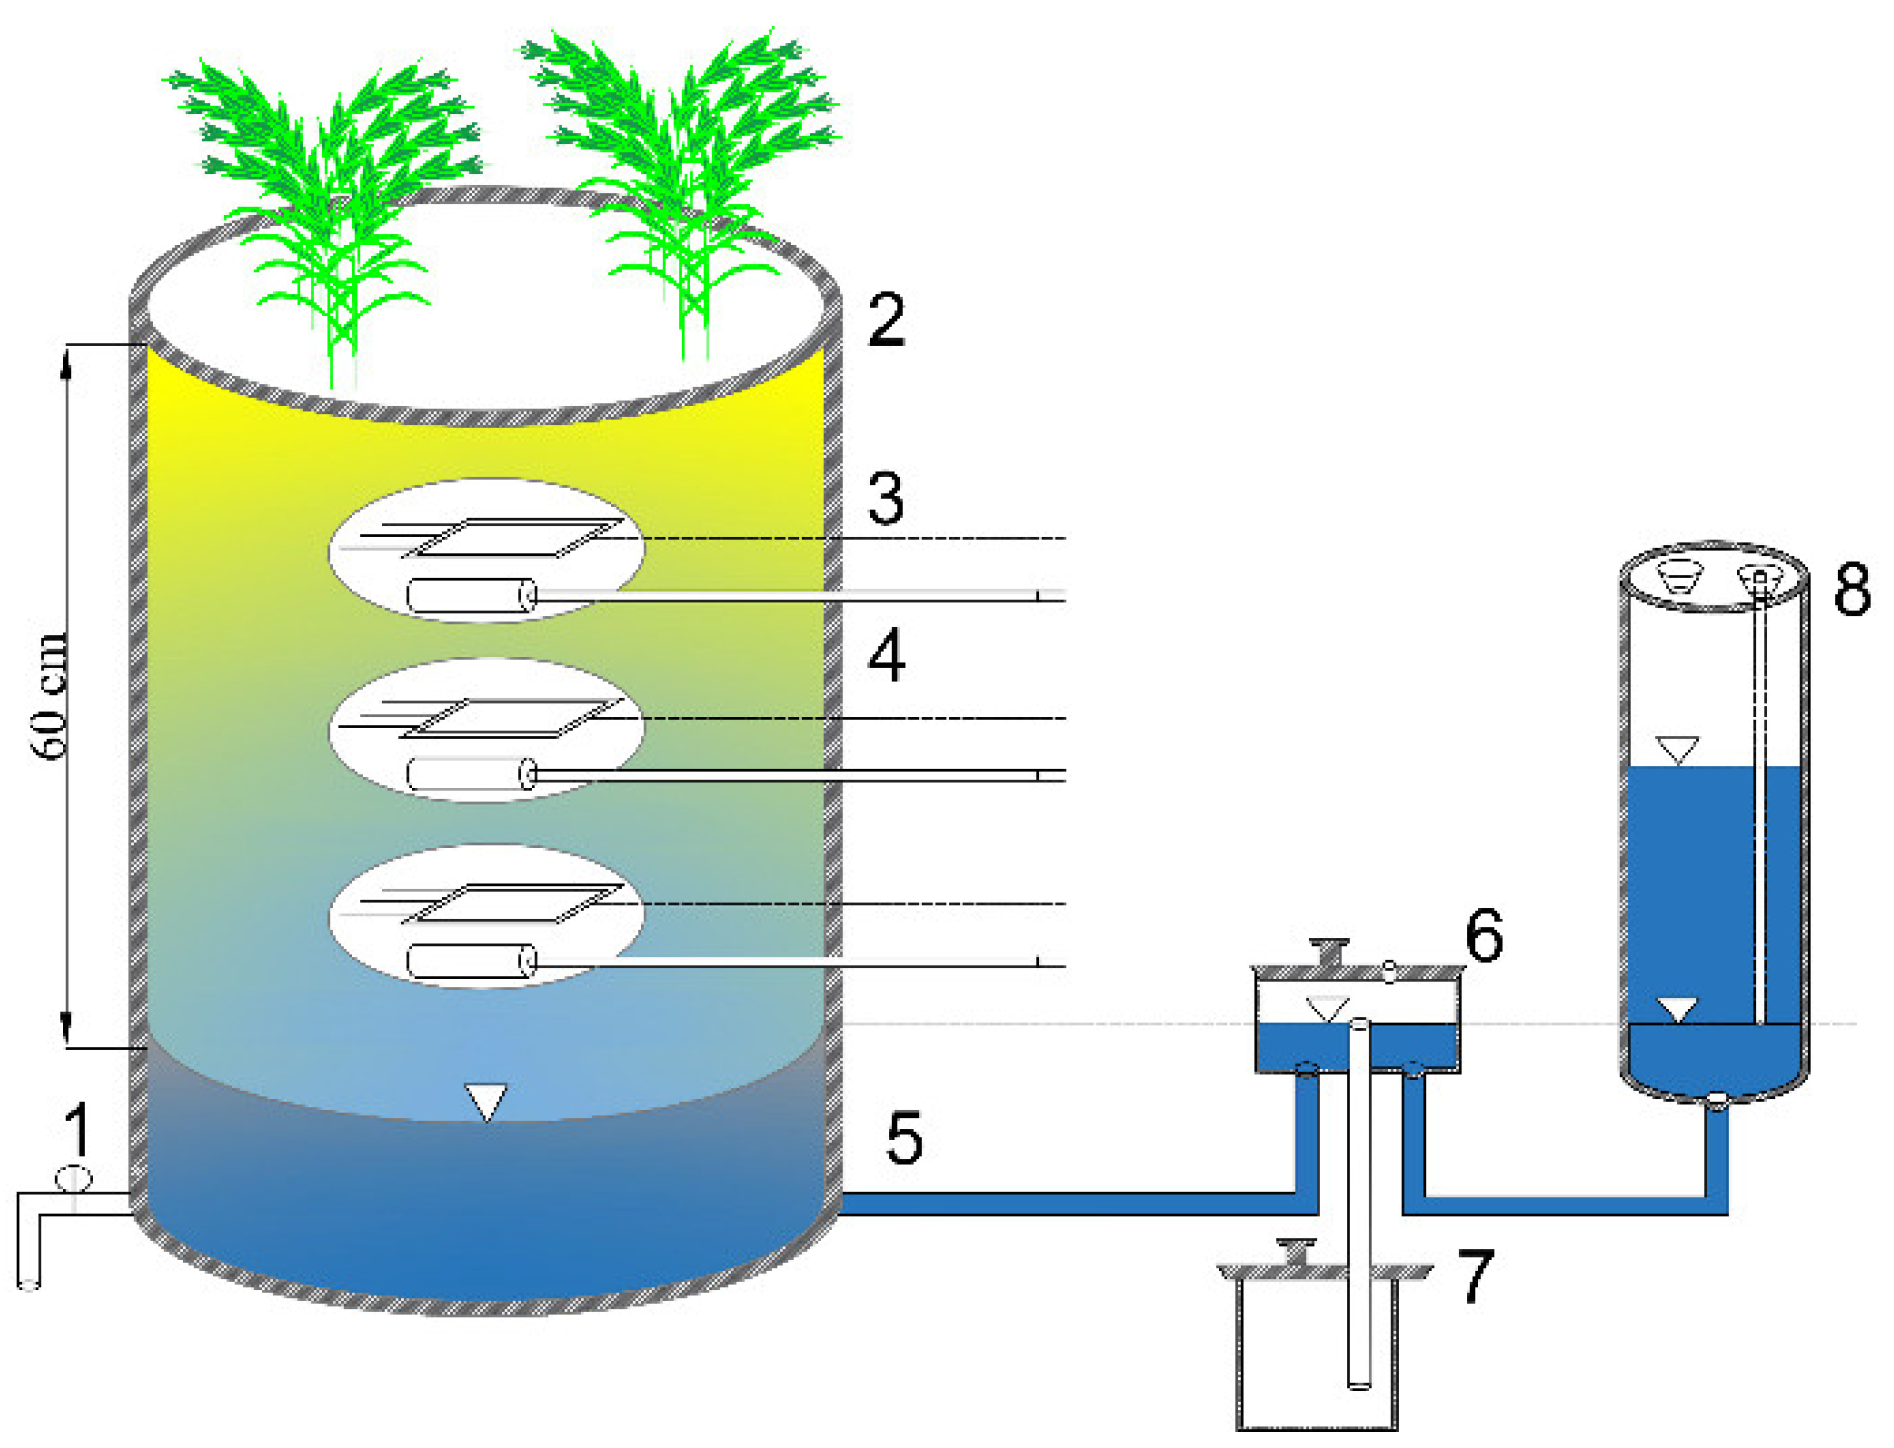
2.2.1. Testing Apparatus
2.2.2. Pre-Treatment of Experimental Soil
2.2.3. Description of Experiment
2.2.4. Monitoring Items and Analytical Methods
- (1)
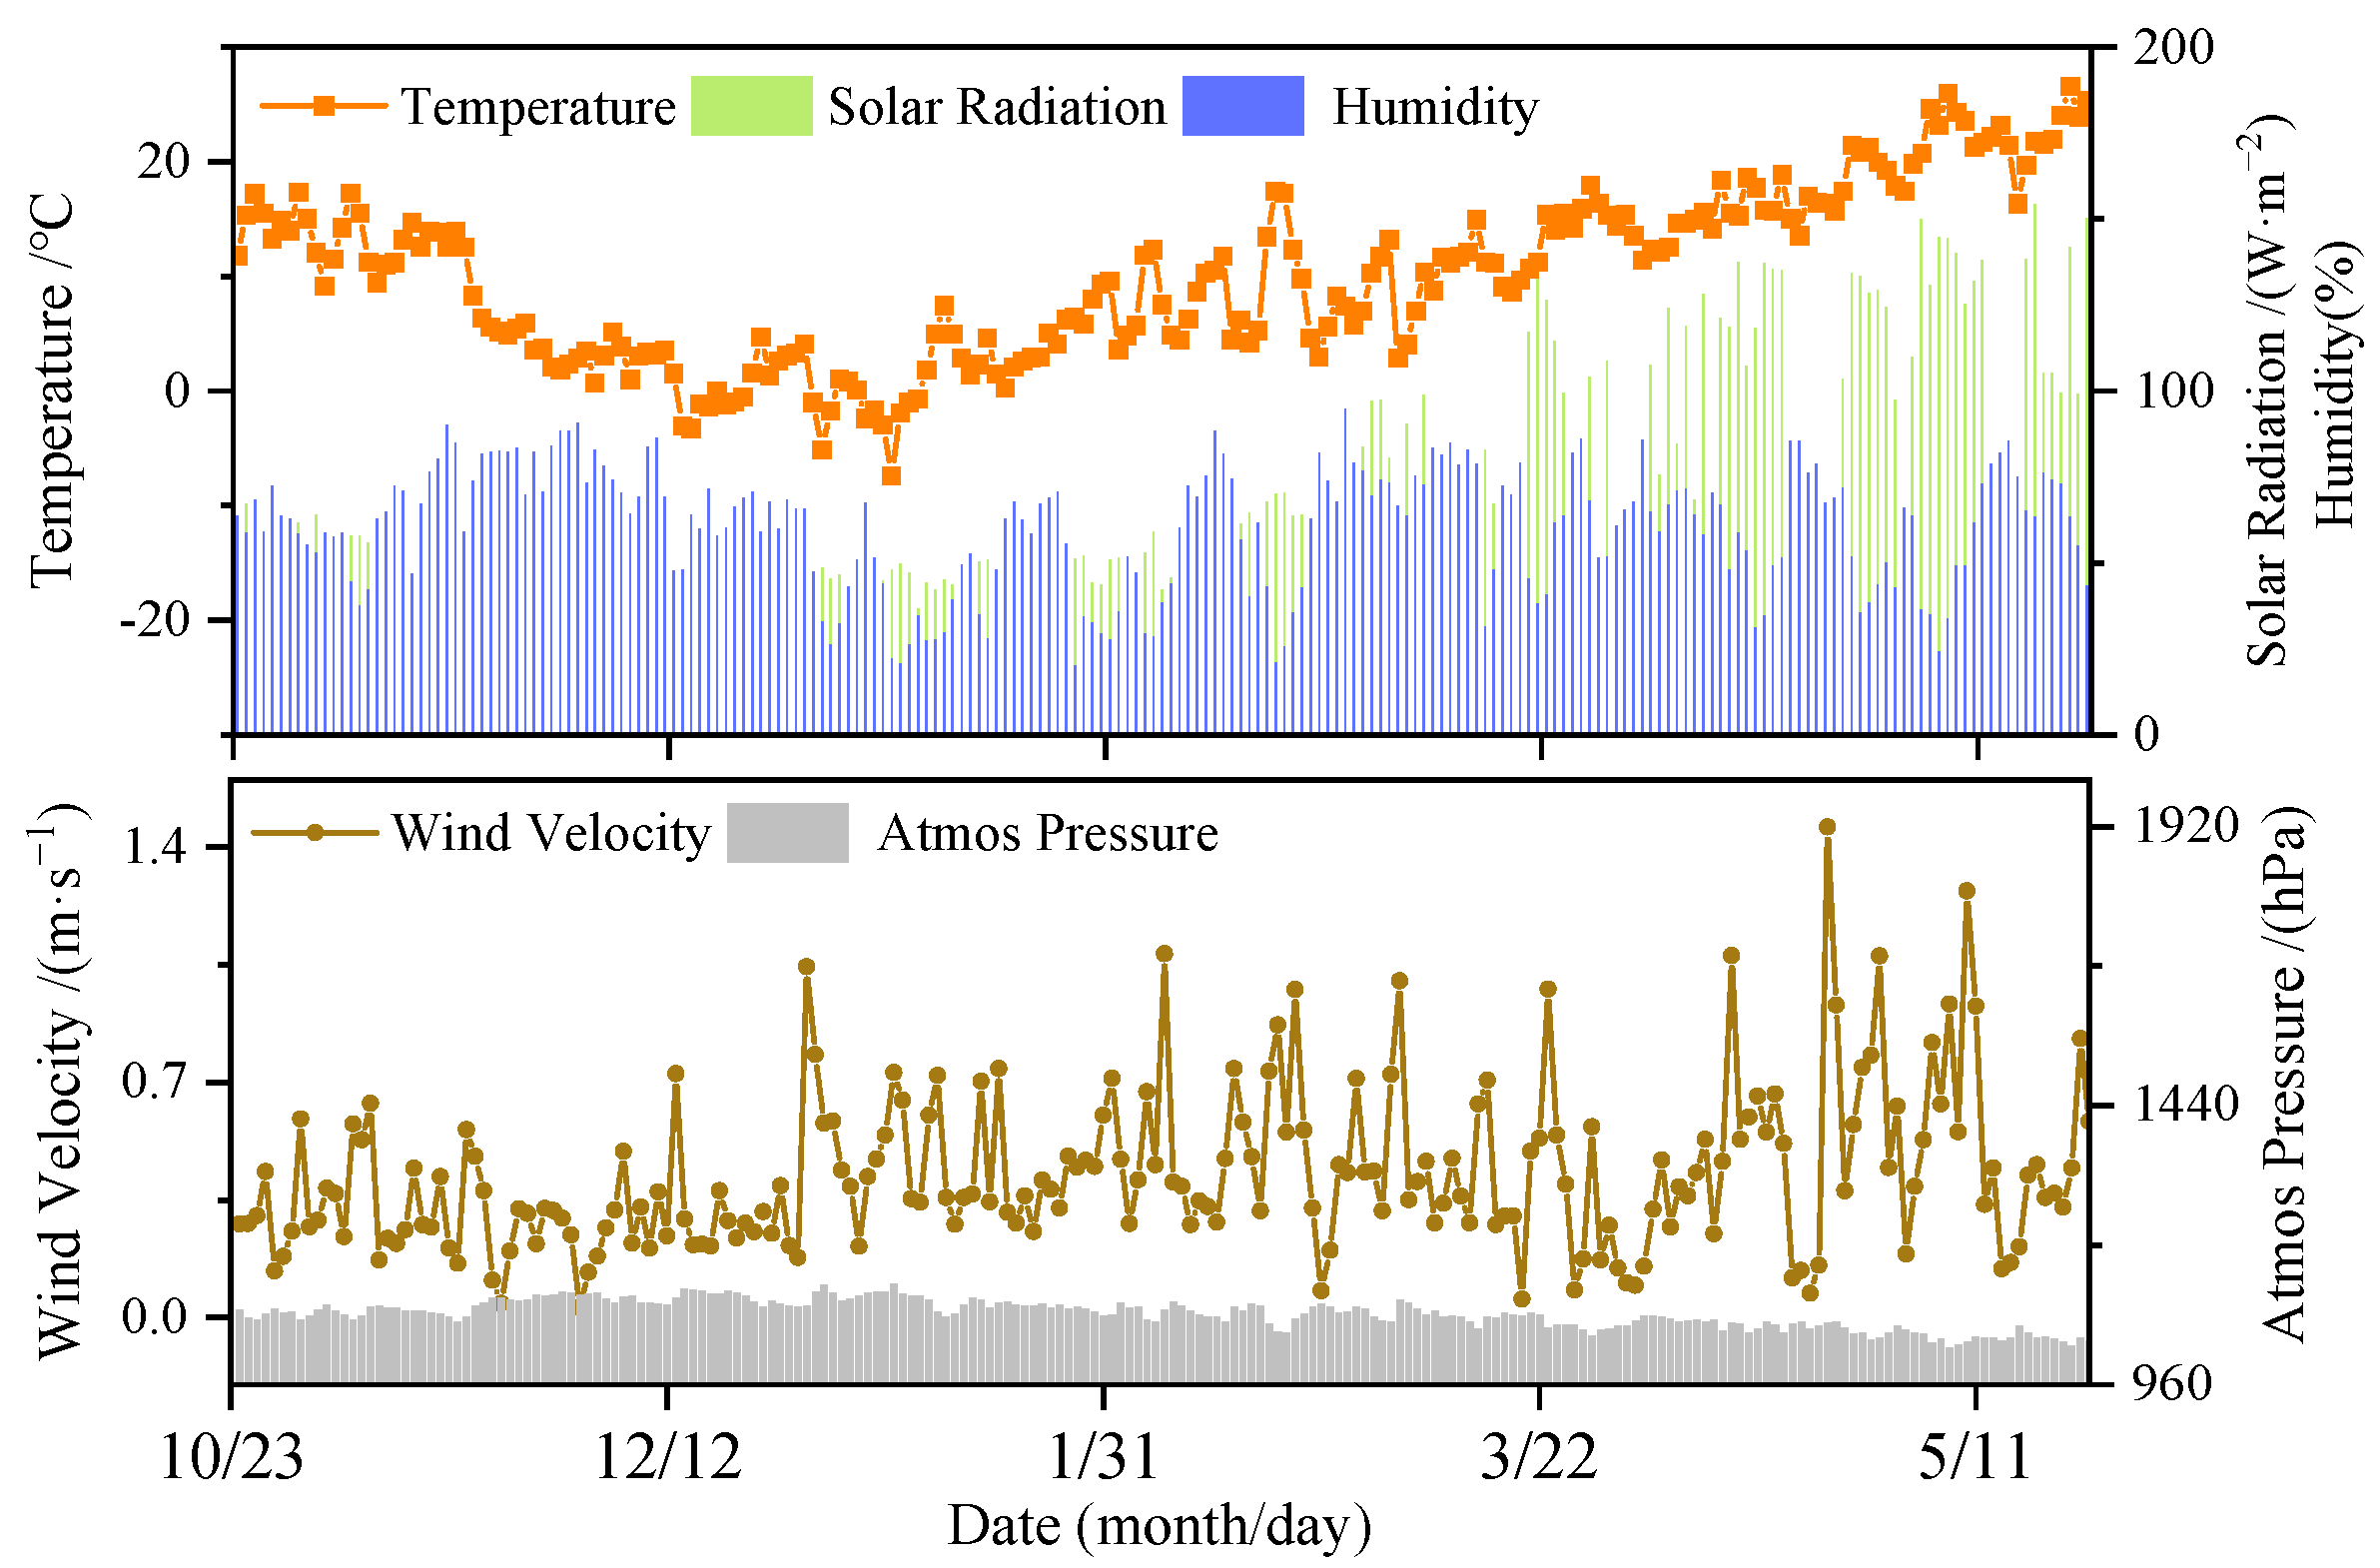
- Meteorological data
- (2)
- Crop height and leaf area index (LAI)
- Plant height: Before the booting stage, a ruler was used to measure the distance between the base of wheat and the highest point of leaf growth as the plant height, and the distance between the base of winter wheat and the top of spike (excluding awn length) was used as crop height in the booting stage and later. The measured growth stages were the regreening, jointing, booting, anthesis, filling, mid-filling and the maturity stage.
- LAI: The maximum leaf length and maximum leaf width were measured with a ruler. The leaf area index (LAI) was calculated by using the ruler method and the length-width coefficient method. The measured growth stages were the jointing, anthesis, filling and middle of filling stage.
- (3)
- Nitrate-accumulation in the vadose zone
- (4)
- Soil moisture
- (5)
- Daily groundwater evaporation velocity
- (6)
- Crop water requirements
- (7)
- Evapotranspiration (ET)
- (8)
- Crop water use efficiency (WUE), partial factor productivity of applied N (PFPN), groundwater use efficiency (GUE), and groundwater utilization rate (Gr)
2.3. Statistical Analysis
3. Results
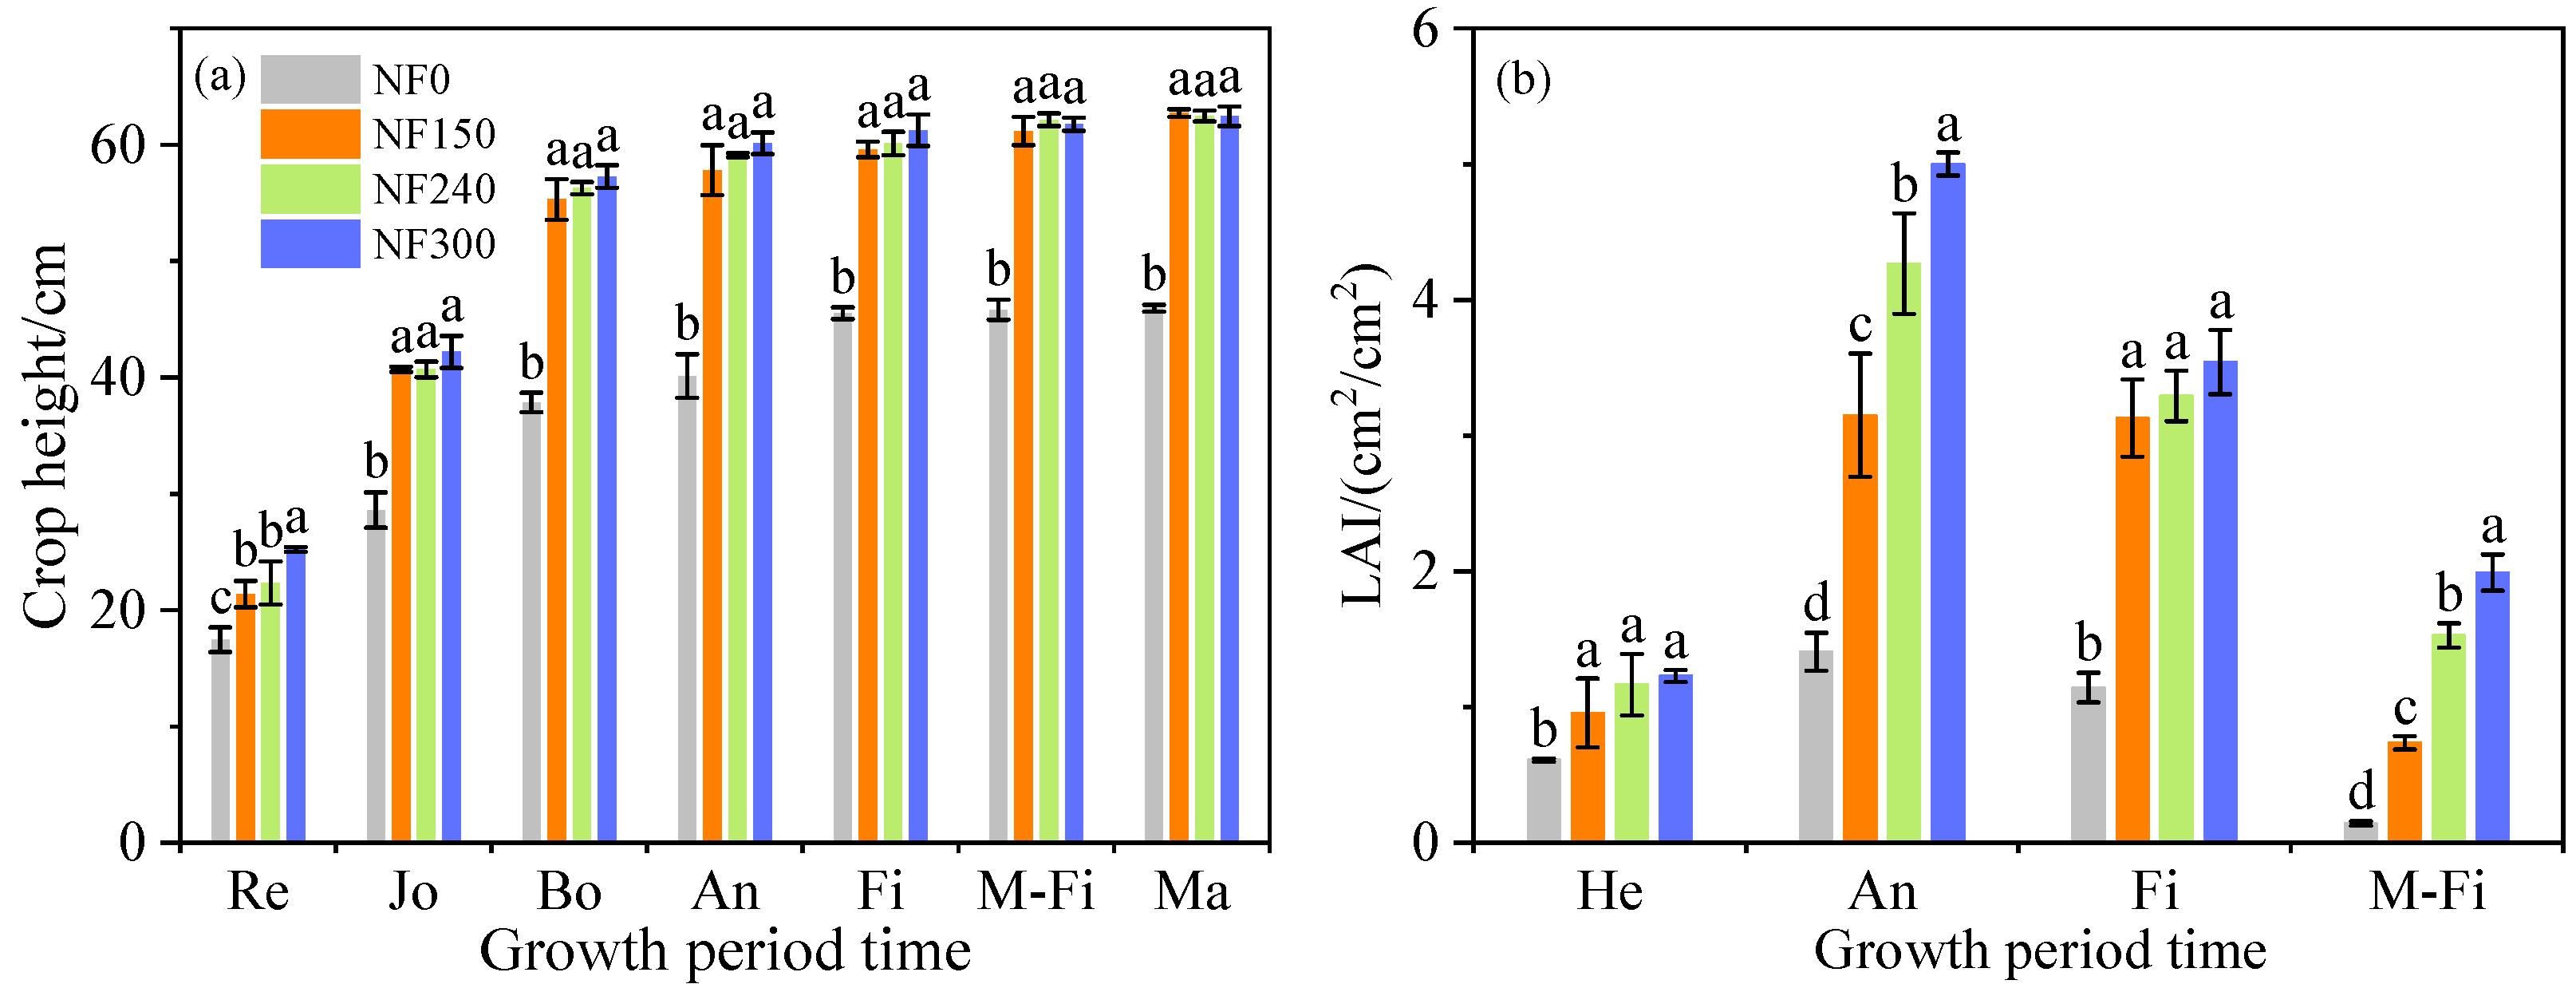
3.1. Crop Height and Leaf Area Index (LAI)
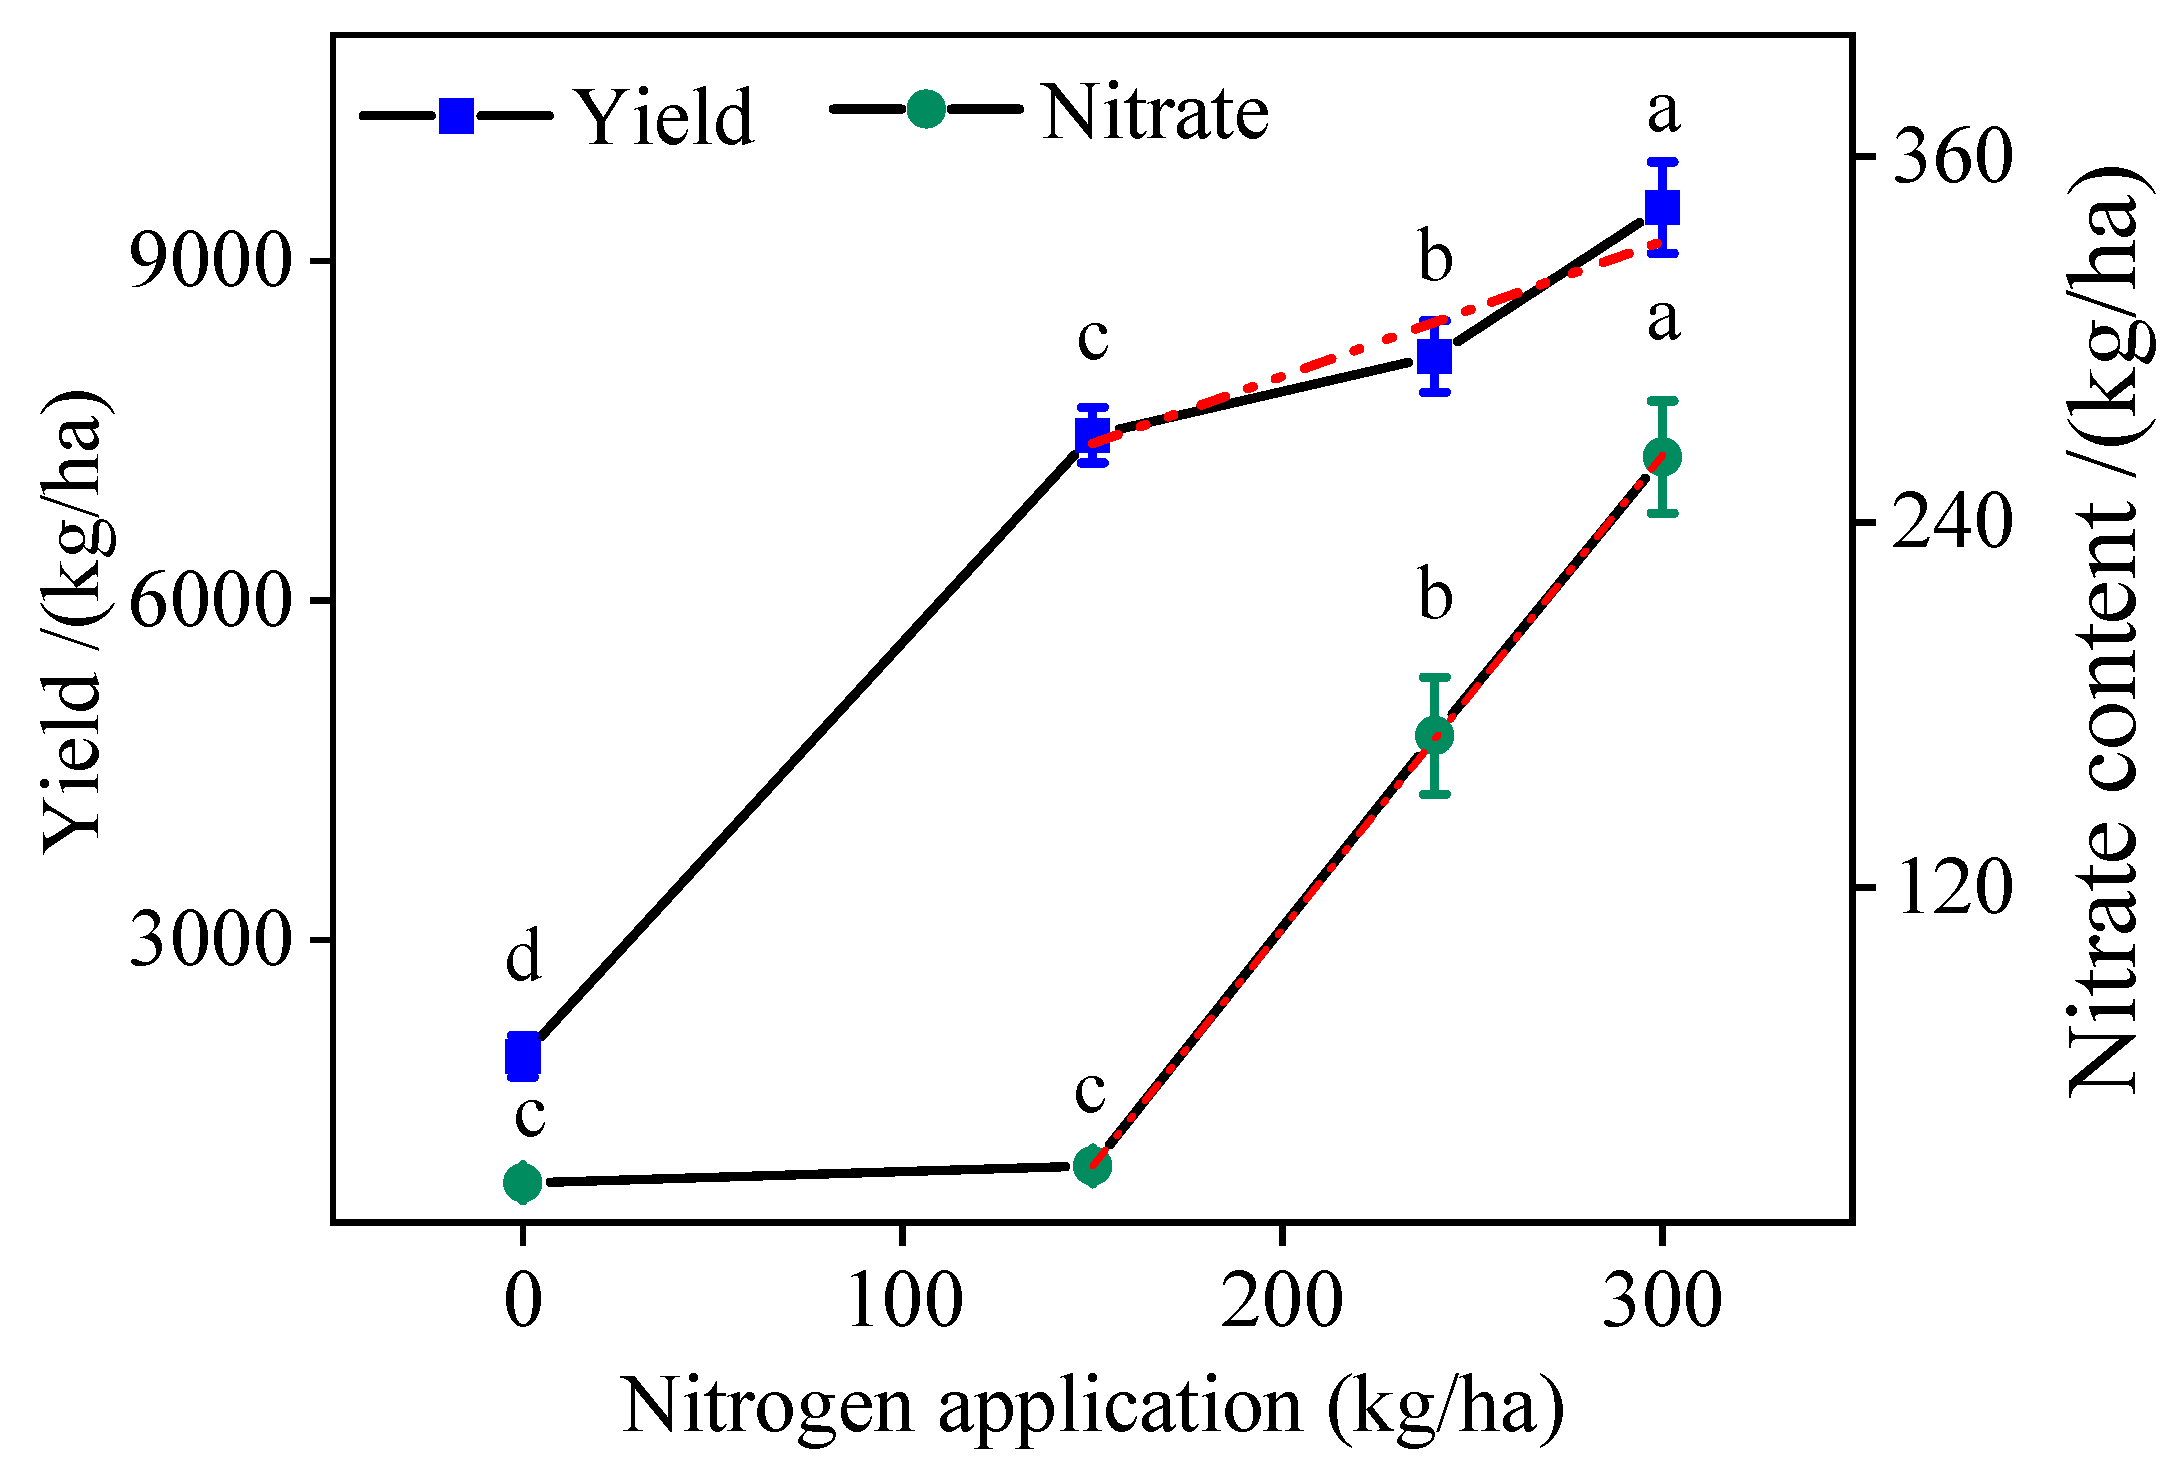
3.2. Yield and Nitrate Accumulation in the Vadose Zone
3.3. Daily Groundwater Evaporation Velocity (Gv), Maximum Gv and Average Gv in Each Growth Period
3.4. Soil Moisture and Crop Water Requirements of 0–20 cm Soil Layer in Each Stage
3.5. Evapotranspiration (ET), Groundwater Evaporation (ETgw), and Groundwater Utilization Rate (Gr)
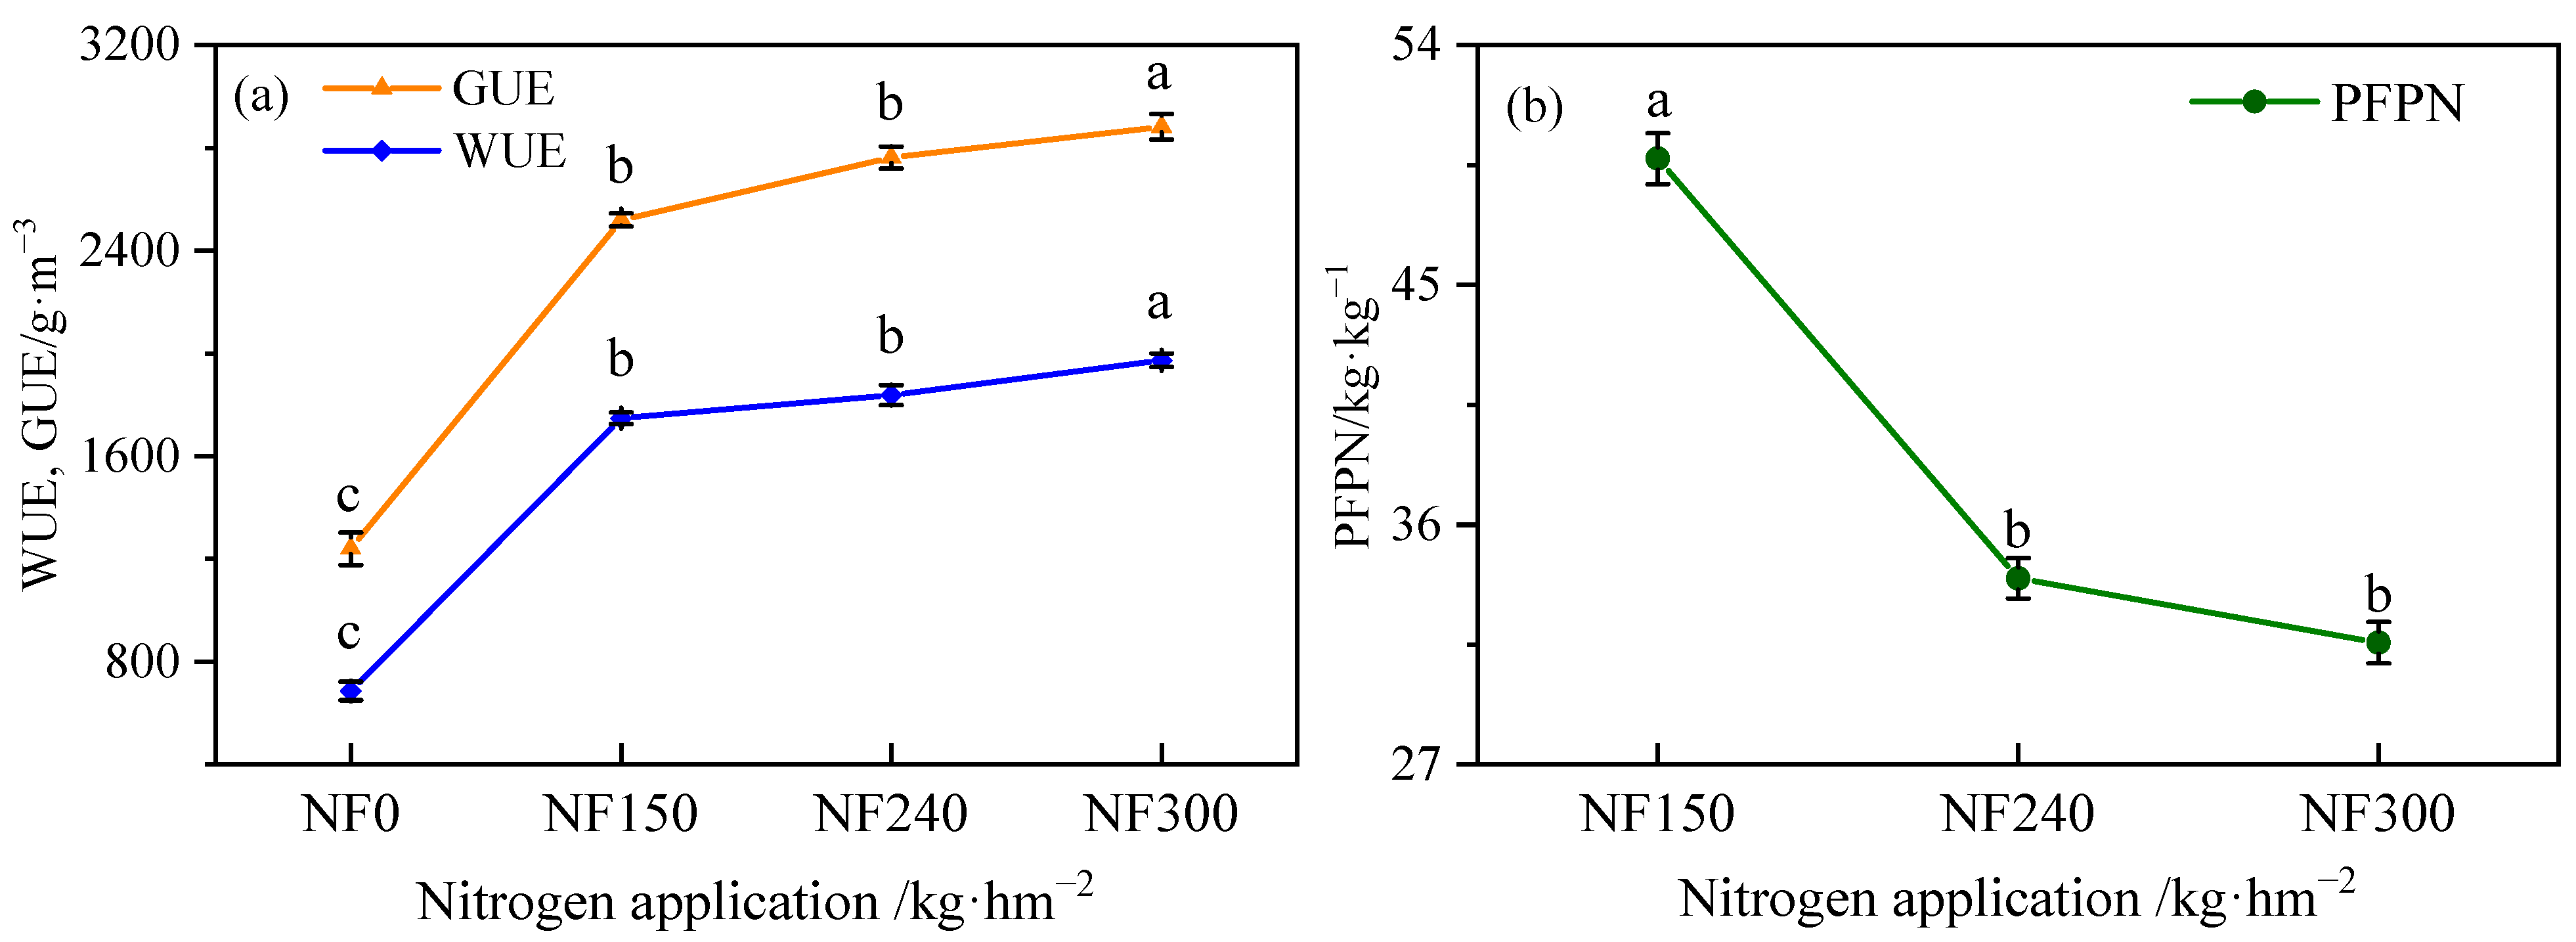
3.6. Groundwater Use Efficiency (GUE), Water Use Efficiency (WUE), and Partial Factor Productivity of Applied N (PFPN)
3.7. Correlation Analysis
4. Discussion
5. Conclusions
Author Contributions
Funding
Institutional Review Board Statement
Informed Consent Statement
Data Availability Statement
Acknowledgments
Conflicts of Interest
References
- Lian, J.; Li, Y.; Li, Y.; Zhao, X.; Zhang, T.; Wang, X.; Wang, X.; Wang, L.; Zhang, R. Effect of Center-Pivot Irrigation Intensity on Groundwater Level Dynamics in the Agro-Pastoral Ecotone of Northern China. Front. Environ. Sci. 2022, 10, 892577. [Google Scholar] [CrossRef]
- Russo, T.A.; Lall, U. Depletion and response of deep groundwater to climate-induced pumping variability. Nat. Geosci. 2017, 10, 105–108. [Google Scholar] [CrossRef]
- Dai, J.; Li, R.; Miao, Q.; Li, C.; Lu, Y.; Hua, Z. Shallow groundwater enhances water productivity of maize in arid area. Irrig. Sci. 2022, 40, 885–908. [Google Scholar] [CrossRef]
- Babajimopoulos, C.; Panoras, A.; Georgoussis, H.; Arampatzis, G.; Hatzigiannakis, E.; Papamichail, D. Contribution to irrigation from shallow water table under field conditions. Agric. Water Manag. 2007, 92, 205–210. [Google Scholar] [CrossRef]
- Liu, H.; Wang, Z.; Yu, R.; Li, F.; Li, K.; Cao, H.; Yang, N.; Li, M.; Dai, J.; Zan, Y.; et al. Optimal nitrogen input for higher efficiency and lower environmental impacts of winter wheat production in China. Agric. Ecosyst. Environ. 2016, 224, 22. [Google Scholar] [CrossRef]
- Rasmussen, I.S.; Dresbøll, D.B.; Thorup-Kristensen, K. Winter wheat cultivars and nitrogen (N) fertilization—Effects on root growth, N uptake efficiency and N use efficiency. Eur. J. Agron. 2015, 68, 38–49. [Google Scholar] [CrossRef]
- Cossani, C.M.; Slafer, G.A.; Savin, R. Nitrogen and water use efficiencies of wheat and barley under a Mediterranean environment in Catalonia. Field Crops Res. 2012, 128, 109–118. [Google Scholar] [CrossRef]
- Yu, C.; Huang, X.; Chen, H.; Godfray, H.C.J.; Wright, J.S.; Hall, J.W.; Gong, P.; Ni, S.; Qiao, S.; Huang, G.; et al. Managing nitrogen to restore water quality in China. Nature 2019, 567, 516–520. [Google Scholar] [CrossRef]
- Si, Z.; Zain, M.; Mehmood, F.; Wang, G.; Gao, Y.; Duan, A. Effects of nitrogen application rate and irrigation regime on growth, yield, and water-nitrogen use efficiency of drip-irrigated winter wheat in the North China Plain. Agric. Water Manag. 2020, 231, 106002. [Google Scholar] [CrossRef]
- Ruiz, A.; Salvagiotti, F.; Gambin, B.L.; Borrás, L. Maize nitrogen management in soils with influencing water tables within optimum depth. Crop Sci. 2021, 61, 1386–1399. [Google Scholar] [CrossRef]
- Liu, L.; Luo, Y.; Lai, J.; Liu, T. Study on extinction depth and steady water storage in root zone based on lysimeter experiment and HYDRUS-1D simulation. Hydrol. Res. 2015, 46, 871–879. [Google Scholar] [CrossRef]
- Yang, J.; Wan, S.; Deng, W.; Zhang, G. Water fluxes at a fluctuating water table and groundwater contributions to wheat water use in the lower Yellow River flood plain, China. Hydrol. Process. 2007, 21, 717–724. [Google Scholar] [CrossRef]
- Kahlown, M.A.; Ashraf, M.; Ziaul, H. Effect of shallow groundwater table on crop water requirements and crop yields. Agric. Water Manag. 2005, 76, 24–35. [Google Scholar] [CrossRef]
- Fidantemiz, Y.F.; Jia, X.; Daigh, A.L.M.; Hatterman-Valenti, H.; Steele, D.D.; Niaghi, A.R.; Simsek, H. Effect of Water Table Depth on Soybean Water Use, Growth, and Yield Parameters. Water 2019, 11, 931. [Google Scholar] [CrossRef] [Green Version]
- Gao, X.; Huo, Z.; Xu, X.; Qu, Z.; Huang, G.; Tang, P.; Bai, Y. Shallow groundwater plays an important role in enhancing irrigation water productivity in an arid area: The perspective from a regional agricultural hydrology simulation. Agric. Water Manag. 2018, 208, 43–58. [Google Scholar] [CrossRef]
- Huo, Z.; Feng, S.; Huang, G.; Zheng, Y.; Wang, Y.; Guo, P. Effect of Groundwater Level Depth and Irrigation Amount on Water Fluxes at the Groundwater Table and Water Use of Wheat. Irrig. Drain. 2012, 61, 348–356. [Google Scholar] [CrossRef]
- Ren, F.; Sun, N.; Xu, M.; Zhang, X.; Wu, L.; Xu, M. Changes in soil microbial biomass with manure application in cropping systems: A meta-analysis. Soil. Till. Res. 2019, 194, 104291. [Google Scholar] [CrossRef] [Green Version]
- Qiu, S.; Gao, H.; Zhu, P.; Hou, Y.; Zhao, S.; Rong, X.; Zhang, Y.; He, P.; Christie, P.; Zhou, W. Changes in soil carbon and nitrogen pools in a Mollisol after long-term fallow or application of chemical fertilizers, straw or manures. Soil. Till. Res. 2016, 163, 255–265. [Google Scholar] [CrossRef]
- Wu, X.; Cai, X.; Li, Q.; Ren, B.; Bi, Y.; Zhang, J.; Wang, D. Effects of nitrogen application rate on summer maize (Zea mays L.) yield and water–nitrogen use efficiency under micro–sprinkling irrigation in the Huang–Huai–Hai Plain of China. Arch. Agron. Soil Sci. 2021, 68, 1915–1929. [Google Scholar] [CrossRef]
- Treseder, K.K. Nitrogen additions and microbial biomass: A meta-analysis of ecosystem studies. Ecol. Lett. 2008, 11, 1111–1120. [Google Scholar] [CrossRef]
- He, W.; Jiang, R.; He, P.; Yang, J.; Zhou, W.; Ma, J.; Liu, Y. Estimating soil nitrogen balance at regional scale in China’s croplands from 1984 to 2014. Agric. Syst. 2018, 167, 125–135. [Google Scholar] [CrossRef]
- Zhang, Y.; Wang, H.; Lei, Q.; Zhang, J.; Zhai, L.; Ren, T.; Liu, H. Recommended methods for optimal nitrogen application rate. Sci. Agric. Sin. 2018, 51, 2937–2947, (In Chinese with English Abstract). [Google Scholar]
- Yan, M.; Luo, T.; Bian, R.; Cheng, K.; Pan, G.; Rees, R. A comparative study on carbon footprint of rice production between household and aggregated farms from Jiangxi, China. Environ. Monit. Assess. 2015, 187, 332. [Google Scholar] [CrossRef] [PubMed]
- Zhou, J.; Ma, Y.; Wu, M.; Peng, Z.; Wang, Y.; Li, H.; Wang, Y.; Sheng, L. Water and Nitrogen Utilization and Biological Effects of Winter Wheat under Different Water and Fertilizer Measures. J. Irrig. Drain. 2019, 38, 36–41, (In Chinese with English Abstract). [Google Scholar] [CrossRef]
- Kumar, R.; Pareek, N.K.; Kumar, U.; Javed, T.; Al-Huqail, A.A.; Rathore, V.S.; Nangia, V.; Choudhary, A.; Nanda, G.; Ali, H.M.; et al. Coupling Effects of Nitrogen and Irrigation Levels on Growth Attributes, Nitrogen Use Efficiency, and Economics of Cotton. Front. Plant Sci. 2022, 13, 890181. [Google Scholar] [CrossRef]
- Ji, Y.; Feng, W.; Hao, X.; Peng, Y.; Han, P.; Ma, Z.; Zhang, L. Effects of Different Fertilization Pattern on the Yield of the Rotation System of Wheat and Maize and Soil Nitrate Accumulation in North China Plain. Ecol. Environ. Sci. 2014, 11, 1725–1731, (In Chinese with English Abstract). [Google Scholar] [CrossRef]
- Sun, M.; Huo, Z.; Zheng, Y.; Dai, X.; Feng, S.; Mao, X. Quantifying long-term responses of crop yield and nitrate leaching in an intensive farmland using agro-eco-environmental model. Sci. Total Environ. 2018, 613–614, 1003–1012. [Google Scholar] [CrossRef]
- Naghdyzadegan Jahromi, M.; Razzaghi, F.; Zand-Parsa, S. Strategies to increase barley production and water use efficiency by combining deficit irrigation and nitrogen fertilizer. Irrig. Sci. 2022, 2022, 1–15. [Google Scholar] [CrossRef]
- Harries, M.; Flower, K.C.; Renton, M.; Anderson, G.C.; Sadras, V. Water use efficiency in Western Australian cropping systems. Crop Pasture Sci. 2022, 73, 1097–1117. [Google Scholar] [CrossRef]
- Cui, Z.; Zhang, H.; Chen, X.; Zhang, C.; Ma, W.; Huang, C.; Zhang, W.; Mi, G.; Miao, Y.; Li, X.; et al. Pursuing sustainable productivity with millions of smallholder farmers. Nature 2018, 555, 363–366. [Google Scholar] [CrossRef]
- Zhou, J.; Gu, B.; Schlesinger, W.H.; Ju, X. Significant accumulation of nitrate in Chinese semi-humid croplands. Sci. Rep. 2016, 6, 25088. [Google Scholar] [CrossRef]
- Yang, X.; Lu, Y.; Ding, Y.; Yin, X.; Raza, S.; Tong, Y.A. Optimising nitrogen fertilisation: A key to improving nitrogen-use efficiency and minimising nitrate leaching losses in an intensive wheat/maize rotation (2008–2014). Field Crops Res. 2017, 206, 16. [Google Scholar] [CrossRef]
- Kadioglu, H.; Hatterman-Valenti, H.; Jia, X.; Chu, X.; Aslan, H.; Simsek, H. Groundwater Table Effects on the Yield, Growth, and Water Use of Canola (Brassica napus L.) Plant. Water 2019, 11, 1730. [Google Scholar] [CrossRef] [Green Version]
- Liu, Z.; Niu, H.; Jia, Y. Influence of Groundwater Depth on Evapotranspiration of Winter Wheat. Water Sav. Irrig. 2010, 2020, 1–3, (In Chinese with English Abstract). [Google Scholar]
- Cassman, K.G.; Peng, S.; Olk, D.C.; Ladha, J.K.; Reichardt, W.; Dobermann, A.; Singh, U. Opportunities for Increased Nitrogen–Use Efficiency from Improved Resource Management in Irrigated Rice Systems. Field Crops Res. 1998, 56, 7–39. [Google Scholar] [CrossRef]
- Idowu, O.; Wang, Y.; Homma, K.; Nakazaki, T.; Xu, Z.; Shiraiwa, T. Interaction of erect panicle genotype and nitrogen fertilizer application on the source-sink ratio and nitrogen use efficiency in rice. Field Crops Res. 2022, 278, 108430. [Google Scholar] [CrossRef]
- Li, R.; Wang, Y.; Liu, M.; Chen, X. Research on Relation Between Crop Growth and Shallow Groundwater in North of Anhui Province. Water Sav. Irrig. 2013, 2013, 30–41, (In Chinese with English Abstract). [Google Scholar]
- Zhang, X.; Wang, Z.; Du, F.; Wang, B.; Li, R.; Lu, L. Study on the Relationship Between Soil Water and Groundwater Conversion in Wheat Field and Bare Land in Lime Concretion Black Soil. Water Sav. Irrig. 2020, 2020, 57–60, (In Chinese with English Abstract). [Google Scholar]
- Barbeta, A.; Penuelas, J. Relative contribution of groundwater to plant transpiration estimated with stable isotopes. Sci. Rep. 2017, 7, 10580. [Google Scholar] [CrossRef] [Green Version]
- Liu, T.; Liu, L.; Luo, Y.; Lai, J. Simulation of groundwater evaporation and groundwater depth using SWAT in the irrigation district with shallow water table. Environ. Earth Sci. 2015, 74, 315–324. [Google Scholar] [CrossRef] [Green Version]
- Müller, L.; Augustin, J.; Eulenstein, F.; Seeger, J.; Meissner, R.; Behrendt, A.; Schindler, U. Einfluss unterschiedlicher böden auf die ausnutzung von wasser und stickstoff durch weidelgras, sommergerste und mais auf einigen grundwasserstandorten. Arch. Agron. Soil Sci. 2001, 47, 277–292. [Google Scholar] [CrossRef]
- Ma, S.; Wang, Y.; Huang, Z.; Han, X.; Zhang, W.; Fan, Y.; Ma, Y. Research Progress of Effects of Waterlogging on Wheat Growth and Cultivation Technique for Waterlogging Resistance. J. Triticeae Crops 2019, 39, 835–843, (In Chinese with English Abstract). [Google Scholar] [CrossRef]
- Herzog, M.; Striker, G.G.; Colmer, T.D.; Pedersen, O. Mechanisms of waterlogging tolerance in wheat--a review of root and shoot physiology. Plant Cell Environ. 2016, 39, 1068–1086. [Google Scholar] [CrossRef] [PubMed]
- Li, Z.; Zhang, Q.; Qiao, Y.; Leng, P.; Zhang, Q.; Du, K.; Tian, C.; Li, X.; Chen, G.; Li, F. Influence of the shallow groundwater table on the groundwater N2O and direct N2O emissions in summer maize field in the North China Plain. Sci. Total Environ. 2021, 799, 149495. [Google Scholar] [CrossRef] [PubMed]
- Mueller, L.; Behrendt, A.; Schalitz, G.; Schindler, U. Above ground biomass and water use efficiency of crops at shallow water tables in a temperate climate. Agric. Water Manag. 2005, 75, 117–136. [Google Scholar] [CrossRef]
- Ogola, J.B.O.; Wheeler, T.R.; Harris, P.M. Effects of nitrogen and irrigation on water use of maize crops. Field Crops Res. 2005, 78, 105–117. [Google Scholar] [CrossRef]
- Gu, N.; Zhang, J.; Liu, C.; Wang, Z.; Wang, G. An experimental study of the influence of groundwater level on water consumption of winter wheat in the Huaibei Plain. Hydrogeol. Eng. Geol. 2021, 48, 15–24, (In Chinese with English Abstract). [Google Scholar] [CrossRef]
- Lu, X.; Yang, M.; Wang, Z.; Lyu, H.; Gu, N. Metrological Factors Affecting Evaporation of Shallow Groundwater in the Absence of Plants in Huaibei Plain. J. Irrig. Drain. 2019, 38, 84–91, (In Chinese with English Abstract). [Google Scholar] [CrossRef]
- Wang, Z.; Liu, M.; Li, R. Experiment on phreatic evaporation of bare soil and soil with crop in Huaibei plain. Trans. CSAE 2009, 25, 26–32, (In Chinese with English Abstract). [Google Scholar] [CrossRef]
- Huang, J.; Zhou, Y.; Wenninger, J.; Ma, H.; Zhang, J.; Zhang, D. How water use of Salix psammophila bush depends on groundwater depth in a semi-desert area. Environ. Earth Sci. 2016, 75, 556. [Google Scholar] [CrossRef]
- Karimov, A.K.; Šimůnek, J.; Hanjra, M.A.; Avliyakulov, M.; Forkutsa, I. Effects of the shallow water table on water use of winter wheat and ecosystem health: Implications for unlocking the potential of groundwater in the Fergana Valley (Central Asia). Agric. Water Manag. 2014, 131, 57–69. [Google Scholar] [CrossRef]
- Liu, W.; Wang, J.; Wang, C.; Ma, G.; Wei, Q.; Lu, H.; Xie, Y.; Ma, D.; Kang, G. Root Growth, Water and Nitrogen Use Efficiencies in Winter Wheat Under Different Irrigation and Nitrogen Regimes in North China Plain. Front Plant Sci. 2018, 9, 1798. [Google Scholar] [CrossRef] [Green Version]
- Soylu, M.E.; Kucharik, C.J.; Loheide, S.P. Influence of groundwater on plant water use and productivity: Development of an integrated ecosystem—Variably saturated soil water flow model. Agric. Forest Meteorol. 2014, 189–190, 198–210. [Google Scholar] [CrossRef]
- Deng, C.; Zhang, Y.; Bailey, R.T. Evaluating crop-soil-water dynamics in waterlogged areas using a coupled groundwater-agronomic model. Environ. Modell Softw. 2021, 143, 105130. [Google Scholar] [CrossRef]
- Gou, Q.; Zhu, Y.; Horton, R.; Lü, H.; Wang, Z.; Su, J.; Cui, C.; Zhang, H.; Wang, X.; Zheng, J.; et al. Effect of climate change on the contribution of groundwater to the root zone of winter wheat in the Huaibei Plain of China. Agric. Water Manag. 2020, 240, 106292. [Google Scholar] [CrossRef]
- Xin, J.; Liu, Y.; Chen, F.; Duan, Y.; Wei, G.; Zheng, X.; Li, M. The missing nitrogen pieces: A critical review on the distribution, transformation, and budget of nitrogen in the vadose zone-groundwater system. Water Res. 2019, 165, 114977. [Google Scholar] [CrossRef]
- Guo, J.H.; Liu, X.J.; Zhang, Y.; Shen, J.L.; Han, W.X.; Zhang, W.F.; Christie, P.; Goulding, K.W.T.; Vitousek, P.M.; Zhang, F.S. Significant Acidification in Major Chinese Croplands. Science 2010, 327, 1008–1010. [Google Scholar] [CrossRef]


| Soil Layer (cm) | pH | EC (us·cm−1) | OM (g·kg−1) | AN (mg·kg−1) | AK (mg·kg−1) | TN (g·kg−1) | TP (g·kg−1) | Soil Texture | ||
|---|---|---|---|---|---|---|---|---|---|---|
| Clay (%) | Silt (%) | Sand (%) | ||||||||
| 0–20 | 9.34 | 270.00 | 12.29 | 17.27 | 128.33 | 0.85 | 0.63 | 18.26 | 47.43 | 34.31 |
| 20–40 | 9.62 | 313.33 | 9.87 | 13.30 | 81.33 | 1.25 | 0.59 | 18.09 | 45.93 | 35.97 |
| 40–60 | 9.58 | 364.00 | 8.78 | 7.93 | 81.67 | 1.52 | 0.53 | 17.84 | 44.04 | 38.78 |
| >60 | 9.39 | 421.67 | 8.77 | 6.18 | 76.33 | 1.47 | 0.48 | 15.88 | 43.87 | 40.00 |
| Irrigating Date (yy/mm/dd) | Irrigating Amount (mm) | Irrigating Date (yy/mm/dd) | Irrigating Amount (mm) |
|---|---|---|---|
| 2021/1/13 | 17.64 | 2021/4/21 | 17.64 |
| 2021/3/17 | 30.88 | 2021/5/2 | 8.82 |
| 2021/3/31 | 17.64 | 2021/5/8 | 17.64 |
| 2021/4/11 | 17.64 | ||
| NF | Soil Surface Moisture(cm3·cm−3) | Current Solar Radiation (W·m−2) | Cumulative Solar Radiation (MJ·m−2) | Humidity (%) | Dew Point Temperature (°C) | Atmos Pressure (hPa) | Temperature (°C) | Highest Wind Velocity (m·s−1) | Wind Velocity (m·s−1) |
|---|---|---|---|---|---|---|---|---|---|
| NF0 | −0.284 * | −0.033 | −0.016 | −0.263 * | −0.382 ** | 0.130 | −0.167 | 0.004 | 0.025 |
| NF150 | −0.236 * | 0.044 | 0.055 | −0.339 ** | −0.062 | −0.178 | 0.157 | 0.095 | 0.134 |
| NF240 | −0.357 * | 0.120 | 0.134 | −0.435 ** | −0.126 | −0.225 * | 0.218 * | 0.130 | 0.160 |
| NF300 | −0.278 * | 0.133 | 0.147 | −0.487 ** | −0.120 | −0.296 ** | 0.281 ** | 0.151 | 0.170 |
Publisher’s Note: MDPI stays neutral with regard to jurisdictional claims in published maps and institutional affiliations. |
© 2022 by the authors. Licensee MDPI, Basel, Switzerland. This article is an open access article distributed under the terms and conditions of the Creative Commons Attribution (CC BY) license (https://creativecommons.org/licenses/by/4.0/).
Share and Cite
She, Y.; Li, P.; Du, Z.; Qi, X.; Zhao, S.; Li, T.; Guo, W. Nitrogen Fertilization Effects on Soil Nitrate, Water Use, Growth Attributes and Yield of Winter Wheat under Shallow Groundwater Table Condition. Agronomy 2022, 12, 3048. https://doi.org/10.3390/agronomy12123048
She Y, Li P, Du Z, Qi X, Zhao S, Li T, Guo W. Nitrogen Fertilization Effects on Soil Nitrate, Water Use, Growth Attributes and Yield of Winter Wheat under Shallow Groundwater Table Condition. Agronomy. 2022; 12(12):3048. https://doi.org/10.3390/agronomy12123048
Chicago/Turabian StyleShe, Yingjun, Ping Li, Zhenjie Du, Xuebin Qi, Shuang Zhao, Tong Li, and Wei Guo. 2022. "Nitrogen Fertilization Effects on Soil Nitrate, Water Use, Growth Attributes and Yield of Winter Wheat under Shallow Groundwater Table Condition" Agronomy 12, no. 12: 3048. https://doi.org/10.3390/agronomy12123048
APA StyleShe, Y., Li, P., Du, Z., Qi, X., Zhao, S., Li, T., & Guo, W. (2022). Nitrogen Fertilization Effects on Soil Nitrate, Water Use, Growth Attributes and Yield of Winter Wheat under Shallow Groundwater Table Condition. Agronomy, 12(12), 3048. https://doi.org/10.3390/agronomy12123048