


Sample Temperature Affects Measurement of Nitrate with a Rapid Analysis Ion Selective Electrode System Used for N Management of Vegetable Crops

 ,
, 
Abstract
1. Introduction
2. Materials and Methods
2.1. Rapid Analysis Ion Selective Electrode (ISE) System for NO3− Measurement
2.2. Laboratory System for NO3− Measurement
2.3. Effect of Temperature on [NO3−] Measurement with Rapid Test Systems
3. Results
3.1. Laboratory Analysis of the Prepared Aqueous Solutions
3.2. Absolute [NO3−] Measured with ISE Meters at Different Temperatures
3.3. Relation of Relative Error, in Measurements of [NO3−] with ISE Meter, with Temperature
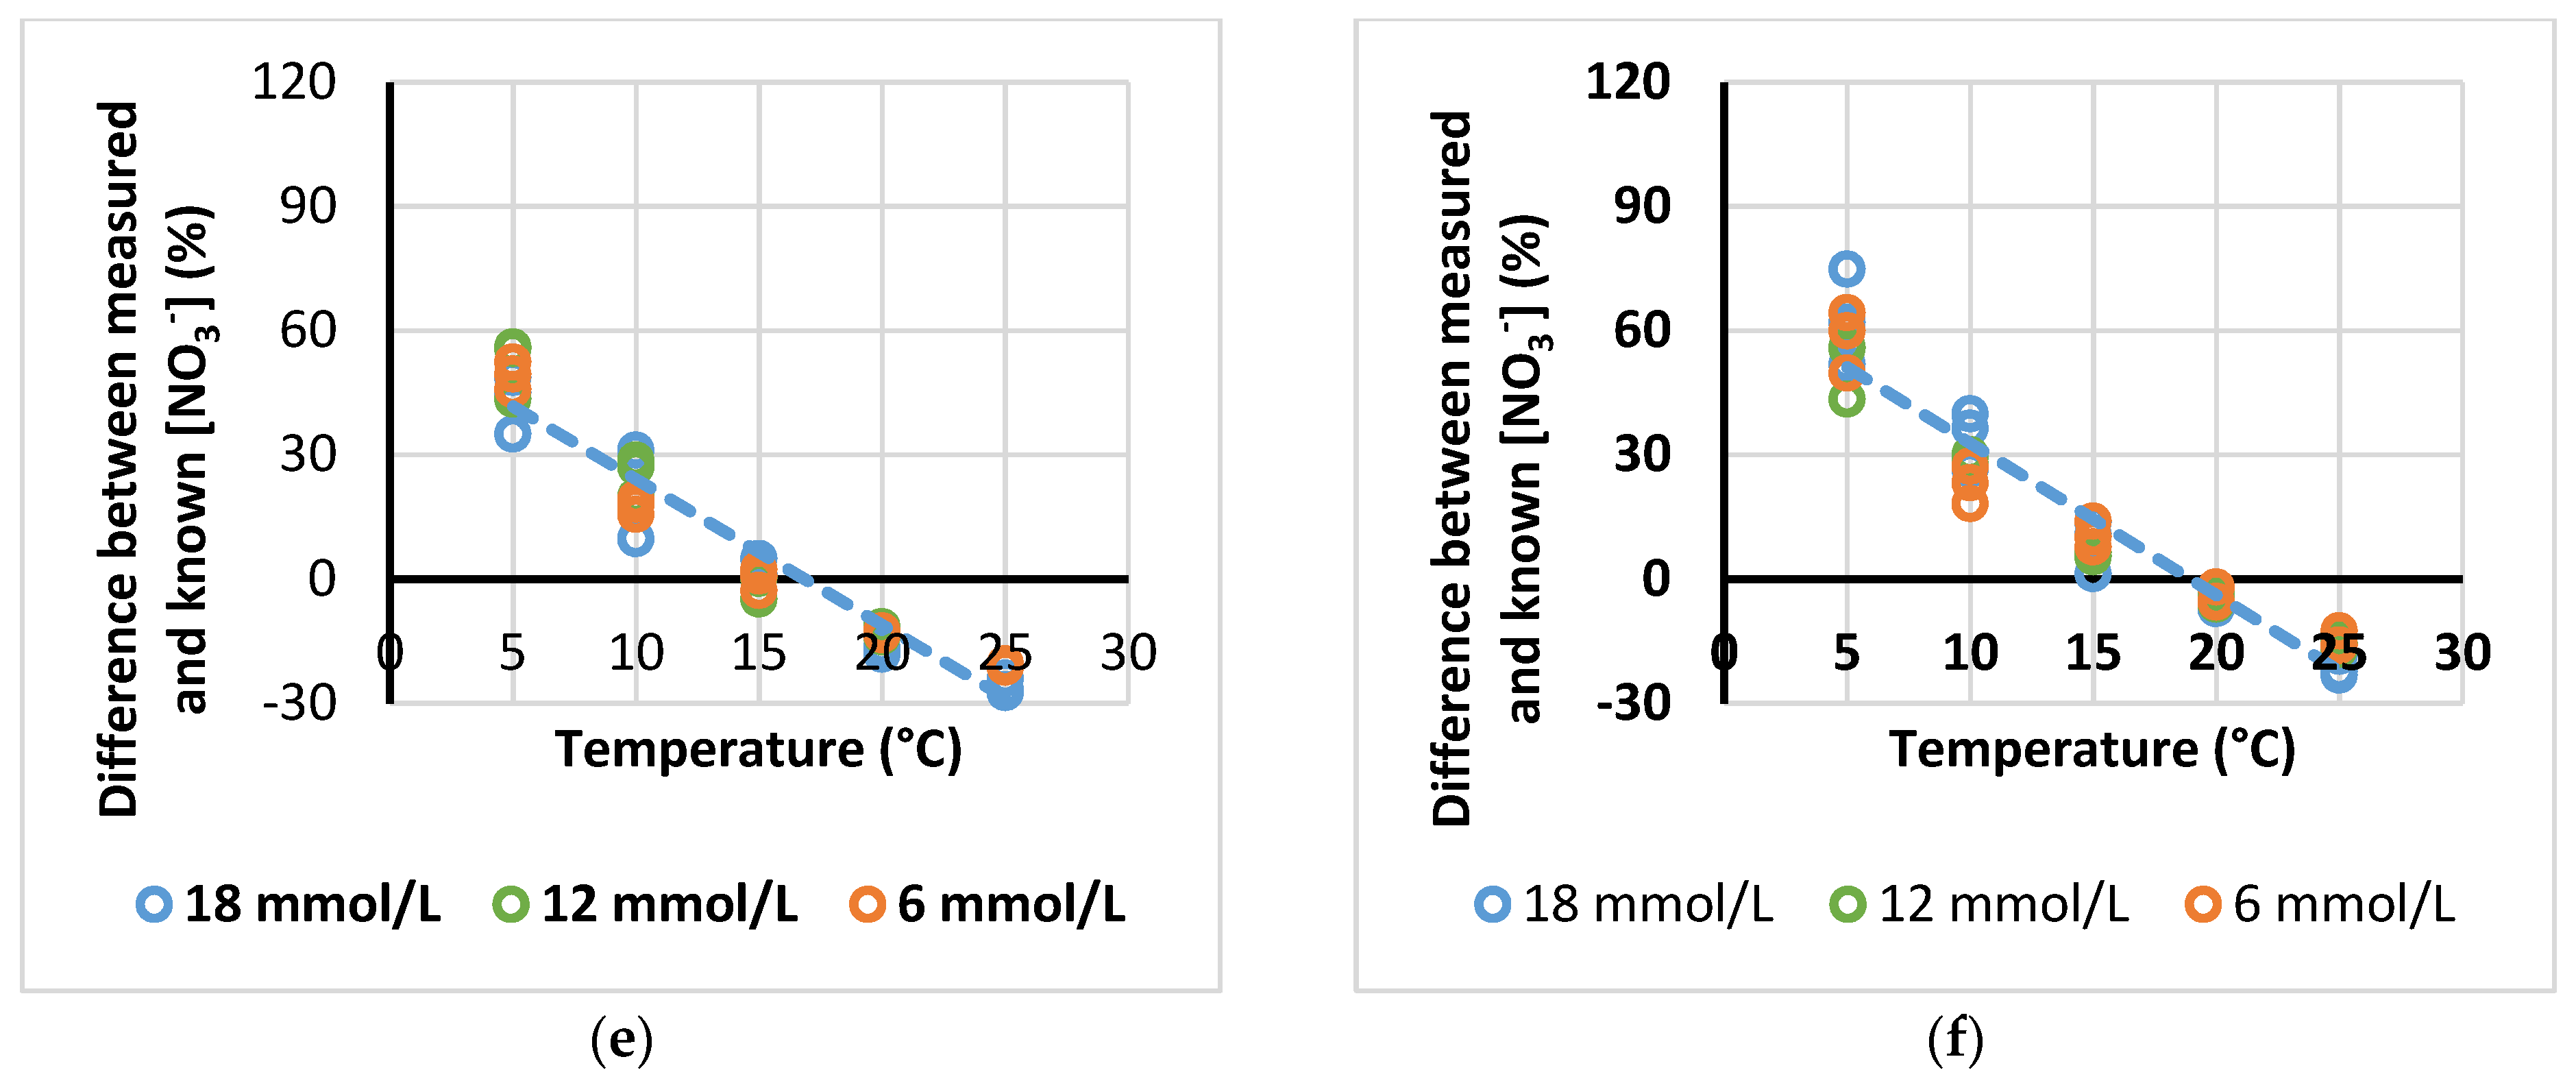
3.4. Effect of NO3− Source on the Temperature-Induced Error in ISE [NO3−] Measurement
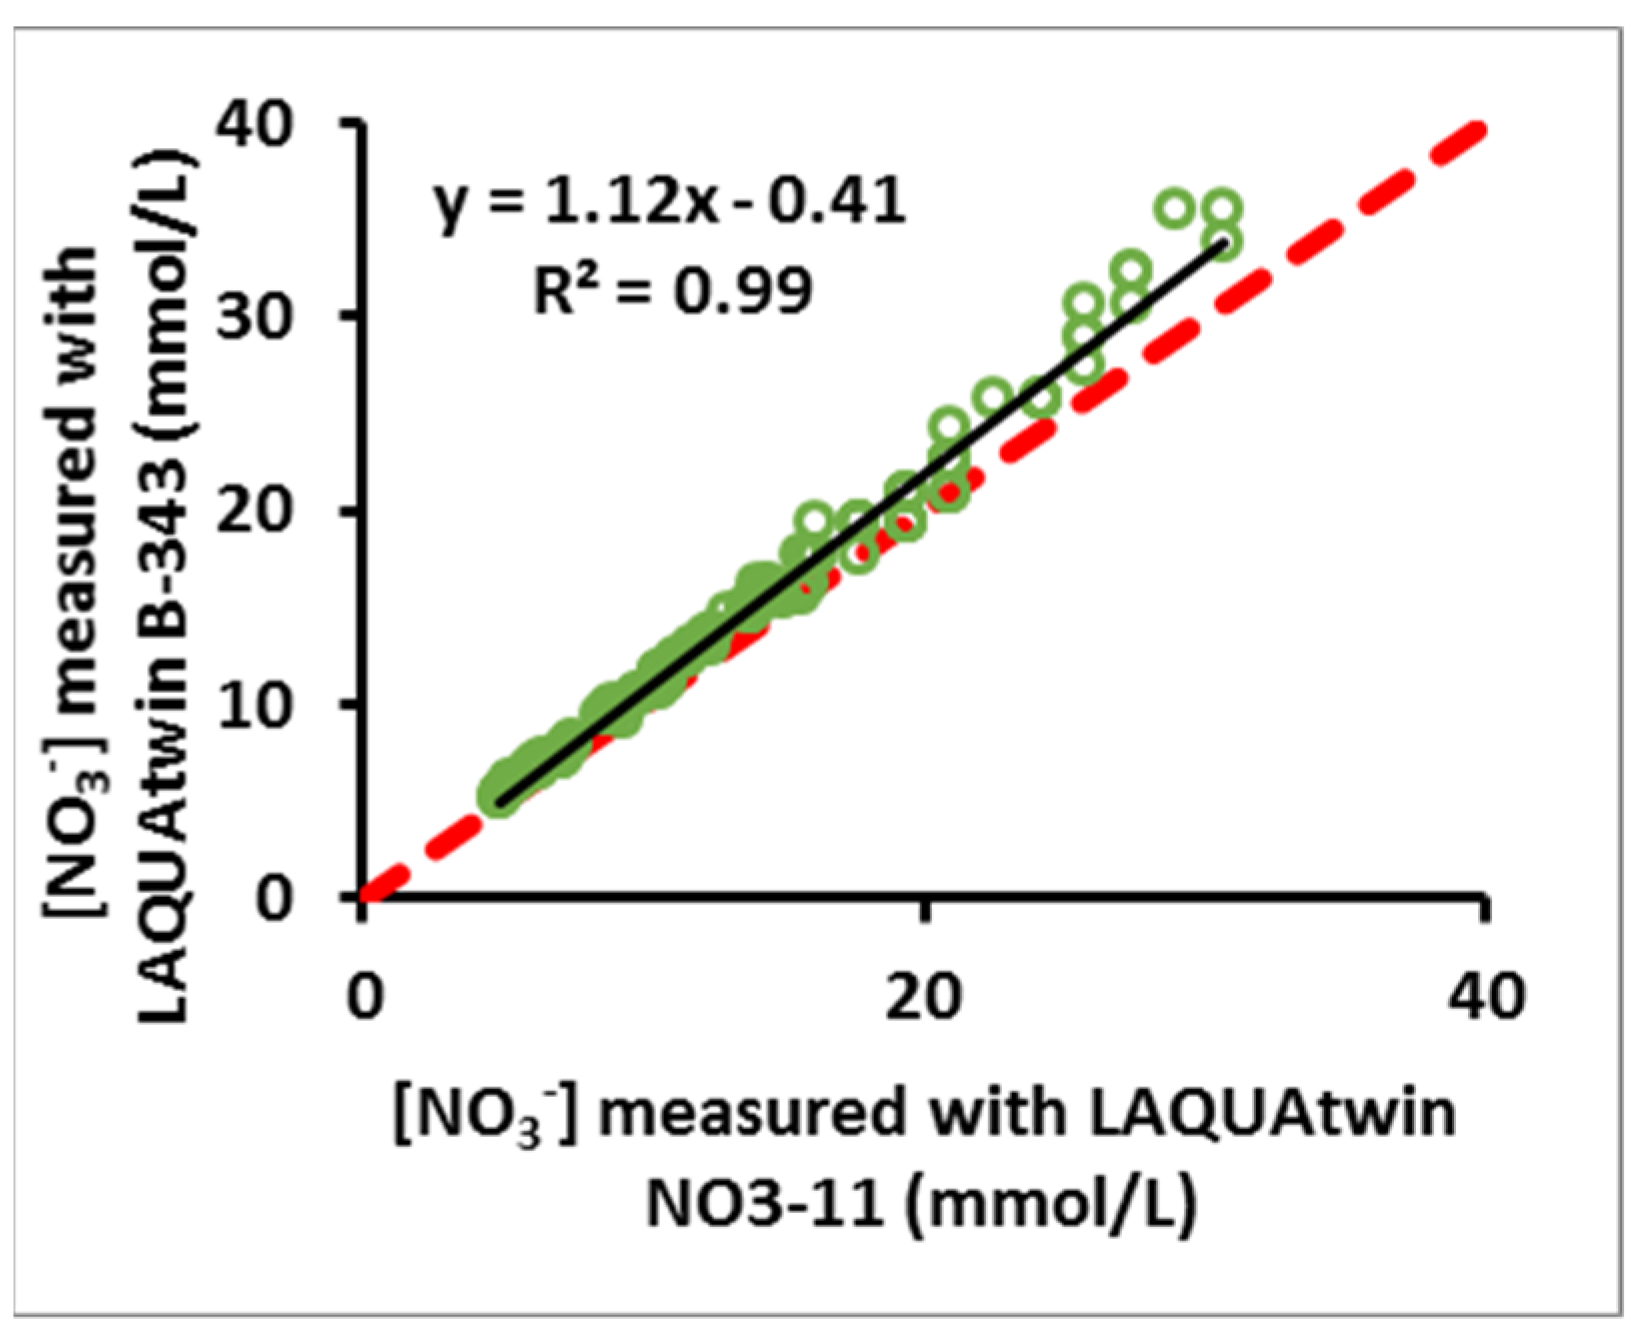
3.5. Comparison of Two Different ISE Meters for Measurement of NO3− in Aqueous Solution
4. Discussion
5. Conclusions
Author Contributions
Funding
Conflicts of Interest
References
- Ju, X.T.; Kou, C.L.; Zhang, F.S.; Christie, P. Nitrogen balance and groundwater nitrate contamination: Comparison among three intensive cropping systems on the North China Plain. Environ. Pollut. 2006, 143, 117–125. [Google Scholar] [CrossRef] [PubMed]
- Zotarelli, L.; Dukes, M.D.; Scholberg, J.M.S.; Muñoz-Carpena, R.; Icerman, J. Tomato nitrogen accumulation and fertilizer use efficiency on a sandy soil, as affected by nitrogen rate and irrigation scheduling. Agric. Water Manag. 2009, 96, 1247–1258. [Google Scholar] [CrossRef]
- Thompson, R.B.; Massa, D.; van Ruijven, J.; Incrocci, L. Reducing contamination of water bodies from European vegetable production systems. Agric. Water Manag. 2020, 240, 106258. [Google Scholar] [CrossRef]
- Qasim, W.; Xia, L.; Lin, S.; Wan, L.; Zhao, Y.; Butterbach-Bahl, K. Global greenhouse vegetable production systems are hotspots of soil N2O emissions and nitrogen leaching: A meta-analysis. Environ. Pollut. 2021, 272, 116372. [Google Scholar] [CrossRef]
- Pardossi, A.; Tognoni, F.; Incrocci, L. Mediterranean greenhouse technology. Chron. Horticult. 2004, 44, 28–34. Available online: https://edepot.wur.nl/414569 (accessed on 24 November 2022).
- Incrocci, L.; Thompson, R.B.; Fernandez-Fernandez, M.D.; De Pascale, S.; Pardossi, A.; Stanghellini, C.; Rouphael, Y.; Gallardo, M. Irrigation management of European greenhouse vegetable crops. Agric. Water Manag. 2020, 242, 106393. [Google Scholar] [CrossRef]
- Thompson, R.B.; Padilla, F.M.; Peña-Fleitas, M.T.; Gallardo, M. Reducing nitrate leaching losses from vegetable production in Mediterranean greenhouses. Acta Hortic. 2020, 1268, 105–118. [Google Scholar] [CrossRef]
- Thompson, R.B.; Martínez-Gaitán, C.; Gallardo, M.; Giménez, C.; Fernández, M.D. Identification of irrigation and N management practices that contribute to nitrate leaching loss from an intensive vegetable production system by use of a comprehensive survey. Agric. Water Manag. 2007, 89, 261–274. [Google Scholar] [CrossRef]
- Thompson, R.B.; Tremblay, N.; Fink, M.; Gallardo, M.; Padilla, F.M. Tools and Strategies for Sustainable Nitrogen Fertilisation of Vegetable Crops. In Advances in Research on Fertilization Management of Vegetable Crops; Tei, F., Nicola, S., Benincasa, P., Eds.; Springer: Cham, Switzerland, 2017; pp. 11–63. [Google Scholar] [CrossRef]
- Zhou, W.; Lv, H.; Chen, F.; Wang, Q.; Li, J.; Chen, Q.; Liang, B. Optimizing nitrogen management reduces mineral nitrogen leaching loss mainly by decreasing water leakage in vegetable fields under plastic-shed greenhouse. Environ. Pollut. 2022, 308, 119616. [Google Scholar] [CrossRef]
- Incrocci, L.; Massa, D.; Pardossi, A. New trends in the fertigation management of irrigated vegetable crops. Horticulturae 2017, 3, 37. [Google Scholar] [CrossRef]
- Thompson, R.B.; Incrocci, L.; Voogt, W.; Pardossi, A.; Magán, J.J. Sustainable irrigation and nitrogen management of fertigated vegetable crops. Acta Hortic. 2017, 1150, 363–378. [Google Scholar] [CrossRef]
- Padilla, F.M.; Farneselli, M.; Gianquinto, G.; Tei, F.; Thompson, R.B. Monitoring nitrogen status of vegetable crops and soils for optimal nitrogen management. Agric. Water Manag. 2020, 241, 106356. [Google Scholar] [CrossRef]
- Gallardo, M.; Thompson, R.B.; Fernández, M.D. Water requirements and irrigation management in Mediterranean greenhouses: The case of the southeast coast of Spain. In Good Agricultural Practices for Greenhouse Vegetable Crops. Principle for Mediterranean Climate Areas; FAO: Rome, Italy, 2013; pp. 109–136. Available online: https://www.fao.org/3/i3284e/i3284e.pdf (accessed on 24 November 2022).
- Thompson, R.B.; Gallardo, M. Use of soil sensors for irrigation scheduling. In Improvement of Water Use Efficiency in Protected Crops; Dirección General de Investigación y Formación Agraria de la Junta de Andalucía, Hortimed; Fernández-Fernández, M., Lorenzo-Minguez, P., Cuadrado Gómez, M.I., Eds.; Cajamar: Almería, Spain, 2005; pp. 351–376. Available online: https://www.researchgate.net/publication/285422793_Use_of_soil_sensors_for_irrigation_scheduling (accessed on 24 November 2022).
- Thompson, R.B.; Gallardo, M.; Valdez, L.C.; Fernández, M.D. Using plant water status to define soil water threshold values for irrigation management of vegetable crops using soil moisture sensors. Agric. Water Manag. 2007, 88, 147–158. [Google Scholar] [CrossRef]
- Zinkernagel, J.; Maestre-Valero, J.F.; Seresti, S.Y.; Intrigliolo, D.S. New technologies and practical approaches to improve irrigation management of open field vegetable crops. Agric. Water Manag. 2020, 242, 106404. [Google Scholar] [CrossRef]
- Hartz, T.K.; Smith, R.F.; LeStrange, M.; Schulbach, K.F. On-farm monitoring of soil and crop nitrogen status by nitrate-selective electrode. Commun. Soil Sci. Plant Anal. 1993, 24, 2607–2615. [Google Scholar] [CrossRef]
- Hartz, T.; Smith, R.; Schulbach, K.; LeStrange, M. On-farm nitrogen tests improve fertilizer efficiency, protect groundwater. Calif. Agric. 1994, 48, 29–32. Available online: https://calag.ucanr.edu/archive/?article=ca.v048n04p29&sharebar=share (accessed on 24 November 2022). [CrossRef]
- Westerveld, S.M.; McKeown, A.W.; Scott-Dupree, C.D.; McDonald, M.R. Assessment of chlorophyll and nitrate meters as field tissue nitrogen tests for cabbage, onions, and carrots. HortTechnology 2004, 14, 179–188. [Google Scholar] [CrossRef]
- Majić, A.; Poljak, M.; Sabljo, A.; Knezović, Z.; Horvat, T. Efficiency of use of chlorophyll meter and Cardy-ion meter in potato nitrogen nutrition supply. Cereal Res. Commun 2008, 36, 1431–1434. Available online: https://www.jstor.org/stable/90002983 (accessed on 24 November 2022).
- Hochmuth, G. Plant Petiole Sap-Testing For Vegetable Crops; University of Florida, IFAS Extension: Gainesville, FL, USA, 2012; Available online: https://edis.ifas.ufl.edu/pdffiles/CV/CV00400.pdf (accessed on 25 October 2022).
- Altamimi, M.E.; Janke, R.R.; Williams, K.A.; Nelson, N.O.; Murray, L.W. Nitrate-nitrogen sufficiency ranges in leaf petiole sap of Brassica oleracea L., pac choi grown with organic and conventional fertilizers. HortScience 2013, 48, 357–368. [Google Scholar] [CrossRef]
- Peña-Fleitas, M.T.; Gallardo, M.; Thompson, R.B.; Farneselli, M.; Padilla, F.M. Assessing crop N status of fertigated vegetable crops using plant and soil monitoring techniques. Ann. Appl. Biol 2015, 167, 387–405. [Google Scholar] [CrossRef]
- Rodríguez, A.; Peña-Fleitas, M.T.; Padilla, F.M.; Gallardo, M.; Thompson, R.B. Petiole sap nitrate concentration to assess crop nitrogen status of greenhouse sweet pepper. Sci. Hortic. 2021, 285, 110157. [Google Scholar] [CrossRef]
- Rodríguez, A.; Peña-Fleitas, M.T.; Padilla, F.M.; Gallardo, M.; Thompson, R.B. Soil monitoring methods to assess immediately available Soil N for fertigated sweet pepper. Agronomy 2020, 10, 2000. [Google Scholar] [CrossRef]
- Schmidhalter, U. Development of a quick on-farm test to determine nitrate levels in soil. J. Plant Nutr. Soil Sci. 2005, 168, 432–438. [Google Scholar] [CrossRef]
- Maggini, R.; Carmassi, G.; Incrocci, L.; Pardossi, A. Evaluation of quick test kits for the determination of nitrate, ammonium and phosphate in soil and in hydroponic nutrient solutions. Agrochimica 2010, 54, 331–341. [Google Scholar]
- Parks, S.E.; Irving, D.E.; Milham, P.J. A critical evaluation of on-farm rapid tests for measuring nitrate in leafy vegetables. Sci. Hortic. 2012, 134, 1–6. [Google Scholar] [CrossRef]
- Kubota, A.; Thompson, T.L.; Doerge, T.A.; Godin, R.E. A petiole sap nitrate test for broccoli. J. Plant Nutr. 1997, 20, 669–682. [Google Scholar] [CrossRef]
- Rosen, C.J.; Errebhi, M.; Wang, W. Testing petiole sap for nitrate and potassium: A comparison of several analytical procedures. HortScience 1996, 31, 1173–1176. [Google Scholar] [CrossRef]
- Fontes, P.C.R.; Coelho, E.L.; Américo Cardoso, A. Petiole sap nitrate and leaf nitrogen critical values in melon plants grown in unheated greenhouse and field conditions. J. Plant Nutr. 2003, 26, 1403–1411. [Google Scholar] [CrossRef]
- Carson, L.; Ozores-Hampton, M.; Morgan, K. Correlation of petiole sap nitrate-nitrogen concentration measured by ion selective electrode, leaf tissue nitrogen concentration, and tomato yield in Florida. J. Plant Nutr. 2016, 39, 1809–1819. [Google Scholar] [CrossRef]
- Ott-Borrelli, K.A.; Koenig, R.T.; Miles, C.A. A comparison of rapid potentiometric and colorimetric methods for measuring tissue nitrate concentrations in leafy green vegetables. HortTechnology 2009, 19, 439–444. [Google Scholar] [CrossRef]
- Peña-Fleitas, M.T.; Gallardo, M.; Padilla, F.M.; Rodríguez, A.; Thompson, R.B. Use of a portable rapid analysis system to measure nitrate concentration of nutrient and soil solution, and plant sap in greenhouse vegetable production. Agronomy 2021, 11, 819. [Google Scholar] [CrossRef]
- Thompson, R.B.; Gallardo, M.; Joya, M.; Segovia, C.; Martinez-Gaitan, C.; Granados, M.R. Evaluation of rapid analysis systems for on-farm nitrate analysis in vegetable cropping. Span. J. Agric. Res. 2009, 7, 200–211. [Google Scholar] [CrossRef]
- da Costa Almeida, P.; Oliveira, C.; Mota, M.; Ribeiro, H. Rapid sap nutrient analysis methods in Malus Domestica Borkh Cv. ‘Gala’. Commun. Soil Sci. Plant Anal. 2020, 51, 1693–1706. [Google Scholar] [CrossRef]
- Di Gioia, F.; Simonne, E.H.; Gonnella, M.; Santamaria, P.; Gazula, A.; Sheppard, Z. Assessment of ionic interferences to nitrate and potassium analyses with ion-selective electrodes. Commun. Soil Sci. Plant Anal. 2010, 41, 1750–1768. [Google Scholar] [CrossRef]
- Vaughan-Jones, R.D.; Kaila, K. The sensitivity of liquid sensor, ion-selective microelectrodes to changes in temperature and solution level. Pflug. Arch. 1986, 406, 641–644. [Google Scholar] [CrossRef] [PubMed]
- Bler, A.W. Introduction to Ion-Selective Measurement. Hach Company. 2009. Available online: https://us.vwr.com/assetsvc/asset/en_US/id/7979405/contents (accessed on 25 October 2022).
- Caldwell, E.; Savoy, H.; Leib, B. Growing season measurement of petiole sap nitrate-n concentrations in burley tobacco to predict yield and tobacco specific nitrosamines in the cured leaf. Commun. Soil Sci. Plant Anal. 2010, 41, 2545–2554. [Google Scholar] [CrossRef]
- Lu, Q.; Miles, C.; Tao, H.; DeVetter, L. Evaluation of real-time nutrient analysis of fertilized raspberry using petiole sap. Front. Plant Sci. 2022, 13, 918021. [Google Scholar] [CrossRef]
- Horiba Scientific. Laqua. Waterproof Pocket Water Quality Meters; Brochure PBT-02-2017A. 2017. Available online: https://static.horiba.com/fileadmin/Horiba/Water_Quality/04_Support/Brochures/Pocket_Meters/Brochure_-_PBT-02-2017A_LAQUAtwin_Pocket_Water_Quality_Meter_-_LOWRES.pdf (accessed on 25 October 2022).
- Rodrigo, M.C.; Ginestar, J.; Boix, M.; Ramos, C. Evaluation of rapid methods for nitrate plant sap analysis of globe artichoke grown in sand culture. Acta Hortic. 2005, 697, 393–397. [Google Scholar] [CrossRef]
- Tully, K.L.; Weil, R. Ion-selective electrode offers accurate, inexpensive method for analyzing soil solution nitrate in remote regions. Commun. Soil Sci. Plant Anal. 2014, 45, 1974–1980. [Google Scholar] [CrossRef]
- Cabrera, F.J.; Bonachela, S.; Fernández, M.D.; Granados, M.R.; López, J.C. Lysimetry methods for monitoring soil solution electrical conductivity and nutrient concentration in greenhouse tomato crops. Agric. Water Manag. 2016, 178, 171–179. [Google Scholar] [CrossRef]


| LaquaTWIN Meter | Source NO3− | Equation | R2 | Intersection x Axis (°C) |
|---|---|---|---|---|
| NO3-11 | KNO3 | y = −3.81x + 68.6 | 0.93 | 18.0 |
| NO3-11 | Ca(NO3)2 | y = −3.23x + 54.8 | 0.90 | 17.0 |
| NO3-11 | NaNO3 | y = −3.54x + 60.2 | 0.93 | 17.0 |
| B343 | KNO3 | y = −4.22x + 85.1 | 0.92 | 20.2 |
| B343 | Ca(NO3)2 | y = −3.62x + 69.4 | 0.87 | 19.2 |
| B343 | NaNO3 | y = −3.69x + 70.4 | 0.94 | 19.1 |
| All data | y = −3.68x + 68.1 | 0.88 | 18.5 |
| Temperature (°C) | Estimated Relative Error in Measurement of [NO3−] (%) |
|---|---|
| 5 | 49.7 |
| 10 | 31.3 |
| 15 | 12.9 |
| 20 | −5.5 |
| 25 | −23.9 |
| Source NO3− | Equation | R2 | Intersection x Axis (°C) |
|---|---|---|---|
| KNO3 | y = −4.01x + 76.9 | 0.93 | 19.1 |
| Ca(NO3)2 | y = −3.33x + 57.7 | 0.88 | 17.3 |
| NaNO3 | y = −3.59x + 64.4 | 0.93 | 17.9 |
Publisher’s Note: MDPI stays neutral with regard to jurisdictional claims in published maps and institutional affiliations. |
© 2022 by the authors. Licensee MDPI, Basel, Switzerland. This article is an open access article distributed under the terms and conditions of the Creative Commons Attribution (CC BY) license (https://creativecommons.org/licenses/by/4.0/).
Share and Cite
Peña-Fleitas, M.T.; Grasso, R.; Gallardo, M.; Padilla, F.M.; de Souza, R.; Rodríguez, A.; Thompson, R.B. Sample Temperature Affects Measurement of Nitrate with a Rapid Analysis Ion Selective Electrode System Used for N Management of Vegetable Crops. Agronomy 2022, 12, 3031. https://doi.org/10.3390/agronomy12123031
Peña-Fleitas MT, Grasso R, Gallardo M, Padilla FM, de Souza R, Rodríguez A, Thompson RB. Sample Temperature Affects Measurement of Nitrate with a Rapid Analysis Ion Selective Electrode System Used for N Management of Vegetable Crops. Agronomy. 2022; 12(12):3031. https://doi.org/10.3390/agronomy12123031
Chicago/Turabian StylePeña-Fleitas, M. Teresa, Rafael Grasso, Marisa Gallardo, Francisco M. Padilla, Romina de Souza, Alejandra Rodríguez, and Rodney B. Thompson. 2022. "Sample Temperature Affects Measurement of Nitrate with a Rapid Analysis Ion Selective Electrode System Used for N Management of Vegetable Crops" Agronomy 12, no. 12: 3031. https://doi.org/10.3390/agronomy12123031
APA StylePeña-Fleitas, M. T., Grasso, R., Gallardo, M., Padilla, F. M., de Souza, R., Rodríguez, A., & Thompson, R. B. (2022). Sample Temperature Affects Measurement of Nitrate with a Rapid Analysis Ion Selective Electrode System Used for N Management of Vegetable Crops. Agronomy, 12(12), 3031. https://doi.org/10.3390/agronomy12123031