Article

Phosphorus Sorption following the Application of Charcoal and Sago (Metroxylon sagu) Bark Ash to Acid Soils

by
Prisca Divra Johan
1,
Osumanu Haruna Ahmed
2,*,
Nur Aainaa Hasbullah
3,
Latifah Omar
1,4,
Puvan Paramisparam
1,
Nur Hidayah Hamidi
1,
Mohamadu Boyie Jalloh
3,* and
Adiza Alhassan Musah
5,6
1
Department of Crop Science, Faculty of Agricultural Science and Forestry, Universiti Putra Malaysia, Bintulu Sarawak Campus, Bintulu 97008, Malaysia
2
Faculty of Agriculture, Universiti Islam Sultan Sharif Ali, Kampus Sinaut, KM 33 Jalan Tutong Kampung Sinaut, Tutong TB1741, Brunei
3
Crop Production Programme, Faculty of Sustainable Agriculture, Universiti Malaysia Sabah, Sandakan Branch, Locked Bag No. 3, Sandakan 90509, Malaysia
4
Institut Ekosains Borneo (IEB), Faculty of Agriculture and Forestry Sciences, Universiti Putra Malaysia, Bintulu Sarawak Campus, Bintulu 97008, Malaysia
5
Department of Business Management and Law, Faculty of Business Management and Professional Studies, Management & Science University, University Drive, Off Persiaran Olahraga Section 13, Shah Alam 40100, Malaysia
6
Graduate School of Management Post Graduate Centre, Management & Science University, University Drive, Off Persiaran Olahraga Section 13, Shah Alam 40100, Malaysia
*
Authors to whom correspondence should be addressed.
Agronomy 2022, 12(12), 3020; https://doi.org/10.3390/agronomy12123020
Submission received: 12 September 2022 / Revised: 8 October 2022 / Accepted: 29 October 2022 / Published: 29 November 2022

Abstract

:
Acidic cations such as Al, Fe, and Mn tend to fix P in soils, and this reaction make P unavailable for plant uptake. Several conventional strategies for farmers had been proposed to ameliorate Al toxicity either via liming or continuous P fertilization. However, these approaches are not only expensive but are also environmental unfriendly. Thus, a sorption study was carried out using charcoal and sago bark ash as soil amendments to determine their effects on P sorption characteristics of low pH soils. Phosphorus sorption determination was based on standard procedures and the P adsorption data for the samples tested in this study were fitted to the Langmuir equation. The results suggest that the combined use of charcoal and sago bark ash decreased P adsorption and increased P desorption relative to the untreated soils. Organic matter in the charcoal reduced P sorption by providing more negatively charged surfaces, thus increasing anion repulsion. Apart from increasing the amount of P adsorbed in the soil, the use of the sago bark ash increased the amount of P desorbed because the primary reaction between the sago bark ash and soils is an acid neutralization reaction. These improvements do not only reduce P fixation in acid soils but they also promote the effective utilization of nutrients via the timely release of nutrients for maximum crop production. In conclusion, the incorporation of charcoal and sago bark ash to the soil had a positive effect on replenishing the soil solution’s P. The organic matter of the charcoal reduces P sorption capacity by blocking P binding sites, increasing the negative electric potential in the plane of adsorption, causing steric hindrance on the mineral surfaces and decreasing goethite and hematite-specific surface areas. However, there is a need for the inclusion of more soil chemical, physical, and mineralogical properties in predicting soil P sorption to enhance the reliability of the findings.

1. Introduction

Adsorption and desorption reactions are considered as key aspects of the chemical behaviour of P in soils [1]. Phosphorus adsorption is the process of removing phosphate ions from the solution and binding them to soil components [2,3], whereas P desorption is the process of returning bound soil P to the solution [4]. Phosphorus adsorption is determined by the availability of native soil P and the amount of P applied to soils as fertilizers. When soluble P compounds are applied to the soil, they undergo a series of complex reactions that can reduce P availability to crops. Thus, P compounds often react rapidly with other soil minerals by precipitation and adsorption onto the soil’s solid particle surfaces. Furthermore, the adsorption reaction is one of the principal processes involved in the retention of P on soil surfaces. Depending on the capacity of the soil to replenish the soil solution P, the P removed from the soil solution by plant root needs to be replaced. The P removed from the soil solution can be replaced via the desorption of sorbed P, P released from soil organic matter via the mineralization of soil organic matter or added organic inputs, and via the application of P fertilizer to the soil. According to Guedes et al. [5], the addition of organic matter to soils can be an efficient strategy to optimize P fertilization by reducing P sorption and enhancing sorbed P reversibility.
The main factors which affect maximum soil P adsorption capacity include pH, clay mineralogy, types of Fe and Al oxide content, particle size distribution, the crystallinity of soil oxide, and the quality and quantity of organic matter [6,7,8,9]. In high pH environments, the strength of P sorption–desorption is significant but not as severe as in acid conditions. This is because in acid soils, plant P uptake is very low, which is reflected in the low recovery P-fertilizer rates of 5 to 25% [10]. Phosphate adsorption isotherms can be defined as the quantitative equilibrium relationships between the amounts of adsorbed and dissolved phosphate species at constant temperatures [11]. Phosphate sorption isotherms are crucial for determining the interaction of P anions with oxides and soil, and they have been used to quantify soil adsorption capacity. Adsorption is usually characterized by fitting the adsorption isotherm and their mathematical description using one or more adsorption equations [12]. Langmuir, Freundlich, Brunauer–Emmett–Teller (BET), Dubinin–Radushkevich, and Temkin isotherm adsorption isotherms are commonly used isotherms for understanding the relationship between the adsorbate (applied nutrients) and adsorbent (soil or amendment) [13,14].
The mechanism underlying the altered P availability caused by the application of compost, biochar, manure, crop residues, and zeolite to soils has been extensively explored [15,16,17,18]. However, to date, the use of charcoal and sago bark ash as soil amendments received considerable interest because little literature exists on P sorption characteristics of these amendments. Thus, it is hypothesized that amending charcoal and sago bark ash to soils will enhance P availability by increasing soil pH and reversing P fixation to provide readily and timely available P. This is possible because of the presence of humic substances in the charcoal with functional groups such as R-COO-, R-C=O, R-COH, and R-SH. These functional groups are capable of adsorbing detrimental ions (Al3+ and Fe2+), resulting in delayed P adsorption or precipitation in soils [19,20]. Furthermore, the reaction is enhanced by the increase in soil pH because of the application of the sago bark ash. The pertinent research question this study addressed is how much P can be adsorbed and desorbed by charcoal and sago bark ash in response to the soil solution’s equilibrium? Understanding the basic P chemistry and interactions in soils would enable designing appropriate agronomic management strategies and predict the amount of fertilizers required in applications in soils. Therefore, the objective of this sorption study was to determine the ability of charcoal and sago bark ash to regulate P adsorption and desorption in highly weathered acid soil.

2. Materials and Methods

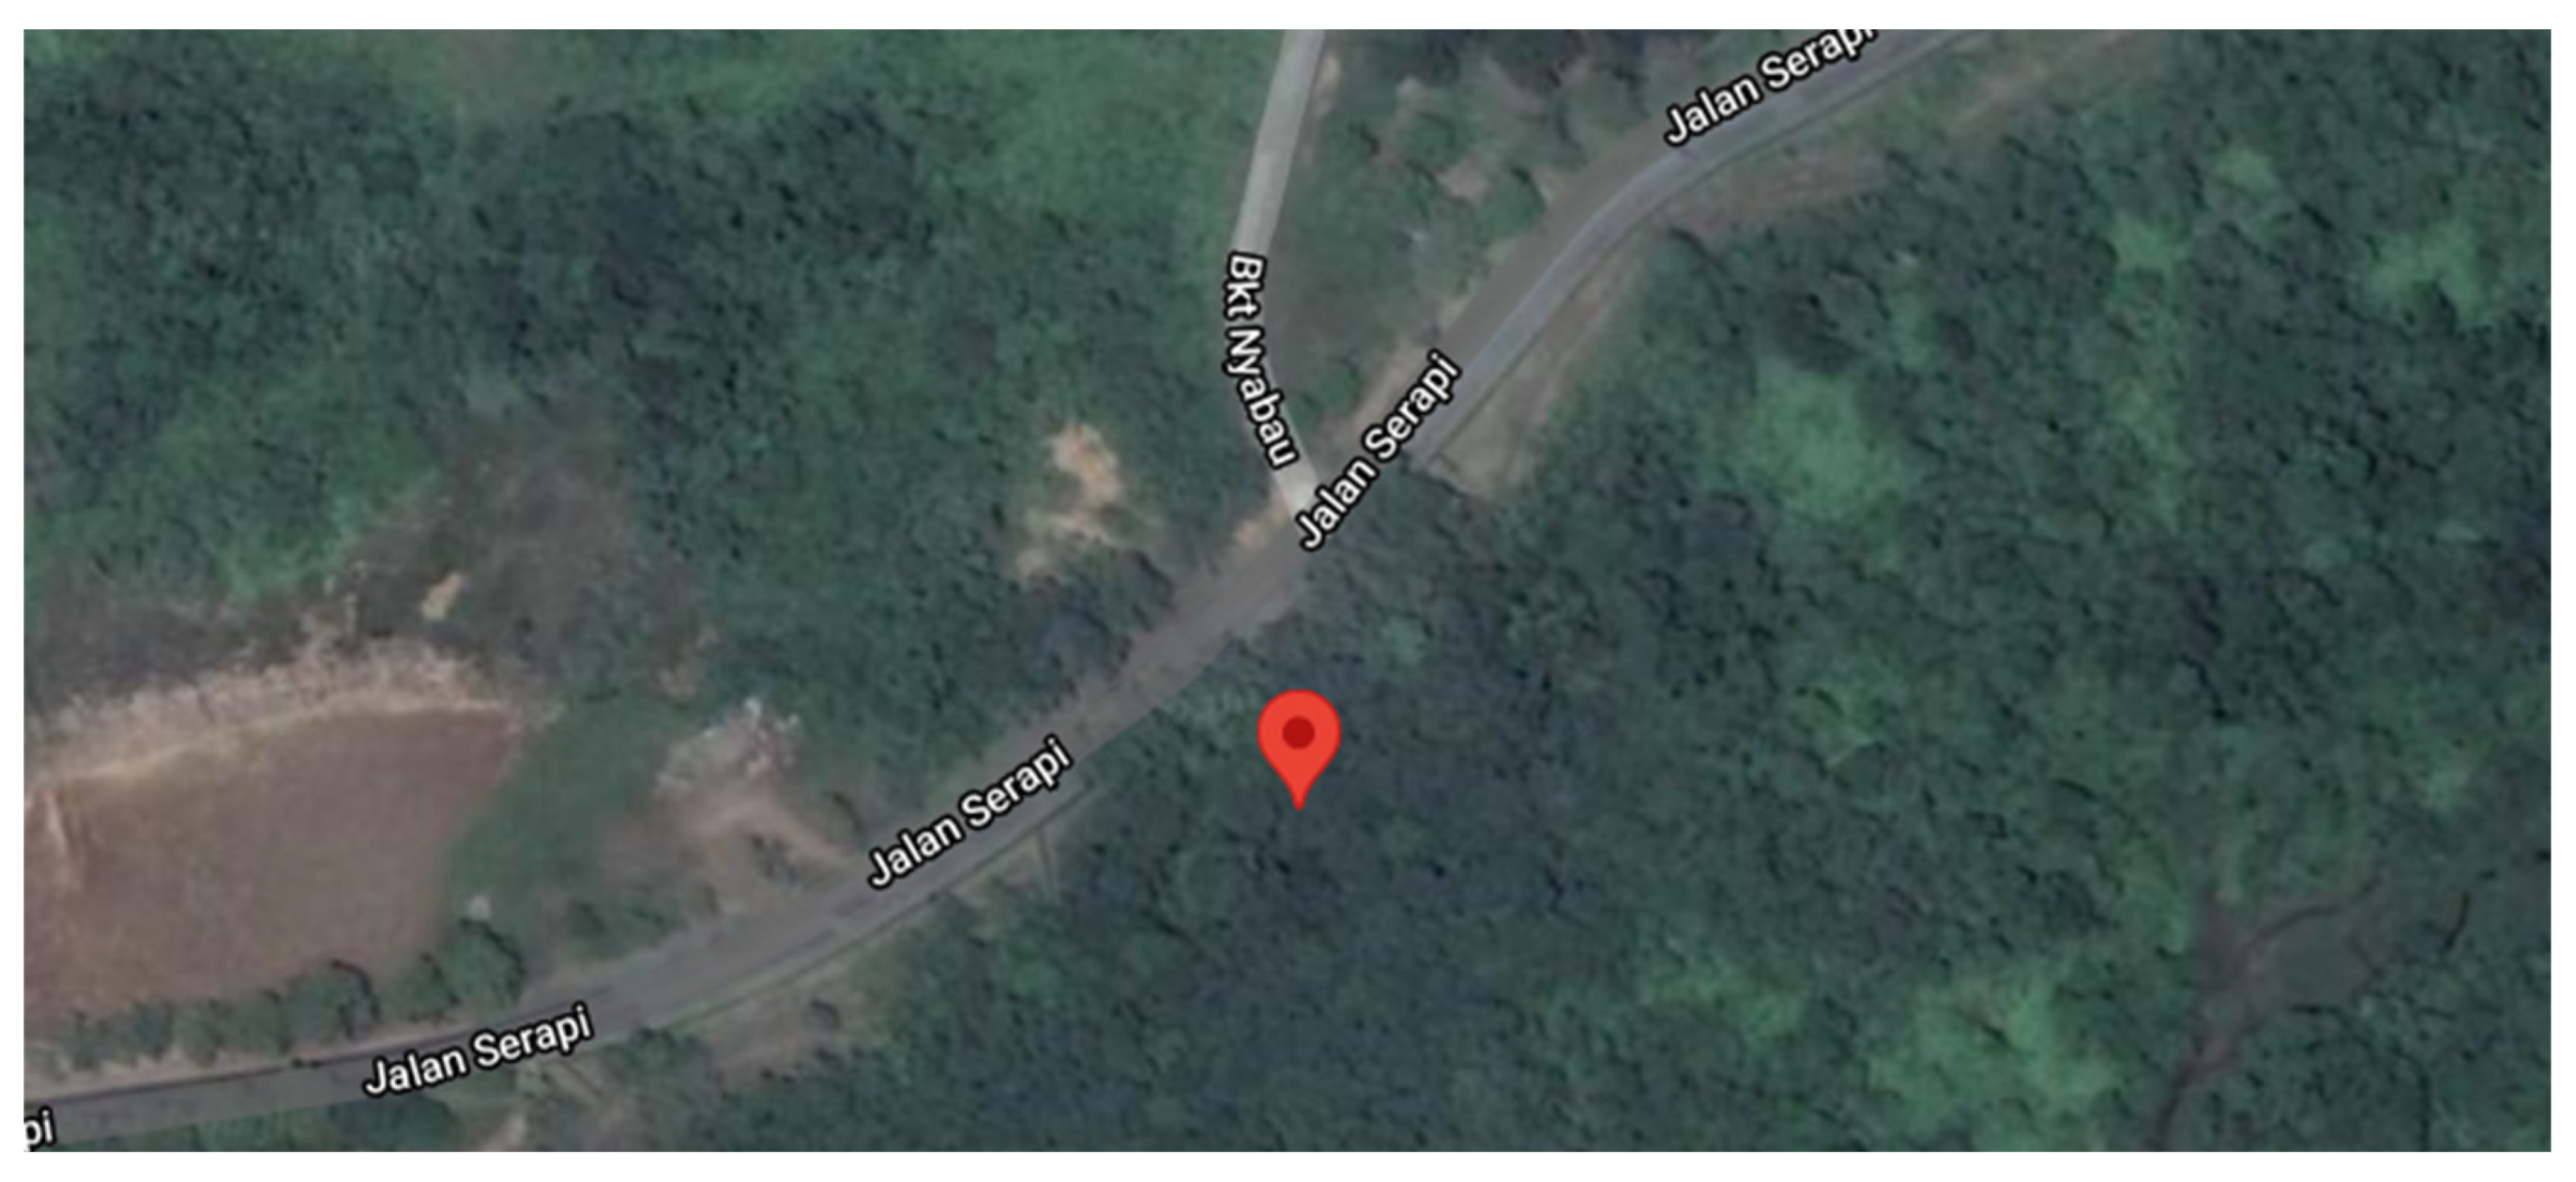
2.1. Soil Sampling and Preparation

The soil used in this present study was collected from an uncultivated secondary forest at Universiti Putra Malaysia Bintulu Sarawak Campus (UPMKB) with geographical coordinates of 3°12′20″ N, 113°04′20″ E (Figure 1). The soil belongs to the Bekenu series (Typic Paleudults). This soil series was selected because it is commonly cultivated with different crops in Malaysia despite its acidity high P fixation characteristics. The high P fixation is due to its high Al and Fe contents. The area has an elevation of 27.3 m, an annual rainfall of 2993 mm, a mean temperature of 27 °C, and relative humidity of approximately 80%. The soil was randomly sampled at 0–20 cm depth. Thereafter, the soil samples were air-dried, crushed, and sieved to pass through a 5 mm sieve to remove twigs, plant roots, and ironstone concretions. Afterwards, the soil samples were bulked and homogenized before being used for the sorption study.

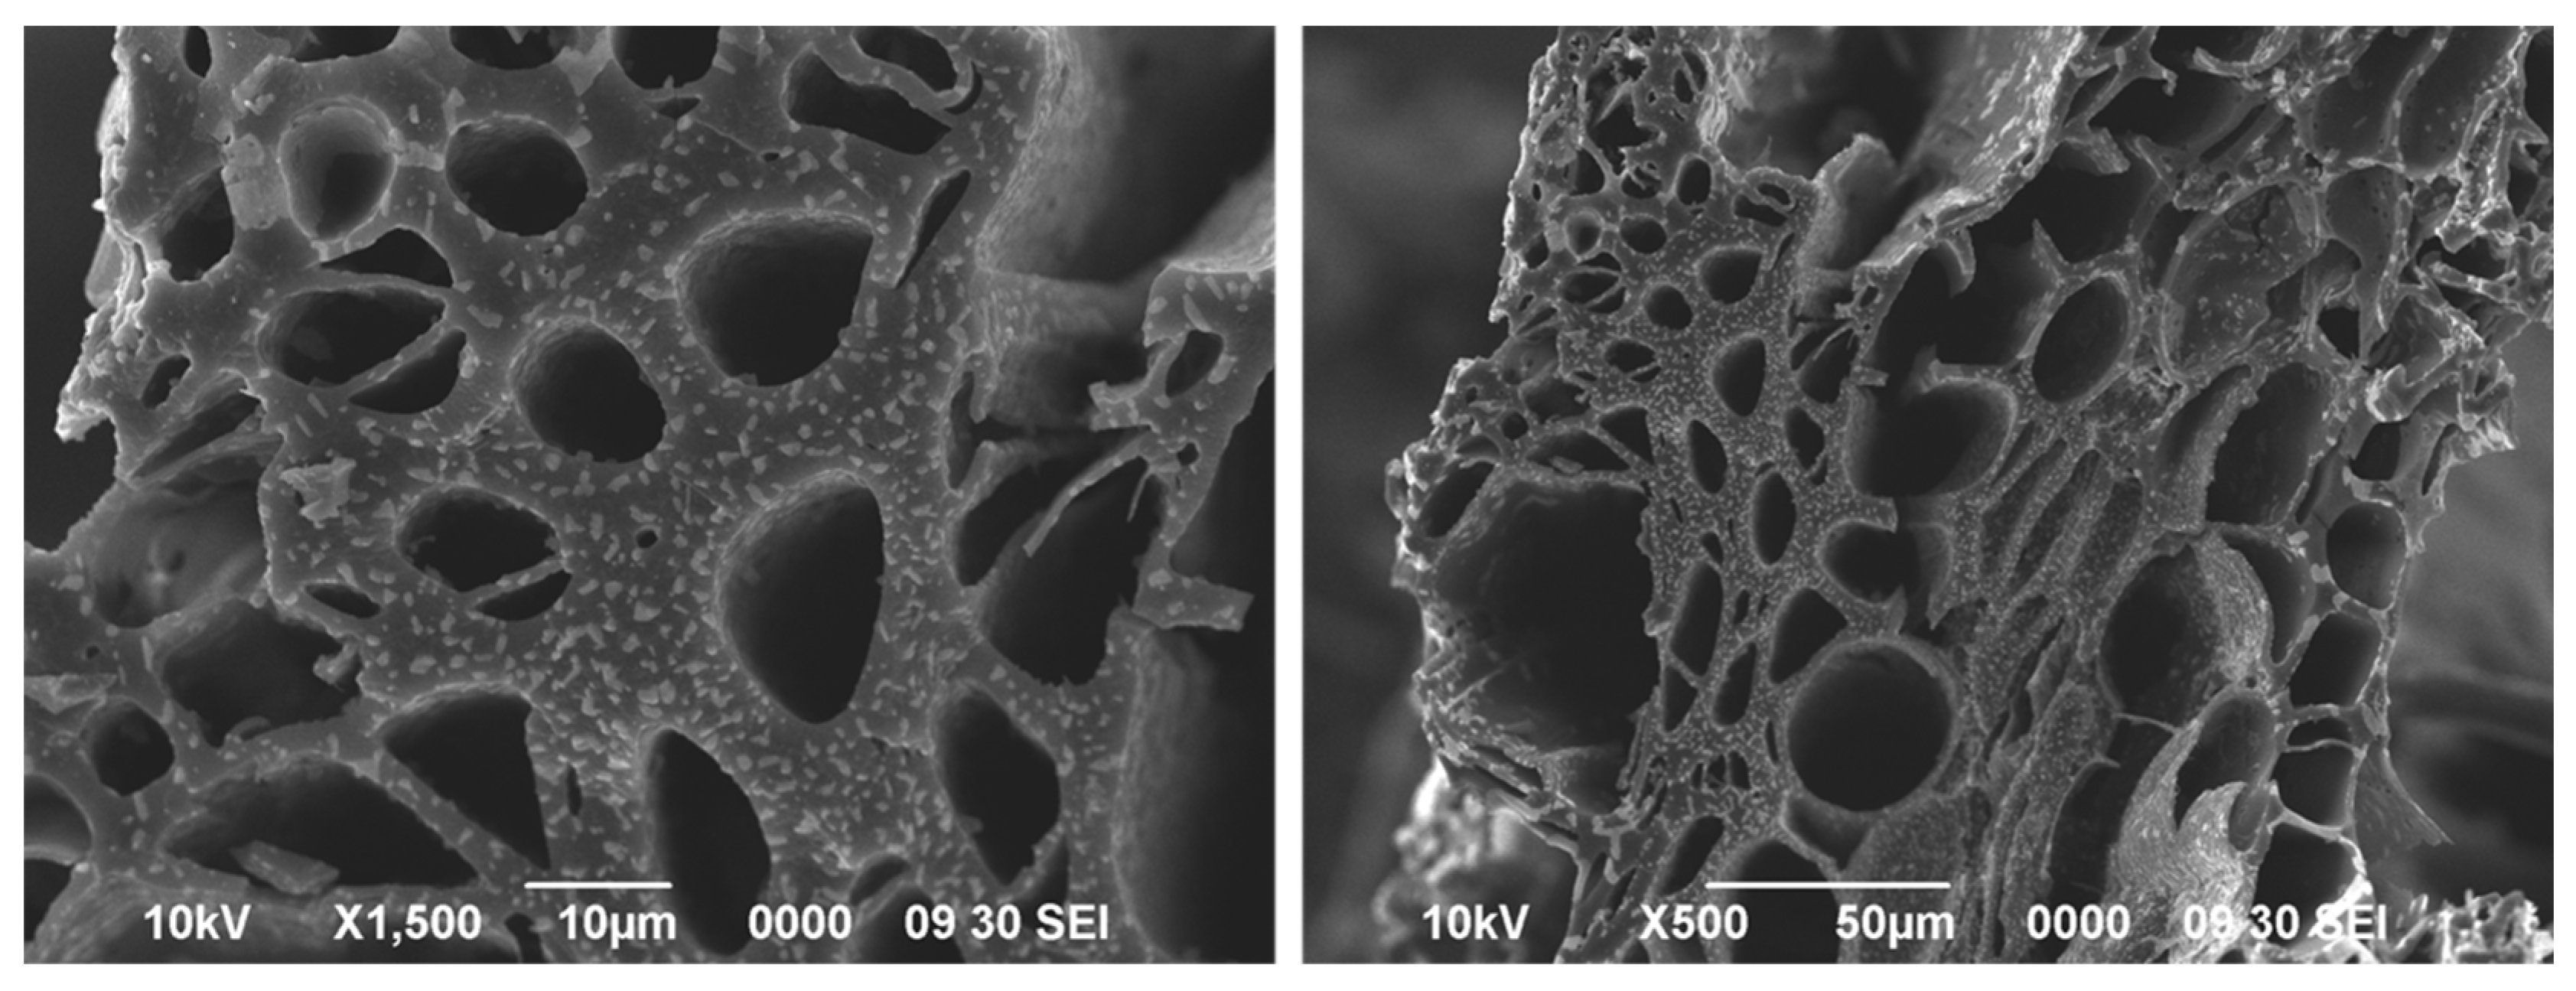
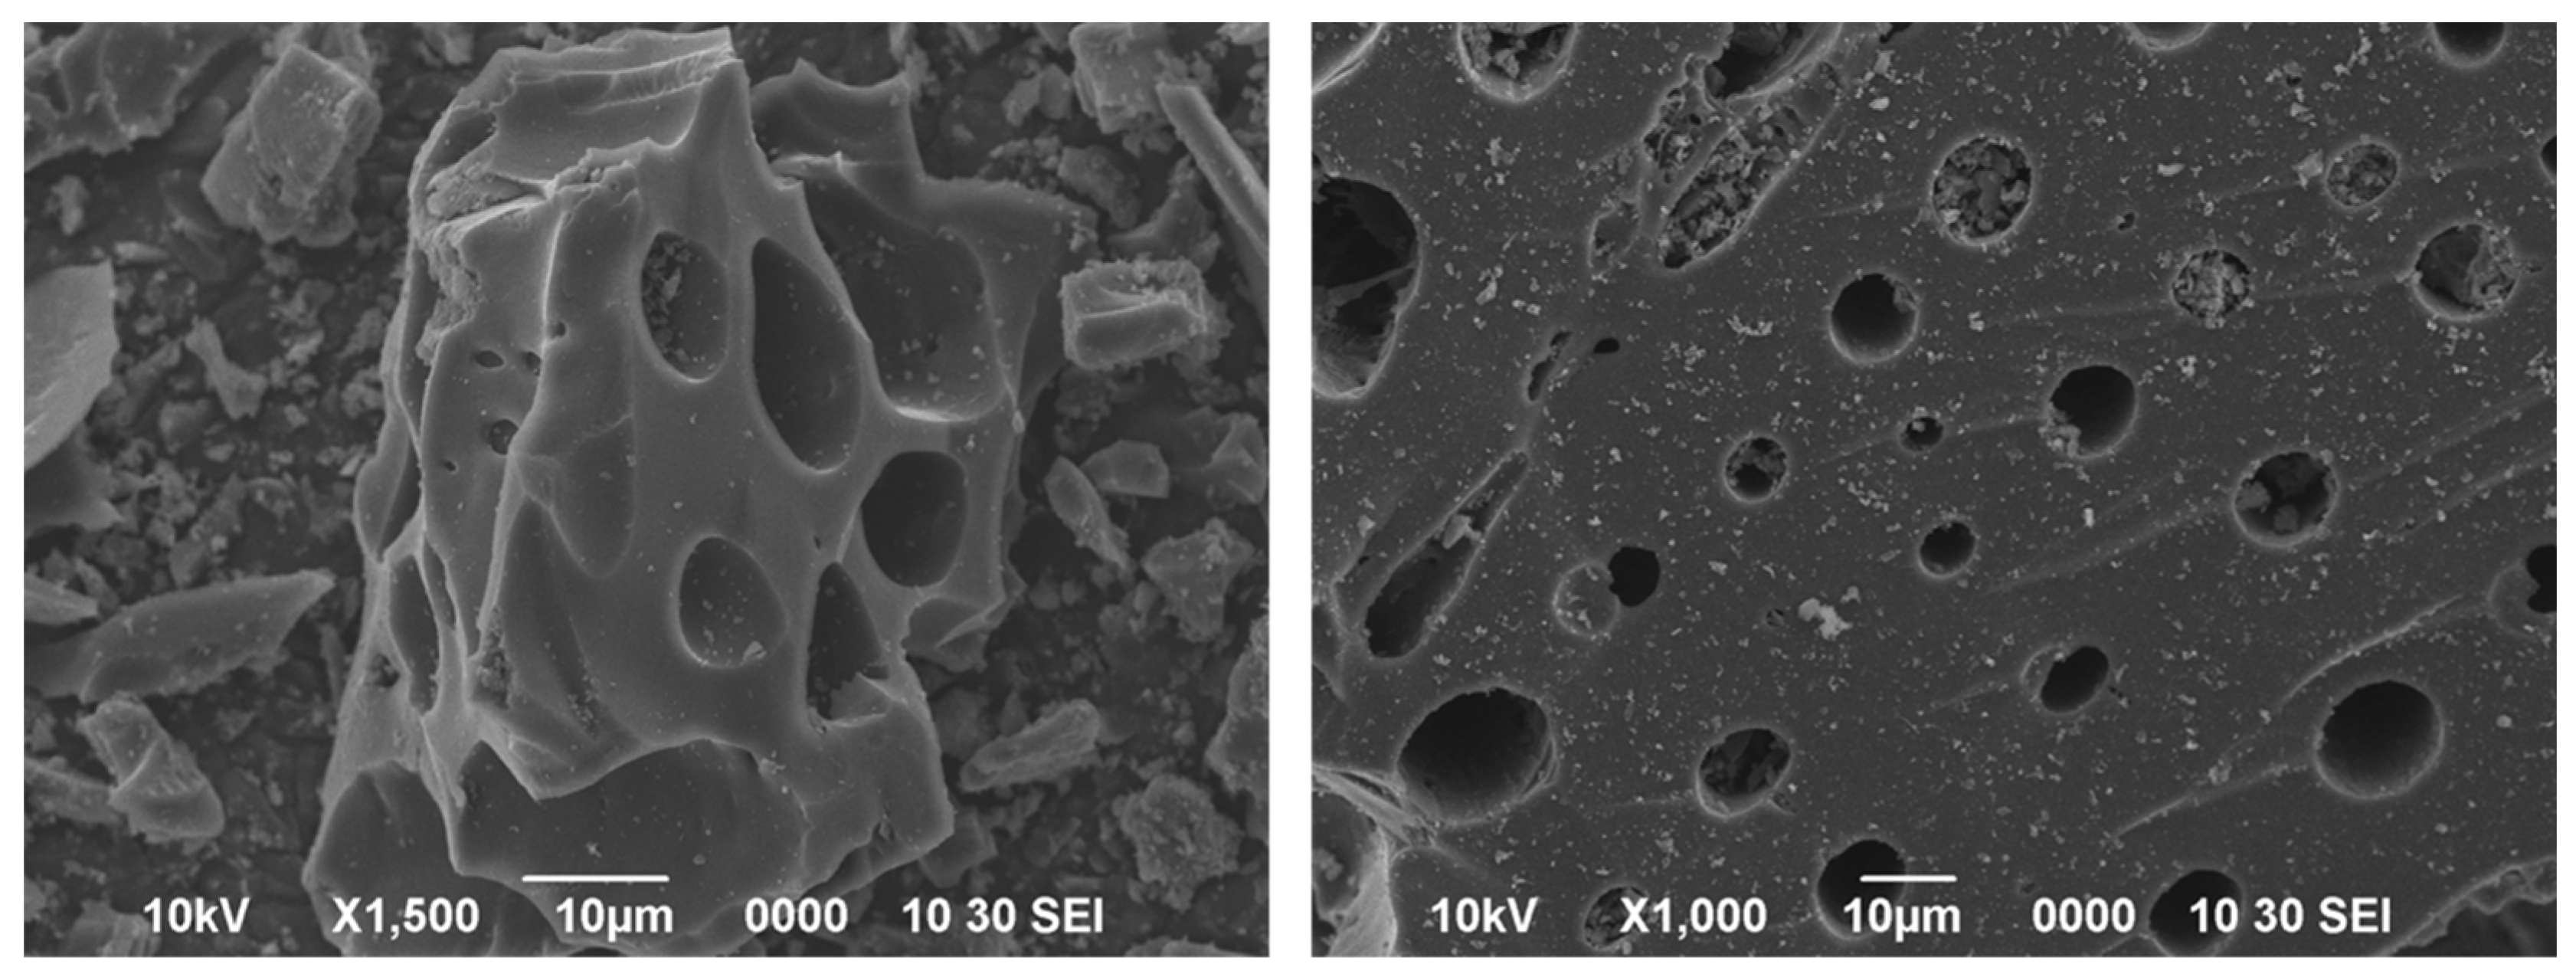
2.2. Soil, Charcoal, and Sago Bark Ash Characterization

The soil was analyzed for its bulk density using coring methods [21]. The texture of the soil was determined using the hydrometer method [22]. The soil pH in water and KCl and soil electrical conductivity (EC) were determined in a 1:2.5 (soil: distilled water / KCl) using a digital pH meter and a digital EC meter [23]. The soil pH in water represents the acidity of the soil solution, whereas the soil pH in KCl indicates the acidity of the soil solution and the reserve acidity of the soil colloids. The soil’s total carbon was calculated as 58% of the organic matter and determined using the loss on ignition method [24]. Total N was determined using Kjeldahl method [25]. The soil’s cation exchange capacity (CEC) was determined using the leaching method [26] followed by steam distillation [25]. Soil exchangeable acidity, Al3+, and H+ were determined using acid–base titration method [27].
Soil total P was extracted using aqua regia method [28]. Aqua regia solution was prepared by mixing concentrated HCl and concentrated HNO3 in a ratio 3:1. Soil weighing 2 g was weighed into a 250 mL conical flask after which 20 mL of aqua regia solution was added. Thereafter, the suspension was heated on a hot plate until the solution turned clear. The suspension was filtered through a filter paper into a 100 mL volumetric flask and distilled water was added to the desired volume. Soil available P and exchangeable cations (K+, Ca2+, Mg2+, Na+, Mn2+, and Fe2+) were extracted using Mehlich No.1 Double Acid method [29]. A double acid solution (mixture of 0.05 M HCl and 0.025 M H2SO4) was prepared by mixing 4.12 mL of concentrated HCl with 1.40 mL of concentrated H2SO4 in a 1000 mL volumetric flask and distilled water was added to the desired volume. A 5 g of soil was weighed and placed into a plastic vial after which a 20 mL of double acid solution was added. Afterwards, the suspension was shaken at 180 rpm for 10 min. The suspension was filtered into a plastic vial using filter paper.
Soil total P and available P were determined using UV-VIS Spectrophotometer (Perkin Elmer Lambda 25, USA) at 882 nm wavelength after a blue colour developed based on the molybdenum blue method described by Murphy and Riley [30]. Acid molybdate (Reagent A) and ascorbic acid stock solutions (Reagent B) were prepared for the blue colour development procedure. A standard P solution (standard solution 1) and a standard solution 2 were prepared and used to prepare working solutions ranging from 0 to 0.6 ppm. Standard solution 2 measuring 1 to 6 mL was pipetted into a 50 mL volumetric flask containing 8 mL of Reagent B and diluted to the volume with distilled water. Therefrom, 8 mL of Reagent B was pipetted into a different 50 mL volumetric flask after which the sample was added depending on the intensity of the blue colour to be developed. The solution was diluted to mark with distilled water. Soil exchangeable cations were determined using Atomic Absorption Spectrometry (AAS) (Analyst 800, Perkin Elmer, Norwalk, CT, USA). The physico-chemical properties of the soil used in the sorption study was within the range reported by Paramananthan [31] except for soil texture.
The charcoal used in this present study was obtained from Pertama Ferroalloys Sdn Bhd, Bintulu, Sarawak, Malaysia, whereas sago bark ash was purchased from Song Ngeng Sago Industries, Dalat, Sarawak, Malaysia. Therefrom, these amendment materials were analyzed for pH in water and in KCl and EC [23]; available P [29,30]; and exchangeable K+, Ca2+, Mg2+, Na+, and Fe2+ [29]. Surface morphologies of the charcoal and sago bark ash were determined using scanning electron microscopy (SEM) (JEOL JSM 6930 LA). The results of the initial characterization the soil, charcoal, and sago bark ash are presented in Table 1, whereas the SEM images of the charcoal and sago bark ash are shown in Figure 2 and Figure 3, respectively.

2.3. Phosphorus Adsorption and Desorption Determination

The phosphorus sorption study was carried out in the Soil Science Laboratory at Universiti Putra Malaysia Bintulu Sarawak Campus. Prior to the P sorption determination, a 300 g of soil (Bekenu Series, Typic Paleudults) (from the 2 mm bulked soil sample) was mixed thoroughly with charcoal and sago bark ash in a container based on the treatments evaluated in this present study. The amount of the amendments used was deduced from the literature (charcoal [32,33] and sago bark ash [34,35,36]), where 10 t ha−1 and 5 t ha−1 were equivalent to 15.42 and 7.71 g, respectively, for 300 g of soil per container. The treatments tested in this study were as follows:
  • S: Soil only;
  • C: Charcoal only;
  • A: Sago bark ash only;
  • SC: 300 g soil + 15.42 g charcoal;
  • SA: 300 g soil + 7.71 g sago bark ash;
  • SCA: 300 g soil + 15.42 g charcoal + 7.71 g sago bark ash.
Phosphorus sorption determination was based on the standard procedure described by Graetz and Nair [37] with slight modifications on the concentrations of potassium dihydrogen phosphate (KH2PO4) used. The original procedure uses a low and narrow range of dissolved inorganic P concentrations because these are the concentrations likely to be encountered in natural systems. However, higher concentrations of P (up to 500 mg P L−1) can be used for isotherm determinations on soils and sediments [38,39,40,41,42]. A 2 g sample of each treatment was weighed into a 250 mL centrifuge bottle. Each treatment had three replicates. A range of P solutions (0, 100, 200, 300, and 400 mg P L−1) was prepared by dissolving KH2PO4 in 0.01 M CaCl2 solution after which 25 mL of these isonormal P solutions was added to the centrifuge bottles to attain 0.0, 2.5, 5.0, 7.5, and 10.0 mg of added P sample−1. Isonormal P solutions were used in this adsorption study to preserve a constant ionic strength in the mixtures (adsorbent and solution) in addition to providing competing ions for exchange sites [43]. The samples were shaken for 24 h at 180 rpm using an orbital shaker. Thereof, the samples were centrifuged at 10,000 rpm for 15 min. The supernatants (equilibrium solution) were collected after centrifugation after which they were analyzed for the P content using UV-VIS Spectrophotometer (Perkin Elmer Lambda 25, USA) at 882 nm wavelength after blue colours developed using molybdenum blue method [30]. The P adsorption at equilibrium (qe) was calculated using the formula described by Peng et al. [44]:
qe = [(Co − Ce) × V] ÷ m
where
  • qe = P adsorption at equilibrium (mg g−1);
  • Co = Initial concentration of P (mg L−1);
  • Ce = P concentration at adsorption equilibrium (mg L−1);
  • V = Volume of P solution used (L);
  • m = Mass of sample (g).
The P adsorption data for the samples tested in this study were fitted to the Langmuir equation. This equation was used because it enables the estimation of maximum P sorption (qmax) and a constant related to P binding strength (KL) [45]. Additionally, the amount of nutrients in the form of a single layer on the soil’s surface is determined using Langmuir isotherms, suggesting that this method is suitable for single-layer surface adsorption reactions with fixed adsorption sites [46,47]. The linear form of the Langmuir equation is given by the following expression:
Ce/qe = Ce/qmax + 1/qmaxKL
where
  • qe = P adsorption at equilibrium (mg g−1);
  • qmax = Maximum adsorption capacity (mg g−1);
  • KL = Langmuir constant related to the binding energy (L mg−1);
  • Ce = P concentration at adsorption equilibrium (mg L−1).
A plot of Ce/qe against Ce produces a straight line; qmax can be obtained from the slope of the line and KL can be obtained from the intercept. The slope of the line gives 1/qmax, whereas the intercept gives 1/qmaxKL. The maximum P buffering capacity (MBC) of the sample was calculated from products of KL and qmax [48].
For the P desorption study, the same samples or the sediments after the centrifugation were washed with ethanol and centrifuged at 10,000 rpm for 10 min. Afterwards, ethanol was discarded. Twenty-five millilitres of 0.01 M CaCl2 was added to each sample and shaken for 24 h at 180 rpm using an orbital shaker. Therefrom, the samples were centrifuged at 10,000 rpm for 15 min. The supernatants were collected, and their P contents were determined using UV-VIS Spectrophotometer (Perkin Elmer Lambda 25, Middlesex County, Massachusetts, USA) at 882 nm wavelength after blue colours developed using molybdenum blue method [30]. The P desorption at equilibrium (qde) was determined using the formula described by Peng et al. [44]:
qde = [(Cdo − Cde) × V] ÷ m
where
  • qde = P desorption at equilibrium (mg g−1);
  • Cdo = P concentration on sample (mg L−1); Cdo = Co − Ce;
  • Cde = P concentration at desorption equilibrium (mg L−1);
  • V = Volume of 0.01 M CaCl2 solution used (L);
  • m = Vass of sample (g).

2.4. Experimental Design and Statistical Analysis

The treatments were arranged in a completely randomized design (CRD) with three replications. An analysis of variance (ANOVA) was used to detect treatment effects, whereas treatment means were compared using Tukey’s Studentized Range (HSD) Test at p ≤ 0.05. PROC REG was used to test linear regression and to obtain coefficient of determination (R2) for each linear regression equation. The statistical software used was Statistical Analysis System (SAS, Cary, NC, USA) version 9.4.

3. Results and Discussion

3.1. Phosphorus Concentration at Adsorption Equilibrium

Phosphorus concentrations in the equilibrium solution (Ce) increased gradually with increasing concentrations of added P up to 400 mg P L−1 (Table 2). The increasing trend of the equilibrium solution P concentration occurred because of P addition, and this observation is in agreement with previous findings [49,50]. The soil with charcoal and sago bark ash (SCA) demonstrated significantly higher P in the equilibrium solution at 100 mg P L−1 compared with sago bark ash alone (A). The P concentrations at adsorption equilibrium for charcoal alone (C), soil with charcoal (SC), soil with sago bark ash (SA), and soil with both amendments (SCA) were similar but significantly higher than soil alone (S) when 200 mg P L−1 was used as an isonormal solution. Although SCA had the highest P concentration in the equilibrium solution at 300 mg P L−1, the effect was not significantly different compared to those of S, C, and SC. Generally, A had the lowest P concentration at adsorption equilibrium at 100 and 300 mg P L−1, S at 200 mg P L−1, and C at 400 mg P L−1, whereas SCA consistently recorded the highest P concentration at the adsorption equilibrium, irrespective of the concentration of added P. The increase in the concentration of P remaining in the equilibrium solution of the soil with amendments suggests that the addition of the charcoal and sago bark ash decreased the adsorption of P.

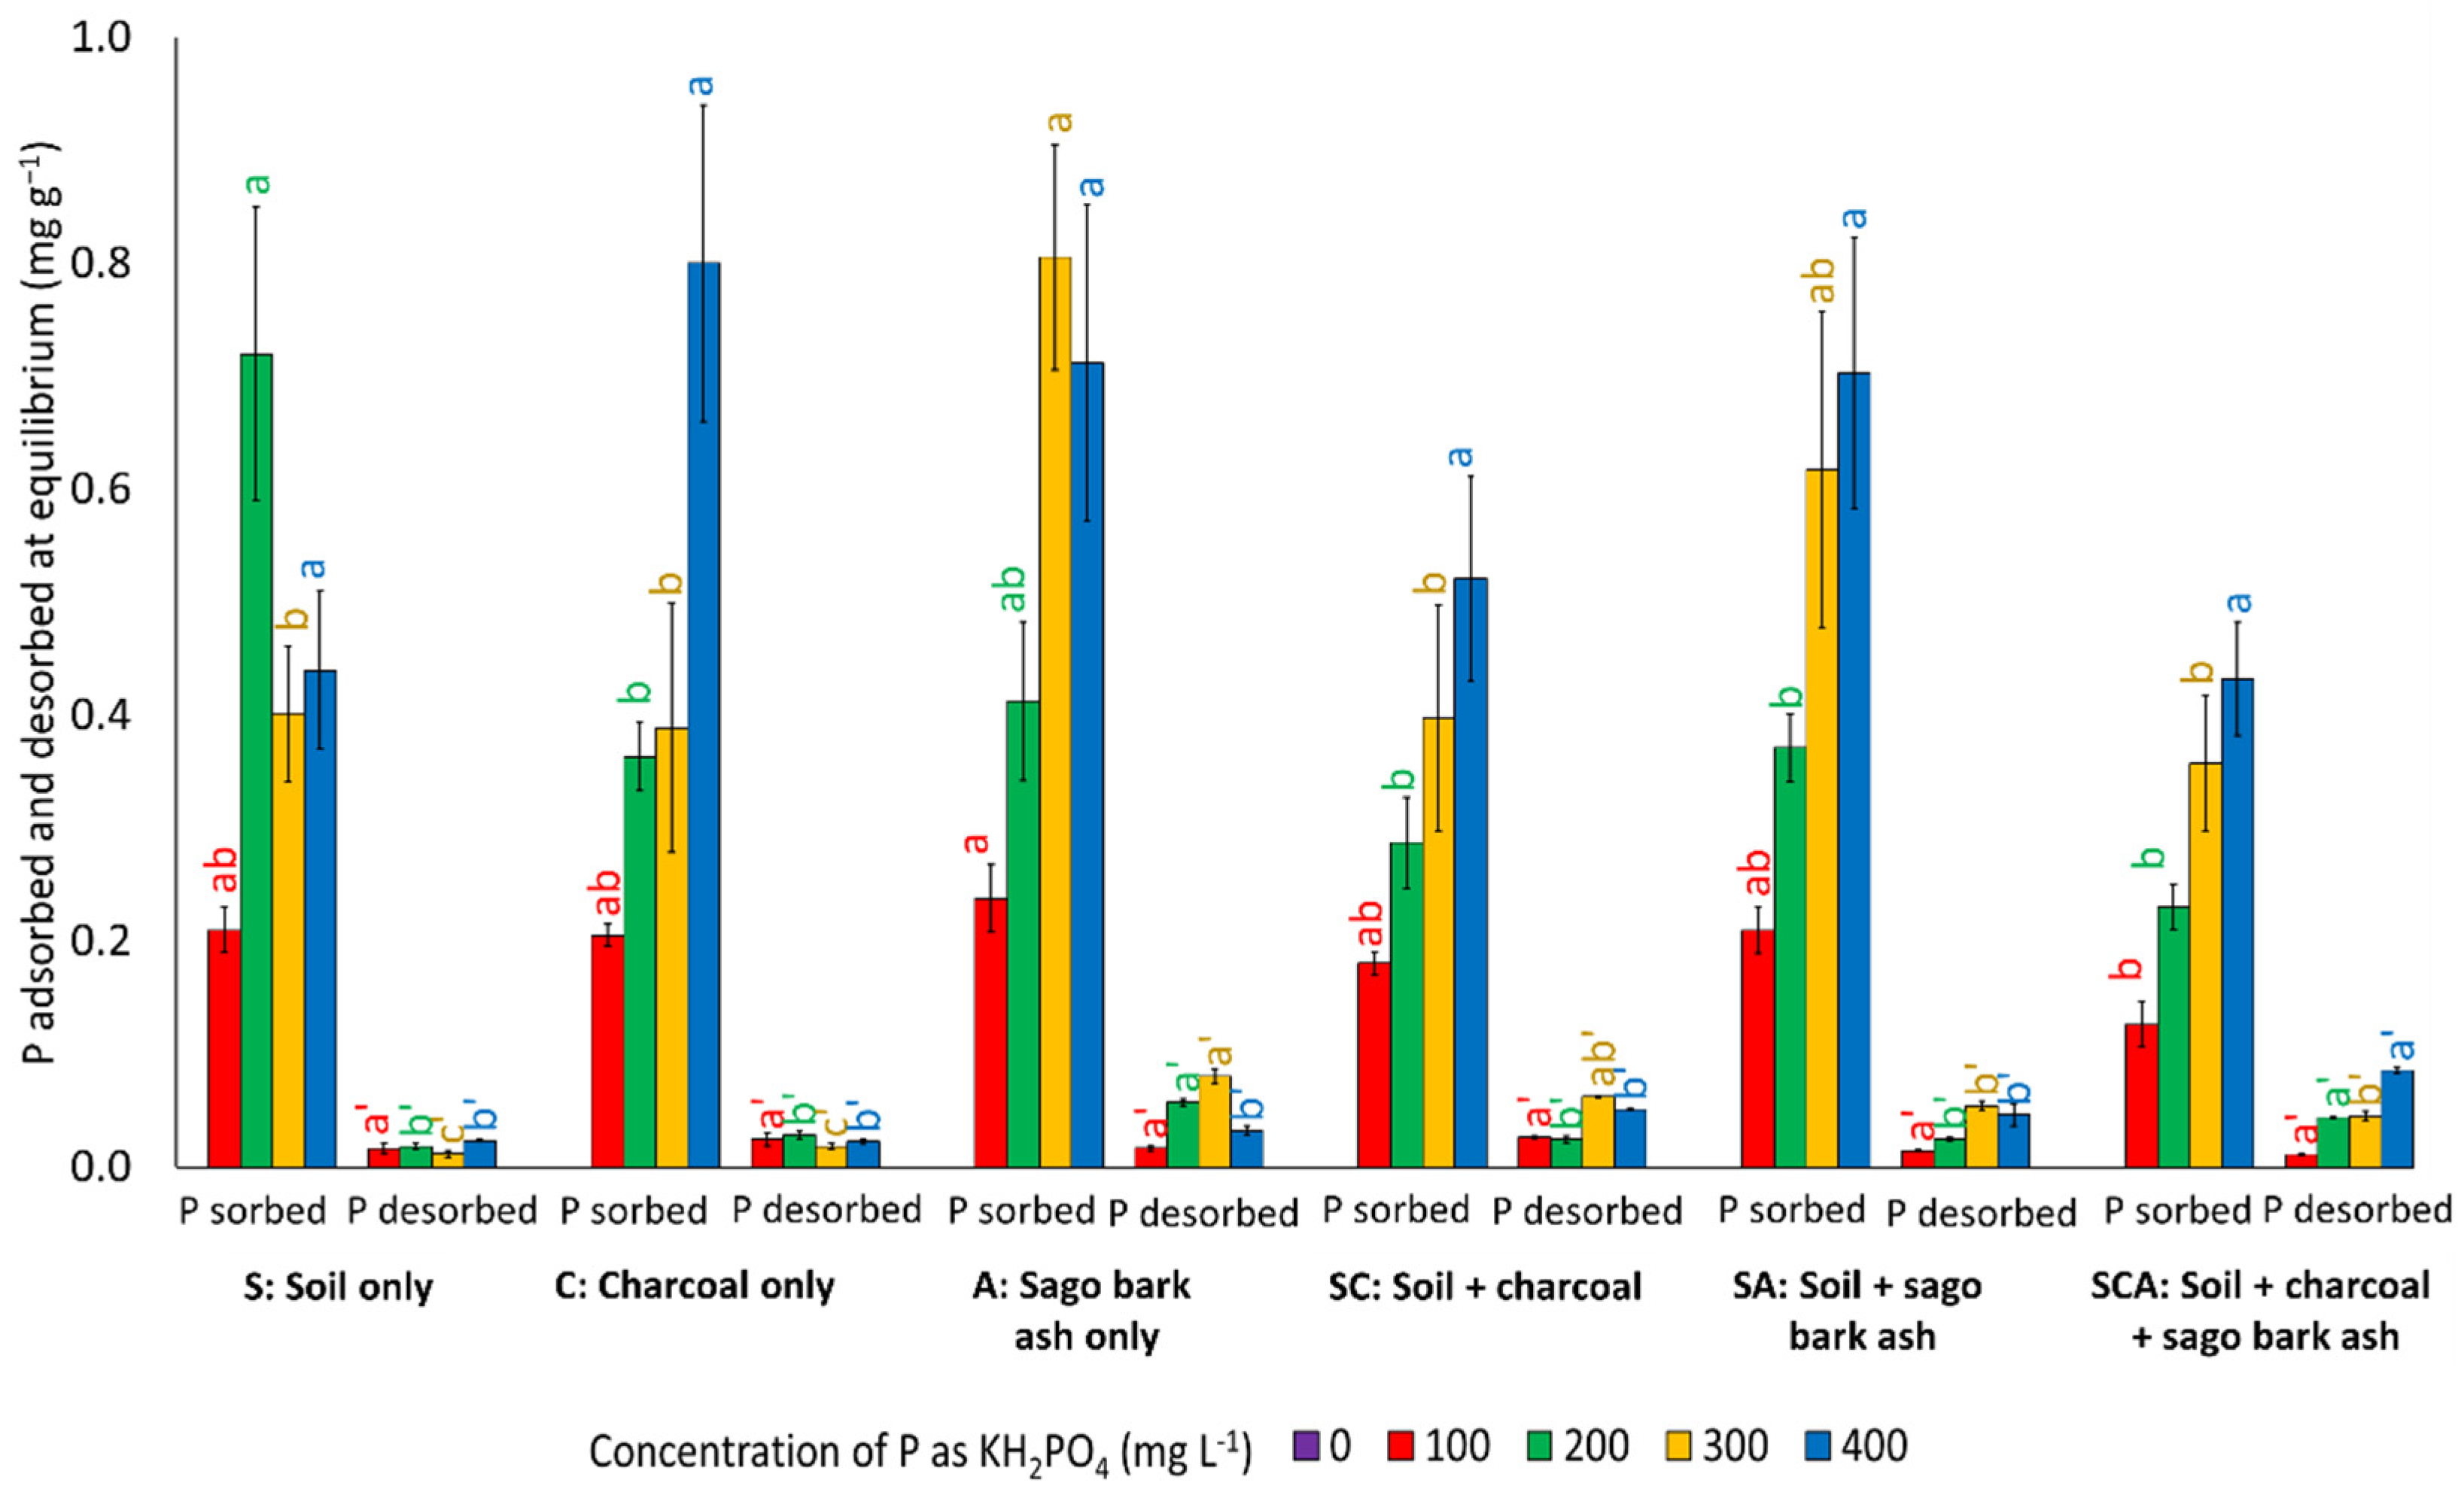
3.2. Phosphorus Adsorption

Among the treatments, soils with charcoal and sago bark ash (SCA) had the lowest P adsorption at equilibrium (qe) regardless of the concentration of isonormal P solution used (Table 3 and Figure 4). There were no significant differences in the amount of P adsorbed for S, C, SC, and SA at 100 and 300 mg P L−1. In comparison to soil alone (S), P adsorption at 200 mg P L−1 reduced significantly when charcoal and sago bark ash were applied to the soil separately (SC and SA) or together (SCA). The effect of sago bark ash alone (A) on the amount of P adsorbed was significantly higher compared with the soil with charcoal and sago bark ash (SCA) when the P solution’s concentration increased to 300 mg P L−1. The inclusion of charcoal and sago bark ash had no significant effects on P adsorption at 400 mg P L−1.
In acid soils, the adsorption of P occurs principally via the formation of an inner-sphere complex between orthophosphate anions and a metal cation or metal oxyhydroxide such as Fe and Al. The decrease in P sorption resulting from the co-application of charcoal and sago bark ash is related to the complexation of Al and Fe on the highly negative charged functional group surfaces of the charcoal when the soil pH increase was caused by the addition of sago bark ash. This is consistent with what has been reported for other weathered acid soils with low levels of exchangeable Al3+ [51]. Furthermore, this observation relates to the increase in electrostatic repulsion because of the increased negative surface charges of the charcoal. The Coulombic repulsive forces (same charge repulsion) reduced the ability of the soil to adsorb P [52]. Moreover, low molecular weight organic acids produced during the breakdown of charcoal, such as citric, oxalic, tartaric, and malic acids, served as anions that strongly competed with P for the adsorption sites on soil colloids. Organic acid anions are rapidly adsorbed on soil colloids compared with P, and this increased the concentration of P in the soil solution. Moreover, the enveloping effects of charcoal might have reduced the P adsorption of the soil [53,54,55]. Thus, the findings of this present study suggest that the dominant reaction of charcoal which could significantly decrease P loss via leaching is absorption, although adsorption might still occur but not to the same extent as absorption.
In contrast, the high P sorption in the soil with sago bark ash could be associated with an increase in positive charges and decrease in net negative charges of the soil [56,57]. The effects of liming on P sorption and bioavailability are conflicting, and the ability of lime to promote or inhibit P adsorption is mostly determined by these two opposing forces [58]. For example, the addition of lime increases soil pH to cause the surface charge conferred on soil oxide surfaces to become more negative (thus decreasing P adsorption), whereas the precipitation of exchangeable Al as hydroxy-Al polymers results in the formation of new and highly active adsorption surfaces (thus increasing P adsorption) [59,60]. A decrease in the concentration of P in the equilibrium soil solution and increase in P adsorption with liming had also been reported by Paliyal and Verma [61].

3.3. Langmuir Adsorption Isotherm

Langmuir equation parameters, which are maximum adsorption capacity (qmax), Langmuir bonding energy constant (KL), and regression coefficient (R2) values computed from the plotting of Ce/qe against Ce, are summarized in Table 4. R2 values ranged from 0.10 to 0.85, indicating a non-apparent high conformity of the adsorption data to the Langmuir adsorption model. Hence, the insertion of sorption data into other P adsorption models such as Freundlich, Temkin, Redlich–Peterson, and Van Huay isotherms is recommended to better describe the relationship between equilibrium P added and P sorbed by the soil.
The maximum adsorption capacity (qmax) reflects the number of P adsorption sites per mass unit of adsorbent in monolayer manners and is widely used to evaluate the adsorption capacity of soils for P [62,63]. High qmax requires less P saturation maximum mass adsorbed at saturation conditions per mass unit of adsorbent. qmax increased from 0.44 mg g−1 for soil alone (S) to 1.28, 2.38, 2.44, 2.56, and 3.70 mg g−1 for soil with charcoal (SC), sago bark ash alone (A), soil with charcoal and sago bark ash (SCA), charcoal alone (C), and soil with sago bark ash (SA), respectively. This finding is consistent with that of Yang et al. [64] who reported a directly proportional relationship between soil organic matter (SOM) content and the maximum adsorption capacity (qmax). Moreover, this observation corroborates the findings of Palanivell [65] who found that crude humic substances, chicken litter biochar, and clinoptilolite zeolite treatments had higher qmax than untreated soil, implying that less P is required to saturate the adsorbent because the negatively charged exchange sites of these amendments repelled P from being adsorbed. The comparison of Langmuir adsorption maximum values with those obtained from the sorption data suggests that the values determined from Langmuir equation were relatively greater than those calculated from sorption data. This suggests that the adsorption sites were not occupied by the adsorbate [12].
The Langmuir bonding energy constant (KL) is one of the most important parameters which describes the affinity of soil for P. Among the treatments, soil alone (S) demonstrated the highest KL, whereas the soil with charcoal and sago bark ash (SCA) had the lowest KL. According to Tamungang et al. [12] and Wang and Liang [48], the higher the binding energy (KL), the higher the amount of P fixed (lower P desorbed), and the stronger P adsorption. Between the soil with charcoal (SC) and the soil with sago bark ash (SA), the former treatment (SC) recorded higher KL. This finding contrasted that of Yang et al. [64] who found that the KL and maximum P buffering capacity (MBC) values decreased with increasing SOM content. However, the contradictory results for SC and SA are possible because of the large difference in R2 values. In addition, it might have been caused by other factors such as the soil type, clay content, equilibrium pH, and the Al and Fe chemical forms present.
The maximum P buffering capacity (MBC) is a capacity factor which measures the ability of the soil to replenish phosphate ions in the soil solution as they are depleted [66]. It is an indirect index of soil P availability because a higher MBC means more P will be adsorbed. In this present study, the MBC values followed the decreasing order of S > A > SA > C > SC > SCA. The higher value of MBC for the soil without any amendment suggests that higher applications of P fertilizers are required to mitigate soil P sorption affinity and to maintain a desired P concentration in soil solutions. Azeez and Averbeke [67] revealed that when poultry, cattle, and goat manure were applied to highly weathered tropical soil, P sorption efficiency of the soil and P buffering capacity decreased with increasing incubation periods.

3.4. Phosphorus Concentration at Desorption Equilibrium

The influence of treatments on P concentrations at desorption equilibrium (Cde) is presented in Table 5. At 100 mg P L−1, sago bark ash alone (A) had significantly higher P in the equilibrium solution compared with the soil with charcoal and sago bark ash (SCA). Although P concentrations in the equilibrium solution at 200 mg P L−1 were similar for C, A, SC, SA, and SCA, their effects were significantly lower compared with S. The trend of P concentrations at desorption equilibrium was the opposite of the trend of P concentration at adsorption equilibrium. For example, in the adsorption study, SCA had the highest P concentration at the adsorption equilibrium, whereas in the desorption study, SCA recorded the lowest P concentration at desorption equilibrium. Moreover, similar results were observed for A, which showed the highest P concentrations at desorption equilibrium at 100 and 300 mg P L−1, S at 200 mg P L−1, and C at 400 mg P L−1. The decrease in P concentration at desorption equilibrium indicates an increase in P desorption.

3.5. Phosphorus Desorption

Amending the soil with charcoal and sago bark ash (SCA) enhanced the desorbed P at equilibrium (qde) relative to the soil alone (S) (Table 6 and Figure 4) because desorption was positively affected by increased soil pH. Results from a study by Sato and Comerford [68] confirmed the hypothesis that P desorption increases with increasing soil pH. Irrespective of treatment, there were no significant differences in the amounts desorbed P at 100 mg P L−1. This finding suggests that P desorption is more sensitive at high P loading (> 200 mg P L−1). At 200 mg P L−1, the effects of A and SCA on P desorption at equilibrium were significantly higher compared with S, C, SC, and SA. Although there were no significant differences in the amounts of P desorbed at 300 mg P L−1 for S and C, their effects were significantly lower than those of SC, SA, and SCA. Among the treatments, SCA demonstrated the highest P desorption at 400 mg P L−1.
Lower amounts of P desorbed for soil alone (S) at 200, 300, and 400 mg P L−1 were consistent with the preceding findings where it was noticed that S had the highest bonding energy constant (KL) and maximum P buffering capacity (MBC) (Table 4). Furthermore, this observation is ascribed to the high amount of sesquioxides in the soil. The finding is congruent with that of Hartono et al. [69], who also reported that P desorbed passively in soils with high amounts of A1 and Fe oxides and a high clay content than soils with relatively low amounts of A1 and Fe oxides and a low clay content. The C content, which is believed to reduce bonding energy, could also promote P desorption from soil surfaces, as evidenced by SC and SCA.
Apart from increasing the amount of P adsorbed in the soil (Table 3), the use of sago bark ash increased the amount of P desorbed. This confirms the findings of leaching studies which demonstrated that if sago bark ash is not applied in combination with charcoal, the added P in the soil leaches because the primary reaction between sago bark ash and soils is an acid neutralization reaction [70], and properties related to soil acidity may be controlling the adsorption and desorption processes between this amendment and soils.
In general, the amount of P desorbed was significantly lower compared with the amount of P adsorbed. The low P desorption at equilibrium relates to irreversible reactions of adsorbed P with soil compounds that lead to stronger bond via the rearrangement of phosphate ions on the surface [71]. Phosphorus desorption is controlled by the type of P complexation with the surface: monodentate, bidentate mononuclear, and bidentate binuclear. Bidentate complexes require more activation energy to break the bond than monodentate complexes; hence, it can be more difficult for P desorption to take place in environments where bidentate complexes predominate between phosphate and the soil surface. In addition, it might be because the desorption equilibrium was not achieved, and desorption is a slower process than adsorption [72].

4. Conclusions

In soils where yield is limited because of P-deficient soils, the application of a relatively higher amount of mineral P fertilizers is the only way to enhance the soil’s available P status. However, continuous applications of P fertilizer for meeting plant needs can lead to a significantly large reserve of residual P in soils, and this raises ecological and environmental concerns because the presence of excess soluble P affects water quality, biodiversity, and human health. Thus, by determining the maximum adsorption capacity and P buffering capacity of soils, the effectiveness of P fertilizers could be predicted. The results of this present study suggest that the combined use of charcoal and sago bark ash in soils can decrease P adsorption and increase P desorption relative to untreated soils. The organic matter of the aforestated amendment reduces P sorption capacities by blocking P binding sites, increasing the negative electric potential in the plane of adsorption, causing steric hindrance on mineral surfaces, and decreasing goethite and hematite specific surface areas. However, there is a need for the inclusion of more soil chemical, physical, and mineralogical properties in predicting soil P sorption to enhance the reliability of the findings. In future studies, analyzing the fraction of organic matter and humic substance to estimate the real sorption capacity of amendments is recommended. In-depth information on P sorption efficiency could also be obtained by determining the number of acidic and basic active sites in addition to the functional composition of organic matter in the amendments and the structure and stability of soil aggregates.

Author Contributions

Conceptualization, O.H.A. and P.D.J.; methodology, P.D.J., P.P., N.H.H. and M.B.J.; validation, O.H.A., N.A.H. and L.O.; formal analysis, P.D.J.; investigation, P.D.J., P.P. and N.H.H.; resources, O.H.A., N.A.H. and L.O.; data curation, P.P. and N.H.H.; writing—original draft preparation, P.D.J.; writing—review and editing, O.H.A., A.A.M. and M.B.J.; visualization, P.D.J.; supervision, O.H.A., N.A.H. and L.O.; project administration, M.B.J., O.H.A. and A.A.M.; funding acquisition, M.B.J., O.H.A. and A.A.M. All authors have read and agreed to the published version of the manuscript.

Funding

This research was funded by Ministry of Higher Education, Malaysia with grant number (FRGS/1/2016/WAB01/UPM/02/2).

Institutional Review Board Statement

Not applicable.

Informed Consent Statement

Not applicable.

Data Availability Statement

The data presented in this study are available within the article.

Acknowledgments

The authors would like to acknowledge Ministry of Higher Education, Malaysia, for financial assistance and Universiti Putra Malaysia for providing research facilities. Our appreciation also goes to colleagues and staff of Universiti Putra Malaysia, Universiti Malaysia Sabah, Universiti Islam Sultan Sharif Ali, and Management and Science University for their technical support and collaboration.

Conflicts of Interest

The authors declare no conflict of interest.

References

  1. Sims, J.T.; Pierzynski, G.M. Chemistry of phosphorus in soils. Chem. Process. Soils 2005, 8, 151–192. [Google Scholar]
  2. Barrow, N.J. Soil phosphate chemistry and the P-sparing effect of previous phosphate applications. Plant Soil 2015, 397, 401–409. [Google Scholar] [CrossRef]
  3. Constantino, L.V.; Quirino, J.N.; Monteiro, A.M.; Abrão, T.; Parreira, P.S.; Urbano, A.; Santos, M.J. Sorption-desorption of selenite and selenate on Mg-Al layered double hydroxide in competition with nitrate, sulfate and phosphate. Chemosphere 2017, 181, 627–634. [Google Scholar] [CrossRef]
  4. Krumina, L.; Kenney, J.P.; Loring, J.S.; Persson, P. Desorption mechanisms of phosphate from ferrihydrite and goethite surfaces. Chem. Geol. 2016, 427, 54–64. [Google Scholar] [CrossRef]
  5. Guedes, R.S.; Melo, L.C.A.; Vergütz, L.; Rodríguez-Vila, A.; Covelo, E.F.; Fernandes, A.R. Adsorption and desorption kinetics and phosphorus hysteresis in highly weathered soil by stirred flow chamber experiments. Soil Till. Res. 2016, 162, 46–54. [Google Scholar] [CrossRef]
  6. Hanyabui, E.; Apori, S.O.; Frimpong, K.A.; Atiah, K.; Abindaw, T.; Ali, M.; Asiamah, J.Y.; Byalebeka, J. Phosphorus sorption in tropical soils. AIMS Agric. Food 2020, 5, 599–616. [Google Scholar] [CrossRef]
  7. Idris, O.A.; Ahmed, H.S. Phosphorus sorption capacity as a guide for phosphorus availability of selected Sudanese soil series. Afr. Crop Sci. J. 2012, 20, 59–65. [Google Scholar]
  8. Tsado, P.A.; Osunde, O.A.; Igwe, C.A.; Adeboye, M.K.A.; Lawal, B.A. Phosphorus sorption characteristics of some selected soil of the Nigerian Guinea Savanna. Int. J. Agric. Sci. 2012, 2, 613–618. [Google Scholar]
  9. Tening, A.S.; Foba-Tendo, J.N.; Yakum-Ntaw, S.Y.; Tchuenteu, F. Phosphorus fixing capacity of a volcanic soil on the slope of mount Cameroon. Agric. Biol. J. N. Am. 2013, 4, 166–174. [Google Scholar] [CrossRef]
  10. Maluf, H.J.G.M.; Silva, C.A.; Curi, N.; Norton, L.D.; Rosa, S.D. Adsorption and availability of phosphorus in response to humic acid rates in soils limed with CaCO3 or MgCO3. Ciência E Agrotecnologia 2018, 42, 7–20. [Google Scholar] [CrossRef]
  11. Limousin, G.; Gaudet, J.P.; Charlet, L.; Szenknect, S.; Barthes, V.; Krimissa, M. Sorption isotherms: A review on physical bases, modeling and measurement. Appl. Geochem. 2007, 22, 249–275. [Google Scholar] [CrossRef]
  12. Tamungang, N.E.B.; Mvondo-Zé, A.D.; Ghogomu, J.N.; Mofor, N.A. Evaluation of phosphorus sorption characteristics of soils from the Bambouto sequence (West Cameroon). Int. J. Biol. Chem. 2016, 10, 860–874. [Google Scholar] [CrossRef]
  13. Jamal, A.; Muhammad, D.; Jamal, H. Application of adsorption isotherms in evaluating the influence of humic acid and farmyard manure on phosphorous adsorption and desorption capacity of calcareous soil. World Sci. News 2018, 107, 136–149. [Google Scholar]
  14. Palanivell, P.; Ahmed, O.H.; Omar, L.; Abdul Majid, N.M. Nitrogen, Phosphorus, and Potassium Adsorption and Desorption Improvement and Soil Buffering Capacity Using Clinoptilolite Zeolite. Agronomy 2021, 11, 379. [Google Scholar] [CrossRef]
  15. Ch’ng, H.Y. Phosphorus Management for Tropical Acid Soils Using Amendments from Agro-Industrial Wastes. Doctoral Thesis, Universiti Putra Malaysia, Serdang, Selangor, Malaysia, 2015. [Google Scholar]
  16. Hasbullah, N.A. Use of Clinoptilolite Zeolite to Improve Efficiency of Phosphorus Use in Acid Soils. Doctoral Thesis, Universiti Putra Malaysia, Serdang, Selangor, Malaysia, 2016. [Google Scholar]
  17. Gichangi, E.M. Effects of organic amendments on the transformations and bioavailability of phosphorus in soils: A review. Discov. Agric. 2019, 5, 41–50. [Google Scholar]
  18. Maru, A.; Haruna, A.O.; Asap, A.; Majid, N.M.A.; Maikol, N.; Jeffary, A.V. Reducing Acidity of Tropical Acid Soil to Improve Phosphorus Availability and Zea mays L. Productivity through Efficient Use of Chicken Litter Biochar and Triple Superphosphate. Appl. Sci. 2020, 10, 2127. [Google Scholar] [CrossRef] [Green Version]
  19. Ch’ng, H.Y.; Haruna, A.O.; Majid, N.M.N.A.; Jalloh, M.B. Improving soil phosphorus availability and yield of Zea mays L. using biochar and compost derived from agro-industrial wastes. Ital. J. Agron. 2019, 14, 34–42. [Google Scholar] [CrossRef] [Green Version]
  20. Palanivell, P.; Ahmed, O.H.; Latifah, O.; Abdul Majid, N.M. Adsorption and desorption of nitrogen, phosphorus, potassium, and soil buffering capacity following application of chicken litter biochar to an acid soil. Appl. Sci. 2020, 10, 295. [Google Scholar] [CrossRef] [Green Version]
  21. Dixon, R.K.; Wisniewski, J. Global Forest systems: An uncertain response to atmospheric pollutants and global climate change. Water Air Soil Pollut. 1995, 85, 101–110. [Google Scholar] [CrossRef]
  22. Bouyoucos, G.J. Hydrometer method improved for making particle size analysis of soils. Agron. J. 1962, 54, 464–465. [Google Scholar] [CrossRef]
  23. Peech, H.M. Hydrogen-ion Activity. In Methods of Soil Analysis Chemical and Microbiological Properties; Black, C.A., Evans, D.D., White, J.L., Ensminger, L.E., Clark, F.E., Eds.; American Society of Agronomy: Madison, WI, USA, 1965; pp. 914–926. [Google Scholar]
  24. Chefetz, B.; Hatcher, P.H.; Hadar, Y.; Chen, Y. Chemical and biological characterization of organic matter during composting of municipal solid waste. J. Environ. Qual. 1996, 25, 776–785. [Google Scholar] [CrossRef]
  25. Bremner, J.M. Total Nitrogen. In Methods of Soil Analysis: Part 2; Black, C.A., Evans, D.D., Ensminger, L.E., White, J.L., Clark, F.F., Dinauer, R.C., Eds.; American Society of Agronomy: Madison, WI, USA, 1965; pp. 1149–1178. [Google Scholar]
  26. Cottenie, A. Soil testing and plant testing as a basis of fertilizer recommendation. FAO Soils Bull. 1980, 38, 70–73. [Google Scholar]
  27. Rowell, D.L. Soil Science: Methods and Application; Longman Publishers Ltd.: London, UK, 1994; p. 169. [Google Scholar]
  28. Bernas, B. New method for decomposition and comprehensive analysis of silicates by atomic absorption spectrometry. Anal. Chem. 1968, 40, 1682–1686. [Google Scholar] [CrossRef]
  29. Mehlich, A. Determination of P, Ca, Mg, K, Na and NH4. Short Test Methods Used in Soil Testing Division; Department of Agriculture: Raleigh, NC, USA, 1953.
  30. Murphy, J.; Riley, J.P. A modified single solution method for the determination of phosphate in natural waters. Anal. Chim. Acta 1962, 27, 31–36. [Google Scholar] [CrossRef]
  31. Paramananthan, S. Soil of Malaysia: Their Characteristics and Identification; Academy of Sciences Malaysia: Kuala Lumpur, Malaysia, 2000; Volume 1, pp. 11–125.
  32. Free, H.F.; McGill, C.R.; Rowarth, J.S.; Hedley, M.J. The effect of biochars on maize (Zea mays) germination. N. Z. J. Agric. Res. 2010, 53, 1–4. [Google Scholar] [CrossRef]
  33. Ndor, E.; Dauda, S.N.; Azagaku, E.D. Response of maize varieties (Zea mays) to biochar amended soil in Lafia, Nigeria. J. Exp. Agric. Int. 2015, 5, 525–531. [Google Scholar] [CrossRef]
  34. Mandre, M.; Parn, H.; Ots, K. Short-term effects of wood ash on the soil and the lignin concentration and growth of Pinus sylvestris L. For. Ecol. Manag. 2006, 223, 349–357. [Google Scholar] [CrossRef]
  35. Ozolincius, R.; Buozyte, R.; Varnagiryte, K.I. Wood ash and nitrogen influence on ground vegetation cover and chemical composition. Biomass Bioenergy 2007, 31, 710–716. [Google Scholar] [CrossRef]
  36. Perucci, P.; Monaci, E.; Onofri, A.; Vischetti, C.; Casucci, C. Changes in physico-chemical and biochemical parameters of soil following addition of wood ash: A field experiment. Eur. J. Agron. 2008, 28, 155–161. [Google Scholar] [CrossRef]
  37. Graetz, D.A.; Nair, V.D. Phosphorus sorption isotherm determination. In Methods of Phosphorus Analysis for Soils, Sediments, Residuals, and Waters; Southern Cooperative Series Bulletin 408; Kovar, J.L., Pierzynski, G.M., Eds.; Virginia Tech University: Blacksburg, VA, USA, 2009; pp. 33–37. [Google Scholar]
  38. Mozaffari, M.; Sims, J.T. Phosphorus availability and sorption in Atlantic Coastal Plain watershed dominated by animal-based agriculture. Soil Sci. 1994, 157, 97–107. [Google Scholar] [CrossRef]
  39. Sallade, Y.E.; Sims, J.T. Phosphorus transformations in the sediments of Delaware’s agricultural drainageways: I. Phosphorus forms and sorption. J. Environ. Qual. 1997, 26, 1571–1579. [Google Scholar] [CrossRef]
  40. Nair, V.D.; Graetz, D.A.; Reddy, K.R. Dairy manure influences on phosphorus retention capacity of Spodosols. J. Environ. Qual. 1998, 27, 522–527. [Google Scholar] [CrossRef]
  41. Reddy, K.R.; O’Connor, G.A.; Gale, P.M. Phosphorus sorption capacities of wetland soils and stream sediments impacted by dairy effluent. J. Environ. Qual. 1998, 27, 438–447. [Google Scholar] [CrossRef]
  42. Brock, E.H.; Ketterings, Q.M.; Kleinman, P.J. Measuring and predicting the phosphorus sorption capacity of manure-amended soils. Soil Sci. 2007, 172, 266–278. [Google Scholar] [CrossRef]
  43. Kithome, M.; Paul, J.W.; Lavkulich, L.M.; Bomke, A.A. Kinetics of ammonium adsorption and desorption by the natural zeolite clinoptilolite. Soil Sci. Soc. Am. J. 1998, 62, 622–629. [Google Scholar] [CrossRef]
  44. Peng, H.; Jiang, A.; Wang, H. Adsorption and Desorption Characteristics of Phosphorus on Sediments in Panzhihua Section of Jinsha River, China. In IOP Conference Series: Earth and Environmental Science; IOP Publishing: Bristol, UK, 2021; p. 042059. [Google Scholar]
  45. Gregory, T.; Karns, C.L.; Shimizu, K.D. A critical examination of the use of the Freundlich isotherm in characterizing molecularly imprinted polymers (MIPS). Anal. Chim. Acta. 2005, 528, 107–113. [Google Scholar]
  46. Okeola, F.O.; Odebunmi, E.O. Comparison of Freundlich and Langmuir isotherms for adsorption of methylene blue by agrowaste derived activated carbon. Adv. Environ. Biol. 2010, 4, 329–336. [Google Scholar]
  47. Dada, A.O.; Ojediran, J.O.; Olalekan, A.P. Sorption of Pb2+ from aqueous solution unto modified rice husk: Isotherms studies. Adv. Phys. Chem. 2013, 2013, 1–6. [Google Scholar] [CrossRef]
  48. Wang, L.; Liang, T. Effects of exogenous rare earth elements on phosphorus adsorption and desorption in different types of soils. Chemosphere 2014, 103, 148–155. [Google Scholar] [CrossRef]
  49. Akhtar, M.S.; Richards, B.K.; Medrano, P.A.; DeGroot, M.; Steenhuis, T.S. Dissolved phosphorus from undisturbed soil cores: Related to adsorption strength, flow rate, or soil structure? Soil Sci. Soc. Am. J. 2003, 67, 458–470. [Google Scholar] [CrossRef]
  50. Ahmed, M.F.; Kennedy, I.R.; Choudhury, A.T.M.A.; Kecskés, M.L.; Deaker, R. Phosphorus adsorption in some Australian soils and influence of bacteria on the desorption of phosphorus. Commun. Soil Sci. Plant Anal. 2008, 39, 1269–1294. [Google Scholar] [CrossRef]
  51. Naidu, R.; Syers, J.K.; Tillman, R.W.; Kirkman, J.H. Effect of liming and added phosphate on charge characteristics of acid soils. J. Soil Sci. 1990, 41, 157–164. [Google Scholar] [CrossRef]
  52. Onyango, M.S.; Masukume, M.; Ochieng, A.; Otieno, F. Functionalized natural zeolite and its potential for treating drinking water containing excess amount of nitrate. Water SA 2010, 36, 655–662. [Google Scholar] [CrossRef] [Green Version]
  53. Shariatmadari, H.; Shirvani, M.; Jafari, A. Phosphorus release kinetics and availability in calcareous soils of selected arid and semiarid toposequence. Geoderma 2006, 132, 261–272. [Google Scholar] [CrossRef]
  54. Hunt, J.F.; Ohno, T.; He, Z.; Honeycutt, C.W.; Dail, D.B. Inhibition of phosphorus sorption to goethite, gibbsite, and kaolin by fresh and decomposed organic matter. Biol. Fert. Soil 2007, 44, 277–288. [Google Scholar] [CrossRef]
  55. Ma, L.; Xu, R. Effects of regulation of pH and application of organic material adsorption and desorption of phosphorus in three types of acid soils. J. Ecol. Rural Environ. 2010, 26, 596–599. [Google Scholar]
  56. Haynes, R.J. Lime and phosphate in the soil-plant system. Adv. Agron. 1984, 37, 249–315. [Google Scholar]
  57. Sanyal, S.K.; De Datta, S.K. Chemistry of phosphorus transformations in soil. In Advances in Soil Science; Springer: New York, NY, USA, 1991; pp. 1–120. [Google Scholar]
  58. Haynes, R.J.; Swift, R.S. Effects of air-drying on the adsorption and desorption of phosphate and levels of extractable phosphate in a group of acid soils, New Zealand. Geoderma 1985, 35, 145–157. [Google Scholar] [CrossRef]
  59. Haynes, R.J.; Naidu, R. Effects of lime additions on the availability of phosphorus and sulphur in some temperate and tropical acid soils. In Plant-Soil Interactions at Low pH; Springer: Dordrecht, The Netherlands, 1991; pp. 267–274. [Google Scholar]
  60. Majumdar, B.; Kumar, K.; Venkatesh, M.S. Effect of liming on phosphorus adsorption and desorption behaviour of acidic Alfisols and Entisol of Meghalaya. J. Indian Soc. Soil Sci. 2005, 53, 188–193. [Google Scholar]
  61. Paliyal, S.S.; Verma, T.S. Adsorption of added phosphorus as influenced by the application of lime and gypsum in an acid Alfisol of Himalayan region. J. Indian Soc. Soil Sci. 2002, 50, 163–167. [Google Scholar]
  62. Hiradate, S.; Uchida, N. Effects of soil organic matter on pH-dependent phosphate sorption by soils. Soil Sci. Plant Nutr. 2004, 50, 665–675. [Google Scholar] [CrossRef]
  63. Yan, X.; Wang, D.; Zhang, H.; Zhang, G.; Wei, Z. Organic amendments affect phosphorus sorption characteristics in a paddy soil. Agric. Ecosyst. and Environ. 2013, 175, 47–53. [Google Scholar] [CrossRef]
  64. Yang, X.; Chen, X.; Yang, X. Effect of organic matter on phosphorus adsorption and desorption in a black soil from Northeast China. Soil Tillage Res. 2019, 187, 85–91. [Google Scholar] [CrossRef]
  65. Palanivell, P. Organic and Mineral Amendments on Rice (Oryza sativa L.) Yield and Nutrients Recovery Efficiency. Doctoral Thesis, Universiti Putra Malaysia, Kuala Lumpur, Selangor, Malaysia, 2016. [Google Scholar]
  66. Amarh, F. Phosphorus Adsorption Isotherms of Some Selected Soils from the Eastern Region of Ghana. Doctoral Thesis, Kwame Nkrumah University, Kabwe, Zambia, 2012. [Google Scholar]
  67. Azeez, J.O.; Averbeke, W.V. Effect of manure types and period of incubation on phosphorus-sorption indices of a weathered tropical soil. Commun. Soil Sci. Plant Anal. 2011, 42, 2200–2218. [Google Scholar] [CrossRef]
  68. Sato, S.; Comerford, N.B. Influence of soil pH on inorganic phosphorus sorption and desorption in a humid Brazilian Ultisol. Rev. Bras. Cienc. Solo 2005, 29, 685–694. [Google Scholar] [CrossRef]
  69. Hartono, A.; Funakawa, S.; Kosaki, T. Phosphorus Sorption-Desorption Characteristics of Selected Acid Upland Soils in Indonesia. Soil Sci. Plant Nutr. 2005, 51, 787–799. [Google Scholar] [CrossRef]
  70. Johan, P.D.; Ahmed, O.H.; Omar, L.; Hasbullah, N.A. Charcoal and Sago Bark Ash on pH Buffering Capacity and Phosphorus Leaching. Agronomy 2021, 11, 2223. [Google Scholar] [CrossRef]
  71. Kuo, S.; Lotse, E.G. Kinetics of phosphate adsorption and desorption by hematite and gibbsite. Soil Sci. 1973, 116, 400–406. [Google Scholar] [CrossRef]
  72. Barrow, N.J. On the reversibility of phosphate sorption by soils. J. Soil Sci. 1983, 34, 751–758. [Google Scholar] [CrossRef]
Figure 1. Aerial view of location where soil sampled for this study in Universiti Putra Malaysia Bintulu Sarawak Campus, Malaysia.
Agronomy 12 03020 g001
Figure 2. Scanning electron micrographs of charcoal at 1500× and 500× magnifications.
Agronomy 12 03020 g002
Figure 3. Scanning electron micrographs of sago bark ash at 1500× and 1000× magnifications.
Agronomy 12 03020 g003
Figure 4. Summary of the amounts of phosphorus adsorbed and desorbed at different potassium dihydrogen phosphate concentration as affected by soil alone, amendments alone, and soil with the amendments. Means with different letter(s) within the same font colour indicate significant differences between treatments according to Tukey’s HSD test at p ≤ 0.05, i.e., a > b > c. Bars represent the mean values ± SE.
Agronomy 12 03020 g004
Table 1. Initial characterization of the Bekenu Series (Typic Paleudults), charcoal, and sago bark ash.
Property Value ObtainedParamananthan [31]CharcoalSago Bark Ash
pH (H2O) 4.61 ± 0.054.6–4.97.74 ± 0.029.99 ± 0.03
pH (KCl) 3.95 ± 0.013.8–4.07.31 ± 0.059.66 ± 0.02
EC (dS m−1) 0.04 ± 0.00NA0.270 ± 0.0065.75 ± 0.02
Bulk density (g cm−1) 1.25 ± 0.04NANANA
Total carbon (%) 2.16 ± 0.050.57–2.51NANA
Total N (%) 0.08 ± 0.010.04–0.17NANA
Total P (mg kg−1) 23.65 ± 1.09NANANA
Available P (mg kg−1) 1.13 ± 0.02NA31.25 ± 1.1555.83 ± 1.32
CECcmol kg−14.67 ± 0.293.86–8.46NANA
Exchangeable acidity1.15 ± 0.03NANANA
Exchangeable Al3+1.02 ± 0.03NANANA
Exchangeable H+0.13 ± 0.02NANANA
Exchangeable K+0.060 ± 0.0020.05–0.193.67 ± 0.0623.33 ± 0.25
Exchangeable Ca2+0.020 ± 0.0010.0111.71 ± 0.3216.77 ± 0.48
Exchangeable Mg2+0.220 ± 0.0030.07–0.213.37 ± 0.033.57 ± 0.03
Exchangeable Na+0.030 ± 0.0010.010.43 ± 0.011.51 ± 0.03
Exchangeable Mn2+0.010 ± 0.001NANANA
Exchangeable Fe2+1.09 ± 0.02NA0.150 ± 0.0030.030 ± 0.001
Soil texture Sand (%): 71.9Sand (%): 72–76NANA
Silt (%): 13.5Silt (%): 8–9
Clay (%): 14.6Clay (%): 16–19
Sandy loamSandy clay loam
Note: The values given are mean ± standard error; NA: not available; EC: electrical conductivity; CEC: cation exchange capacity.
Table 2. Effects of treatments on phosphorus concentration at adsorption equilibrium at different isonormal phosphorus solutions.
TreatmentPhosphorus Concentration at Adsorption Equilibrium, Ce (mg L−1)
0100200300400
Added P (mg P L−1)
Snd83.48 ab ± 1.41143.45 b ± 10.06267.88 a ± 5.00365.21 a ± 5.77
Cnd83.56 ab ± 1.01170.92 a ± 2.12268.88 a ± 8.62335.96 a ± 10.96
And80.96 b ± 2.03166.98 ab ± 5.50235.55 b ± 7.91343.02 a ± 11.60
SCnd85.51 ab ± 0.56177.00 a ± 3.36268.21 a ± 6.95358.29 a ± 7.44
SAnd83.21 ab ± 1.96170.29 a ± 2.38250.58 ab ± 11.26343.75 a ± 9.63
SCAnd89.88 a ± 1.77181.58 a ± 1.46271.42 a ± 4.50365.42 a ± 4.08
Note: S: soil only; C: charcoal only; A: sago bark ash only; SC: soil + charcoal; SA: soil + sago bark ash; SCA: soil + charcoal + sago bark ash; nd: not detected; different letters within a column indicate significant difference of means ± standard error using Tukey’s test at p ≤ 0.05.
Table 3. Effects of treatments on the amounts of phosphorus adsorbed at equilibrium at different concentrations of added phosphorus.
TreatmentPhosphorus Adsorption at Equilibrium, qe (mg g−1)
100200300400
Added P (mg P L−1)
S0.21 ab ± 0.020.72 a ± 0.130.40 b ± 0.060.44 a ± 0.07
C0.21 ab ± 0.010.36 b ± 0.030.39 b ± 0.110.80 a ± 0.14
A0.24 a ± 0.030.41 ab ± 0.070.81 a ± 0.100.71 a ± 0.14
SC0.18 ab ± 0.010.29 b ± 0.040.40 b ± 0.100.52 a ± 0.09
SA0.21 ab ± 0.020.37 b ± 0.030.62 ab ± 0.140.70 a ± 0.12
SCA0.13 b ± 0.020.23 b ± 0.020.36 b ± 0.060.43 a ± 0.05
Note: S: soil only; C: charcoal only; A: sago bark ash only; SC: soil + charcoal; SA: soil + sago bark ash; SCA: soil + charcoal + sago bark ash; different letters within a column indicate significant difference of means ± standard error using Tukey’s test at p ≤ 0.05.
Table 4. Effects of treatments on phosphorus sorption parameters of the isotherm described by Langmuir equation.
TreatmentEstimated by Langmuir Equation
Regression EquationR2qmax
(mg g−1)
KL
(L mg−1)
MBC
(L mg−1)
Sy = 2.28x + 93.260.720.440.028.80 × 10−3
Cy = 0.39x + 414.060.102.569.42 × 10−42.41 × 10⁻³
Ay = 0.42x + 293.490.322.381.43 × 10−33.40 × 10⁻³
SCy = 0.78x + 440.170.851.281.77 × 10−32.27 × 10⁻³
SAy = 0.27x + 380.680.463.707.09 × 10−42.62 × 10⁻³
SCAy = 0.41x + 682.310.752.446.01 × 10−41.47 × 10⁻³
Note: S: soil only; C: charcoal only; A: sago bark ash only; SC: soil + charcoal; SA: soil + sago bark ash; SCA: soil + charcoal + sago bark ash; R2: regression coefficient; qmax: maximum adsorption capacity; KL: Langmuir constant related to the binding energy; MBC: maximum P buffering capacity.
Table 5. Effects of treatments on phosphorus concentration at desorption equilibrium at different isonormal phosphorus solutions.
TreatmentPhosphorus Concentration at Desorption Equilibrium, Cde (mg L−1)
0100200300400
Added P (mg P L−1)
Snd15.22 ab ± 1.0455.08 a ± 9.9131.16 a ± 4.8032.91 a ± 5.73
Cnd14.43 ab ± 1.1326.80 b ± 2.1929.64 a ± 8.6862.23 a ± 11.06
And17.68 a ± 1.9128.39 b ± 5.2657.99 a ± 8.3254.37 a ± 11.89
SCnd12.34 ab ± 0.5021.03 b ± 3.2326.75 a ± 6.9537.63 a ± 7.38
SAnd15.63 ab ± 1.9627.69 b ± 2.3745.05 a ± 10.9652.52 a ± 8.81
SCAnd9.20 b ± 1.7114.87 b ± 1.2024.95 a ± 4.1827.71 a ± 4.06
Note: S: soil only; C: charcoal only; A: sago bark ash only; SC: soil + charcoal; SA: soil + sago bark ash; SCA: soil + charcoal + sago bark ash; nd: not detected; different letters within a column indicate significant difference of means ± standard error using Tukey’s test at p ≤ 0.05.
Table 6. Effects of treatments on the amounts of phosphorus desorbed at equilibrium at different concentrations of added phosphorus.
TreatmentPhosphorus Desorption at Equilibrium, qde (mg g−1)
100200300400
Added P (mg P L−1)
S0.016 a ± 0.0050.018 b ± 0.0030.012 c ± 0.0030.024 b ± 0.001
C0.025 a ± 0.0060.029 b ± 0.0040.019 c ± 0.0030.023 b ± 0.002
A0.017 a ± 0.0020.058 a ± 0.0030.081 a ± 0.0070.033 b ± 0.004
SC0.027 a ± 0.0010.025 b ± 0.0030.063 ab ± 0.0010.051 b ± 0.001
SA0.015 a ± 0.0010.025 b ± 0.0010.055 b ± 0.0040.047 b ± 0.010
SCA0.012 a ± 0.0010.044 a ± 0.0010.045 b ± 0.0040.086 a ± 0.002
Note: S: soil only; C: charcoal only; A: sago bark ash only; SC: soil + charcoal; SA: soil + sago bark ash; SCA: soil + charcoal + sago bark ash; different letters within a column indicate significant difference of means ± standard error using Tukey’s test at p ≤ 0.05.
Publisher’s Note: MDPI stays neutral with regard to jurisdictional claims in published maps and institutional affiliations.

