Article

Effect of Chemical Fertilizer Application on Maize Production in China over the Past 15 Years: A Meta-Analysis

1
College of Agronomy, Sichuan Agricultural University, Chengdu 611130, China
2
Key Laboratory of Crop Ecophysiology and Farming System in Southwest China, Ministry of Agriculture, Chengdu 611130, China
3
Crop Ecophysiology and Cultivation Key Laboratory of Sichuan Province, Chengdu 611130, China
*
Author to whom correspondence should be addressed.
These authors contributed equally to this work.
Agronomy 2022, 12(12), 3005; https://doi.org/10.3390/agronomy12123005
Submission received: 13 October 2022 / Revised: 17 November 2022 / Accepted: 22 November 2022 / Published: 29 November 2022
(This article belongs to the Special Issue Crop Yield Formation and Fertilization Management)

Abstract

:
Although there are many new types of environmentally friendly fertilizers that can improve maize yield, chemical fertilizers are the most widespread type of fertilizer used in the agricultural sector of China due to their low cost and ease of application. However, the misuse of chemical fertilizers could lead to environmental problems, such as the massive emission of greenhouse gases (GHG). Therefore, it is important to determine how fertilizer-use efficiency (FUE) could be improved to stabilize or increase maize yield while reducing GHG emissions. In this study, we collected 6618 date records which include three datasets (for N, P, and K) from five maize-growing regions in China from 2005 to 2018, and performed a meta-analysis on the effects of N, K, and P fertilization levels on maize yield, partial factor productivity (PFP), agronomic efficiency (AE), and the carbon footprint of maize production. Additionally, scenario analyses were performed to estimate optimal fertilizer application rates for stabilizing or increasing maize yield while reducing GHG emissions. It was shown that FUE and maize yield responses to fertilization level varied in different regions. Compared to the past, the maize production of China has improved significantly in terms of FUE and its carbon footprint in recent years. Because of improvements in maize cultivars and cultivation technologies, it is possible to decrease N, P, and K application rates and reduce per unit area carbon footprint of maize, without compromising yield. In the future, N fertilization should be reduced by 10% from current levels, and the application of P and K fertilizers should be increased or decreased depending on the conditions of each maize-growing region. Thus, it should be possible to stabilize or even increase yields and reduce GHG emissions of maize production, thereby achieving green and efficient development.

1. Introduction

As the human population continues to grow, it is becoming highly challenging to increase food production without exacerbating environmental problems and increasing agricultural acreage [1]. The production of maize (Zea mays L.) plays an important role in efforts to achieve this goal. China is the second largest maize producer in the world, and the 2019 maize production of China accounted for 23.5% of the global total (USDA, 2019 https://www.usda.gov/ (accessed on 15 October 2020)). It is difficult to increase the yield of maize without applying fertilizers [2]. Therefore, proper fertilizer management is important for increasing crop yields and minimizing environmental problems caused by fertilizer overuse.
N, P, and K are the three most widely used elements for improving maize yield [3]. Although there are many new types of fertilizers (slow-release fertilizers, microbial fertilizers, and organic fertilizers, among others) that are effective in increasing yield and protecting the environment [4], traditional chemical fertilizers are still the most commonly used type of fertilizer in China, because they are cheap, fast-acting, and easy to apply. The application of fertilizers in appropriate quantities can increase crop yield and improve crop quality, but excess fertilization will damage the environment, increase production costs, and reduce grain quality [5]. Since the reform and opening up, the application rate of chemical fertilizer in China has maintained a high growth rate. In 2018, the application rate was still as high as 340.77 kg/ha. The application rates of nitrogen fertilizer, phosphorus fertilizer, potassium fertilizer, and compound fertilizer reached124.50 kg ha−1, 43.93 kg ha−1, 35.58 kg ha−1, and 136 kg ha−1 [6]. Because of the vastness of China, the optimal fertilizer application rate and fertilizer-use efficiency (FUE) (i.e., partial factor productivity (PFP) and agronomic efficiency (AE)) of the maize can differ substantially from one region to another. Hence, a systematic analysis that compares the yield-enhancing effects of each type of fertilizer and their FUE in each region and period would help to inform the best practices in fertilization. Furthermore, if we are able to achieve a sustainable and intensive production of maize in China, it is critical to understand how maize yield, PFP, and AE respond to N, P, and K application rates in each region of China, the changes in these responses over time, and to scientifically adopt informed fertilizer management strategies. The optimization of N, P, and K application rates have been studied on the regional level in all of the major maize-growing regions in China [3]. A global meta-analysis showed that chemical fertilizer could increase greenhouse gas by 20~70% [7,8]. However, studies regarding the FUE of each maize-growing region and their changes over time are rare, and reports regarding the relationship between FUE and carbon footprints are practically unheard of. The carbon footprint is defined as the amount of greenhouse gas (GHG) emission generated by a product or service throughout its life cycle [9]. The calculation of the carbon footprint is important for evaluating potential emission reductions in agricultural production and the creation of low-carbon production models [10,11]. The carbon footprint generated by chemical fertilizer usage is the largest contributor to the carbon footprint of agricultural production [11]. Therefore, improvements in FUE, which are in agreement with the transformation of the agricultural sector and green development, will have significant theoretical and practical implications for the reduction in GHG emissions and climate change mitigation.
Meta-analysis is a formal statistical method that is used to systematically combine the results of independent experiments, which can also be used to quantitatively evaluate the effects of some treatments on a regional level [12,13]. Based on a comprehensive literature review, a large dataset has been created that describes the effects of N, P, and K application rates on maize yield in five maize-growing regions of China, from 2005 to 2018. TA scenario analysis was then conducted to predict how chemical fertilization will affect the yield and carbon footprint of maize. The goal of this study is to answer the following questions: (1) How do the responses of maize yield, PFP, and AE to N, P, and K application rates differ among geographic regions? (2) How has the FUE of maize changed over the last 7 years (2012–2018), as compared with that of earlier years (2005–2011)? (3) Will it be possible for China to simultaneously increase maize yield and reduce maize-related GHG emissions in the future by changing fertilizer application rates?

2. Methods

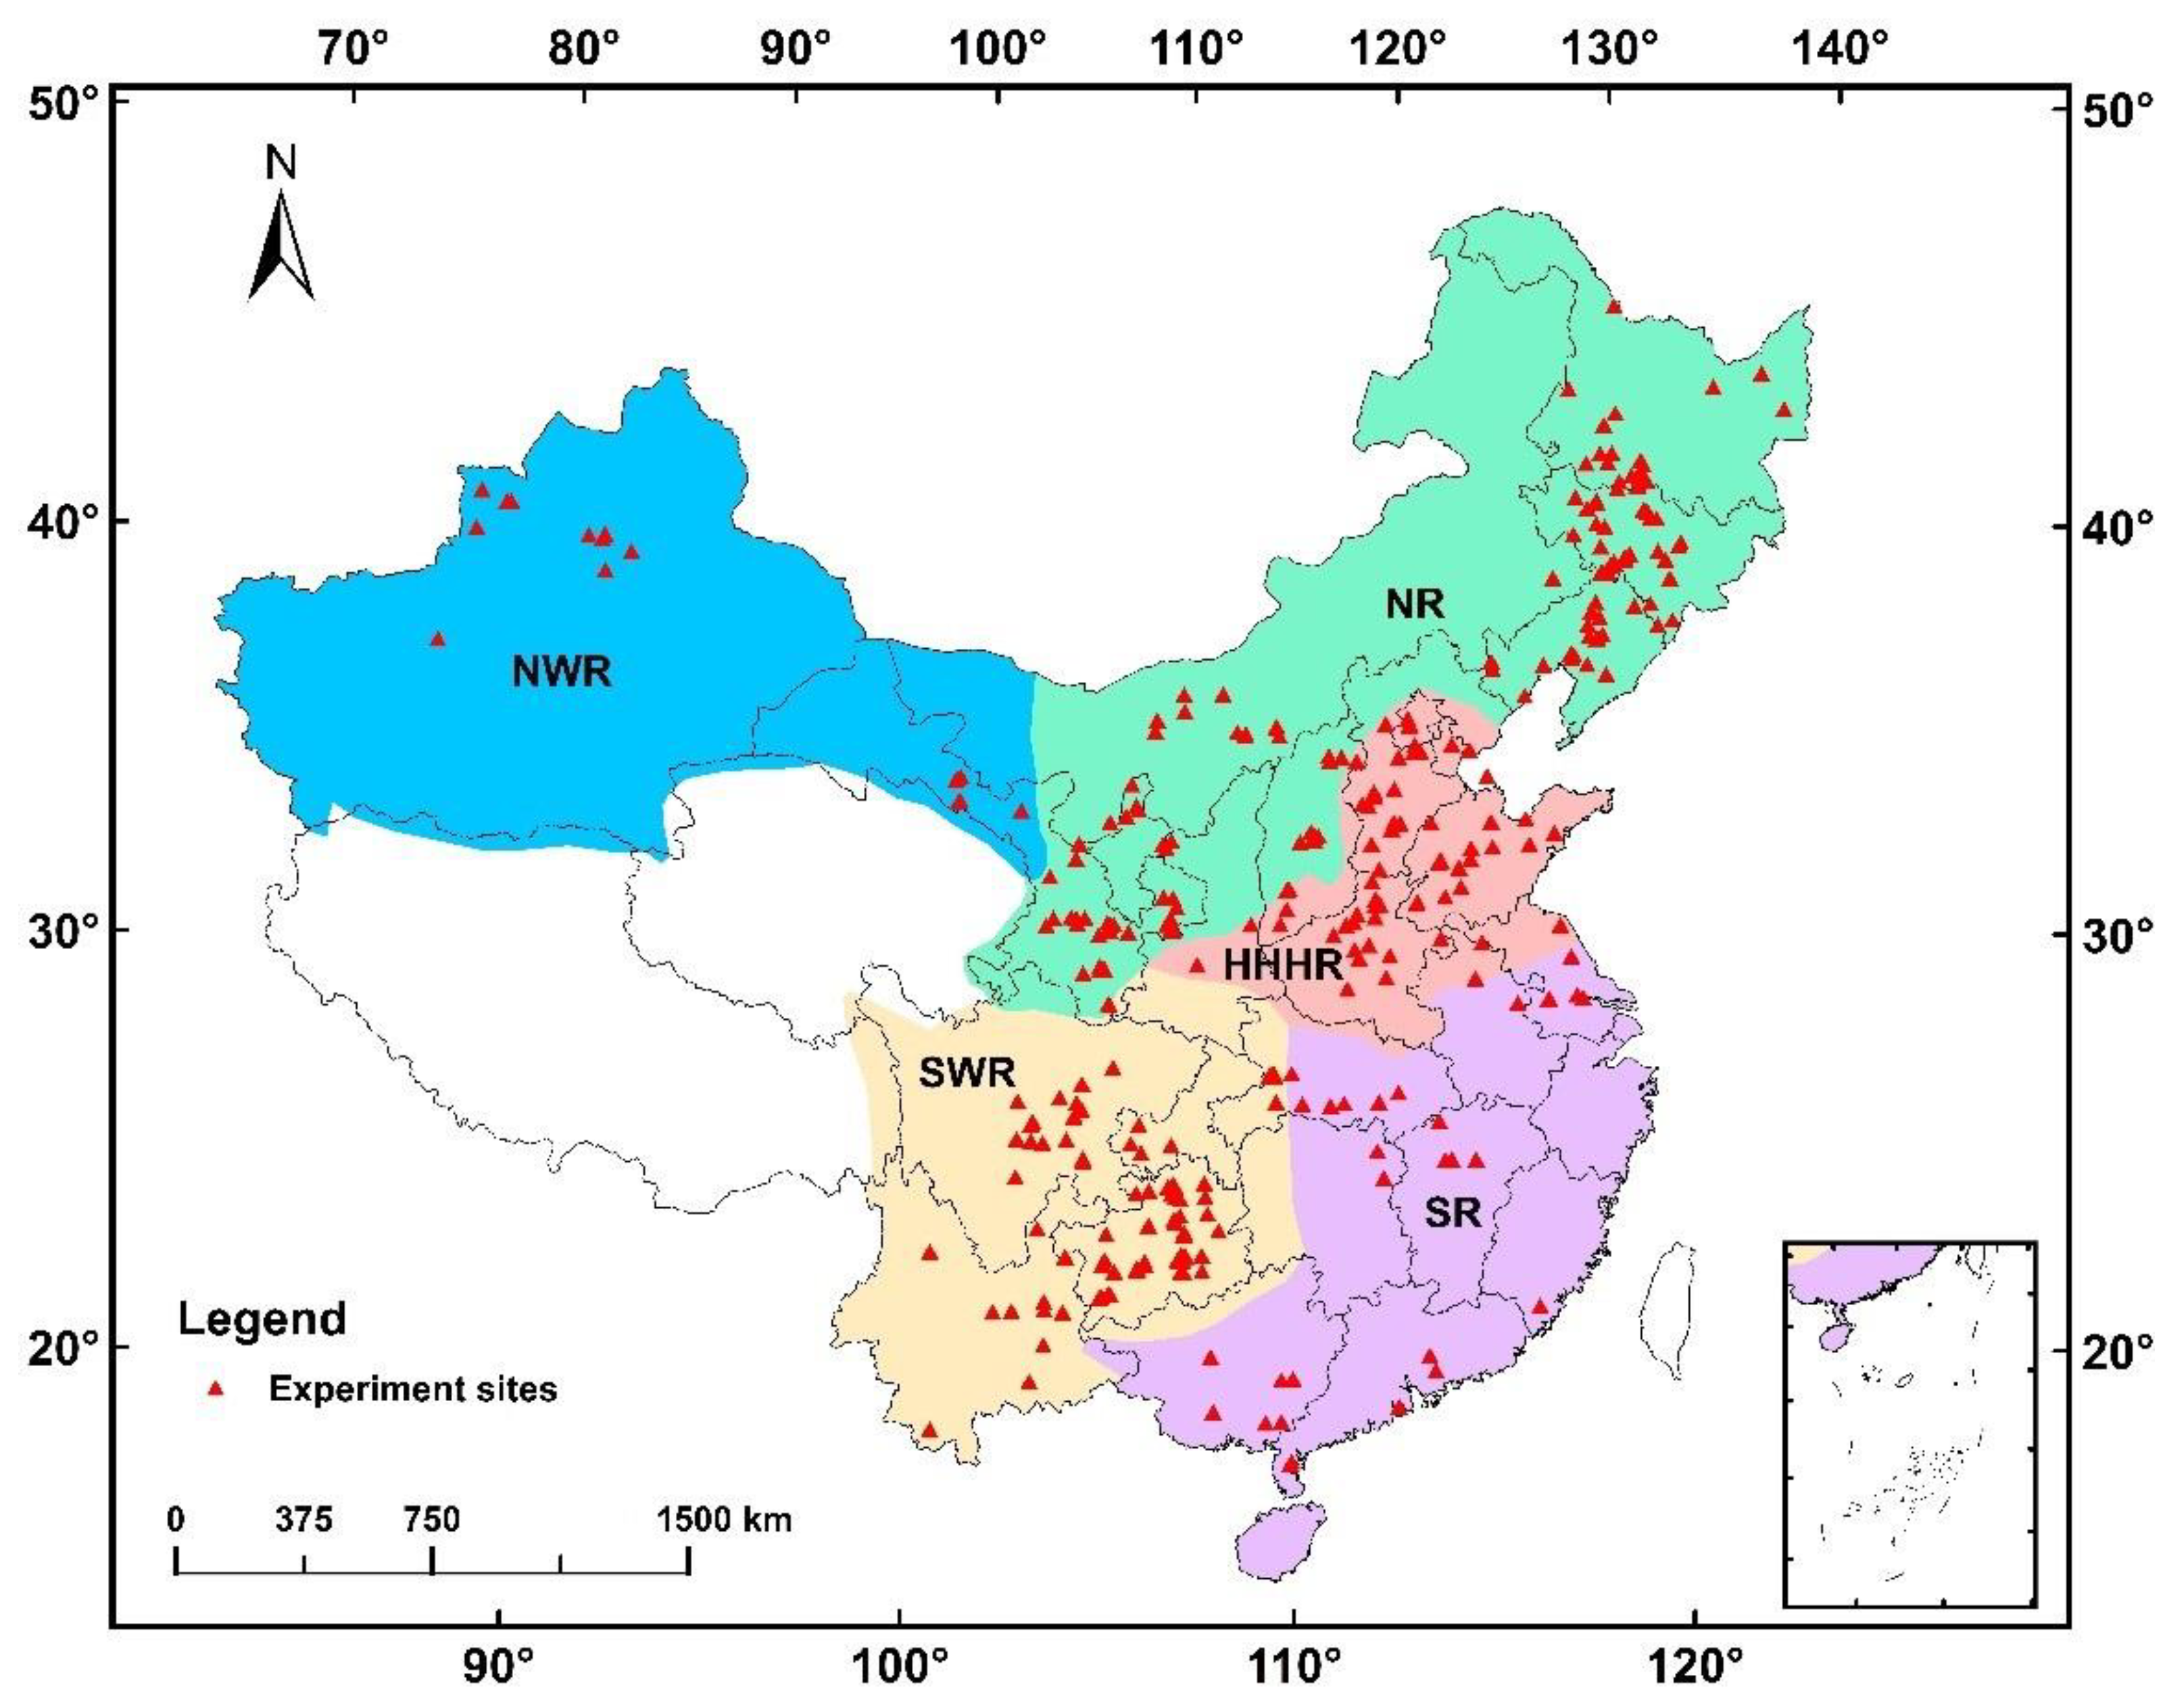
2.1. Data Collection and Collation

This study used “nitrogen + maize,” “phosphorus + maize,” “potassium + maize,” and “China” as keywords to retrieve papers from the China Knowledge Resource Integrated Database (https://www.cnki.net/old/ (accessed on 16 October 2020)) and Web of Science (http://www.apps.webofknowledge.com/ (accessed on 20 October 2020)) regarding studies that were conducted between 2005 and 2018 (these did not include laboratory experiments, evaluations, reviews, and model simulations). The retrieved papers were screened using the following criteria to ensure that they meet the requirements of the meta-analysis: (1) The trials were conducted under field conditions, and the amount and type of N, P, and K fertilizers that were used in the trials were clearly specified, as well as the location and year(s) of the trials. (2) Urea was used in the N fertilizer trials, calcium superphosphate was used in the P fertilizer trials, and potassium chloride and potassium sulfate were used in the K fertilizer trials. (3) The trial must have used “no N,” “no P,” and “no K” conditions as controls and included treatments with varying N, P, and K application rates, and each data record included at least one pair of control and treatment results, including crop yield and fertilizer quantity. (4) All other test conditions were consistent within data records, except for variations in N, P, and K application rates. (5) Each experimental dataset from the literature was only included once in the analysis. At the end of the screening process, 335, 181, and 160 articles were obtained on N, P, and K fertilizer trials, respectively. The yields of the control and treatment groups, the standard deviation in yield and other relevant information (e.g., the location of the trial, basic soil productivity, meteorological data) were extracted from each paper. Textual and tabular data were extracted directly. The graphs were extracted using GetData Graph Digitizer. A total of 6618 experimental data records (N: 3923, P: 1537, K: 1158) were used in the meta-analysis. The studies that met the criteria and could be used for meta-analysis are shown in the meta-analysis references.
To explain how maize yield varies in response to year and environment, the data were divided into two periods: 2005–2011 and 2012–2018. Based on the methods of Hou [14] and Liu [15], the study area was divided into five major maize-growing regions with distinct geographic and climatic conditions: the Northern Region (NR), Huang-Huai-Hai Region (HHHR), Southern Region (SR), Southwest Region (SWR), and Northwest Region (NWR). The locations of the trials are shown in Figure 1. The sowing and harvesting periods, meteorological conditions, and soil physicochemical properties of each region are shown in Table 1. Based on the recommendations of Wu [3] with regard to fertilizer application rates in China, the N, P, and K application rates in the literature were classified as “low,” “medium,” “high,” or “extremely high.” This corresponds to N application rates of 0< and ≤112.5 kg ha−1 (low), 112.5< and ≤225 kg ha−1 (medium), 225< and ≤337.5 kg ha−1 (high), 337.5< and ≤450 kg ha−1 (extremely high), P2O5 application rates of 0< and ≤75 kg ha−1 (low), 75< and ≤150 kg ha−1 (medium), 150< and ≤225 kg ha−1 (high), 225< and ≤300 kg ha−1 (extremely high), and K2O application rates were 0< and ≤60 kg ha−1 (low), 60< and ≤120 kg ha−1 (medium), 120< and ≤180 kg ha−1 (high), 180< and ≤240 kg ha−1 (extremely high).

2.2. Calculation of Fertilizer-Use Efficiency (FUE)

The PFP and AE of the N, P, and K fertilizers were calculated using the following equations [13,16] to determine the FUE of each fertilization level:
P F P ( kg   kg 1 ) =   Y   N , P , K   F   N , P , K
A E (   kg   kg 1 ) =   (   Y   N , P , K Y   0 )   F   N , P , K
In these equations, YN,P,K (kg ha−1) is the grain yield of the fertilization treatment, whereas Y0 is the grain yield of the control treatment. FN,P,K (kg ha−1) is the amount of N, P, and K that was applied in the treatment. The standard deviations of PFP and AE were estimated according to the method of van Groenigen [17]. Firstly, the coefficient of variation of the extracted dataset from each paper was calculated. The missing standard deviations were then estimated by multiplying the mean of each index by the coefficient of variation.

2.3. Meta-Analysis

The fixed-effects and random-effects models are the two most commonly employed statistical models in the meta-analysis. The random-effects model was used to calculate effect values in the meta-analysis because the field trials were conducted in varying regions and years, with different maize cultivars and soils. The natural logarithm of the response ratio, ln R, was used to measure the effect of each treatment. The equation for ln R is as follows Hedges [18]:
ln   R =   ln   X   t   X   c
For the comparisons of the yields in different regions and years, Xt is the mean maize yield of the treatment group (fertilizer treatment), whereas Xc is the mean yield of the control group (no fertilizer fertilization). In the comparisons between the FUE of different regions and fertilization levels, Xt is the mean PFP or AE of the treatment group (2012–2018), whereas Xc is the mean PFP or AE for the control group (2005–2011). The equation to calculate the variance of ln R was based on previous research by Hedges [18] and Du [4], as follows:
  V   ln   R =   S D   t   2   N   t   X   t   2 +   S D   C   2   N   c   X   c   2
where St and Sc, Xt and Xc, and Nt and Nc are the standard deviation, mean, and sample size of the treatment and control groups, respectively.
To facilitate the interpretation of the effects of fertilization on maize yield and FUE, the effect values were transformed into relative rates of change (Y) according to the following equation Du [4]:
Y (   % ) = (   e   ln   R 1 ) × 100
If the 95% confidence interval of Y overlaps with 0, the difference between the treatment and control groups is non-significant. Conversely, if the 95% confidence interval does not overlap 0, the difference between the treatment and control groups is significant (p < 0.05), and this implies that the corresponding fertilization level has significant positive or negative effects on maize yield and FUE compared with that of the control.

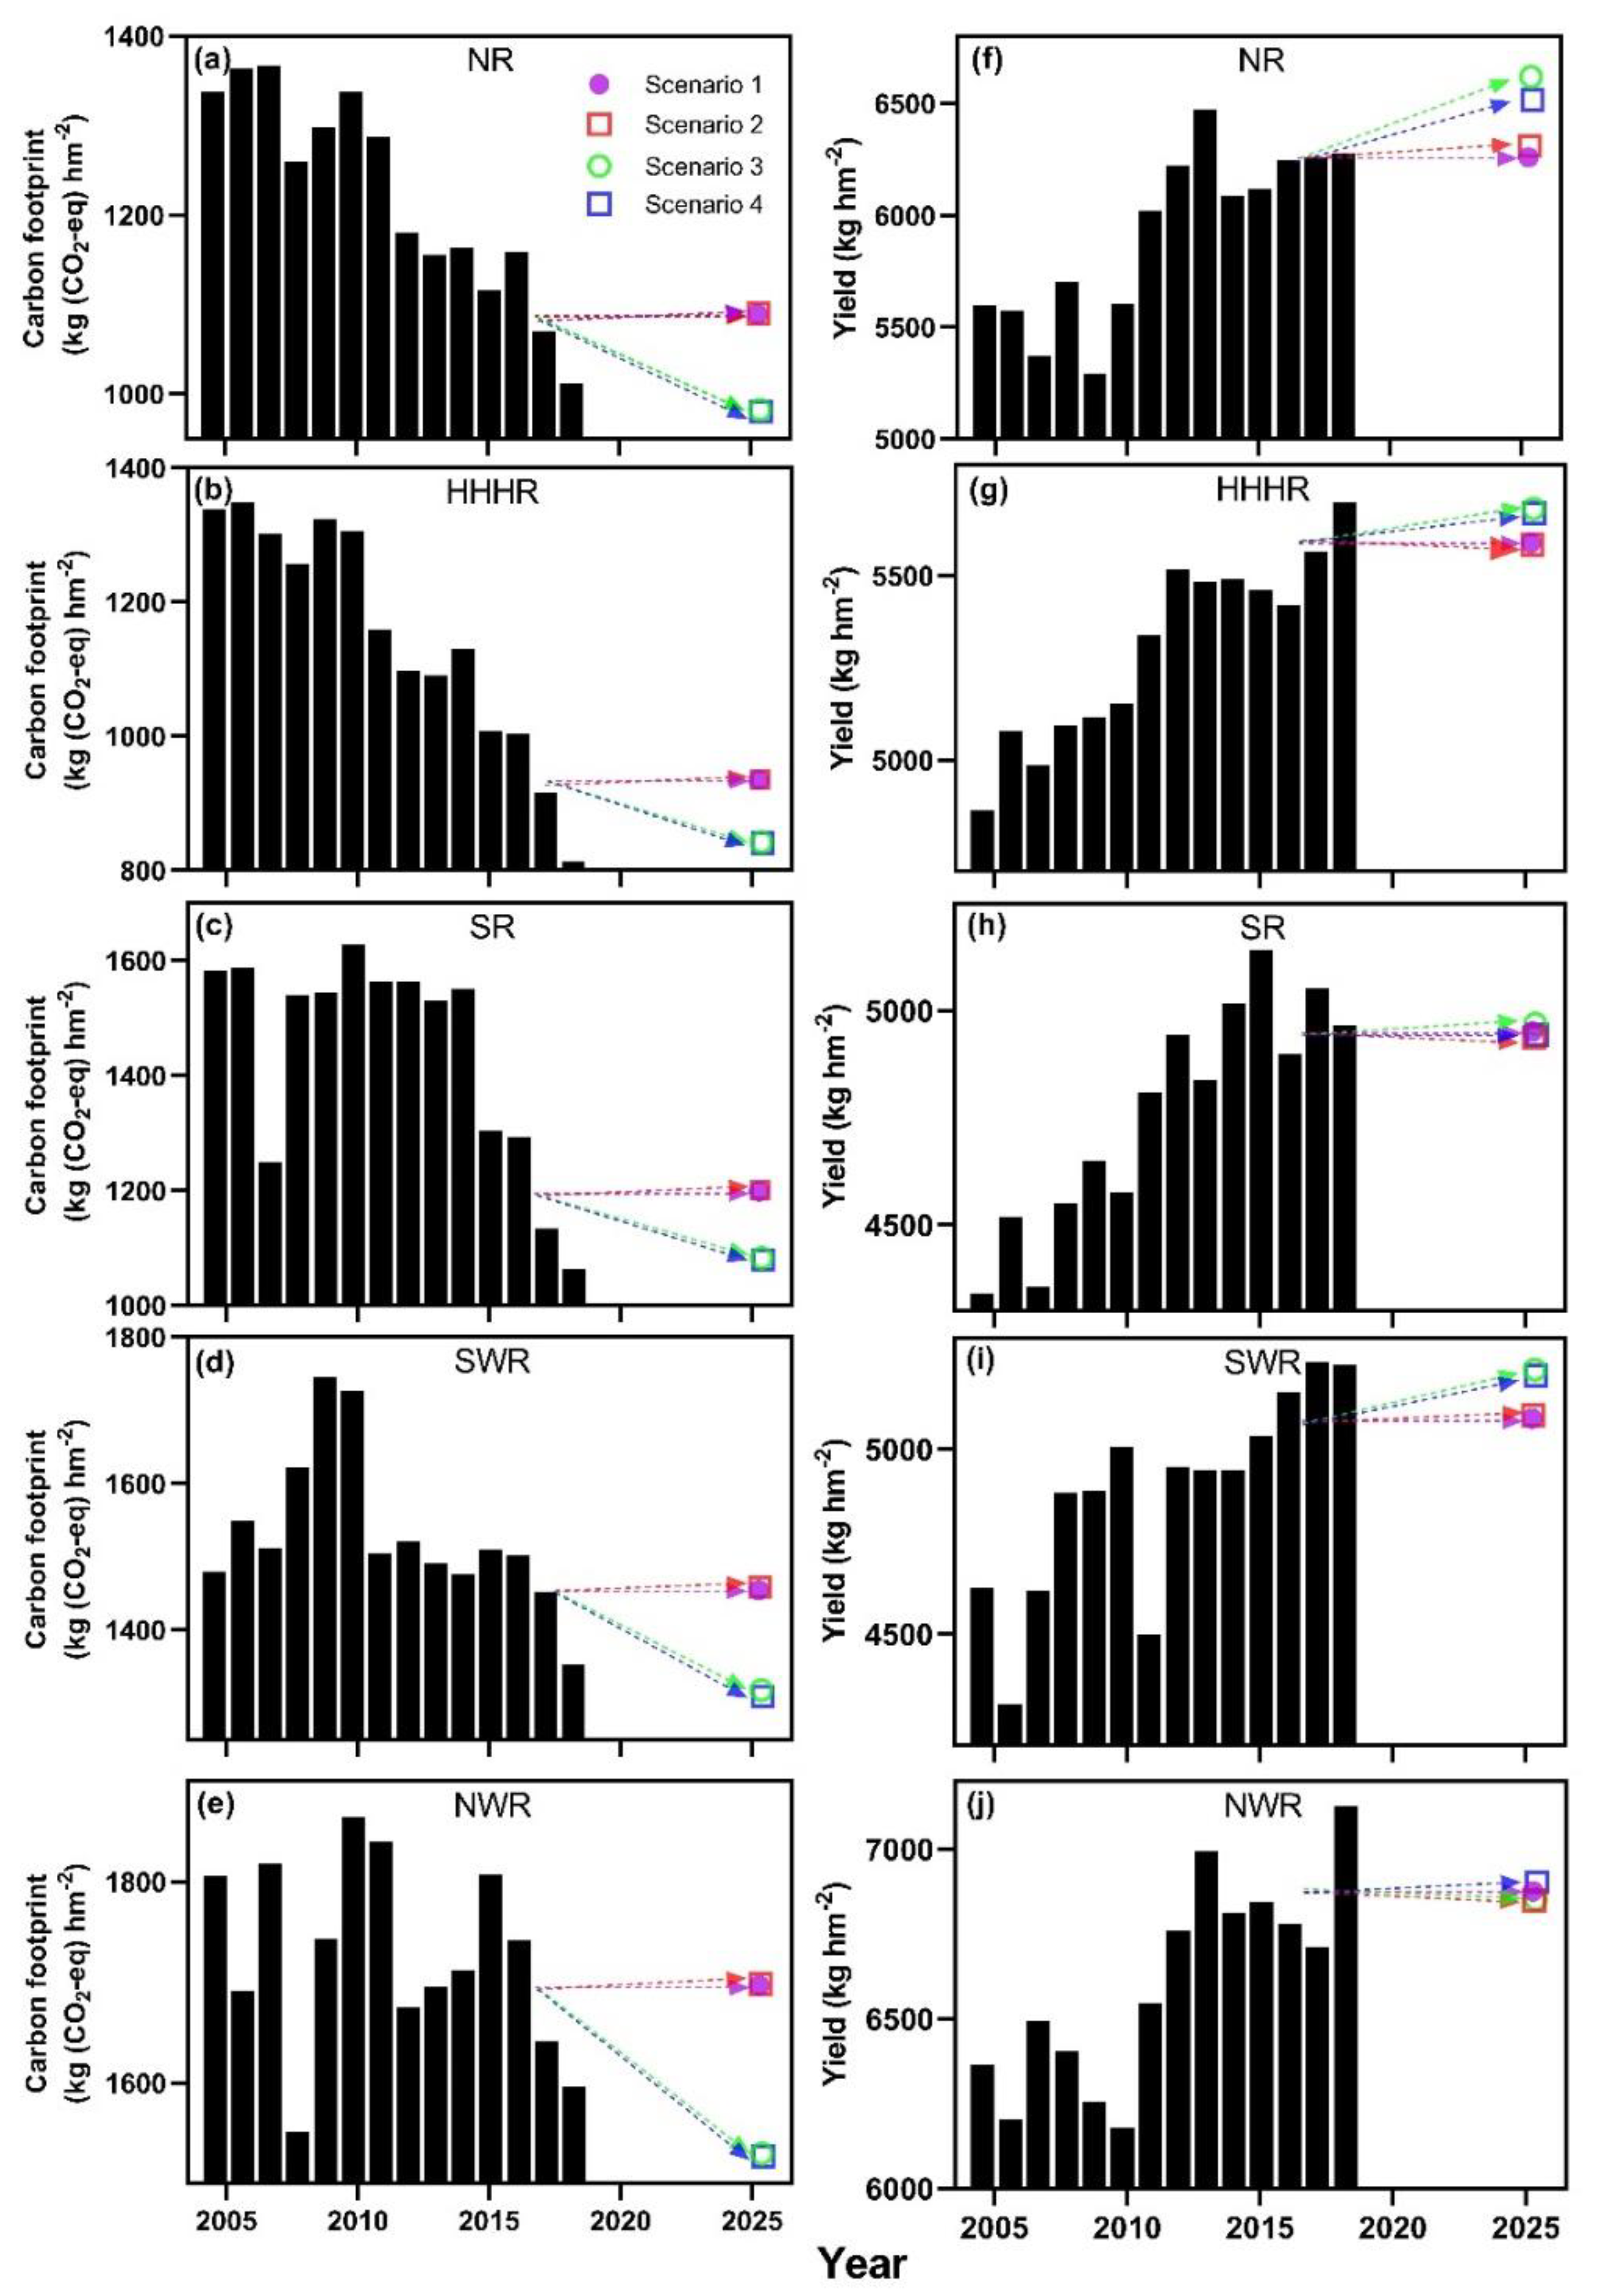
2.4. Scenario Analyses on the Carbon Footprint of Chemical Fertilization in Maize Production

In this study, it was assumed that GHG emissions caused by fertilizer input in maize production was mainly derived from two sources: (1) GHG emissions caused by fertilizer inputs and (2) soil N2O emissions during crop growth. The carbon footprint per unit area of maize production was calculated based on the 2005–2018 maize yields and N, P, and K inputs provided by the China Statistical Yearbook (http://www.stats.gov.cn/tjsj/ndsj/ (accessed on 26 October 2020)) and the National Compilation of Agricultural Cost Information Returns [19]. The carbon emission factors of the N, P, and K fertilizers were obtained from the China Life Cycle Basis Database (CLCD, www.clcd.com (accessed on 28 October 2020)). The equation for calculating the carbon footprint per unit area is demonstrated by Wang [11], as follows:
  C F   A (   kg   ( CO   2   eq )   hm 2 ) =   N , P , K   n ( A m o u n t N , P , K × E F N , P , K )  
In this equation, AmountN,P,K is the rate of fertilizer input (kg ha−1), and EFN,P,K is the emission factor of the selected type of fertilizer.
The equation for calculating the direct N2O emission per unit area of soil is:
  C F   B (   k g     ( C O   2 e q )   h m 2 ) = F   N × E F   N 1 ×   44   28 × 265
In this equation, FN is the rate of N fertilization during the maize-growing season (kg ha−1); EFN1 is the emission factor for soil N2O emissions because of N input (kg(N2O-N) kg−1), which was set to 0.0125 according to the IPCC standard (https://www.ipcc.ch/ (accessed on 26 October 2020)); 44   28 is the conversion factor of N2 to N2O; 265 is the warming potential of N2O over a 100-year timescale [11]
The equation for calculating the indirect emission of N2O per unit area of soil is as follows (Wang et al., 2018):
C F   C (   k g   (   C O   2 e q )   h m 2 ) = F   N 2 × F   r a c   G A S F × E F   N 2 ×   44   28 × 265
In this equation, FracGASF is the ammonia volatilization factor (kg (NH3-N) kg−1 N) from the Ecoinvent Database (http: //www.ecoinvent.ch (accessed on 28 October 2020)), which is 0.17; EFN2 is the emission factor for N2O emissions caused by atmospheric N deposition in soil and water (kg (N2O) kg−1 (NH3-N)), which is 0.01 according to the IPCC standard. The remaining indices have the same meaning as in Equation (9).
The carbon footprint generated by chemical fertilization is given by:
C F ( k g     C O   2   e q   e q   h   m 2 ) = C F   A + C F   B + C F   C
The “Action Plan for Zero Growth in Fertilizer Use by 2020” adopted by China in 2015 (http://www.moa.gov.cn/ztzl/mywrfz/gzgh/201509/t20150914_4827907.htm (accessed on 28 October 2020)) calls for zero growth in fertilizer use by 2020, and seeks to address imbalances in N, P, and K fertilization, which tend to be heavy in N and light in P and K. Based on this plan, we predicted how changes in chemical fertilization may affect the yield and carbon footprint of maize production using a least-squares multiple regression model [11], which assumes that all other production inputs (seeds, pesticides, and agricultural machinery) will remain unchanged. The predicted yields and carbon footprints were then compared to those resulting from the average fertilizer application rates of the 2015–2018 period. We tested the four following scenarios:
(1)
Unchanged N, P, and K application rates.
(2)
A 0% increase in N fertilization with a 10% increase in P and K fertilization.
(3)
A 10% reduction in N fertilization with a 10% increase in P and K fertilization.
(4)
A 10% reduction in N, P, and K fertilization.

2.5. Data Analysis

Microsoft Office 2019 was used for data collation and routine calculations, whereas Review Manager 5.3 was used to perform the meta-analysis. EViews10 was used for the multiple regression simulations and predictions, whereas GraphPad Prism 9.0 was used to perform significance analyses and create graphs. ArcGIS 9.3 was used to create maps of the maize-growing areas.

3. Results

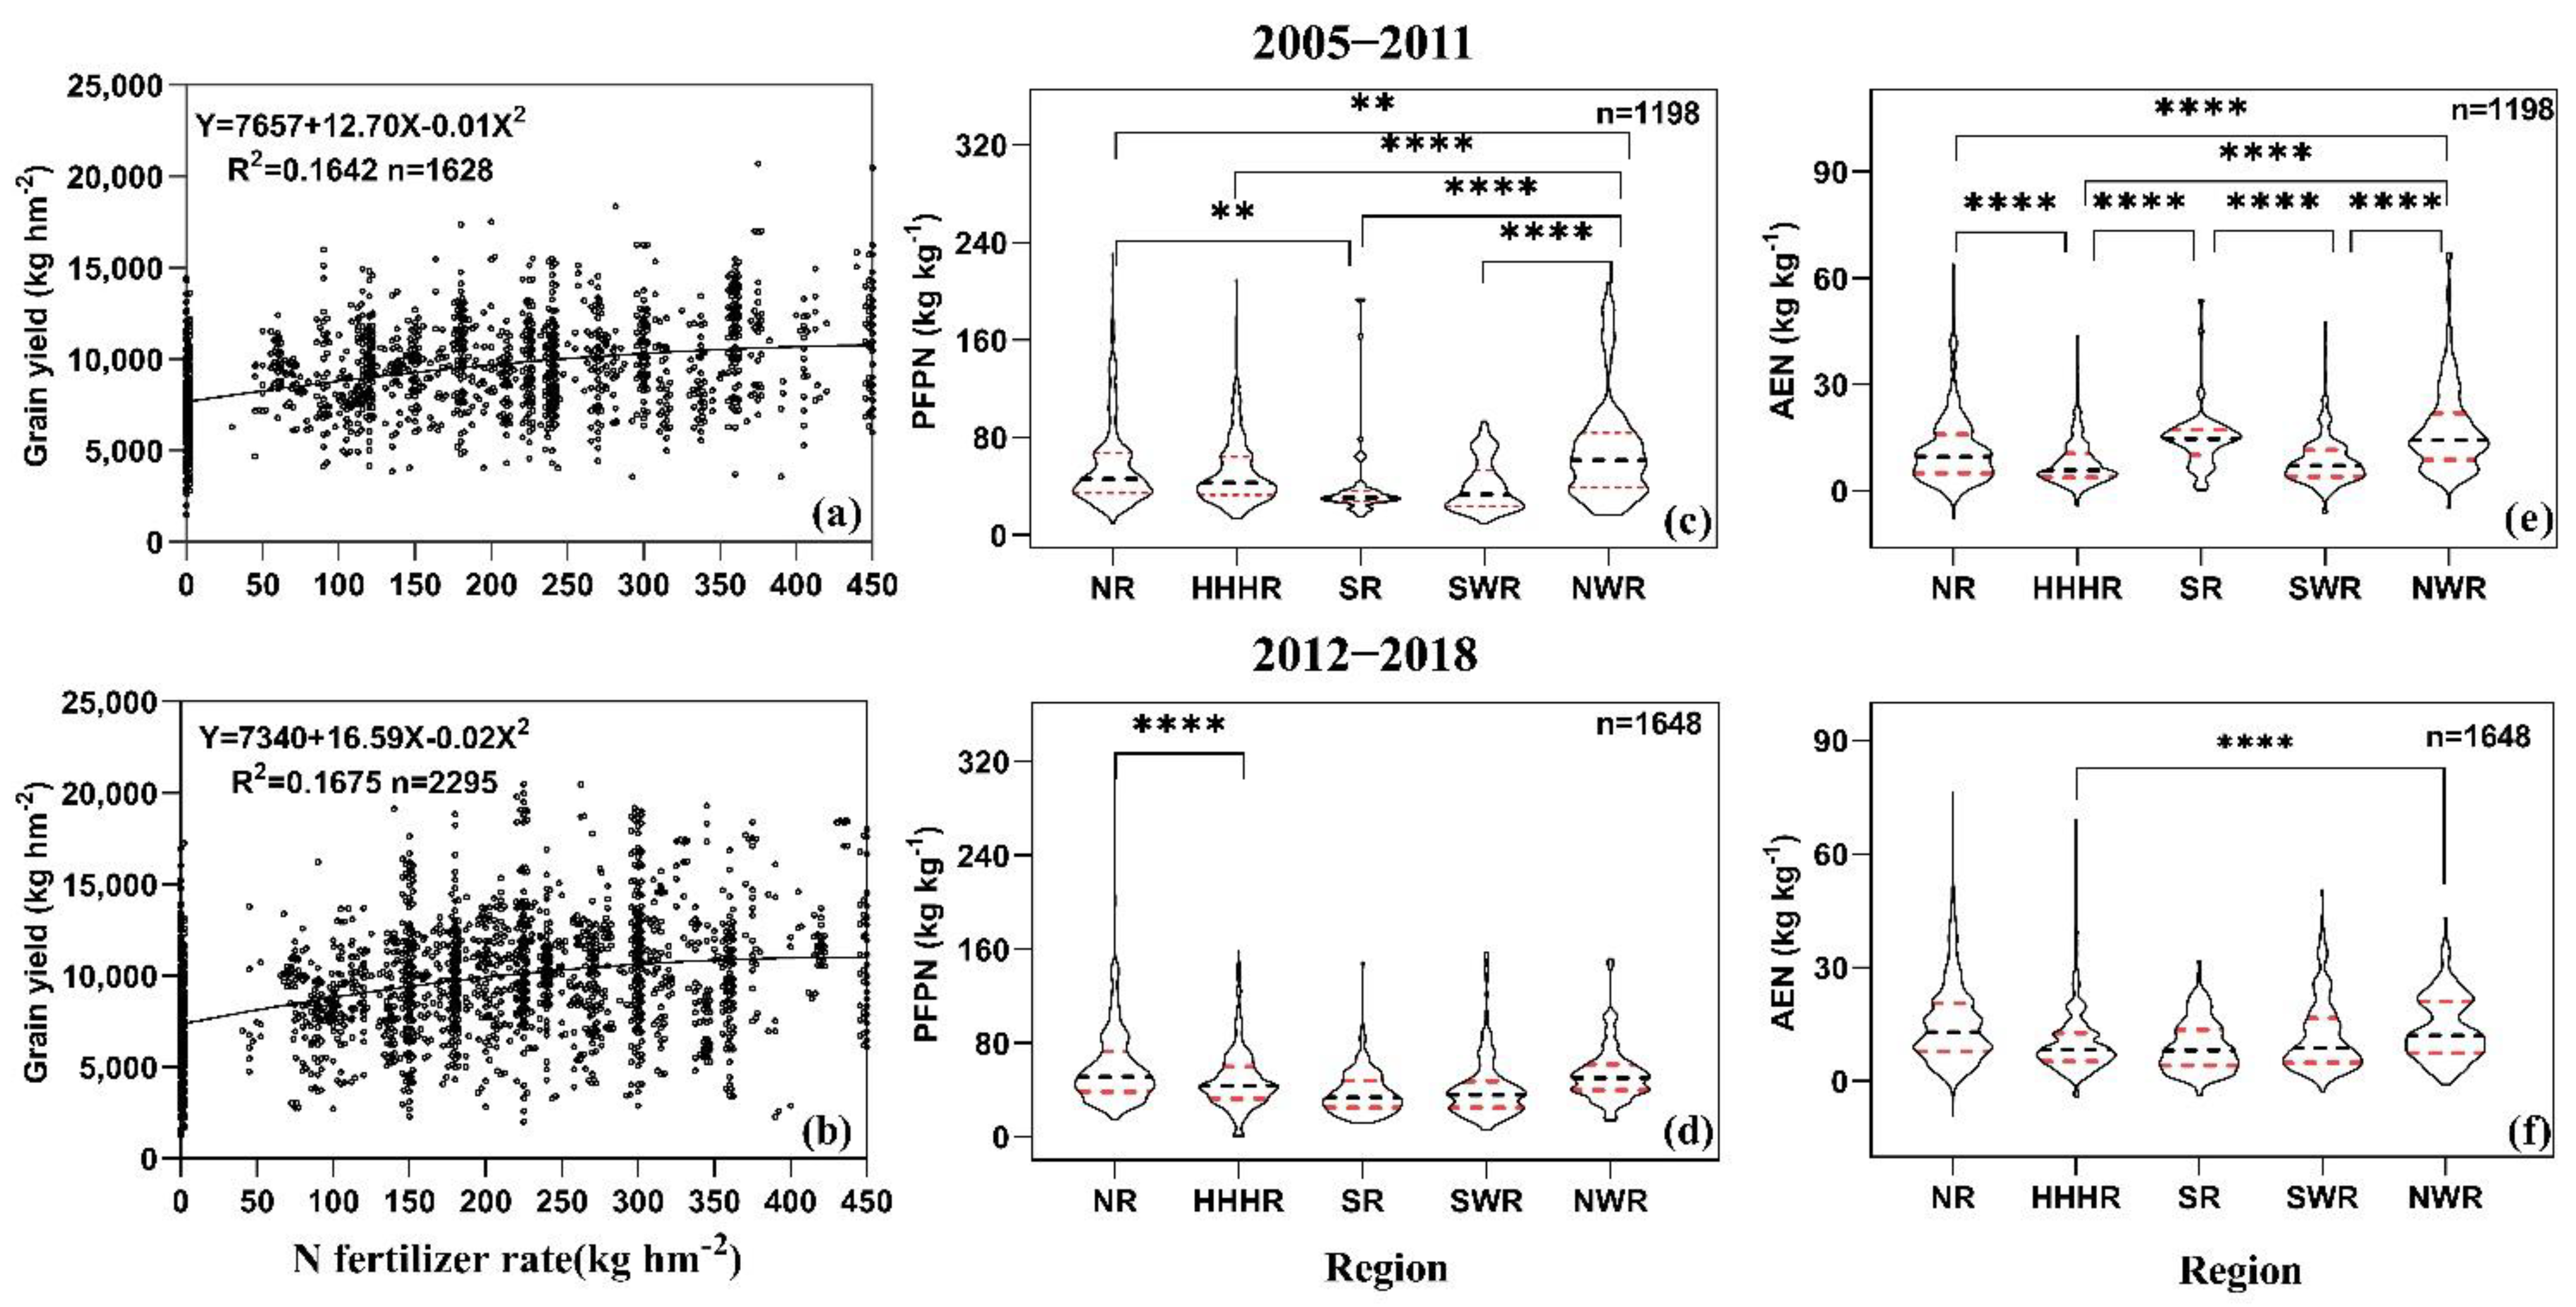
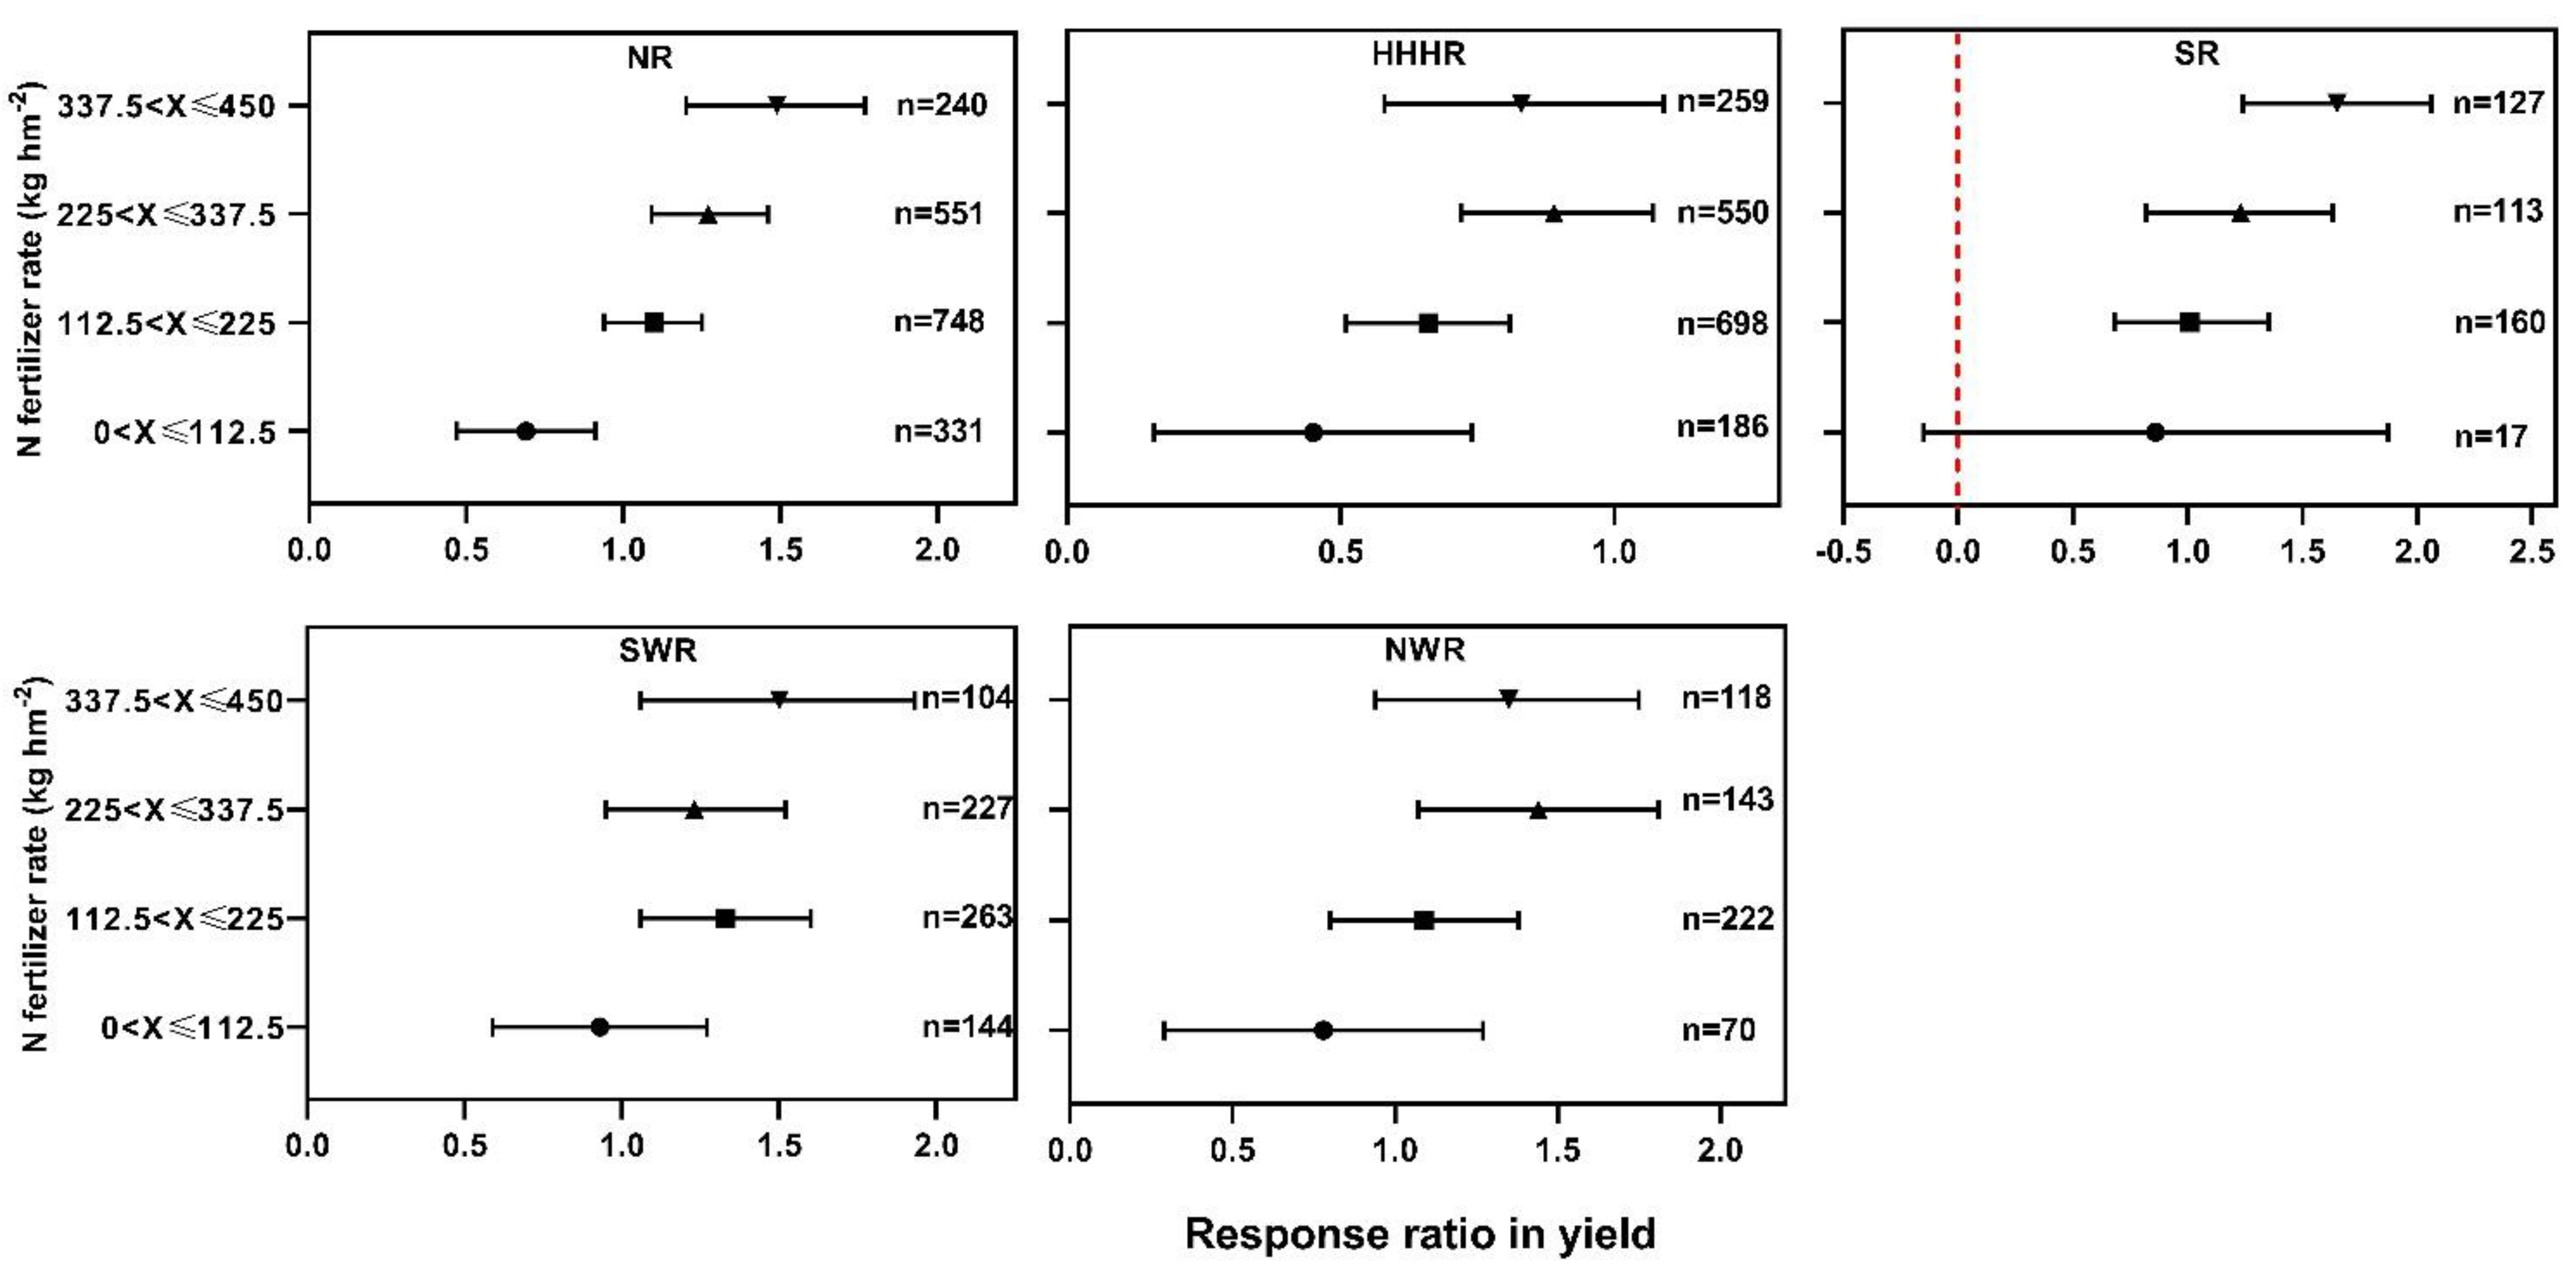
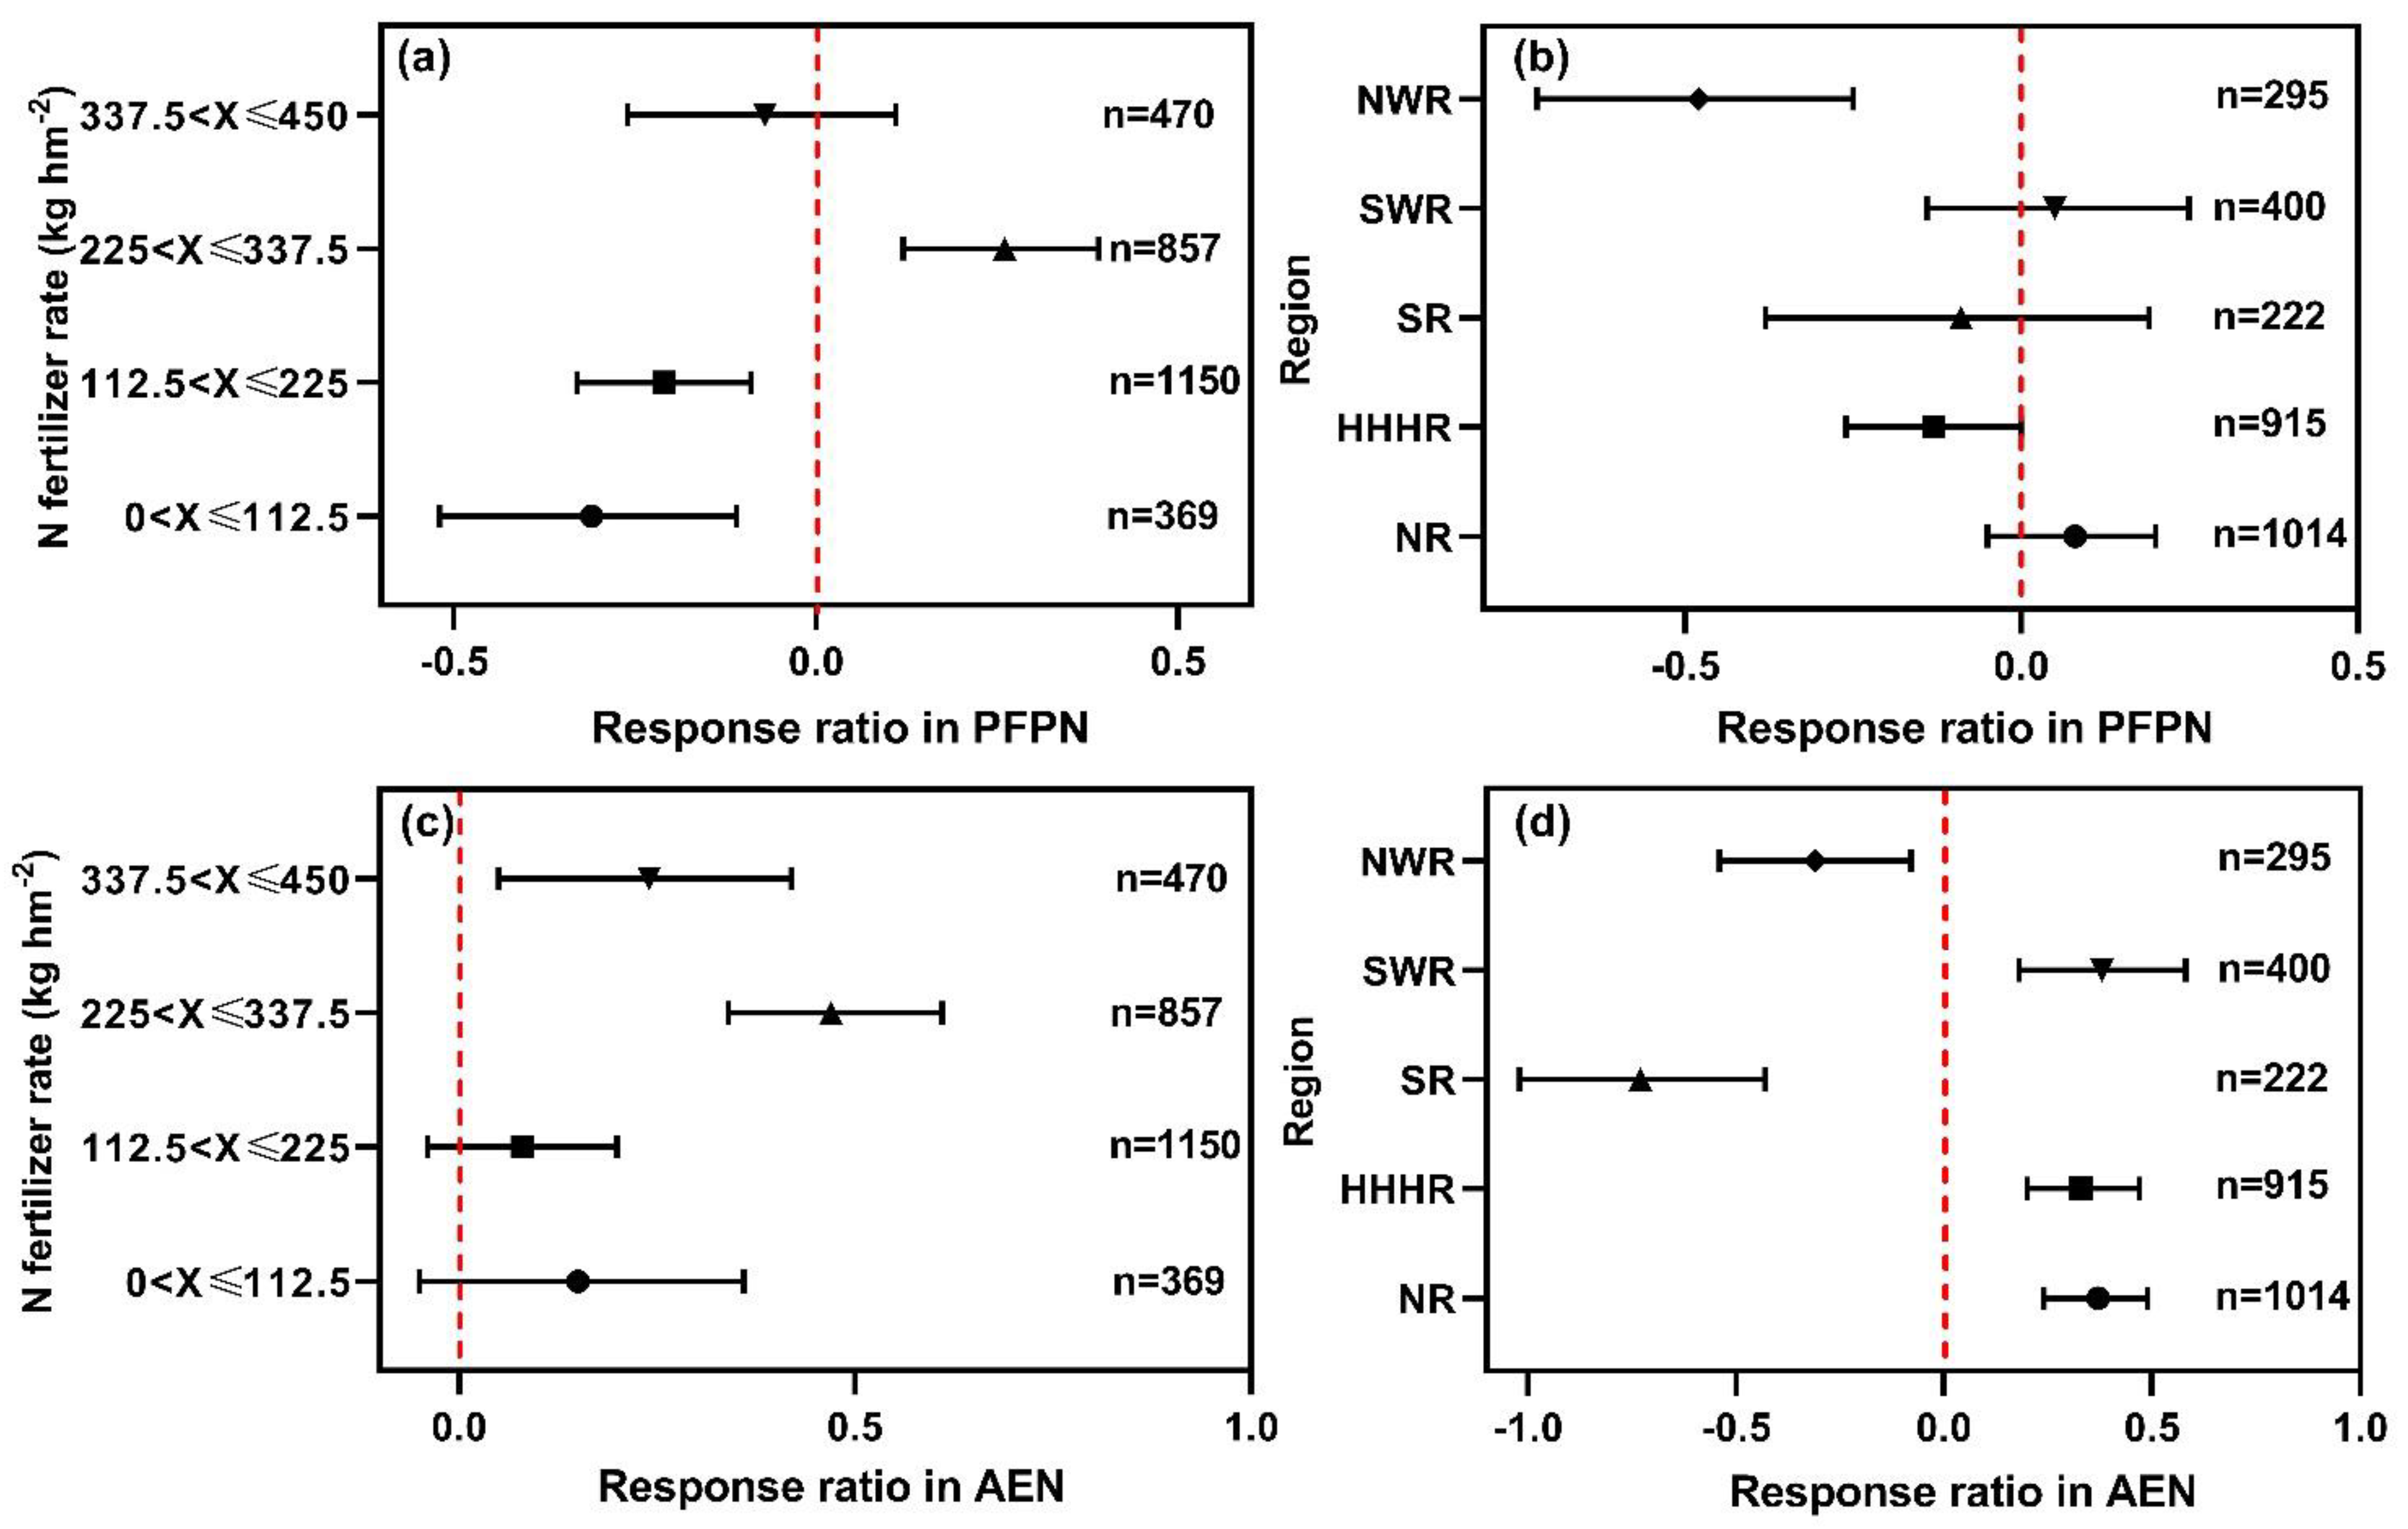
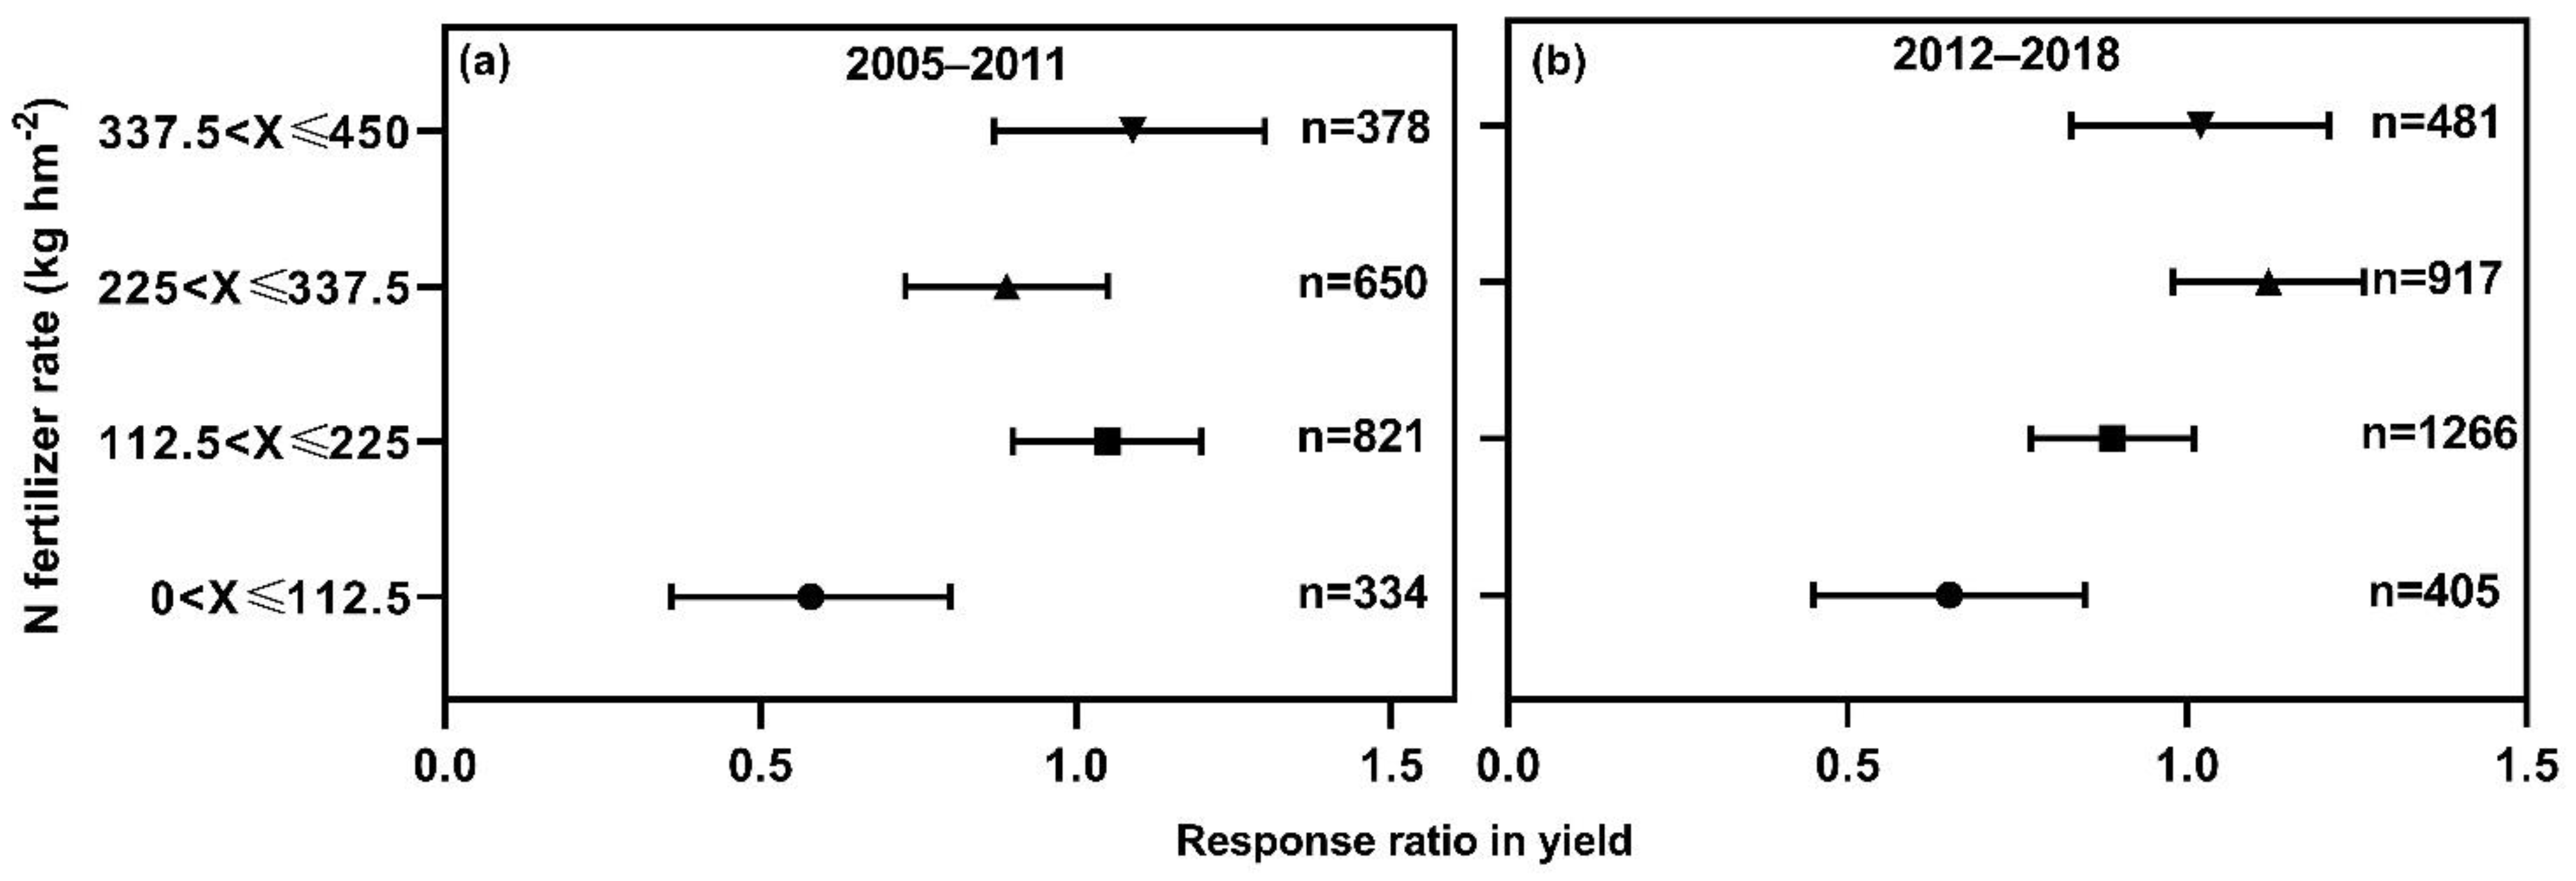
3.1. Effects of N Fertilization Level on Maize Yield and the FUE of N Fertilizers

The level of N fertilization was found to significantly affect maize yield (Figure 2a,b). In the NR, HHHR, SR, SWR, and NWR, low N application rates (0–112.5 kg ha−1) increased maize yield compared to the “no N” condition by an average of 99.37%, 56.83%, 136.32%, 153.45%, and 118.15%, respectively; medium N application rates (112.5–225 kg ha−1) increased yield by an average of 200.42%, 93.48%, 174.56%, 278.10%, and 197.42%; high N application rates (225–337.5 kg∙ha−1) increased the average yield by 256.09%, 143.51%, 242.12%, 242.12%, and 322.07%; extremely high N application rates (337.5–450 kg∙ha−1) increased yield by an average of 343.71%, 129.33%, 420.70%, 348.17%, and 285.74% (Figure 3). Annual maize yields also responded positively to N fertilization (Figure 4). Low, medium, high, and extremely high N fertilization levels increased maize yields compared to the “no N” condition by 78.60%, 185.77%, 143.51%, and 197.43% in 2005–2011, and 91.55%, 143.51%, 206.49%, and 177.32% in 2012–2018. Yield enhancement because of N fertilization was higher in 2012–2018 than in 2005–2011, except for the “extremely high” level of N fertilization.
The partial factor productivity of N (PFP of N) and agronomic efficiency of N (AEN agronomic efficiency of NAE of N) responded differently to differences in region and fertilization levels from one period to another. In Figure 5, it is shown that the PFPN response to the 2012–2018 period (as compared to the 2005–2011 period) was positive for the “high” (225–337.5 kg ha−1) level of N fertilization, but negative at all other N fertilization levels. In 2012–2018, the AENs associated with low, medium, high, and extremely high N fertilization levels increased by an average of 16.18%, 8.33%, 60.00%, and 27.12% compared to the 2005–2011 period. In the SR and NWR, the FUE of N decreased over time. In 2012–2018, the average PFPN of the SR and NWR decreased by 8.61% and 38.12%, whereas their average AEN values decreased by 51.81% and 26.66%, respectively, as compared to the 2005–2011 period. However, in the NR and SWR, PFPN increased by 8.33% and 5.13%, whereas AEN increased by 44.77% and 46.23% on average, from 2005–2011 to 2012–2018. In the HHHR, the average PFPN decreased by 12.19% from 2005–2011 to 2012–2018, whereas the average AEN increased by 39.10%.

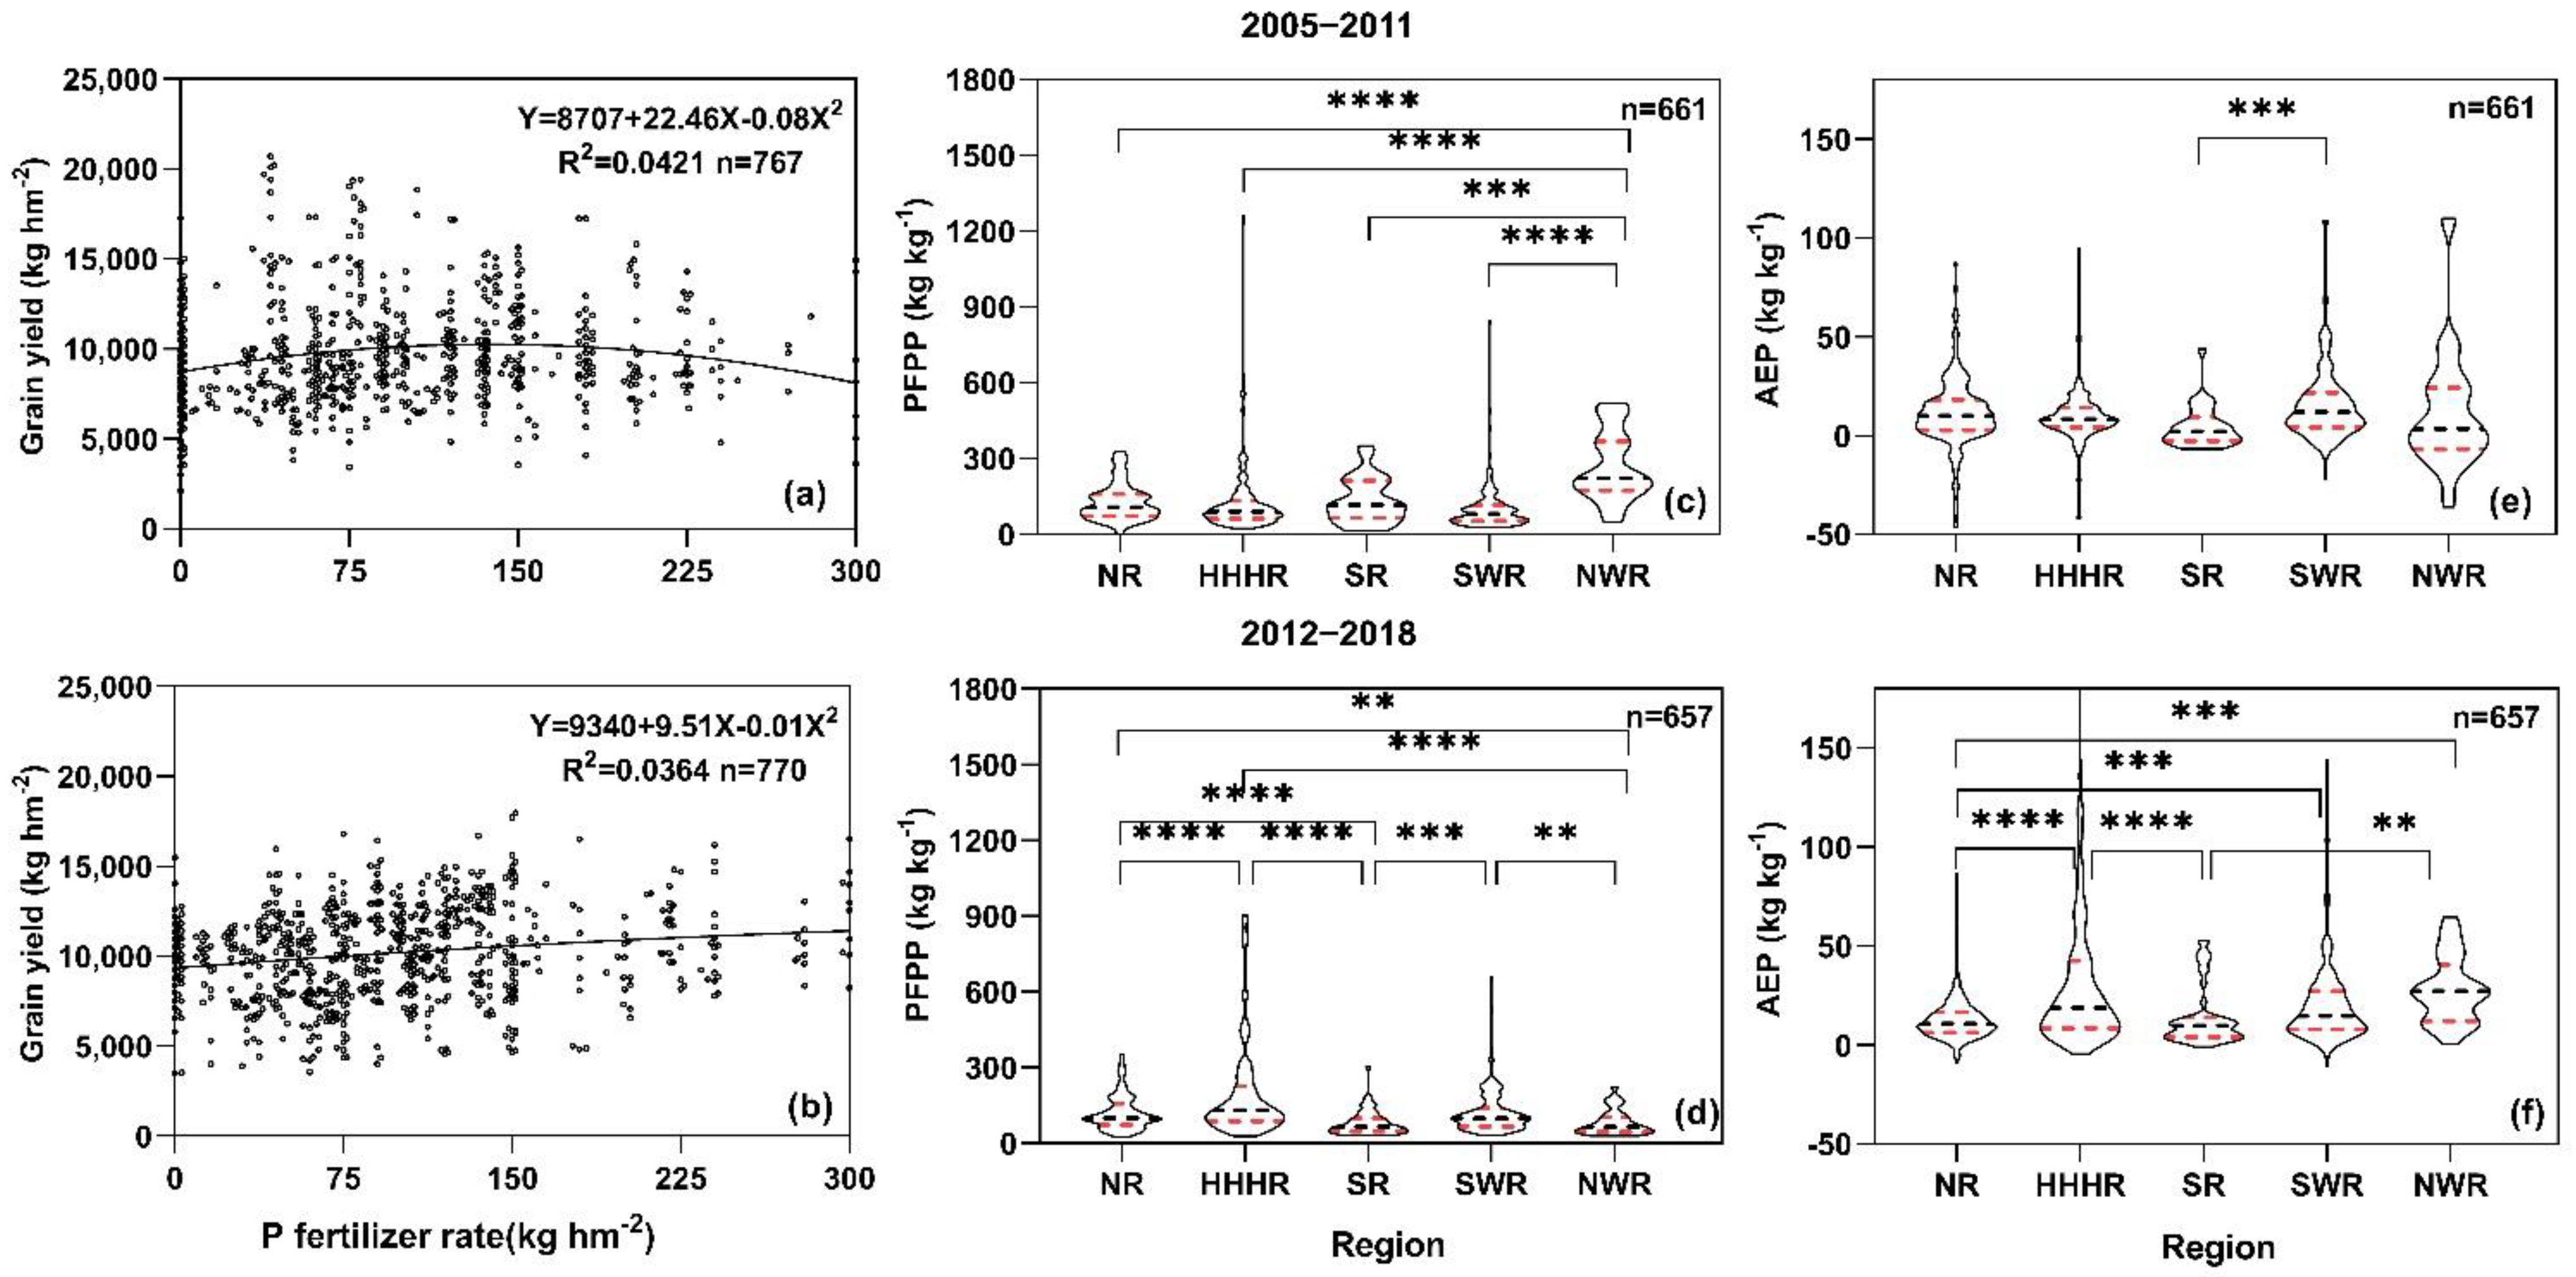
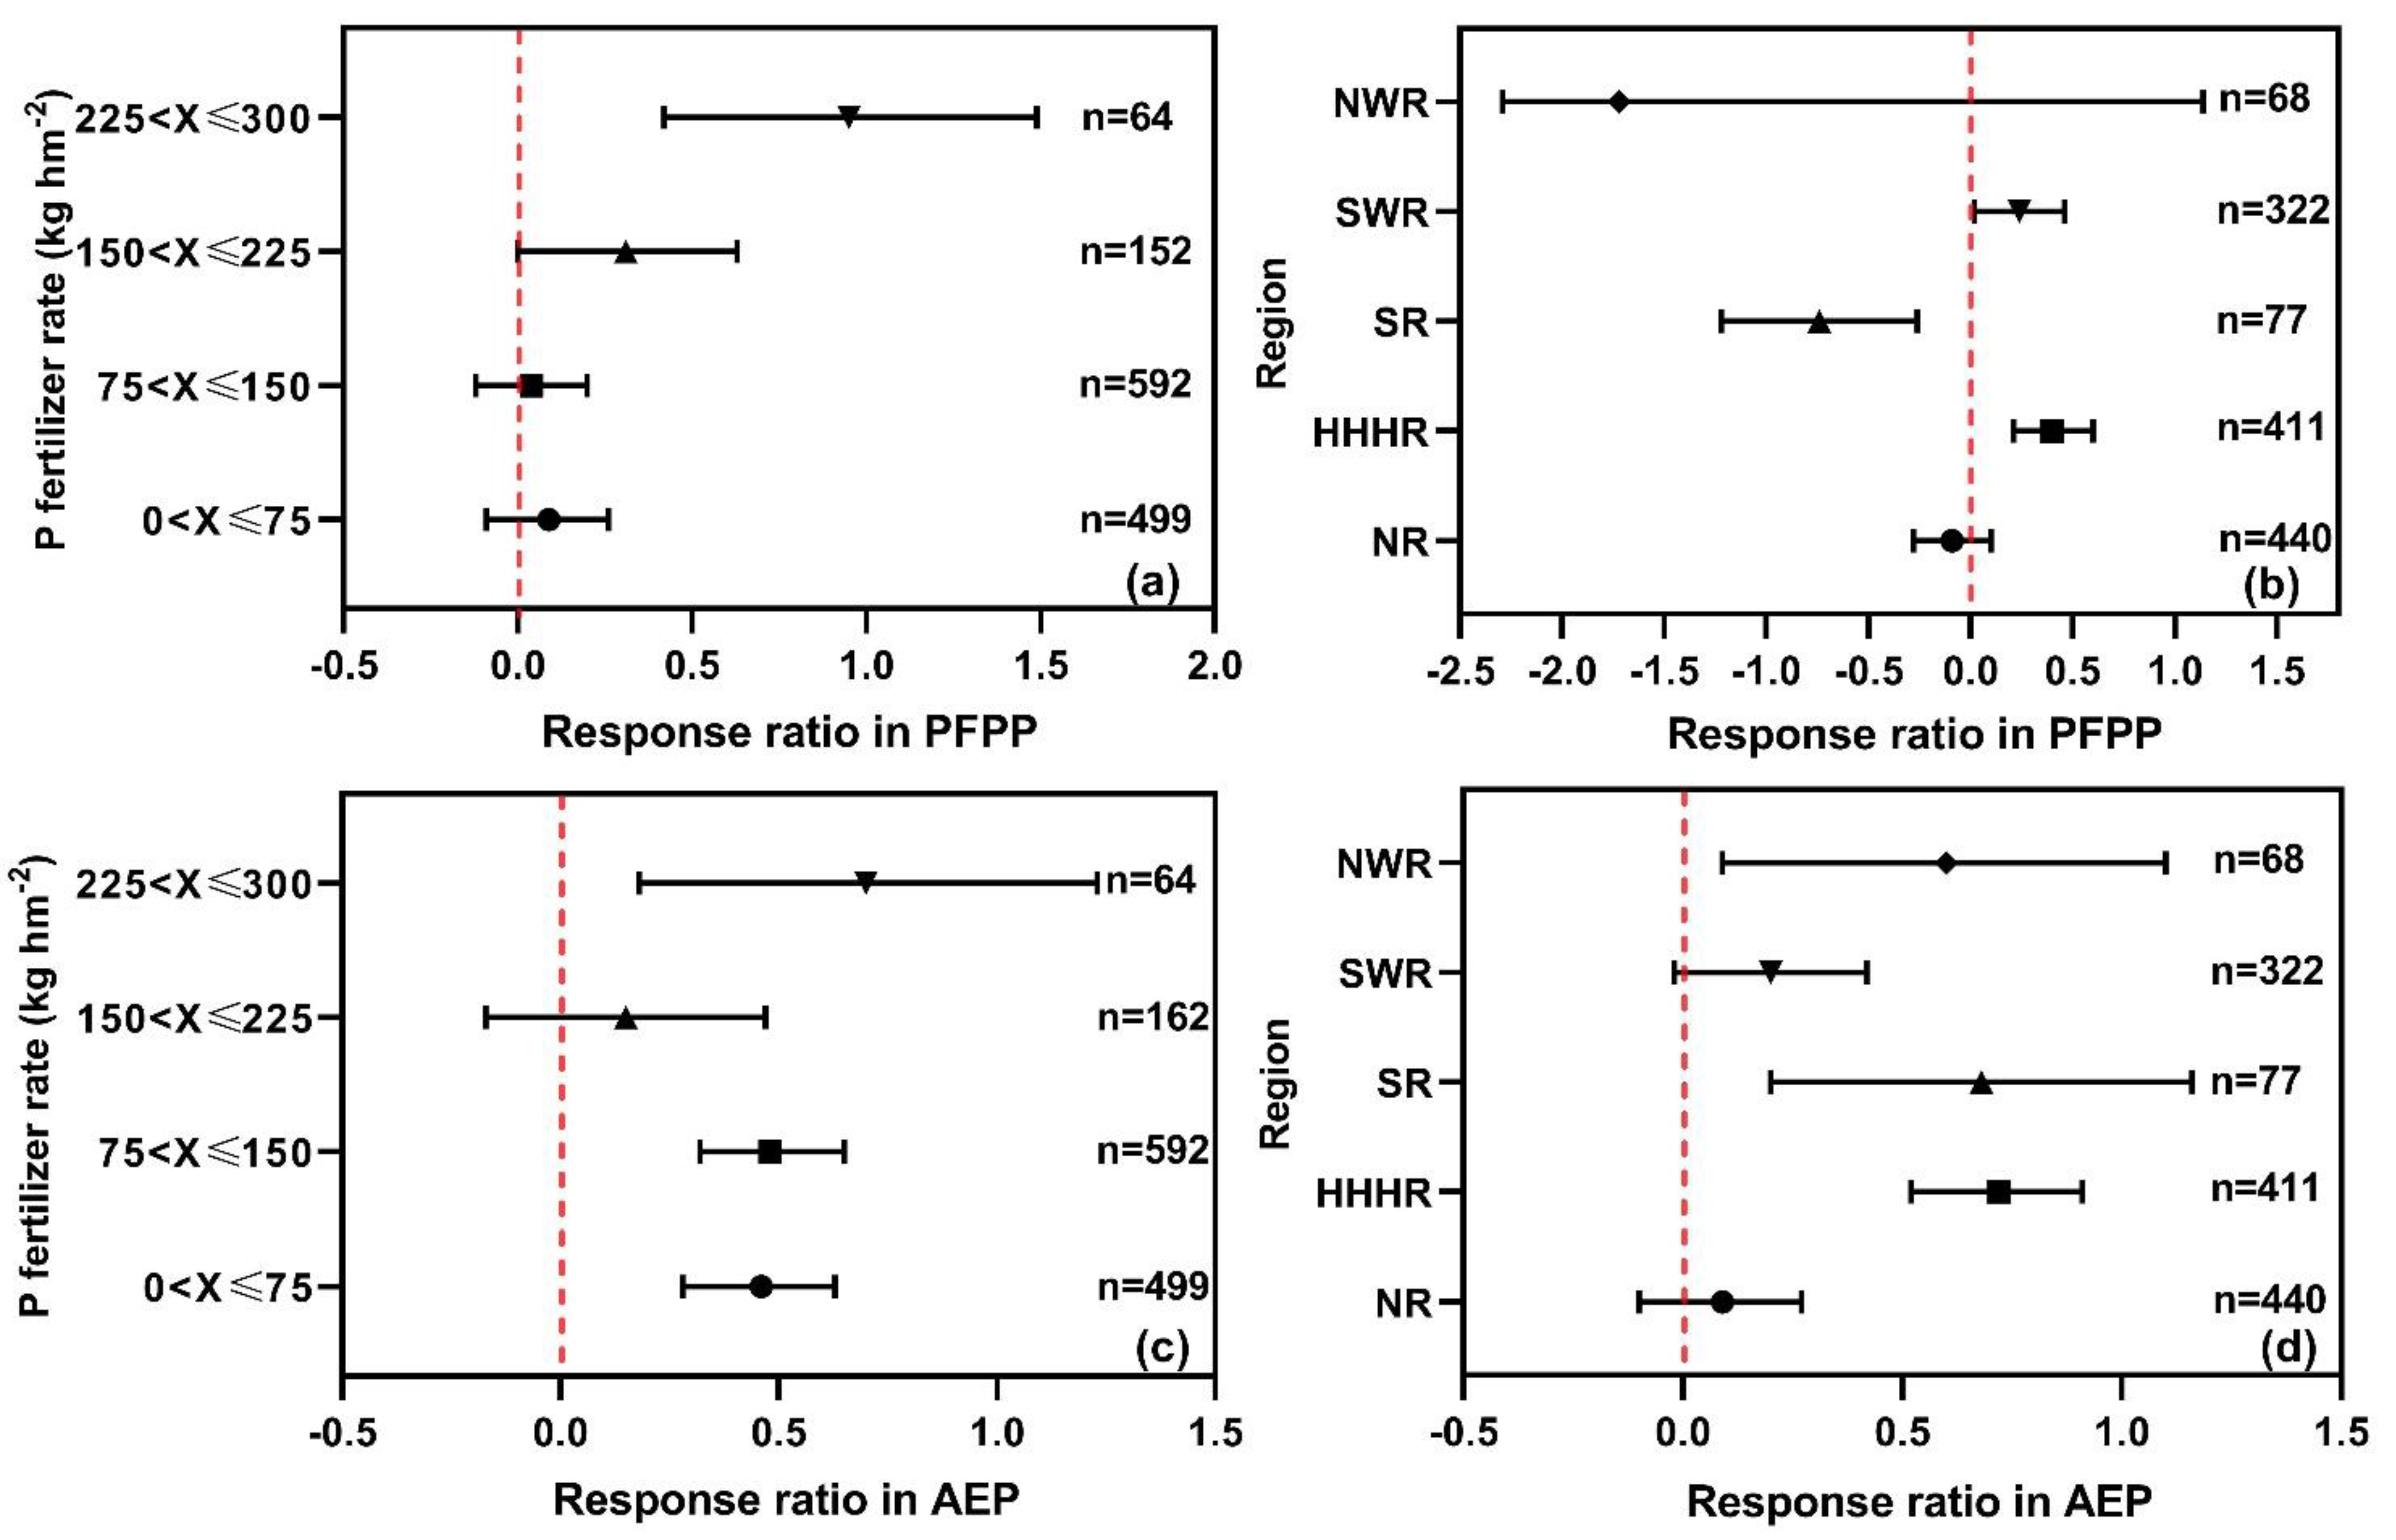
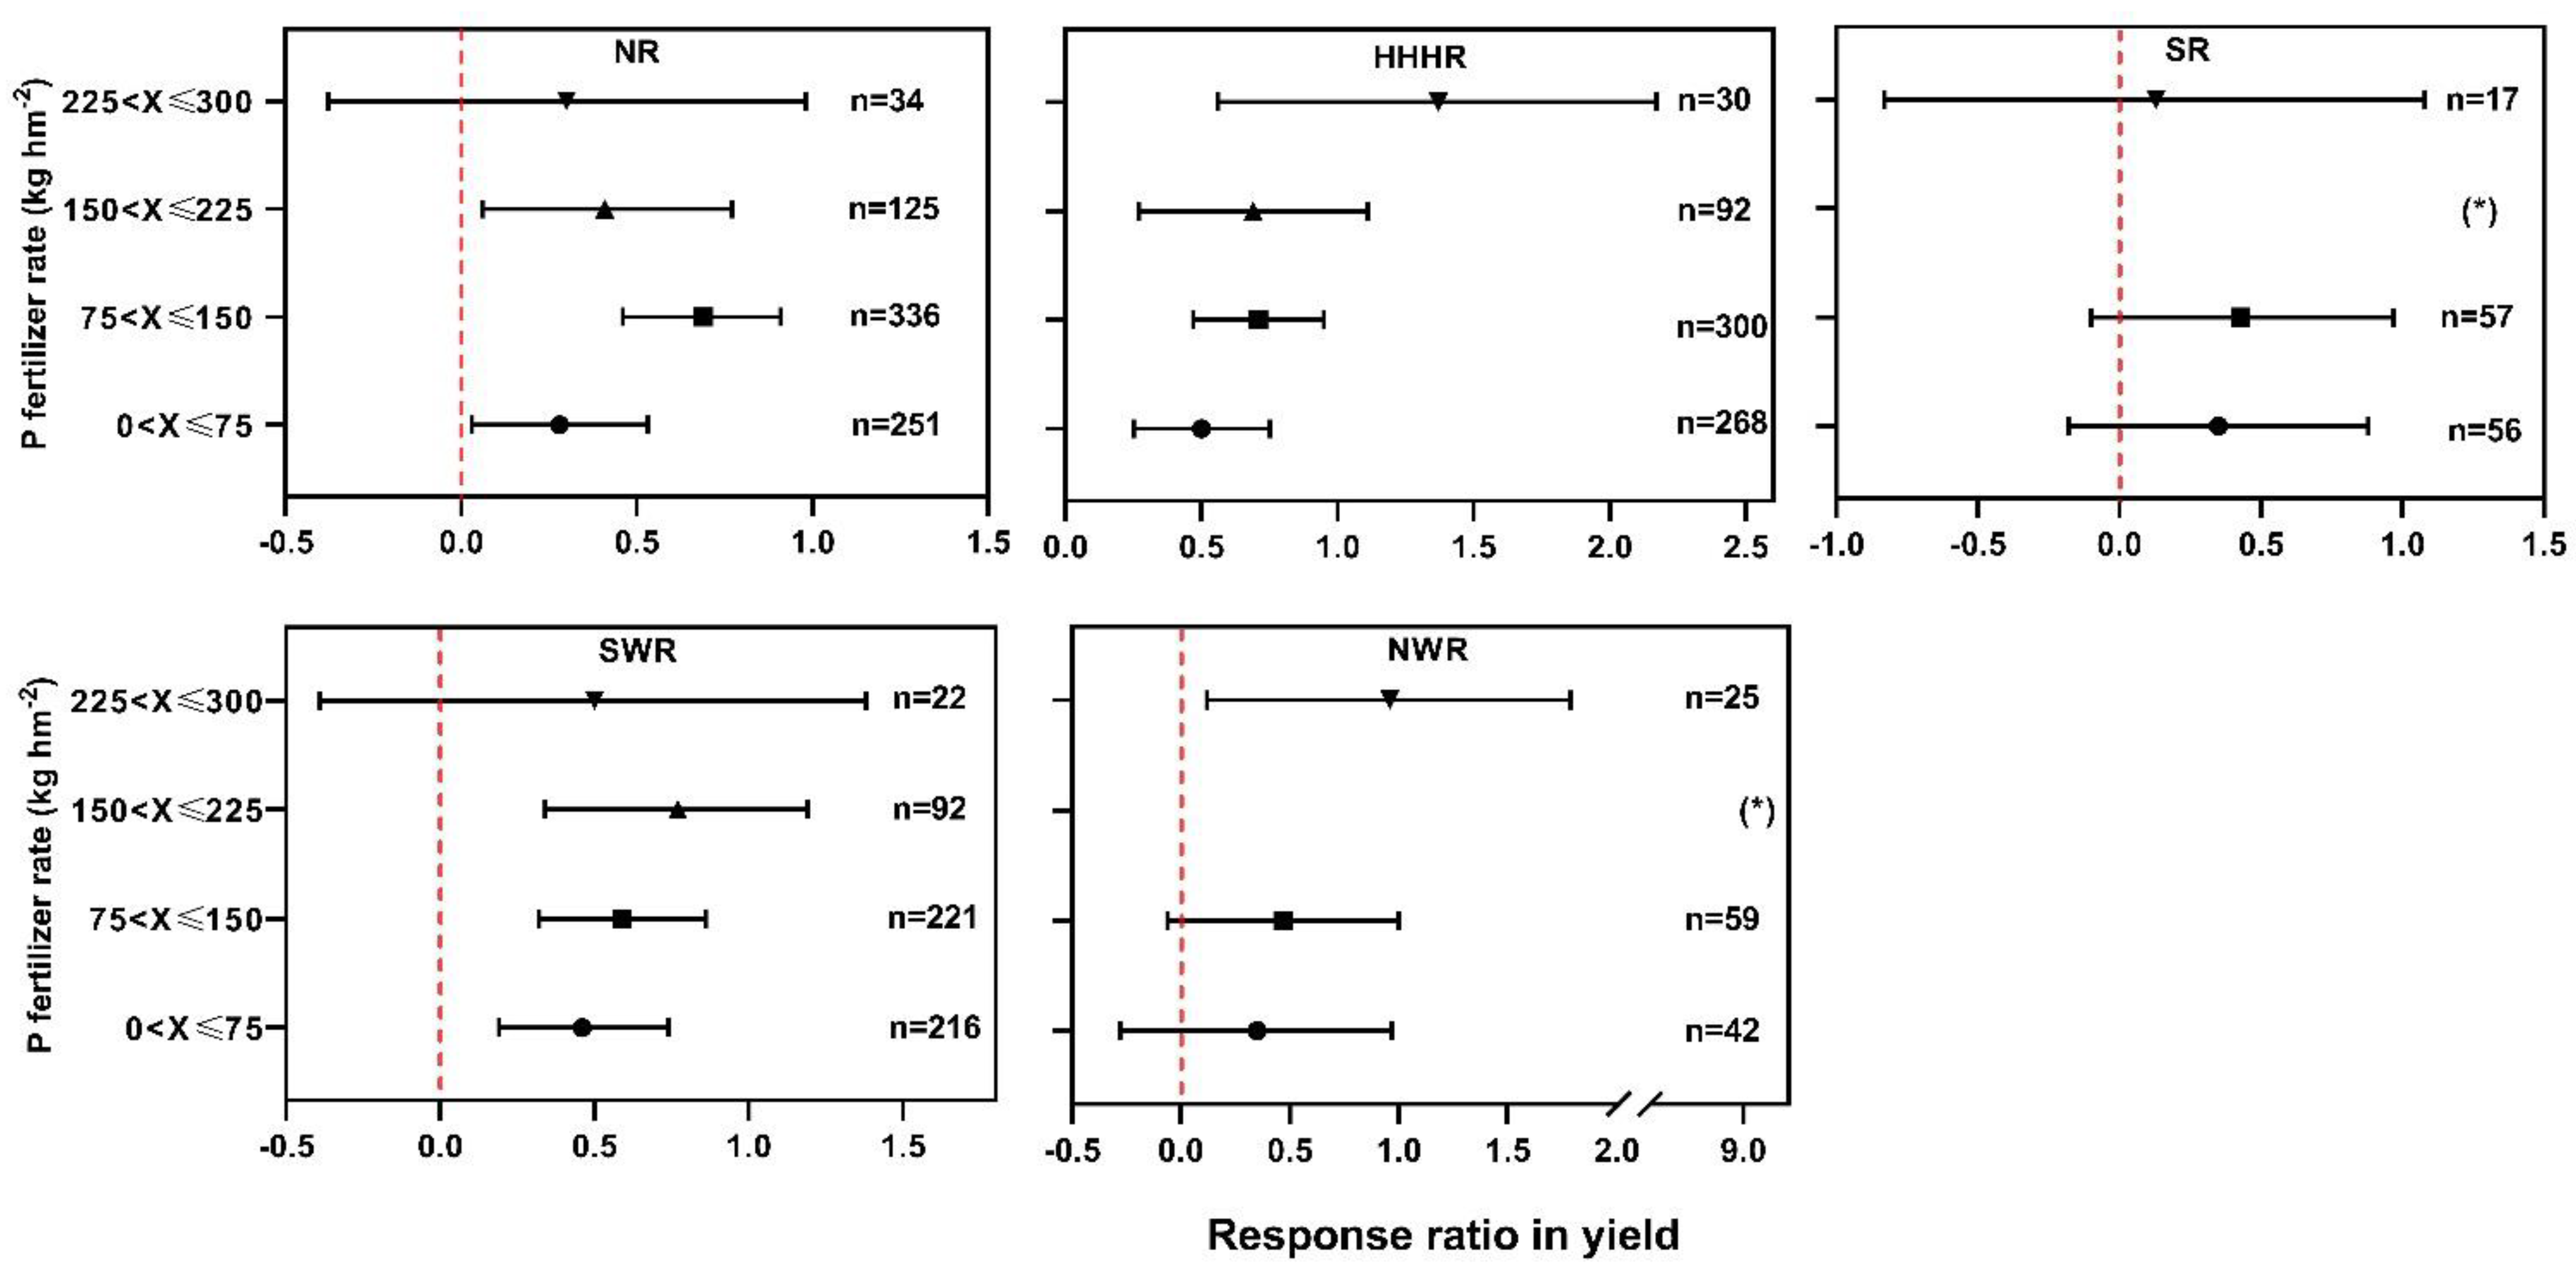
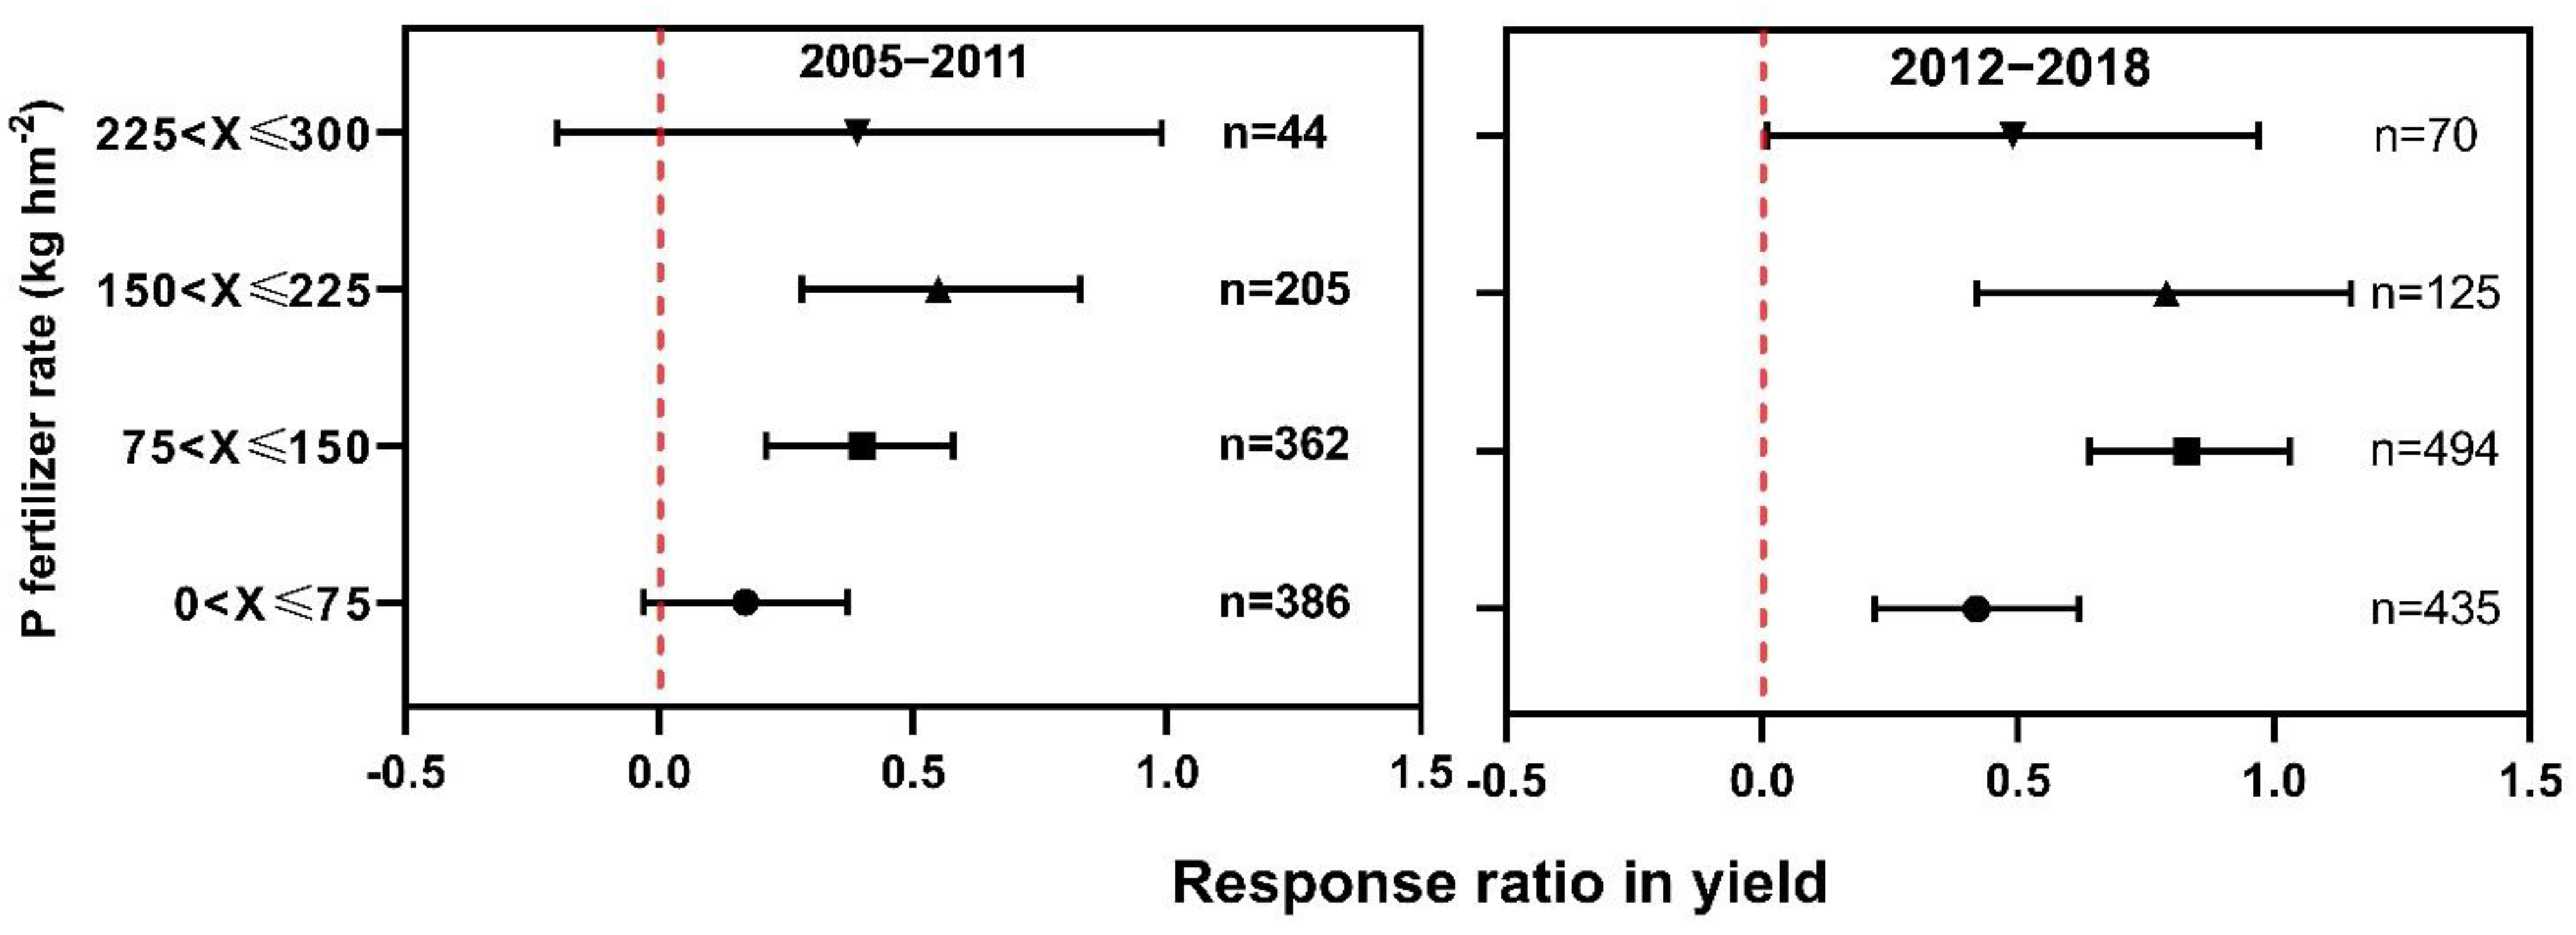
3.2. The Effects of P Fertilization Levels on Maize Yield and the FUE of P Fertilizers

The application of P fertilizer significantly increased maize yield, especially from 2012 to 2018 (Figure 6a,b). As compared to the “no P” condition, low P application rates (0–75 kg ha−1) increased maize yield by an average of 32.31%, 64.87%, 41.91%, 58.41%, and 41.91% in the NR, HHHR, SR, SWR, and NWR, respectively, whereas moderate P application rates (75–150 kg ha−1) increased maize yield by an average of 99.37%, 103.40%, 53.73%, 80.40%, and 60.00% (see Figure 7). High P application rates (150–225 kg ha−1) increased maize yield by an average of 50.68, 99.37, and 115.98% in the NR, HHHR, and SWR, respectively (data unavailable for the SR and NWR). Extremely high P application rates (225–300 kg ha−1) increased maize yield by an average of 34.99%, 293.54%, 13.88%, 64.87%, and 161.17% in the NR, HHHR, SR, SWR, and NWR. It may be observed that yield enhancement because of P fertilization was especially substantial in the HHHR and SWR. Maize yield also responded positively to P fertilization in both periods (2005–2011 and 2012–2018) (Figure 8). The average increases in maize yield because of low, medium, high, and extremely high P fertilization levels (relative to the “no P” condition) were 18.53%, 49.18%, 73.33%, and 47.70% in 2005–2011, and 52.20%, 129.33%, 120.34%, and 63.23% in 2012–2018, respectively. Hence, the increase in yield because of P fertilization was significantly greater in 2012–2018 than in 2005–2011.
In Figure 9, it is shown that the partial factor productivity of P (PFPP) and agronomic efficiency of P (AEP) responded positively to the 2012–2018 period, as compared to the 2005–2011 period. From 2005–2011 to 2012–2018, the average PFPP of the low, medium, high, and extremely high P fertilization levels increased by 9.42%, 4.08%, 36.34%, and 158.57%, whereas their average AEP improved by 58.41%, 61.61%, 16.18%, and 101.38%, respectively. From 2005–2011 to 2012–2018, the average PFPP values of the NR, SR, and NWR decreased by 8.61%, 52.29%, and 82.09%, whereas the average PFPP values of the HHHR and SWR regions increased by 49.18% and 27.12%, respectively. The AEPs of all growing regions responded positively to the 2012–2018 period, as their average 2012–2018 AEPs increased by 9.42% (NR), 105.44% (HHHR), 97.39% (SR), 22.14% (SWR), and 82.21% (NWR) compared to the 2005–2011 levels.

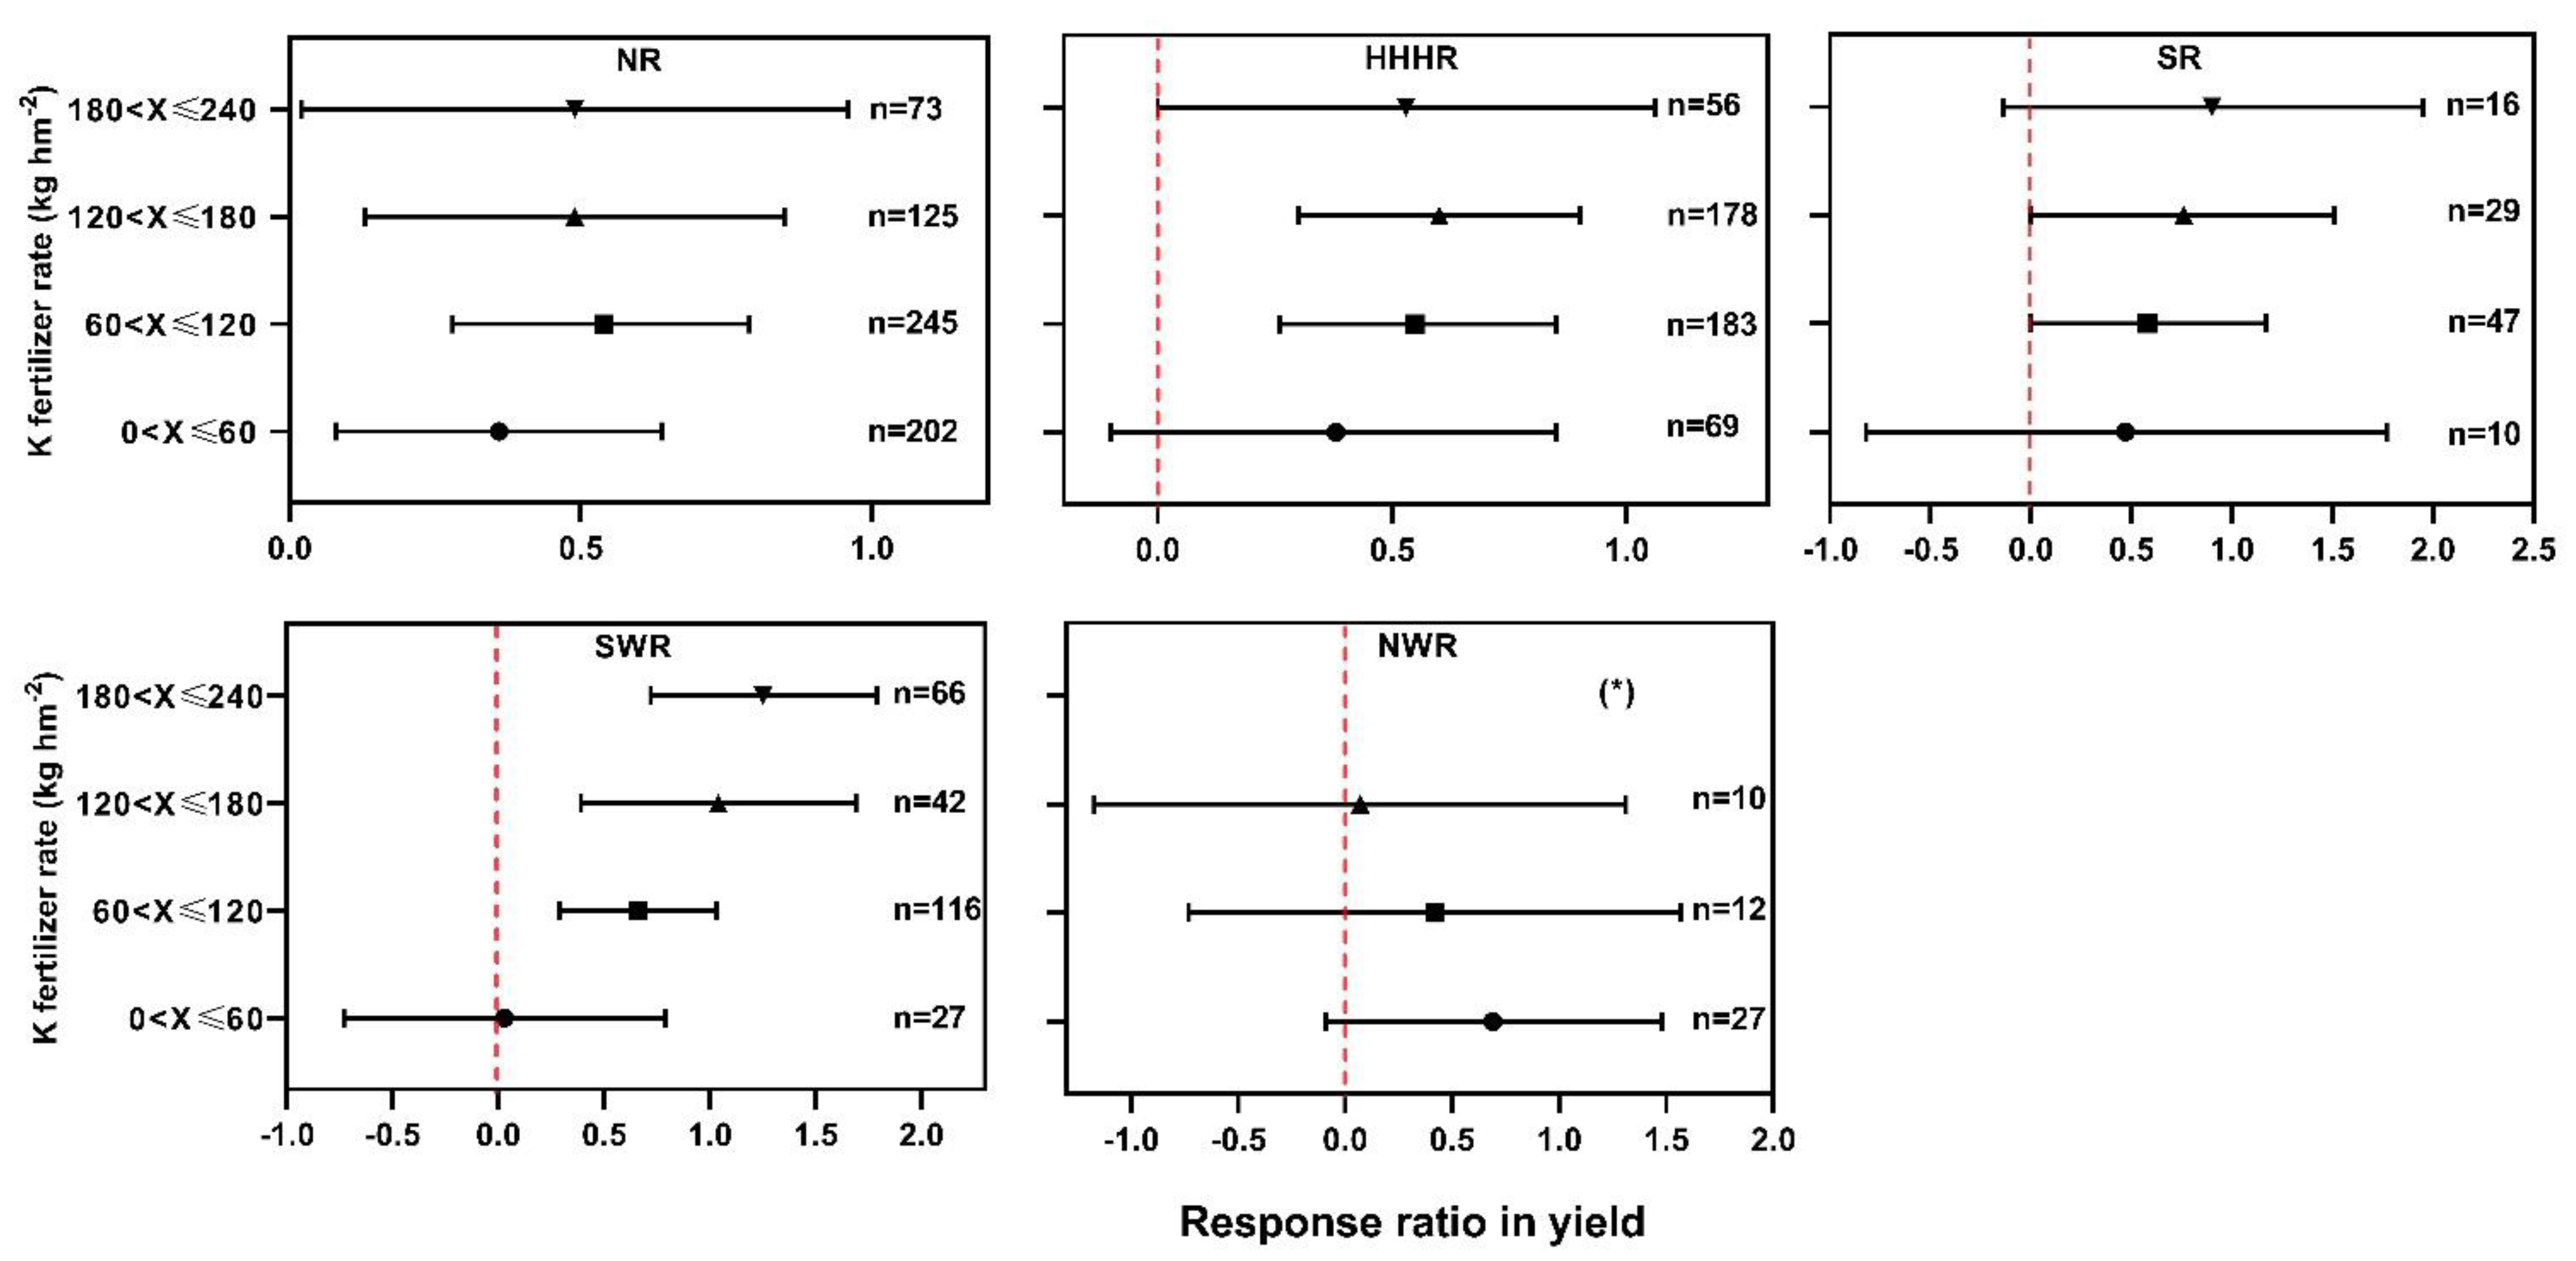
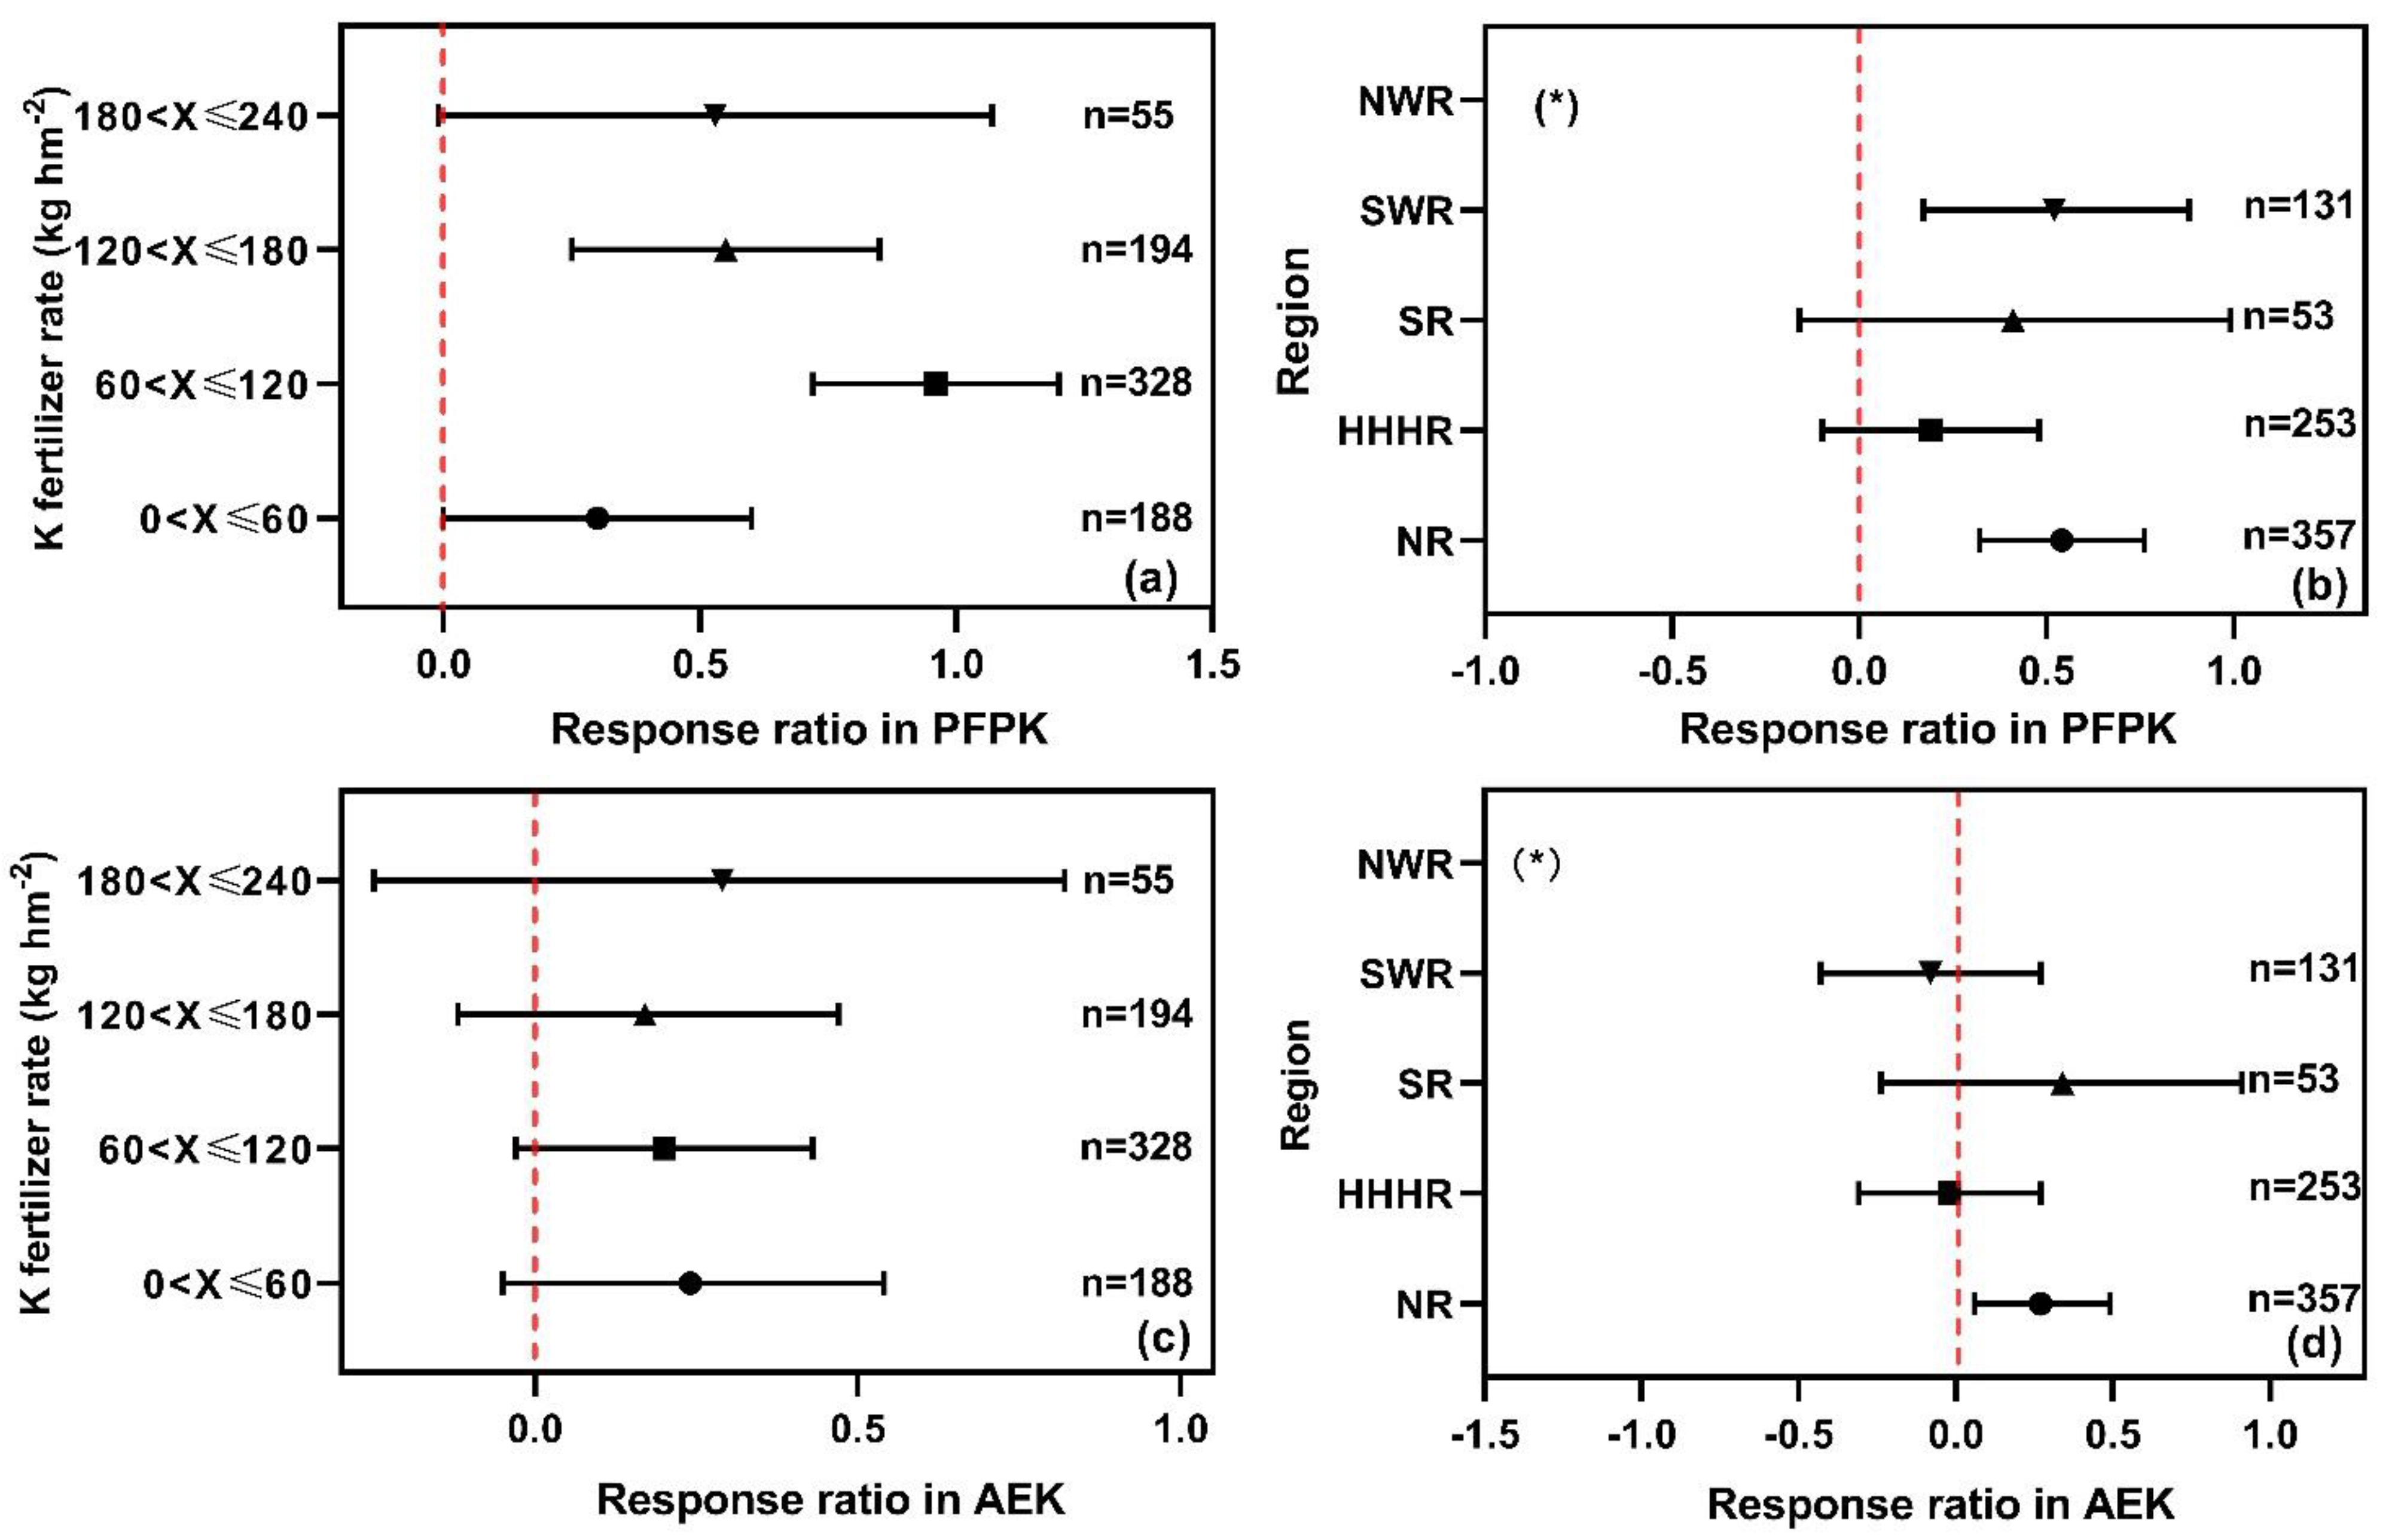
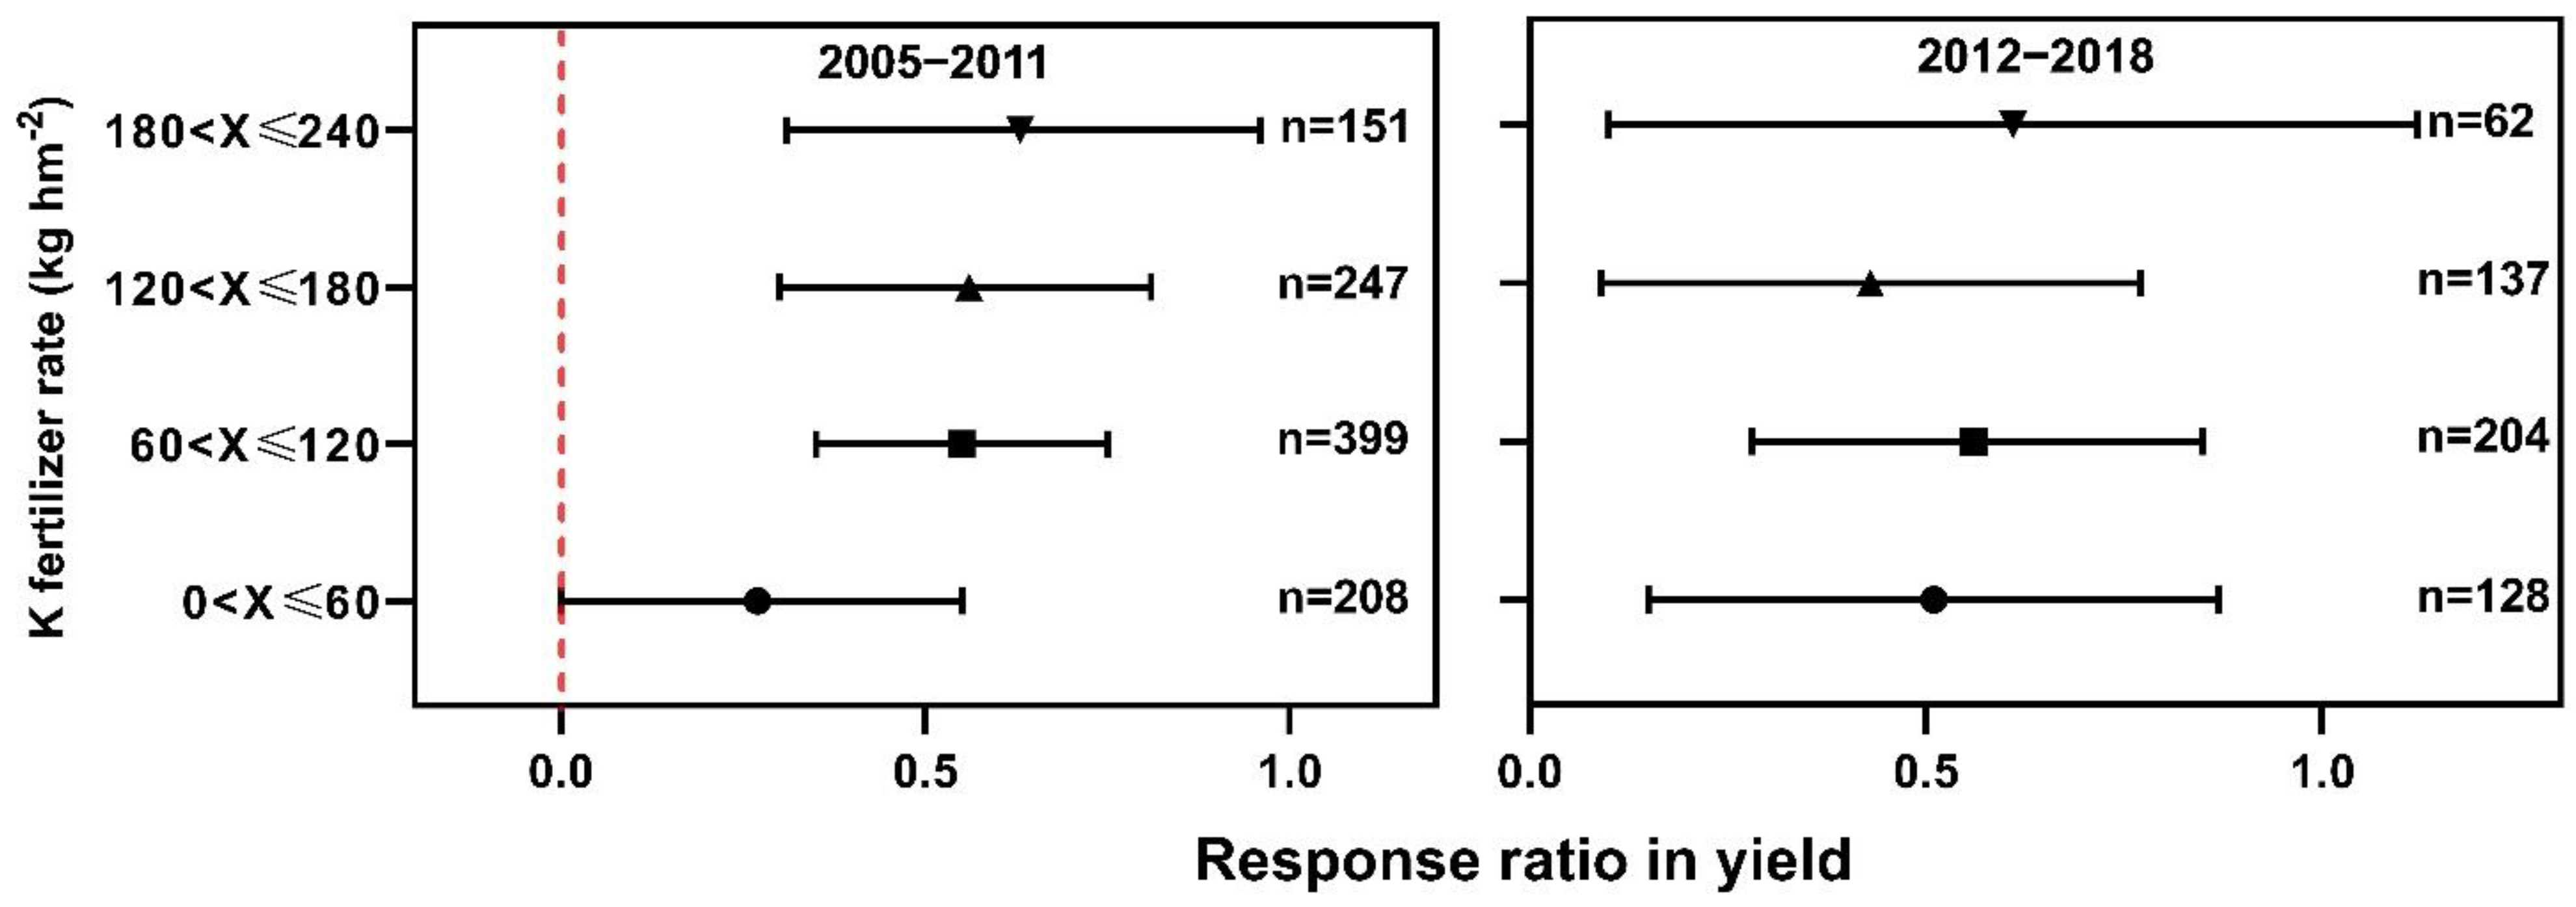
3.3. The Effects of K Fertilization Level on Maize Yields and the FUE of K Fertilizers

The level of K fertilization had significant effects on maize yield (Figure 10a,b). As shown in Figure 11, low K application rates (0–60 kg ha−1) increased maize yields in the NR, HHHR, SR, SWT, and NWR by an average of 43.33%, 46.23%, 60.00%, 3.04%, and 99.37%, respectively, as compared to the “no K” condition; medium K application rates (60–120 kg ha−1) increased average maize yields by 71.60%, 73.32%, 78.60%, 98.48%, and 52.20%; high K application rates (120–180 kg ha−1) increased the average maize yields by 63.23%, 82.21%, 113.838%, 182.92%, and 7.25%. Extremely high K application rates (180–240 kg ha−1) increased the average maize yields by 63.23% (NR), 69.89% (HHHR), 145.96% (SR), and 249.03% (SWR) (no data on the NWR). The effects of high and extremely high K fertilization levels on maize yields were especially pronounced in the SR and SWR. Maize yields responded positively to K fertilization in all years (Figure 12). The increases in average yield because of low, medium, high, and extremely high K fertilization levels (compared to the “no K” condition) were 31.00%, 73.33%, 75.07%, and 87.76% in 2005–2011, and 66.53%, 75.07%, 53.73%, and 84.04% in 2012–2018.
As shown in Figure 13, the partial productivity factor of K (PFPK) and agronomic efficiency of K (AEK) responded positively to the 2012–2018 period, compared to the 2005–2011 period. From 2005–2011 to 2012–2018, the PFPKs of the low, medium, high, and extremely high K fertilization levels increased by 34.99%, 161.17%, 73.33%, and 69.89%, whereas their AEKs increased by 27.12%, 22.14%, 18.53%, and 33.64%, respectively. This positive response in PFPK was observed in all maize-growing regions, and the PFPKs of the NR, HHHR, SR, and SWR in 2012–2018 increased by 71.60%, 20.92%, 50.68%, and 68.20%, respectively, compared to their 2005–2011 values. From 2005–2011 to 2012–2018, the AEKs of the NR and SR increased by 31.00% and 40.49%, but the AEKs of the HHHR and SR decreased by 1.98% and 7.69%, respectively.

3.4. Potential Yield Enhancements and Emission Reductions via the Variation of Chemical Fertilization Rates

From 2010 to 2018, the maize yields of China increased steadily while the carbon footprint decreased because of the chemical fertilizer usage decreased over time (Figure 14). These changes were mainly caused by decreases in N and P application rates. In the NR, HHHR, SR, SWR, and NWR, the application of pure N decreased by 23.41%, 37.32%, 34.73%, 20.84%, and 13.13% in 2018 compared to 2010 levels, and the use of P2O5 also decreased by 69.80%, 62.55%, 33.33%, 41.43%, and 71.60% in these regions. The changes in K2O application varied from one region to another; as compared to 2010 levels, K2O application rates decreased slightly in the NR, HHHR, and SR but increased in the SWR and NWR in 2018. In modern maize production, P and K fertilizers should be used to increase yield, whereas N fertilizer usage should be decreased to reduce GHG emissions. Scenario analyses were performed to gauge the increases in maize yield and reductions in GHG emissions that could be obtained by varying N, P, and K application rates (Figure 14). In terms of emission reductions, it is predicted that the region-averaged carbon footprint per unit area of maize in Scenarios 3 and 4 will be lower than that in Scenario 1 by 9.74% and 10.00% by 2025, respectively. The emission reductions did not vary substantially from one region to another (Figure 14f–j). The response of maize yield to changes in fertilization varies from one region to another (Figure 14a–e). By 2025, the per unit area maize yields of Scenarios 2, 3, and 4 are expected to be higher than those of Scenario 1 by 0.81%, 5.74%, and 4.12% in the NR and 0.16%, 2.58%, and 2.26% in the SWR, respectively. In the HHHR, Scenarios 3 and 4 are expected to increase per unit area maize yield by 1.63% and 1.40%, respectively, as compared to those of Scenario 1. Scenario 3 should increase yields in the SR. Yields in the NWR will increase in Scenario 4.

4. Discussion

4.1. Response of Maize Yield to Chemical Fertilization in Each Geographic Region

The provision of adequate nutrients to crops through fertilization is important for maintaining high and stable crop yields and ensure food security across the globe [5]. The yield-enhancing effects of chemical fertilizers have accounted for 50% of all crop yield in modern agriculture [20]. By analyzing the data regarding the effects N, P, and K fertilizers on maize yields in China over the past 15 years, it was revealed that chemical fertilization has played an important role in improving maize yields.
The effects of fertilization on yield varied significantly from one region to another, because of differences in their climatic characteristics, soil conditions, and farming practices. It was found that N fertilization had the greatest effect on yields in the SR; yields in the NR and SR were most effectively enhanced by “medium” and “extremely high” levels of N fertilization, respectively (Figure 3). The yield-enhancing effects of P fertilization were most significant in the HHHR and SWR (Figure 7), whereas K fertilization was most effective in the SR and SWR (Figure 11). In the SWR, which includes the Yunnan, Sichuan, Chongqing, and Guizhou provinces, crops usually ripen twice a year, and the soils of this region are comparatively infertile. Therefore, the impact of fertilization on yields in this region is significantly greater than that in other maize-growing regions [21]. The climate in northwest China is dry and arid, which results in low N leaching rates and high N-fertilizer-use efficiency (Figure 2) [22]. In the south of China (including the southeast and southwest regions), rainfall is frequent and intense (Table 1), and the K ions in the soil are easily leached to lower soil layers. Because of the low concentration of K ions in the cultivation layer, this region is most sensitive to K fertilization [23]. In the SR and SWR, maize yield increased with increasing K fertilization (Figure 11c,d); in other regions, yields decreased at high K fertilization levels (Figure 11a,b,e). Due to the low soil available P in the HHHR, maize yields in this region are sensitive to P fertilization (Table 1). In the NR, maize is a perennial crop, and soils are highly fertile in this region. As a result, the response of maize yields to fertilization is relatively weak in the NR. In practice, fertilization should be managed according to the characteristics of each maize-growing region and their cropping patterns, and a general fertilization formula should be formulated for each region, with minor adjustments at the site-specific level [3].

4.2. Response of Maize Yield and FUE to Vary Chemical Fertilization Levels in Different Periods

The effects of chemical fertilization on maize yields have been somewhat different over the last 7 years (2012–2018) than in the 7 years prior (2005–2011). This may have been caused by the fertilization practices moving away from previous tendencies to heavily applying N fertilizers with little P and K fertilization [3,24]. With the exception of the “extremely high” (225–337.5 kg ha−1) level of N fertilization, the effects of N fertilization on yields were less pronounced in 2012–2018 than in 2005–2011 (Figure 4). PFPN was also slightly lower in 2012–2018 than in 2005–2011 (Figure 5a). However, AEN was higher in 2012–2018 than in 2005–2011 (Figure 5b). These outcomes may have been caused by decreases in soil N fertility compared to that in the past, the promotion of high-yield maize cultivars, and improved cultivation practices [25,26,27]; these changes have also led to significant increases in AEN. The yield-enhancing effects (Figure 8 and Figure 13) and FUE (Figure 9 and Figure 14) of P and K fertilizers were generally higher in 2012–2018 than in 2005–2011. This indicates that a significant amount of research has been performed on the potential yield-enhancing effects of P and K fertilizers, and that these studies have had a practical impact on the agricultural sector. It is also a sign that fertilization practices are changing in China.
The effects of N, P, and K fertilization levels on yields and FUE in each maize-growing region are somewhat different between the 2005–2011 and 2012–2018 periods. The NR, HHHR, and SWR are the three largest maize-growing regions in China; together, they account for more than 80% of the total maize production in China [28]. The FUE (PFP and AE) of the NR were higher in 2012–2018 than in 2005–2011. Other than PFPN and AEK, the FUE of the HHHR were generally higher in 2012–2018 than in 2005–2011, and the increase in PFPP and AEP in the HHHR was the highest between the five maize-growing regions. Because the soils of the SWR are relatively infertile, fertilization has the potential to significantly enhance its maize yields. The FUE of N, P, and K fertilizers in the SWR were generally higher in 2012–2018 than in 2005–2011, and the increase in AEN in the SWR was the highest between the five maize-growing regions. In the SR and NR, the FUE of N fertilizers (PFPN and AEN) were lower in 2012–2018 than in 2005–2011, but their K and P fertilizer FUE were higher in the later period.

4.3. Potential for Maize Yield Enhancement and GHG Emission Reduction in China

Since the 20th century, there has been widespread concern about global warming and its environmental consequences in the international community [9], and the GHG emissions caused by food production account for a significant proportion of global carbon emissions [10]. China is a very important agricultural country for the global agricultural sector. In the past, the intensity of chemical fertilization increased very rapidly in China; Liu [29] specifically said “the fertilizer intensity in 2014 was nearly 4 times as large as in 1980”. Although yields have increased, this practice also led to massive GHG emissions [30]. The mitigation of the detrimental effects is due to food production-induced GHG emissions [10,13].
From 2005 to 2018, the per unit area carbon footprint of maize from N, P, and K fertilization has decreased steadily in China, in spite of increasing maize yields (Figure 14). This suggests that China has made significant progress in increasing maize yields and reducing GHG emissions. These improvements may be attributed to the introduction of more nutrient-efficient maize cultivars and advances in cultivation techniques. Deng [30] found that the use of soil testing-based formulaic fertilization has reduced the carbon emission of each unit of maize yield in Hebei, Henan, and Sichuan. Wang [31] observed that GHG emissions could be reduced without compromising maize yields by combining plastic mulching with techniques to reduce N fertilization. A study in the SWR showed that the cultivation of N-efficient maize varieties could reduce N application rates by 20% while maintaining yield [32]. In the NR and HHHR, a study revealed that drip irrigation and P fertilization-coupled irrigation could improve PFPP and AEP [33,34]. Irrigation coupled with K fertilization also improves the FUE of K fertilizers in maize [35]. Our scenario analyses have found that the maize production sector of China still has room for improvement in terms of maize yields and GHG emissions (Figure 14). Because fertilization responses vary from one region to another, it is necessary to formulate fertilization schemes based on the fertilization needs of each maize-growing region. Over the past 15 years, N, P, and K application rates have been highest in the NR, followed by the SWR, SR, NR, and lastly, the HHHR. Based on the average fertilization rates of each region in the 2015–2018 period, reducing N application rates by 10% while increasing or decreasing K and P application rates by 10% will significantly increase yields and decrease GHG emissions in the NR, HHHR, and SWR by 2025. In the SR, the optimal scheme for increasing yields and reducing emissions requires a reduction in N fertilization and appropriate increases in P and K application rates. Because of excess fertilization in the NWR, reducing N, P, and K application rates will reduce per unit area carbon emissions and still increase yield.

5. Conclusions

The maize-growing regions of China generally exhibit region-dependent FUE and yield responses to each type and level of fertilization. Compared to the past, the FUE of maize production in China has improved significantly. Appropriate reductions of N, P, and K application rates may reduce the per unit area carbon footprint of maize production without reducing yield. This also shows that the maize production sector of China still has much room for improvement in terms of GHG emission reductions. To reduce GHG emissions and stabilized maize yields in each unit area of maize production, N application rates should be reduced by 10% from current levels in all regions, whereas P and K application rates should be increased or decreased according to the requirements of each region. By promoting nutrient-efficient maize cultivars, improving cultivation practices, reducing chemical fertilizer inputs, and increasing FUE, it will be possible to develop the agricultural sector in a low-carbon and efficient manner in the future.

Author Contributions

F.K.: Conceptualization, Software, Data curation, Writing—original draft, Writing—review and editing. Y.W.: Writing, Data curation, Writing—original draft, S.C.: Data curation, Writing—review and editing. X.W.: Data curation. Writing—original draft. G.W.: Data curation. Writing—original draft. Q.L.: Data curation. Writing—original draft. T.L.: Data curation. F.L.: Data curation. B.Z.: Software. D.F.: Data curation. J.Y.: Conceptualization, Writing—review and editing. All authors have read and agreed to the published version of the manuscript.

Funding

This work was supported by the National Key Technologies Research and Development Program of China ( Grant No. 2018YFD0301206, Grant No. 2016YFD0300209, Grant No. 2016YFD0300307, and Grant No. 2017YFD0301704).

Institutional Review Board Statement

Not applicable.

Informed Consent Statement

Not applicable.

Data Availability Statement

The data presented in this study are available.

Conflicts of Interest

The authors declare no conflict of interest.

References

  1. Xu, Z.; Li, C.J.; Zhang, C.C.; Yu, Y.; van der Werf, W.; Zhang, F.S. Intercropping maize and soybean increases efficiency of land and fertilizer nitrogen use; A meta-analysis. Field Crop Res. 2020, 246, 107661. [Google Scholar] [CrossRef]
  2. Good, A.G.; Shrawat, A.K.; Muench, D.G. Can less yield more? Is reducing nutrient input into the environment compatible with maintaining crop production? Trends Plant Sci. 2004, 9, 597–605. [Google Scholar] [CrossRef] [PubMed]
  3. Wu, L.Q.; Wu, L.; Cui, Z.L.; Chen, X.P.; Zhang, F.S. Basic NPK fertilizer recommendation and fertilizer formula for maize production regions in China. Acta Pedol. Sin. 2015, 52, 802–817. (In Chinese) [Google Scholar] [CrossRef]
  4. Du, Y.D.; Cui, B.B.; Zhang, Q.; Wang, Z.; Sun, J.; Niu, W.Q. Effects of manure fertilizer on crop yield and soil properties in China: A meta-analysis. Catena 2020, 193, 104617. [Google Scholar] [CrossRef]
  5. Liu, X.J.; Zhang, Y.; Han, W.X.; Tang, A.H.; Shen, J.J.; Cui, Z.L.; Vitousek, P.; Erisman, J.W.; Goulding, K.; Christie, P.; et al. Enhanced nitrogen deposition over China. Nature 2013, 494, 459–462. [Google Scholar] [CrossRef]
  6. Zhang, Z.J.; Shi, X.; Ling, T. Influencing factors and empirical test of spatial variation of fertilizer application intensity in China. J. Shanxi Agric. Univ. 2022, 21, 10–19. (In Chinese) [Google Scholar]
  7. Zhou, M.H.; Zhu, B.; Wang, S.J.; Zhu, X.Y.; Vereecken, H.; Brüggemann, N. Stimulation of N2O emission by manure application to agricultural soils may largely offset carbon benefits: A global meta-analysis. Glob. Chang. Biol. 2017, 23, 4068–4083. [Google Scholar] [CrossRef]
  8. Lv, F.L.; Song, J.S.; Giltrap, D.; Feng, Y.T.; Yang, X.Y.; Zhang, S.L. Crop yield and N2O emission affected by long-term organic manure substitution fertilizer under winter wheat-summer maize cropping system. Sci. Total Environ. 2020, 732, 139321. [Google Scholar] [CrossRef]
  9. Perkins, R. Farming and global warming. Vet. Rec. 2019, 185, 542–543. [Google Scholar] [CrossRef]
  10. Zhang, D.; Shen, J.B.; Zhang, F.S.; Li, Y.E.; Zhang, W.F. Carbon footprint of grain production in China. Sci. Rep. 2017, 7, 4126. [Google Scholar] [CrossRef] [Green Version]
  11. Wang, Y.Q.; Pu, C.; Zhao, X.; Wang, X.; Liu, S.L.; Zhang, H.L. Historical dynamics and future trends of carbon footprint of wheat and maize in China. Resour. Sci. 2018, 40, 1800–1811. (In Chinese) [Google Scholar] [CrossRef]
  12. Makowski, D.; Piraux, F.; Brun, F. Basic concepts in meta-analysis. In From Experimental Network to Meta-Analysis: Methods and Applications with R for Agronomic and Environmental Sciences; Springer: Dordrecht, The Netherlands, 2019; pp. 105–126. [Google Scholar]
  13. Wang, L.L.; Coulter, J.A.; Li, L.L.; Luo, Z.Z.; Chen, Y.L.; Deng, X.P.; Xie, J.H. Plastic mulching reduces nitrogen footprint of food crops in China: A meta-analysis. Sci. Total Environ. 2020, 748, 141479. [Google Scholar] [CrossRef] [PubMed]
  14. Hou, P.; Liu, Y.E.; Liu, W.M.; Liu, G.Z.; Xie, R.Z.; Wang, K.R.; Ming, B.; Wang, Y.H.; Zhao, R.L.; Zhang, W.J.; et al. How to increase maize production without extra nitrogen input. Resour. Conserv. Recycl. 2020, 160, 104913. [Google Scholar] [CrossRef]
  15. Liu, W.M.; Hou, P.; Liu, G.Z.; Yang, Y.S.; Guo, X.X.; Ming, B.; Xie, R.Z.; Wang, K.R.; Liu, Y.E.; Li, S.K. Contribution of total dry matter and harvest index to maize grain yield—A multisource data analysis. Food Energy Secur. 2020, 9, e256. [Google Scholar] [CrossRef]
  16. Chuan, L.M.; He, P.; Zhao, T.K.; Zheng, H.G.; Xu, X.X. Agronomic characteristics related to grain yield and nutrient use efficiency for wheat production in China. PLoS ONE 2016, 11, e162802. [Google Scholar] [CrossRef] [Green Version]
  17. van Groenigen, K.J.; Osenberg, C.W.; Hungate, B.A. Increased soil emissions of potent greenhouse gases under increased atmospheric CO2. Nature 2011, 475, 214–216. [Google Scholar] [CrossRef]
  18. Hedges, L.V.; Gurevitch, J.; Curtis, S.P. The meta-analysis of response ratios in experimental ecology. Ecology 1999, 80, 1150–1156. [Google Scholar] [CrossRef]
  19. PDNDRC. The Prices Division of National Development and Reform Commission. In National Compilation of Agricultural Cost Information Returns; China Statistics Press: Beijing, China, 2006–2019. Available online: http://jgrz.ndrc.gov.cn/(In Chinese). (accessed on 20 October 2020). (In Chinese)
  20. Huang, Y.; Sun, W.J. Changes of soil organic carbon content in farmland in mainland China in recent 20 years. Chin. Sci. Bull. 2006, 51, 750–763. [Google Scholar] [CrossRef]
  21. Zhu, M.K.; Yang, S.Q.; Ai, S.H.; Ai, X.Y.; Jiang, X.; Chen, J.; Li, R.R.; Ai, Y.W. Artificial soil nutrient, aggregate stability and soil quality index of restored cut slopes along altitude gradient in southwest China. Chemosphere 2020, 246, 125687. [Google Scholar] [CrossRef]
  22. Gu, W.T.; Jin, W.J.; Yang, T.L.W.; Liu, R.Y.; Li, W.J.; Dong, X.C. Distribution characteristics of soil nutrients and salt content of Northwest Arid Region in China—Taking the industrial park in Gansu as an example. Chin. Agric. Sci. Bull. 2015, 31, 212–215. Available online: http://www.casb.org.cn (accessed on 15 October 2020). (In Chinese).
  23. Zhou, L.H.; Huang, J.; Wang, B.R.; Li, D.C.; Liu, K.L.; Han, T.F.; Zhang, H.M. Response of acidifing red soil to liming in potassium leaching in South China. Acta Pedol. Sin. 2020, 57, 457–467. (In Chinese) [Google Scholar] [CrossRef]
  24. Kong, X.B. China must protect high-quality arable land. Nature 2014, 506, 7. [Google Scholar] [CrossRef]
  25. Zhang, W.F.; Ma, L.; Huang, G.Q.; Wu, L.; Chen, X.P.; Zhang, F.S. The development and contribution of nitrogenous fertilizer in China and challenges faced by the country. Sci. Agric. Sin. 2013, 46, 3161–3171. (In Chinese) [Google Scholar] [CrossRef]
  26. Han, J.N.; Wang, L.F.; Zheng, H.Y.; Pan, X.Y.; Li, H.Y.; Chen, F.J.; Li, X.X. ZD958 is a low-nitrogen-efficient maize hybrid at the seedling stage among five maize and two teosinte lines. Planta 2015, 242, 935–949. [Google Scholar] [CrossRef]
  27. Yang, Y.S.; Xu, W.J.; Hou, P.; Liu, G.Z.; Liu, W.M.; Wang, Y.H.; Zhao, R.L.; Ming, B.; Xie, R.Z.; Wang, K.R.; et al. Improving maize grain yield by matching maize growth and solar radiation. Sci. Rep. 2019, 9, 3635. [Google Scholar] [CrossRef] [PubMed] [Green Version]
  28. Zhao, Q.Y.; Xu, S.J.; Zhang, W.S.; Zhang, Z.; Yao, Z.; Chen, X.P.; Zou, C.Q. Spatial regional variability and influential factors of soil fertilities in the major regions of maize production of China. Sci. Agric. Sin. 2020, 53, 3120–3133. (In Chinese) [Google Scholar] [CrossRef]
  29. Liu, Q.P. Spatio-temporal changes of fertilization intensity and environmental safety thresh-old in China. Trans. Chin. Soc. Agric. Eng. 2017, 33, 214–221. [Google Scholar]
  30. Deng, M.J.; Deng, J.J.; Liu, J.Y. On the space-time evolution of carbon emissions and reduction potential in Chinese grain crop fertilizer application. Resour. Sci. 2016, 38, 534–544. (In Chinese) [Google Scholar] [CrossRef]
  31. Wang, C.; Zang, H.D.; Liu, J.G.; Shi, X.Y.; Li, S.; Chen, F.; Chu, Q.Q. Optimum nitrogen rate to maintain sustainable potato production and improve nitrogen use efficiency at a regional scale in China. A meta-analysis. Agron. Sustain. Dev. 2020, 40, 37. [Google Scholar] [CrossRef]
  32. Li, Q.; Kong, F.L.; Wu, Y.W.; Feng, D.J.; Yuan, J.C. Increasing nitrogen accumulation and reducing nitrogen loss with N-efficient maize cultivars. Plant Prod. Sci. 2020, 23, 260–269. [Google Scholar] [CrossRef] [Green Version]
  33. Huang, Y.; Cao, G.J.; Geng, Y.H.; Han, Y.Y. Effects of precipitation and phosphorus application rate on yield and phosphorus absorption and utilization of maize in black soil region. J. Maize Sci. 2018, 26, 142–148. (In Chinese) [Google Scholar] [CrossRef]
  34. Li, G.; Bai, Y.L.; Yang, L.P.; Lu, Y.L.; Wang, L.L.; Zhang, J.J.; Zhang, Y.J. Effect of drip fertigation on summer maize in North China. Sci. Agric. Sin. 2019, 52, 1930–1941. [Google Scholar]
  35. Guo, Y.Q.; Zhang, J.W.; Liu, K.; Zhu, Y.L.; Pei, S.J.; Dong, S.T.; Liu, P.; Zhao, B. Effects of water-potassium interaction on yield and potassium utilization of high-yield summer maize. J. Soil Water Conserv. 2016, 30, 267–271. (In Chinese) [Google Scholar] [CrossRef]
Figure 1. The locations of the five maize-growing regions of China. NR: Northern region; HHHR: Huang-Huai-Hai region; SR: Southern region; SWR: Southwestern region; NWR: Northwestern region. The triangles represent the locations of the trials that were included in the meta-analysis. The data were sourced from the China Knowledge Resource Integrated Database (https://www.cnki.net/old/ (accessed on 10-20 October 2020)) and Web of Science (http://www.apps.webofknowledge.com/ (accessed on 23 October 2020)) regarding studies that were conducted between 2005 and 2018.
Agronomy 12 03005 g001
Figure 2. Relationship between maize yield and N fertilization levels in two periods (a,b) and comparisons between the PFPN (c,d) and AEN (e,f) of the five maize-growing regions in China. NR: Northern region; HHHR: Huang–Huai–Hai region; SR: Southern region; SWR: Southwestern region; NWR: Northwestern region. The black dashed line and red dashed line indicate the median and quartiles, respectively. ** and **** represent significance levels of p < 0.01 and p < 0.0001, respectively, and the absence of significance-level markings between any pair of regions indicates that their differences were non-significant.
Agronomy 12 03005 g002
Figure 3. The effects of N fertilization levels on maize yield in each geographic region. NR: Northern region; HHHR: Huang–Huai–Hai region; SR: Southern region; SWR: Southwestern region; NWR: Northwestern region. The error lines indicate the 95th percentile bootstrap confidence intervals. The n values represent the corresponding number of observations (total number of control and treatment values). Yield with N fertilization is a treatment value, whereas yield without N is a control value.
Agronomy 12 03005 g003
Figure 4. The effects of N fertilization levels on maize yield in different periods. (a) 2005–2011, (b) 2012–2018. The error lines indicate the 95th percentile bootstrap confidence intervals, whereas n values indicate the corresponding number of observations (total number of control and treatment values). Yield with N fertilization is a treatment value, whereas yield without N fertilization is a control value.
Agronomy 12 03005 g004
Figure 5. The effects of the period (2012–2018 versus 2005–2011) on maize PFPN and AEN at each N fertilization level (a,c) and in each region (b,d). NR: Northern region; HHHR: Huang-Huai-Hai region; SR: Southern region; SWR: Southwest region; NWR: Northwest region; PFPN: partial factor productivity of N; AEN: agronomic efficiency of N. The error lines indicate the 95th percentile bootstrap confidence intervals, whereas the n values indicate the corresponding number of observations (total number of control and treatment values). The PFPN and AEN values of the 2012–2018 period were the treatment values, whereas the PFPN and AEN values of the 2005–2011 period were the control values.
Agronomy 12 03005 g005
Figure 6. Relationship between maize yield and P fertilization levels in different years (a,b), and the comparison between the PFPP (c,d) and AEP (e,f) of five maize-growing regions in China. NR: Northern region; HHHR: Huang−Huai−Hai region; SR: Southern region; SWR: Southwestern region; NWR: Northwestern region. The black dashed lines and red dashed lines indicate the median and quartiles, respectively. **, ***, and **** represent significance levels of p < 0.01, p < 0.001, and p < 0.0001, respectively, and the absence of significance-level markings between any pair of regions indicates that their differences were non-significant.
Agronomy 12 03005 g006
Figure 7. The effect of P fertilization levels on maize yield in each geographic region. NR: Northern region; HHHR: Huang−Huai−Hai region; SR: Southern region; SWR: Southwestern region; NWR: Northwestern region. The error lines indicate the 95th percentile bootstrap confidence intervals, whereas n values represent the corresponding number of observations (total number of control and treatment values). (*) indicates that a subgroup has an n lower than nine. Yield with P fertilization is a treatment value, whereas yield without P fertilization is a control value.
Agronomy 12 03005 g007
Figure 8. The effects of P fertilization levels on maize yield in different periods. The error lines indicate the 95th percentile bootstrap confidence intervals, whereas n values indicate the corresponding number of observations (total number of control and treatment values). Yield with P fertilization is a treatment value, whereas yield without P fertilization is a control value.
Agronomy 12 03005 g008
Figure 9. The effects of period (2012−2018 versus 2005−2011) on maize PFPP and AEP at each P fertilization level (a,c), in each region (b,d). NR: Northern region; HHHR: Huang-Huai-Hai region; SR: Southern region; SWR: Southwest region; NWR: Northwest region; PFPP: partial factor productivity of P; AEP: agronomic efficiency of P. The error lines indicate the 95th percentile bootstrap confidence intervals, whereas n values indicate the corresponding number of observations (total number of control and treatment values). The PFPP and AEP values of the 2012–2018 period were the treatment values, and the PFPP and AEP values of the 2005–2011 period were the control values.
Agronomy 12 03005 g009
Figure 10. Relationship between maize yield and K fertilization levels in different years (a,b), and comparison between the PFPK (c,d) and AEK (e,f) of five maize-growing regions in China. NR: Northern region; HHHR: Huang-Huai-Hai region; SR: Southern region; SWR: Southwestern region; NWR: Northwestern region. The black dashed lines and red dashed lines indicate the median and quartiles, respectively. *, **, *** and **** represent significance levels of p < 0.05, p < 0.01, p < 0.001, and p < 0.0001, respectively, and an absence of significance-level markings between any pair of regions indicates that their differences were non-significant.
Agronomy 12 03005 g010
Figure 11. The effects of K fertilization levels on maize yield in each geographic region. NR: Northern region; HHHR: Huang−Huai−Hai region; SR: Southern region; SWR: Southwestern region; NWR: Northwestern region. The error lines indicate the 95th percentile bootstrap confidence intervals. n values indicate the corresponding number of observations (total number of control and treatment values). (*) indicates that a subgroup has an n value lower than nine. Yield with K fertilization is a treatment value, whereas yield without K fertilization is a control value.
Agronomy 12 03005 g011
Figure 12. The effects of K fertilization levels on maize yield in different periods. The error lines indicate the 95th percentile bootstrap confidence intervals, while n values indicate the corresponding number of observations (total number of control and treatment values). Yield with K fertilization is a treatment value, while yield without K fertilization is a control value.
Agronomy 12 03005 g012
Figure 13. The effects of period (2012−2018 versus 2005−2011) on maize PFPK and AEK at each K fertilization level (a,c), in each region (b,d). NR: Northern region; HHHR: Huang−Huai−Hai region; SR: Southern region; SWR: Southwest region; NWR: Northwest region; PFPK: partial factor productivity of K; AEK: agronomic efficiency of K. The error lines indicate the 95th percentile bootstrap confidence intervals, whereas n values indicate the corresponding number of observations (total number of control and treatment values). The PFPK and AEK values of the 2012–2018 period were the treatment values, whereas the PFPK and AEK values of the 2005–2011 period were the control values. * means PFPK and AEK analyses were not performed due to insufficient samples.
Agronomy 12 03005 g013
Figure 14. The per carbon footprints (ae) and unit area yields (fj) of each maize−growing region in China from 2005 to 2018, and the projections of the scenario analyses. NR: Northern region; HHHR: Huang−Huai−Hai region; SR: Southern region; SWR: Southwest region; NWR: Northwest region. Scenario 1: No change in N, P, and K fertilization rates. Scenario 2: No change in N application rates and 10% increase in P and K application rates. Scenario 3: A 10% decrease in N application rates and 10% increase in P and K application rates. Scenario 4: A 10% decrease in N, P, and K application rates.
Agronomy 12 03005 g014
Table 1. Sowing period, harvest period, meteorological conditions, and soil properties of each maize-growing region in China. The data were sourced from the China Knowledge Resource Integrated Database (https://www.cnki.net/old/ (accessed on 25 October 2020)) and Web of Science (http://www.apps.webofknowledge.com/ (accessed on 25 October 2020)) regarding studies that were conducted between 2005 and 2018.
Northern
Region
Huang-Huai-Hai
Region
Southern
Region
Southwest
Region
Northwest
Region
Sowing dateEarly April to mid-MayLate April to mid-JuneMid-March to early April orLate March to early JuneMid-April to early May
late June to early August
Harvest periodMid-September to mid-OctoberLate September to mid-JuneEarly July to late July or mid-Late July to early October Late September to mid-October
September to late October
Average annual temperature (°C)-1.2–12.67.0–15.414.8–22.811.3–19.03.7–9.0
Average annual precipitation (mm)168–1120307–1000995–1554739–1378104–208
≥10 °C accumulated temperature (°C)1500–34993000–42004500–84133752–58652824–3795
Average annual sunshine hours (h)922–30281285–29001968–30241000–25002710–3230
Frost free period (days)123–212149–299125–212215–317130–201
Available N (mg kg−1)20.5–237.513.8–174.016.3–134.014.5–167.017.1–159.0
Available P (mg kg−1)6.6–202.85.5–84.25.8–101.82.2–97.51.4–61.3
Available K (mg kg−1)52.0–235.019.7–254.029.5–244.043.6–254.452.3–354.0
Organic matter (g kg−1)7.3–34.46.9–37.76.8–33.43.2–67.05.3–43.9
pH4.6–8.75.8–8.84.5–7.84.5–8.67.2–8.9
Publisher’s Note: MDPI stays neutral with regard to jurisdictional claims in published maps and institutional affiliations.

