Article

Nitrogen Application Alleviates the Adverse Effects of Defoliation Stress on Lolium perenne L. by Enhancing the Antioxidant System and Promoting Photosynthesis

School of Grassland Science, Beijing Forestry University, Beijing 100083, China
*
Author to whom correspondence should be addressed.
Agronomy 2022, 12(11), 2902; https://doi.org/10.3390/agronomy12112902
Submission received: 15 October 2022 / Revised: 8 November 2022 / Accepted: 18 November 2022 / Published: 20 November 2022
(This article belongs to the Special Issue Abiotic Stress Tolerance in Grasses)

Abstract

:
Perennial grasses undergo compensatory growth after defoliation. Nitrate is the main nitrogen source for the growth of perennial ryegrass and plays a significant role in plant resistance to stress. The aim of the study was to understand the physiological mechanism of ryegrass in response to defoliation stress under different nitrate supplies and to explore possible ways to alleviate defoliation stress. We performed pot experiments where 12-week-old ryegrass plants grown in low (0.05 mM KNO3) or moderate nitrate (5 mM KNO3) conditions were defoliated and subsequently supplied with different concentrations of nitrate following defoliation treatments. During the regrowth stage, the regrowth rate, biomass, photosynthetic parameters, and the response of the antioxidant system to low or moderate nitrate supply of ryegrass were investigated. The results showed that moderate nitrate supply after defoliation increased the content of photosynthetic pigments in ryegrass and improved its photosynthetic efficiency. In addition, adding moderate nitrate after defoliation increased the activity of antioxidant enzymes and the accumulation of osmotic regulating substances, thereby enhancing plant resistance, effectively reducing the damage to plants caused by defoliation stress, and promoting plant regrowth, especially for plants grown in a low nitrate environment before defoliation. Therefore, this study showed that the addition of exogenous nitrate could counteract some of the adverse effects of defoliation stress on the growth and development of ryegrass.

1. Introduction

Perennial ryegrass (Lolium perenne) is one of the most important grasses in temperate regions of the world, which is widely used in pastures due to its easy establishment and high nutritional value [1]. Defoliation and grazing are important management methods for perennial grassland ecosystems, affecting grassland productivity, forage quality, and livestock growth and production. Forage grass undergoes compensatory growth after grazing or mowing to adapt to severe and frequent defoliation [2]. Since defoliation causes mechanical stress to plant leaves, triggering extravasation of cytosol from the defoliation part and an imbalance in the water balance of the plant, plants produce a series of morpho-physiological adjustments after defoliation in response to the removal of leaf and stem tissues [3]. Studies have shown that perennial forage grasses improve stress resistance by activating their own antioxidant enzyme defense system and osmotic regulation [4]. However, in perennial ryegrass, little is known about whether leaf defoliation elicits an antioxidant response of the defense system in perennial ryegrass.
Defoliation leads to the loss of meristem of grass plants, reduces the photosynthesis of plants, and makes the carbon required by plant growth and regrowth unable to be satisfied [5]. To provide the necessary energy, ryegrass mobilizes carbohydrate reserves from the sheath and leaf base to maintain leaf regrowth [6,7,8]. During early regrowth, the photosynthetic capacity of perennial ryegrass was temporarily impaired, the nitrate low-affinity and high-affinity uptake rate was reduced, and the expression of LpNRT2.1 encoding nitrate transport protein was significantly downregulated in response to defoliation [6].
Nitrogen is an essential nutrient for plant growth and development [9]. Grass regrowth is dependent on two nitrogen sources, the reserve nitrogen previously absorbed in the stubble and roots (endogenous nitrogen) and the mineral nitrogen absorbed from the soil (exogenous) [10]. The supply of nutrients in the soil is directly related to the photosynthesis of plant leaves [11]. Nitrogen can stimulate leaf growth by participating in the synthesis of proteins regarding cell growth, cell division, cell wall and the cytoskeleton [12], thereby increasing the photosynthetic area. With the increase in nitrogen supply, the mature leaf area and specific leaf weight (SLW) of crops such as maize (Zea mays) and sugarcane (Saccharum officinarum) increased significantly [13,14]. Studies have shown that under nitrogen-deficient conditions at 0.75 mM N, perennial ryegrass biomass, nitrogen content and photosynthetic pigment content were reduced, and crude protein synthesis was hindered [15,16]. Chlorophyll fluorescence, as a powerful tool for monitoring leaf photochemical efficiency, is also closely related to various reactions during photosynthesis [11,17,18]. The appropriate nitrogen application for rice (Oryza sativa) was 168.16 kg ha−1 [11]. At this time, the contents of photosynthetic pigments in rice were increased, and the photochemical efficiency of PSII, quantum yield (Fv/Fm) and the electron transport rate were improved, thereby improving photosynthetic efficiency and yield [11,19].
Nitrogen supply is closely linked to the formation of reactive oxygen species (ROS) and oxidative stress in plants. Compared with plants grown in low nitrogen conditions (2.5 kg N ha−1), the MDA content, superoxide dismutase (SOD), ascorbate peroxidase (APX) and guaiacol peroxidase (POD) in creeping bentgrass (Agrostis stolonifera) under high-nitrogen condition (7.5 kg N ha−1) were increased in response to heat stress [20]. In addition, nitrogen fertilizer enhanced the antioxidant defense systems of wheat (Triticum aestivum), soybean (Glycine max), sorghum (Sorghum bicolor), oat (Avena sativa) and other plants under salt stress, effectively protecting their growth from salinity damage [21,22,23,24,25,26,27].
The plant regrowth stage is critical for perennial pastures. In order to make plants recover quickly under defoliation stress and increase yield, stress-alleviating ways should be developed. Our previous studies focused on the relationship between carbon and nitrogen stored in plant remaining stubble and plant regrowth [6,7]. However, the defense system response of plants under defoliation stress and whether nitrogen plays a role in the mitigation of defoliation stress remain unknown. Therefore, the objectives of the proposed research were to investigate the different physiological responses of perennial ryegrass grown in low-nitrogen (0.05 mM KNO3) and moderate-nitrogen (5 mM KNO3) concentrations after defoliation, and the effects of different concentrations of nitrate addition after defoliation on the regrowth, photosynthesis, and antioxidant system of perennial ryegrass, so as to explore possible defoliation stress mitigation mechanisms to provide a basis for the defoliation tolerance of perennial ryegrass.

2. Materials and Methods

2.1. Plant Material and Culture

Perennial ryegrass (L. perenne L. ‘Grasslands Nui’) seeds were sown in individual plastic pots (length, width and height of pots are each 10 cm) filled with unfertilized sand (1 plant per pot) and watered with half-strength N-free Hoagland nutrition solution at a pH of 6.0 and an electrical conductivity of 1300 µS cm−1 in an artificial climate incubator. Air temperatures were maintained at 25 °C (day)/20 °C (night), 16-h photoperiod with 500 μmol·m−2·s−1 light intensity and a constant relative humidity of 70% every day.

2.2. N and Defoliation Treatment

N treatment was started 5 days after perennial ryegrass had germinated. During the treatment period, perennial ryegrass was watered with 30 mL of water on the second day and 30 mL of half-strength Hoagland solution with a pH of 6.0 and an electrical conductivity of 1300 µS cm−1 of 0.05 mM (low nitrogen, LN) or 5 mM KNO3 (moderate nitrogen, MN) as sole N source on the fourth day, and KCl was added to the low N solution to equalize K+ concentrations thereby maintaining intracellular osmotic pressure balance between treatments. Four-day watering was one nitrogen treatment cycle. After the plants were grown for 12 weeks, plants grown in low-nitrogen (LN) and moderate-nitrogen (MN) conditions were randomly divided into 3 groups with 24 pots in each group, and different treatments were performed respectively (Figure 1). For plants grown in the LN condition, we randomly selected 2 groups of them and defoliated the ryegrass 4.5 cm above the soil surface. One group was supplemented with 30 mL of half-strength Hoagland solution of 0.05 mM KNO3 every two days (LN-Defoliation-LN), and the other group was administered 30 mL of half-strength Hoagland solution of 5 mM KNO3 every two days (LN-Defoliation-MN). The remaining non-defoliated group of plants continued to receive 30 mL of the same nutrient solution as before (LN-Intact-LN). For plants grown in the MN condition, we also randomly selected 2 groups of them for defoliation treatment. After defoliation, we selected 1 group to supplement 30 mL of half-strength Hoagland solution of 0.05 mM KNO3 every 2 days (MN-defoliation-LN), the other group to supplement 30 mL of half-strength Hoagland solution of 5 mM KNO3 every 2 days (MN-defoliation-MN), and for the remaining non-defoliated plant group, we continued to irrigate 30 mL of the same nutrient solution as before (MN-Intact-MN). The defoliation time is defined as the time 0 of this experiment. Subsequently, perennial ryegrass root, stubble (0–4.5 cm above the ground), and leaf (4.5 cm above the ground) tissues were harvested in liquid nitrogen before and 2, 5, 10, and 17 days after defoliation, rapidly frozen and stored at −80 °C. Six independent plants subjected to each of the treatments were pooled as 1 biological replicate for further analysis. At least 3 biological replicates were performed.

2.3. Plant Regrowth, Biomass, Nitrate Uptake Rate and Nitrogen Contents

Plant height, defined as the distance from the soil surface to the top of the uppermost leaf blade, was measured every day after defoliation. The growth rate of the plant was defined as the height of the plant regrowth per hour from the time 0 of the experiment after defoliation. The leaf width and tiller number were measured 1 day before and 17 days after defoliation. The aboveground and belowground biomass of individual plants was harvested on the 17th day. Then we brought them to the laboratory for oven drying at 70 °C to a constant weight, with three biological replicates of 6 independent plants in each treatment. The rate of nitrate uptake by roots was determined by 15N labeling. At 2 days after defoliation, the plant was gently sucked onto a paper towel and then immediately washed with 0.1 mM CaSO4 for 1 min to remove any compounds adsorbed on the root surface and then exposed to a basic nitrogen-free Hoagland medium added with 0.05 mM or 5 Mm 15N-labeled KNO3 (atomic% 15N: 10%) for 1 h [6]. At the end of the incubation period, roots were immediately washed with 0.1 mM CaSO4 for 1 min, frozen in liquid nitrogen, and stored at −80 °C. The 15N and total nitrogen contents in the samples were determined using an isotope ratio mass spectrometry.

2.4. Photosynthetic Pigments and Anthocyanin Content Measurement

Chlorophyll and carotenoid contents were extracted with 100% acetone from leaf powder ground with liquid nitrogen, according to Lichtenthaler [28]. All extractions and measurements were performed under low light conditions, and the absorbance was measured with a spectrophotometer at 661.6 nm, 644.8 nm and 470 nm, respectively. All spectrophotometric analyses were conducted on a SHIMADZU UV-2600 spectrophotometer. Anthocyanin contents were extracted using a method from Rabino and Mancinelli [29].

2.5. Gas Exchange Measurement

Photosynthetic rate, stomatal conductance, intercellular carbon dioxide concentration, and transpiration rate of treated plants were measured on fully expanded leaves by using the LI-6400 photosynthesis system (Li-Cor, Inc., Lincoln, NE, USA). During the measurements, leaf temperature was maintained at 23 ± 0.5 °C, the vapor pressure deficit was 2.8 ± 0.05 kPa, steady photosynthetic photon flux density was set as 1000 μmol m−2 s−1, and the reference CO2 in the cuvette was 400 ± 5 μmol mol −1 and the airflow was constant at 500 µmol s−1. Measurements were performed on at least five independent plants per treatment.

2.6. Chlorophyll Fluorescence Measurement Analysis

After dark-adapting plants for a minimum of 30 min, a Dual-PAM-100 fluorometer (Walz, Effeltrich, Germany) was used to measure the maximum photochemical efficiency of photosystem II (PSII; Fv/Fm), the quantum yield of PSII (ΦPSII), the electron transfer rate (ETR), photochemical quenching coefficient (qP) and non-photochemical quenching coefficient (NPQ). Photosynthesis measurements were performed on fully expanded leaves on at least five independent plants per treatment.

2.7. Assays of Antioxidant Enzyme Activity and Soluble Protein

For extraction of antioxidant enzymes and soluble protein, leaf powder samples were homogenized with 50 mM NaH2PO4-Na2HPO4 buffer (pH = 7.00) containing 0.2 mM EDTANa2 and 1% polyvinylpyrrolidone (PVP). The resultant supernatant was used for the determination of Ascorbate peroxidase (APX), Superoxide dismutase (SOD), Catalase (CAT) and Peroxidase (POD) activity, as well as the soluble protein content.
APX activity (EC 1.11.1.11) was estimated using the method described by Nakano and Asada [30]. The decrease in absorbance was recorded at 290 nm. One-unit APX activity was defined as the absorbance change of 0.01 units per minute [31]. The activity of SOD (EC 1.15.1.1) was determined as the ability to inhibit the photochemical reduction of nitro blue tetrazolium (NBT). Absorbance was recorded at 560 nm, and 1 unit of SOD activity was defined as the amount of enzyme required to inhibit 50% of the photoreduction of NBT [32]. CAT (EC 1.11.1.6) activity was obtained based on the decline in absorbance at 240 nm for 3 min due to the decomposition of H2O2 according to the method of Maehly and Chance [33], and the absorbance change of 0.01 units per minute was defined as one unit CAT activity. For POD (EC 1.11.1.7) activity, the increase in absorbance at 470 nm was recorded due to the oxidation of guaiacol [32]. One unit POD activity was defined as the absorbance change of 0.01 units per minute. The soluble protein concentrations were determined via the Coomassie brilliant blue G-250 staining method [34]. Absorbance was recorded at 595 nm with bovine serum albumin as a protein standard.

2.8. Determination of Soluble Sugar Content, Proline Content and Lipid Peroxidation

The soluble sugar was extracted from boiling leaf tissue samples in a water bath for 1 h and determined by the anthrone-sulfuric acid method [35]. The absorbance was measured at 630 nm, and the amount of soluble sugar was calculated based on a standard curve with sucrose as a standard. Proline content was determined by the sulfonylsalicylic acid method following Du et al. [36]. The degree of membrane lipid peroxidation was measured in terms of malondialdehyde (MDA) content by the method of Buege and Aust [37].

2.9. RNA Isolation and Quantitative RT-PCR

Total RNA was extracted from 100 mg of frozen sample powder using the RNase Plant Mini Kit (Qiagen, Germany) according to the manufacturer’s instructions. The extracted RNA was then converted into cDNA using a quantitative reverse transcription kit (Qiagen). Reverse transcription-quantitative PCR (RT-qPCR) was used to detect the relative expression of the nitrate transporter (NRT) gene in the treatment groups. The Nitrate transporters were identified by our previous study [6], and the primers for LpNRT2.1 (Forward: GCTGGTGGTAACGTGGGTGCAG, Reverse: AGCGGGAGTTCTCKGCRAACTTTTG) was designed by Primer Premier 6.20. Three biological replicates were performed, and 3 independent plants were pooled as 1 biological replicate. Primer The reaction system was a 15 µL volume system containing 1 µL of 10-fold diluted cDNA, relevant primers and homemade SYBR Green master mix. The relative expression (fold change) of the target gene was corrected using the geometric means of the 2 reference genes, LpELONGATION FACTOR (eEF) and LpGAPDH, and calculated using the 2−∆∆Ct method as described in a previous study [6].

2.10. Statistical Analysis

SPSS 26.0 software was used for the statistical analysis of the data, and Graphpad prism 9.3 was used for the production of the figures. The N content was analyzed statistically using the t-test. In addition, in the case of normally distributed data and homogeneous variance, one-way analysis of variance (ANOVA) with least significant difference (LSD) multiple comparison test at the 0.05 level of probability was used to analyze the remaining data.

3. Results

3.1. Comparison of Plant Regrowth under LN and MN Treatments

The effect of nitrogen addition on ryegrass regrowth after defoliation was assessed. The growth rate of plants after defoliation was much higher than that of intact plants (Figure 2a and Supplementary Figure S1). In the early stage of regrowth, the growth rate of plants grown under moderate NO3 (MN, 5 mM) was higher than that of plants grown under low NO3 (LN, 0.05 mM; Figure 2a). The single-day regrowth rate of LN-Defoliation-MN plants was the highest of all treatment groups after 2 days of defoliation (Supplementary Figure S1), and the total regrowth rate was also consistently the highest after the fourth day of regrowth (Figure 2a). In addition, the regrowth rate of LN-Defoliation-LN plants was the lowest rate of regrowth in all the plants treated with defoliation. The leaf width and the tiller numbers of the plants grown in the low nitrogen condition (LN plants) were significantly lower than those of the plants grown in the moderate nitrogen condition (MN plants) before defoliation (Figure 2b,c). The 5 mM N addition after defoliation resulted in a significant increase in leaf width and tiller numbers of LN plants but not MN plants (Figure 2b,c). In contrast, the 0.05 mM N after defoliation resulted in a significant decrease in the leaf width of MN plants. Furthermore, the 5 mM N addition significantly increased the aboveground biomass of a single LN plant (Figure 2d). Defoliation significantly increased the belowground biomass of MN plants, especially in the case of 5 mM N addition after defoliation (Figure 2e).

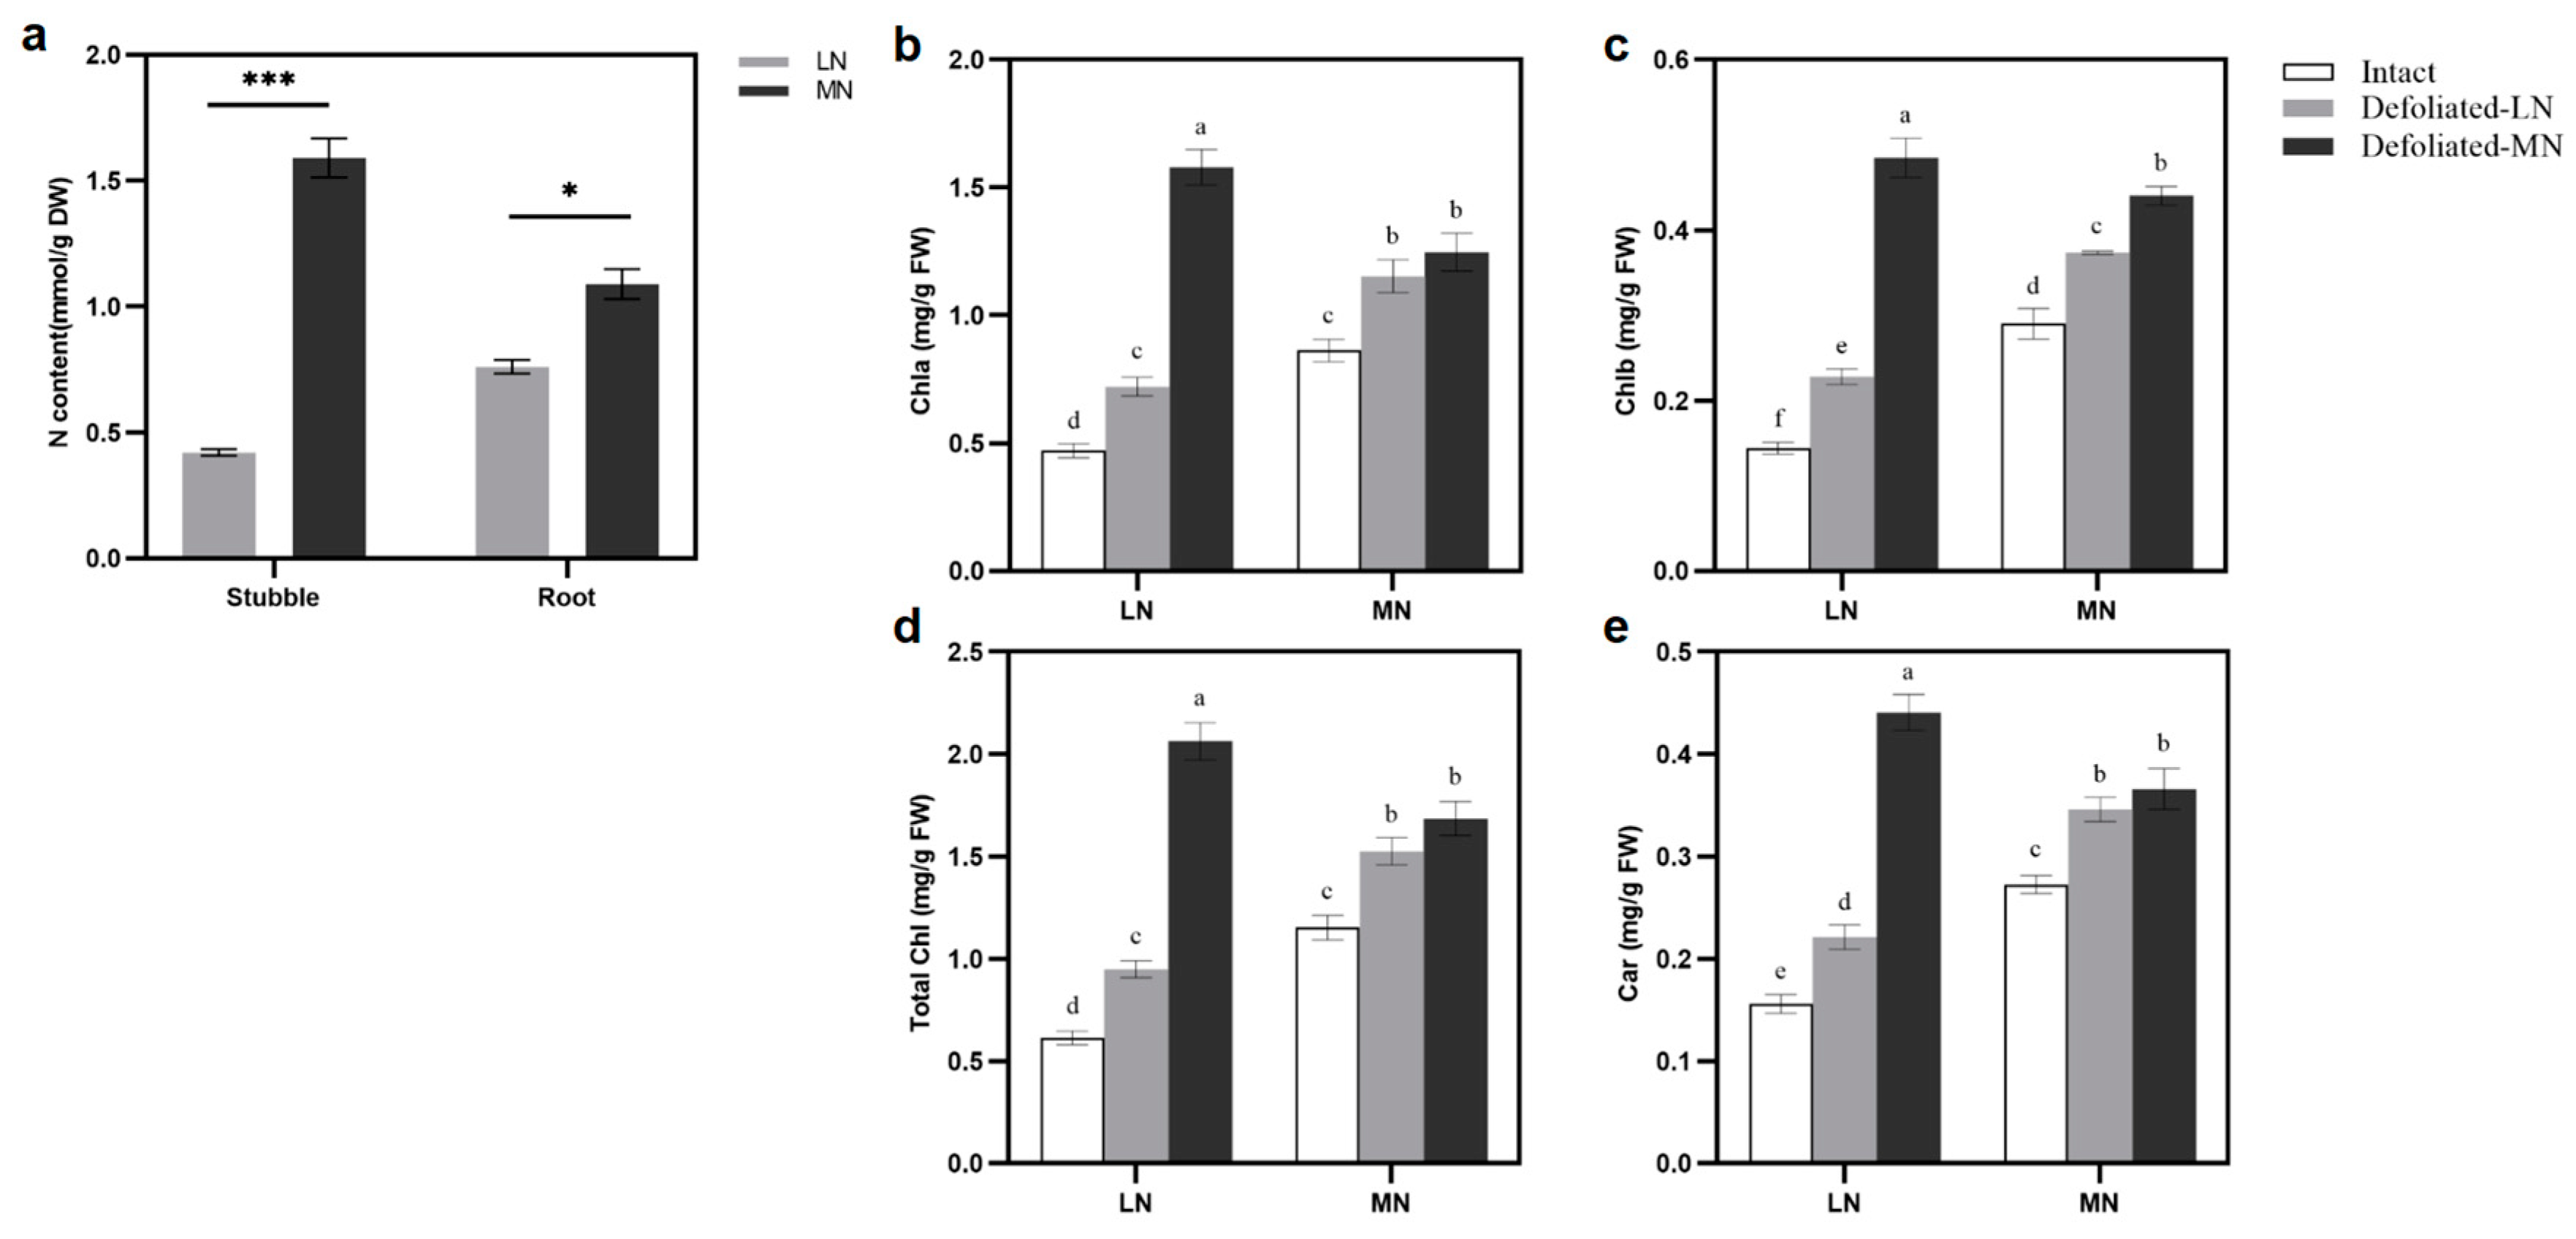
3.2. Effect of Defoliation and Nitrogen Treatments on Photosynthetic Pigments and Gas Exchange Parameters

Before defoliation, the nitrogen content of MN plants was significantly higher than that of LN plants, both in the stubble and in the roots (Figure 3a). After defoliation, the content of photosynthetic pigments in plants changed significantly with the supply of different nitrate concentrations. The 5 mM N addition following defoliation resulted in more chlorophyll content in the regrowth leaf tissue of plants, which was more apparent in LN plants than MN plants (Figure 3b–d). The leaf carotenoid content showed a similar pattern to leaf chlorophyll content under treatments (Figure 3e).
Compared with intact plants, the net photosynthetic rate of regrowth leaves was increased following defoliation, especially in plants grown in low nitrate conditions (Table 1). The addition of 5 mM nitrate following defoliation significantly induced the net photosynthetic rate of plants grown in LN condition. The net photosynthetic rate and leaf chlorophyll content of plants showed a similar trend among different treatments (Figure 3b and Table 1). Compared with plants grown in MN conditions, the LN plants were more sensitive to the defoliation treatment. Similarly, stomatal conductance and transpiration rate also showed similar dynamic changes with the net photosynthetic rate under different nitrogen addition following defoliation (Table 1).

3.3. Chlorophyll Fluorescence Response under Defoliation and Nitrogen Treatments

To further characterize the photosynthetic apparatus, the photoresponse curves of PSII quantum yield (ΦPSII), electron transport rate (ETR), and redox state of the QA electron acceptor of PSII (1 − qP) and Fv/Fm were analyzed following 16 days after defoliation. (Figure 4 and Figure S2). The ΦPSII and ETR were much higher in the LN-defoliation-MN treatment group (Figure 4a,b). In contrast, 1 − qP was significantly reduced in the LN-Defoliation-MN plants, while the continued 0.05 mM N addition of LN plants after defoliation resulted in the highest 1 − qP among all treatments (Figure 4c). We also monitored non-photochemical quenching (NPQ) induction during light and dark transition periods. After dark adaptation, plants were exposed to 450 μmol of photons m−2 s−1 for 5 min to analyze the induction and relaxation of NPQ (Figure 4d). The results showed that the NPQ induction value of LN plants under the condition of adding 5 mM N after defoliation was significantly higher, and the induction rate was slower than that of plants with 0.05 mM N addition after defoliation.

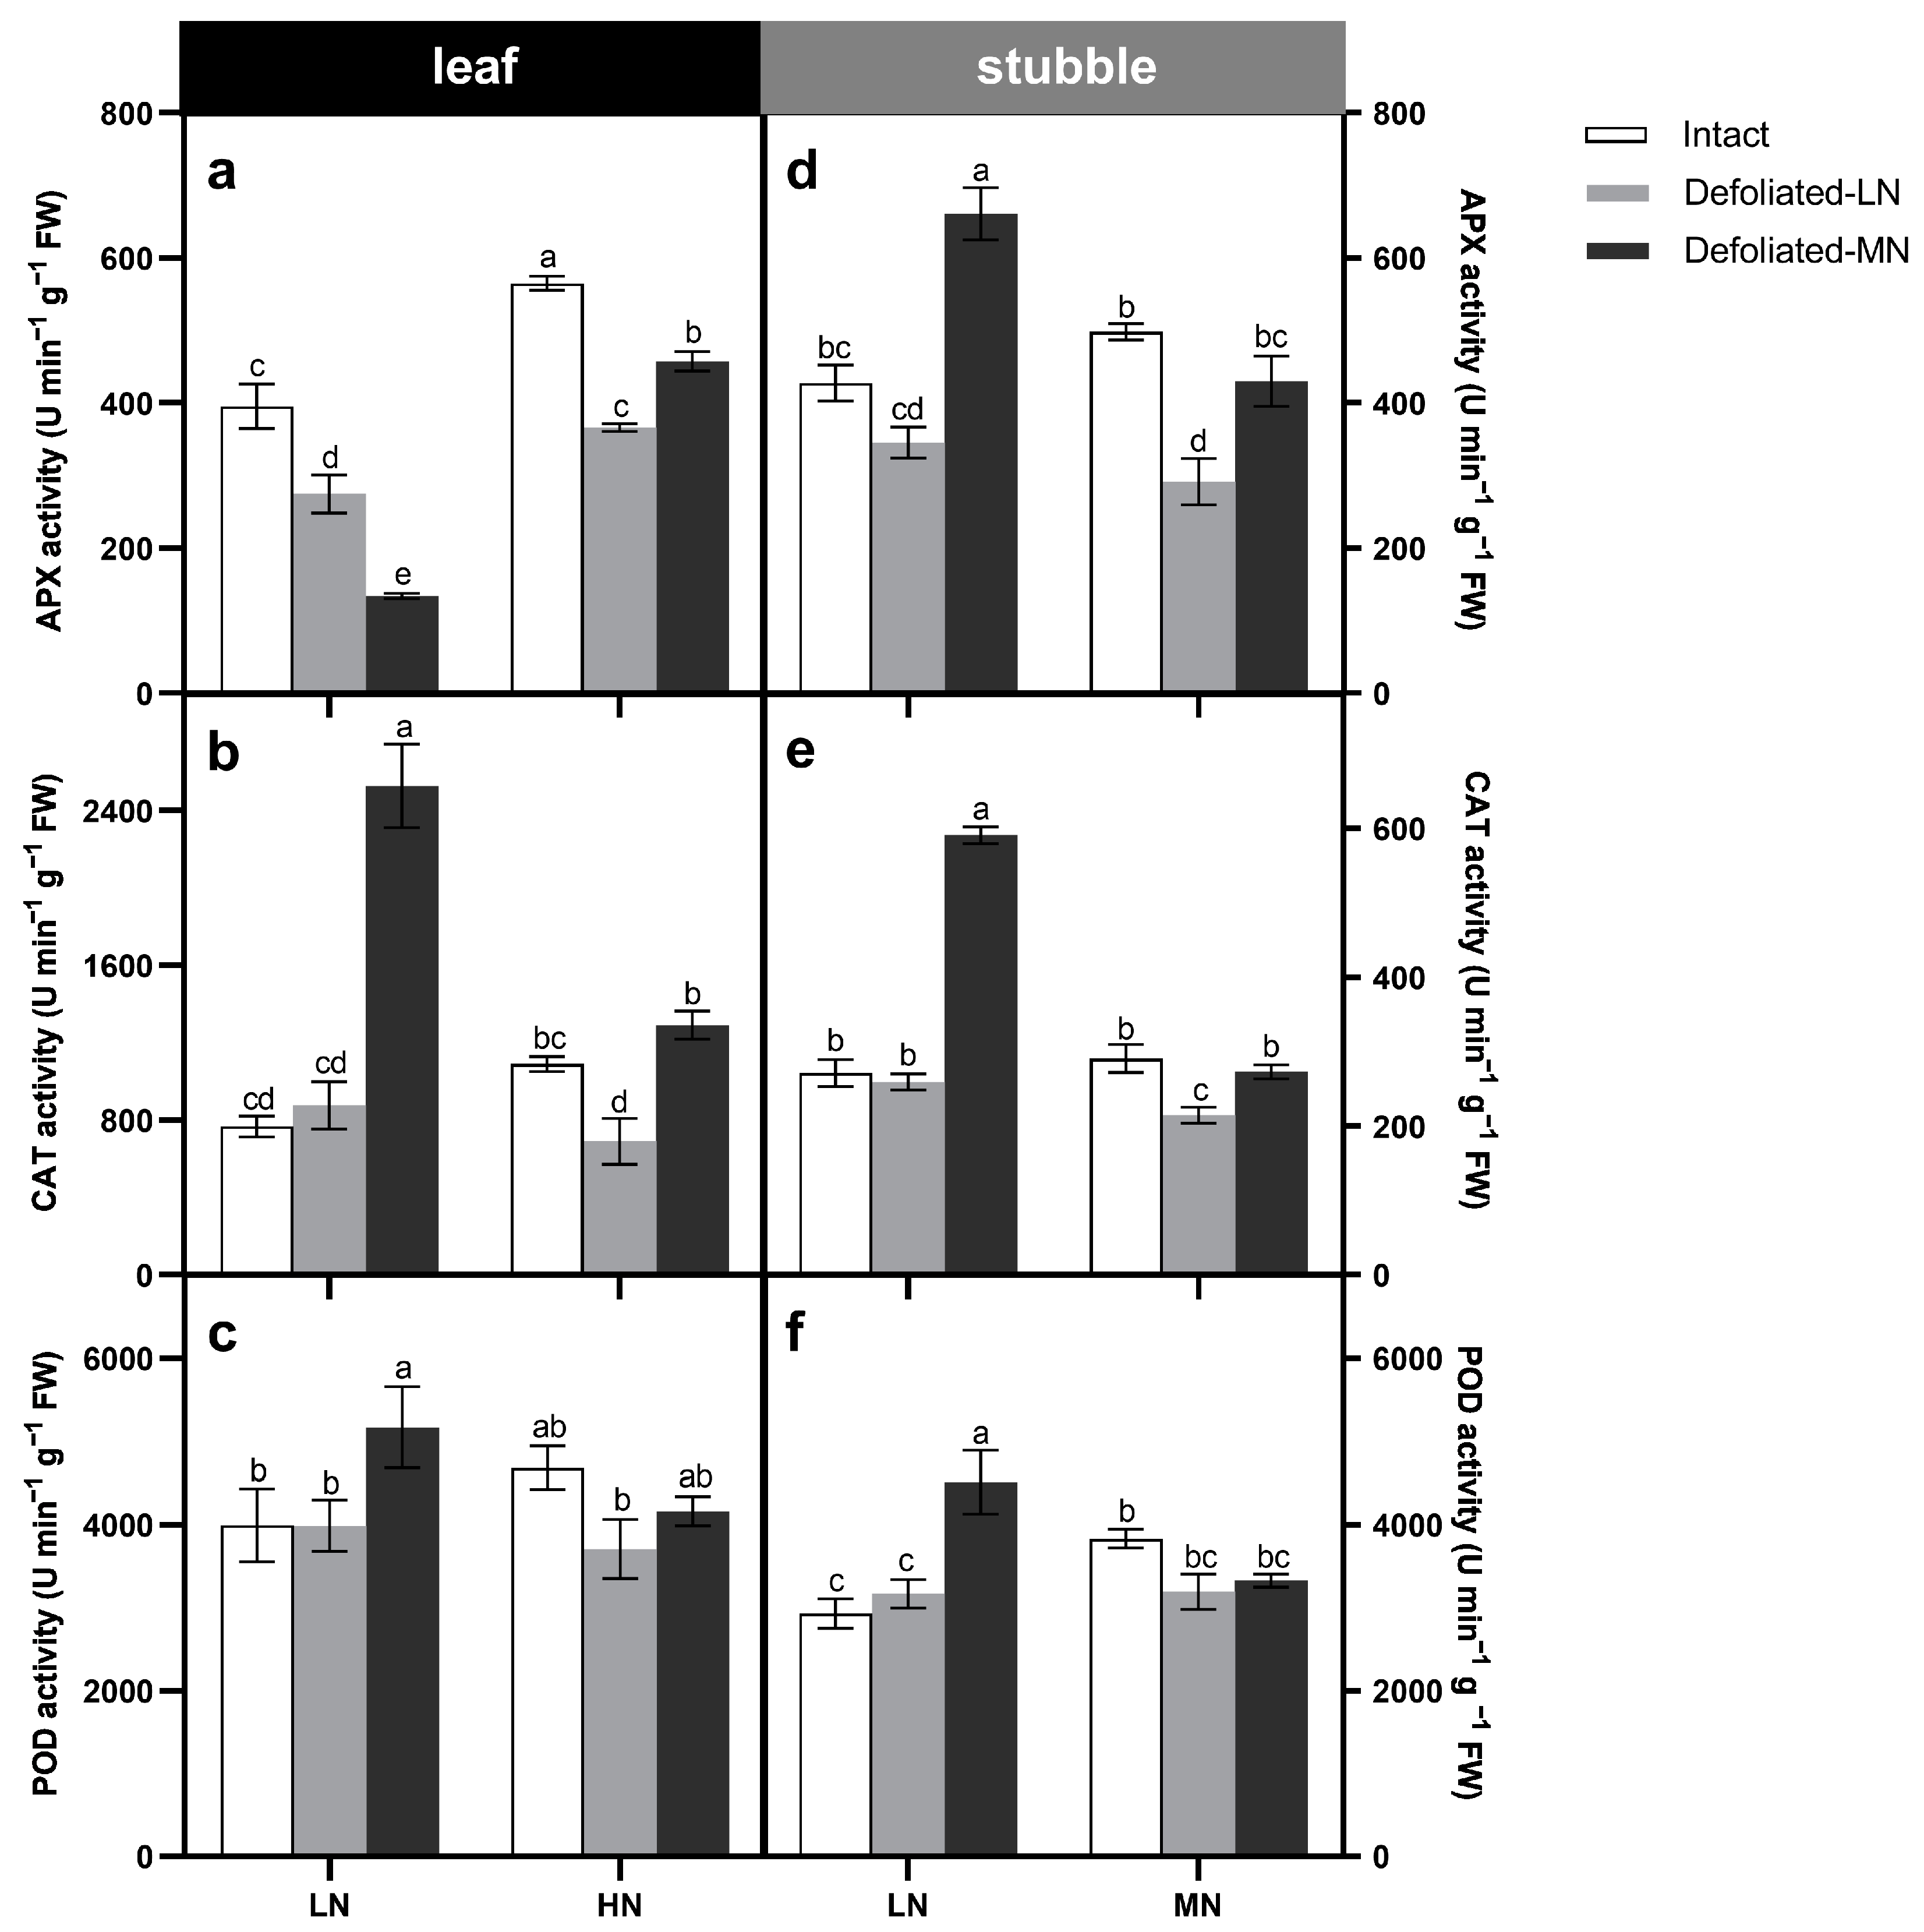
3.4. Plant Antioxidant Responses under Defoliation and Nitrogen Treatments

In order to explore the role of nitrogen addition following defoliation in the antioxidant defense system, the activities of several antioxidant enzymes ten days after defoliation were measured (Figure 5 and Figure S3). The activity levels of APX, CAT, SOD, and POD reflect the ability of plants to clear reactive oxygen species. Ten days after defoliation, the APX, CAT and POD activities of the plant stubble were significantly enhanced with the addition of 5 mM nitrate compared with the addition of 0.05 mM N, even exceeding the activities of intact plants, especially in LN plants (Figure 5d–f). In the leaves of MN plants, the patterns of APX, CAT, and POD activity were consistent with that of the stubble (Figure 5a–c). In LN plants, the activities of CAT and POD increased obviously with the addition of 5 mM N, while the activities of APX and SOD were inhibited, showing opposite trends (Figure 5a–c and Figure S3a).

3.5. Changes in Anthocyanin Content under Defoliation and Nitrogen Treatments

The anthocyanin concentration of LN plants was higher than that of MN plants under the influence of different amounts of nitrogen supply, and the anthocyanin content of regrown leaves of plants exposed to the defoliation was significantly lower than that of old leaves (Table 2). Meanwhile, the accumulation of anthocyanins in the regrown leaves of LN plants was enhanced significantly under the 0.05 mM N addition compared with the 5 mM N addition after defoliation, showing a similar pattern to that of MN plants (Table 2). After defoliation, the anthocyanin content in the stubble of LN plants was strongly increased under the 0.05 mM N addition, while it significantly decreased under the 5 mM N addition (Table 2). After the fifth day of regrowth, the anthocyanin content in the stubble of MN plants had little difference (Table 2). In contrast, anthocyanin content in the stubble of MN plants was apparently increased in the treatment with 0.05 mM N addition after defoliation on the 10th day, while this enhancement was alleviated with 5 mM N addition (Table 2).

3.6. Response of Lipid Peroxidation and Proline Concentration to Defoliation and Differential N Supply

The malondialdehyde and proline content in the stubble of LN plants and MN plants was investigated after ten days of regrowth to show the degree of plant recovery after defoliation (Table 3). The MDA content in the stubble of LN plants was decreased under the addition of 5 mM N, whereas there was no significant difference in MN plants (Table 3). Meanwhile, the free proline content in LN plants was greatly increased in the addition of 5 mM N after defoliation, suggesting improved tolerance to defoliation treatment.

3.7. Effect of Defoliation and Nitrogen Treatments on the Content of Soluble Sugar and Protein in Ryegrass

In comparison with intact plants, a significant reduction in soluble sugar content was observed in LN and MN plants after defoliation (Table 2). The addition of 5 mM N in LN plants after defoliation resulted in a significant reduction in the soluble sugar concentration of the stubbles and leaves compared with the 0.05 mM N addition (Table 2). However, there was little difference between different nitrogen treatments after defoliation in MN plants (Table 2). In addition, the soluble protein content of leaves and stubbles was significantly enhanced under the 5 mM N addition after the defoliation of LN plants and the leaves of MN plants (Table 3).

3.8. Nitrate Uptake Rate and NRT Transcript Levels

To better understand the changes in nitrate uptake in response to defoliation and nitrogen addition, nitrate uptake rates and NRT gene expression two days after defoliation was measured (Figure 6). The results showed that the rate of nitrate uptake in the first two days of plant regrowth was significantly reduced by defoliation stress, and the decrease was more pronounced in MN plants (Figure 6a). As a candidate gene of ryegrass high-affinity transport system (HATS), LpNRT2.1 is more susceptible to inducible expression in a low nitrogen environment. In our findings, LpNRT2.1 was strikingly higher in LN plants than in MN plants, and the expression of LpNRT2.1 was significantly down-regulated by the addition of 5 mM N after defoliation (Figure 6b).

4. Discussion

Growth, development, and regulation directly depend on micro- and macronutrients to maintain proper photosynthesis and physiology in plants [19,38]. Nitrogen limitation is a key factor leading to plant growth dysfunction [19]. At the same time, nitrogen is an indispensable component for plants to resist adversity [20,22,24]. In this study, we found that the regrowth rate, leaf width, tiller number, and biomass of LN plants after defoliation were significantly enhanced under the addition of 5 mM N (Figure 2). Therefore, to understand the specific physiological responses of perennial ryegrass that alleviated defoliation stress when plants were supplied with 5 mM N, our study investigated the plant photosynthetic response and antioxidant defense system under both moderate and low nitrogen supply.

4.1. Nitrate Supply Significantly Affects the Establishment of Ryegrass Leaf Photosynthesis after Defoliation

As important photosynthetic pigments, chlorophyll and carotenoids participate in the absorption, transmission, and distribution of light energy in photosynthesis and play a key role in plant growth and development [39]. Increasing nitrogen application can enhance the content of chlorophyll and carotenoids, thereby increasing the yield of photoassimilates and the growth rate [40,41,42]. This is consistent with our study that MN addition significantly promoted chlorophyll and carotenoid contents in plant leaf parts after defoliation (Figure 3b–e). The chlorophyll content of regrowth leaves was significantly higher than that of older leaves of intact plants because the decline of chlorophyll content could present the beginning of senescence [40]. Photosynthetic efficiency depends on photosynthetic pigment content [43]. As chlorophyll and carotenoid content of plants grown under LN conditions supplied by moderate nitrogen following defoliation increased, the net photosynthetic rate also improved significantly (Figure 3b–e and Table 1). Previous studies have also shown a lower photosynthetic rate of maize, rice, and rapeseed (Brassica campestris) when plants were grown under nitrogen starvation conditions that did not meet their respective recommended nitrogen application levels [19,44,45]. In the present study, we also found that the stomatal conductance and transpiration rate of perennial ryegrass leaves were significantly increased under a supply of moderate nitrogen after defoliation (Table 1), which was consistent with the studies of Shen et al. [46] and Yue et al. [47]. These results further demonstrated that the change of photosynthetic rate under nitrogen deficiency could be due to stomatal limitation, but non-stomatal limitation, such as the membrane structural integrity of the photosynthetic apparatus, the energy supply of the photosynthetic reaction center and the related enzyme activities, also affected the net rate of plant photosynthesis [48]. Therefore, under the condition of defoliation stress, adding an appropriate amount of nitrate to increase the chlorophyll content might be an important way to improve plant photosynthesis and further alleviate the defoliation stress of perennial ryegrass.
Chlorophyll fluorescence assay is a powerful tool for analyzing the photosynthetic response of plants under abiotic stress, reflecting the basic functions of the photosynthetic apparatus and the performance of photosynthesis [19,49]. Appropriate nitrogen application rate can ensure higher photosynthetic pigment content, enhance light energy capture ability, improve the photochemical efficiency and the ratio of the open reaction center of PSII, and improve the quantum efficiency and self-protection ability of PSII [11]. Our results emphasized that the actual quantum yield of PSII photochemistry (ΦPSII) and electron transport rate of PSII photochemistry (ETRII) were efficiently enhanced under moderate nitrogen addition following defoliation (Figure 4a,b). This mechanism may be related to the catalytic effect of nitrogen fertilizer on the activity of photoactivated enzymes in leaves, thereby enhancing the energy capture efficiency of the PSII reaction center [50]. At the same time, the QA electron acceptor of PSII (1 − qP) under LN plants with 0.05 mM N addition following defoliation was much higher than that of LN plants with 5 mM N addition (Figure 4c), reflecting a more highly oxidized plastoquinone pool in LN-Defoliation-LN plants. The induction kinetics of NPQ showed that the NPQ under LN-Defoliation-MN plants was induced faster, and the values were significantly higher compared with the LN plants with 0.05 mM N addition after defoliation. After switching to darkness, the NPQ relaxation of LN-Defoliation-MN plants was also faster than that of LN plants with 0.05 mM N addition, indicating that nitrogen application after defoliation alleviated the damage to the photosynthetic system caused by defoliation stress (Figure 4d). The above findings were consistent with the study by Mu et al. [51] that both ΦPSII, qP and ETR were evidently decreased in maize under low nitrogen supply.

4.2. Moderate Nitrate Supply Alleviates Defoliation Stress by Enhancing Antioxidant Defense System

Plant redox homeostasis is disrupted under stress conditions [52]. As a result of defoliation, plant leaves will be mechanically damaged, the photosynthetic leaf area will be reduced, and the cytosol will extravasate, which will eventually lead to the imbalance of leaf energy and water. At this time, the photosynthetic rate of the regrowth leaves of the plant will increase rapidly. The photosynthetic process can trigger the accumulation of oxygen free radicals, thereby activating the antioxidant enzyme protection system [53]. Meanwhile, low concentrations of nitrogen induce senescence and reactive oxygen species (ROS) production in plant cells [54]. ROS can cause lipid peroxidation and damage cell membranes [55]. Nitrogen deficiency directly affects the production of antioxidant enzymes, and once the ability of plants to scavenge ROS is lower than the production of ROS, it will lead to oxidative stress [56]. Our study showed that the CAT and POD activities in leaves and stubbles of LN plants under moderate nitrate supply after defoliation were significantly increased compared with LN-Defoliation-LN plants (Figure 5). Moreover, the content of MDA, the membrane lipid peroxidation product, was significantly decreased in stubbles of LN-Defoliation-MN plants after defoliation (Table 3). Additionally, the SOD activity of ryegrass was decreased under the addition of moderate nitrate after defoliation (Supplementary Figure S3). This was consistent with the study by Garrido et al. [57] that the defoliation of plants resulted in a decrease in SOD activity. Anthocyanins can be induced and accumulated under abiotic stress conditions [58,59]. In this study, we found that the anthocyanin content of LN plants was significantly reduced under the addition of moderate nitrate after defoliation (Table 2), indicating that nitrogen addition alleviated the damage to plants caused by defoliation stress. The accumulation of osmotic regulatory substances maintains the normal metabolic environment of cells and reduces damage when plants are under stress. The addition of moderate nitrate compared with low nitrate resulted in an increase in soluble protein and proline in LN plants after defoliation (Table 2 and Table 3). The above results showed that the supply of moderate nitrate after perennial ryegrass defoliation might occur mainly through the enhancement of the activities of two antioxidant enzymes, CAT and POD, and the two osmotic regulators, soluble protein and proline, to scavenge newly generated ROS, maintain cellular water balance, prevent membrane damage, and mitigate oxidative damage.
In addition, we found that on the second day of regrowth, the nitrate uptake rate of MN plants decreased significantly (Figure 6a), which was consistent with the study of Guo et al. [6]. In the early stage of regrowth, the nitrate absorption and assimilation ability of perennial ryegrass were limited [6]. Studies have shown that after plant defoliation, when photosynthesis fails to meet the needs of plants for carbon sources, stored carbohydrates will migrate, and carbon migration will occur through fructan hydrolysis [7]. Fructans stored in the growing area of leaves are hydrolyzed and recirculated in this area to maintain leaf growth immediately after defoliation [8]. However, it is the depletion of carbohydrate reserves that limits the uptake of nitrate in ryegrass in the early stages of regeneration [6]. This was also shown in our results. The soluble sugar content of ryegrass decreased significantly after defoliation compared with that of intact plants, and the decrease was greater in plants with moderate nitrogen addition after defoliation. Guo et al. [6] showed that with the degradation and depletion of fructans after defoliation treatment for 48 h, the expression of the nitrate transporter gene LpNRT2.1, which is responsible for high affinity, was significantly inhibited by the regulation of carbon and nitrogen balance, which was consistent with our research results. After the addition of moderate nitrogen, the expression of LPNRT2.1 in LN-defoliation-MN plants was significantly down-regulated (Figure 6b). This may be due to the mobilization of stored carbohydrates for regrowth after plant defoliation [6,7], thus reducing the energy supply for nitrate uptake. However, the addition of exogenous glucose remedied the inhibition of nitrate absorption efficiency caused by defoliation [6], which further proved the dependence of the nitrate absorption system on carbon sources in plants.

5. Conclusions

Defoliation, as the main utilization method of perennial grassland, will cause certain mechanical stress to grassland plants. In our study, the addition of 5 mM nitrate after defoliation promoted the increase of chlorophyll content, which enhanced photosynthesis and photosynthetic capacity, promoted plant regrowth, and also enhanced plant resistance by improving antioxidant enzyme activities and osmotic regulatory substances, thereby mediating the damage of defoliation stress. This suggests that nitrate addition after defoliation in perennial ryegrass alleviated defoliation stress by modulating photosynthesis and antioxidant defense systems. Therefore, nitrogen is beneficial to the growth and development of perennial ryegrass, and proper management of nitrogen after plant defoliation is important, especially for plants grown in nitrogen-deficient areas. As our understanding of nitrogen and defoliation responses continues to deepen, we can apply this knowledge to pasture production for grazing to improve pasture yield. In addition, it is necessary to further explore the appropriate amount and time of nitrate addition to ryegrass after defoliation, as well as its molecular regulation mechanism to optimize the nitrogen use efficiency of ryegrass.

Supplementary Materials

The following supporting information can be downloaded at: https://www.mdpi.com/article/10.3390/agronomy12112902/s1, Figure S1: Single-day regrowth rate of perennial ryegrass after defoliation under low (0.05 mM) or moderate (5 mM) nitrate supply; Figure S2: Maximum efficiency of photosystem II (Fv/Fm) on 15th days of perennial ryegrass regrowth under low (0.05 mM) or moderate (5 mM) nitrate supply after defoliation; Figure S3: SOD activity of perennial ryegrass after defoliation under low (0.05 mM) or moderate (5 mM) nitrate supply.

Author Contributions

Q.G. conceived the original research plans; H.Z., X.X. and M.S. performed experiments and analyzed the data; S.Y. and T.W. commented on the methodology and data; H.Z. wrote the article and prepared figures; Q.G critically commented on and edited the manuscript; Q.G. supervised the research and provided laboratory infrastructure and funding. All authors have read and agreed to the published version of the manuscript.

Funding

This research was funded by Fundamental Research Funds for the Central Universities (BLX201938) and Key project of “Establishment of National Dairy Technology Innovation Center” in Inner Mongolia Autonomous Region: Research and integrated demonstration of key production, processing and utilization technologies of large-scale high-quality alfalfa grass (2022150103000002).

Data Availability Statement

The data presented in this study are available on request from the corresponding author.

Conflicts of Interest

The authors declare no conflict of interest.

References

  1. Humphreys, M.; Feuerstein, U.; Vandewalle, M.; Baert, J. Ryegrasses. In Handbook of Plant Breeding; Beat Boller, B., Posselt, U., Eds.; Springer: Berlin/Heidelberg, Germany, 2010; Volume 5, pp. 211–260. [Google Scholar] [CrossRef]
  2. Lestienne, F.; Thornton, B.; Gastal, F. Impact of defoliation intensity and frequency on N uptake and mobilization in Lolium perenne. J. Exp. Bot. 2006, 57, 997–1006. [Google Scholar] [CrossRef] [PubMed] [Green Version]
  3. Briske, D.; Richards, J. Physiology of plants recovering from defoliation. In Proceedings of the XVII International Grassland Congress, Palmerston North, New Zealand, 8–21 February 1993; SIR Publishing: Auckland, New Zealand, 1993; pp. 85–94. [Google Scholar]
  4. Zhou, R.L.; Zhao, H.L. Seasonal pattern of antioxidant enzyme system in the roots of perennial forage grasses grown in alpine habitat, related to freezing tolerance. Physiol. Plant. 2004, 121, 399–408. [Google Scholar] [CrossRef]
  5. Lee, J.; Puthigae, S.; Donaghy, D.; Roche, J. Impact of defoliation severity on photosynthesis, carbon metabolism and transport gene expression in perennial ryegrass. Funct. Plant Biol. 2011, 38, 808–817. [Google Scholar] [CrossRef]
  6. Guo, Q.; Turnbull, M.H.; Song, J.; Roche, J.; Novak, O.; Spath, J.; Jameson, P.E.; Love, J. Depletion of carbohydrate reserves limits nitrate uptake during early regrowth in Lolium perenne L. J. Exp. Bot. 2017, 68, 1569–1583. [Google Scholar] [CrossRef] [PubMed] [Green Version]
  7. Roche, J.; Turnbull, M.H.; Guo, Q.; Novak, O.; Spath, J.; Gieseg, S.P.; Jameson, P.E.; Love, J. Coordinated nitrogen and carbon remobilization for nitrate assimilation in leaf, sheath and root and associated cytokinin signals during early regrowth of Lolium perenne. Ann. Bot. 2017, 119, 1353–1364. [Google Scholar] [CrossRef]
  8. Morvan-Bertrand, A.; Boucaud, J.; Le Saos, J.; Prud’homme, M.P. Roles of the fructans from leaf sheaths and from the elongating leaf bases in the regrowth following defoliation of Lolium perenne L. Planta 2001, 213, 109–120. [Google Scholar] [CrossRef] [PubMed]
  9. Mohammad, P.; Press, C. Handbook of Plant and Crop Physiology. Phytochemistry 2002, 63, 631. [Google Scholar]
  10. Kim, T.-H.; Jung, W.-J.; Lee, B.-R.; Yoneyama, T.; Kim, H.-Y.; Kim, K.-Y. P effects on N uptake and remobilization during regrowth of Italian ryegrass (Lolium multiflorum). Environ. Exp. Bot. 2003, 50, 233–242. [Google Scholar] [CrossRef]
  11. Peng, J.; Feng, Y.; Wang, X.; Li, J.; Xu, G.; Phonenasay, S.; Luo, Q.; Han, Z.; Lu, W. Effects of nitrogen application rate on the photosynthetic pigment, leaf fluorescence characteristics, and yield of indica hybrid rice and their interrelations. Sci. Rep. 2021, 11, 7485. [Google Scholar] [CrossRef]
  12. Lawlor, D.W. Carbon and nitrogen assimilation in relation to yield: Mechanisms are the key to understanding production systems. J. Exp. Bot. 2002, 53, 773–787. [Google Scholar] [CrossRef]
  13. Allison, J.; Williams, H.; Pammenter, N. Effect of specific leaf nitrogen on photosynthesis in sugarcane. Ann. Appl. Biol. 1997, 131, 339–350. [Google Scholar] [CrossRef]
  14. Vos, J.; van der Putten, P.E.L.; Birch, C.J. Effect of nitrogen supply on leaf appearance, leaf growth, leaf nitrogen economy and photosynthetic capacity in maize (Zea mays L.). Field Crops Res. 2005, 93, 64–73. [Google Scholar] [CrossRef]
  15. Yao, Y.Y.; Zhang, C.K.; Camberato, J.J.; Jiang, Y.W. Nitrogen and carbon contents, nitrogen use efficiency, and antioxidant responses of perennial ryegrass accessions to nitrogen deficiency. J. Plant Nutr. 2019, 42, 2092–2101. [Google Scholar] [CrossRef]
  16. Lv, R.; El-Sabagh, M.; Obitsu, T.; Sugino, T.; Kurokawa, Y.; Kawamura, K. Effects of nitrogen fertilizer and harvesting stage on photosynthetic pigments and phytol contents of Italian ryegrass silage. Anim. Sci. J. 2017, 88, 1513–1522. [Google Scholar] [CrossRef] [PubMed] [Green Version]
  17. Cen, H.; Weng, H.; Yao, J.; He, M.; Lv, J.; Hua, S.; Li, H.; He, Y. Chlorophyll fluorescence imaging uncovers photosynthetic fingerprint of citrus huanglongbing. Front. Plant Sci. 2017, 8, 1509. [Google Scholar] [CrossRef] [Green Version]
  18. Humplik, J.F.; Lazar, D.; Fuerst, T.; Husickova, A.; Hybl, M.; Spichal, L. Automated integrative high-throughput phenotyping of plant shoots: A case study of the cold-tolerance of pea (Pisum sativum L.). Plant Methods 2015, 11, 20. [Google Scholar] [CrossRef] [Green Version]
  19. Tantray, A.Y.; Bashir, S.S.; Ahmad, A. Low nitrogen stress regulates chlorophyll fluorescence in coordination with photosynthesis and Rubisco efficiency of rice. Physiol. Mol. Biol. Plants 2020, 26, 83–94. [Google Scholar] [CrossRef]
  20. Wang, K.; Zhang, X.; Ervin, E. Antioxidative responses in roots and shoots of creeping bentgrass under high temperature: Effects of nitrogen and cytokinin. J. Plant Physiol. 2012, 169, 492–500. [Google Scholar] [CrossRef]
  21. Ibrahim, M.E.H.; Zhu, X.; Zhou, G.; Ali, A.Y.A.; Ahmad, I.; Farah, G.A. Nitrogen fertilizer alleviated negative impacts of NaCl on some physiological parameters of wheat. Pak. J. Bot. 2018, 50, 2097–2104. [Google Scholar]
  22. Ibrahim, M.E.H.; Zhu, X.; Zhou, G.; Ali, A.Y.A.; Ahmad, I.; Elsiddig, A.M.I.; Zhu, G.; Nimir, N.E.A. Promoting salt tolerance in wheat seedlings by application of nitrogen fertilizer. Pak. J. Bot. 2019, 51, 1995–2002. [Google Scholar] [CrossRef]
  23. Kirova, E. Effect of nitrogen nutrition source on antioxidant defense system of soybean plants subjected to salt stress. Comptes Acad. Bulg. Sci. 2020, 73, 211–219. [Google Scholar] [CrossRef]
  24. Ali, A.Y.A.; Ibrahim, M.E.H.; Zhou, G.; Nimir, N.E.A.; Elsiddig, A.M.I.; Jiao, X.; Zhu, G.; Salih, E.G.I.; Suliman, M.S.E.S.; Elradi, S.B.M. Gibberellic acid and nitrogen efficiently protect early seedlings growth stage from salt stress damage in Sorghum. Sci. Rep. 2021, 11, 6672. [Google Scholar] [CrossRef]
  25. Costa Cunha de Souza, E.A.; Alvarez-Pizarro, J.C.; Lopes, L.d.S.; Miranda, R.d.S.; Gomes-Filho, E. Nitrate and ammonium nutrition modulates the photosynthetic performance and antioxidant defense in salt-stressed grass species. J. Soil Sci. Plant Nutr. 2021, 21, 3016–3029. [Google Scholar] [CrossRef]
  26. Zhu, G.; Xu, Z.; Xu, Y.; Lu, H.; Ji, Z.; Zhou, G. Different types of fertilizers enhanced salt resistance of oat and associated physiological mechanisms in saline soils. Agronomy 2022, 12, 317. [Google Scholar] [CrossRef]
  27. Sikder, R.K.; Wang, X.; Zhang, H.; Gui, H.; Dong, Q.; Jin, D.; Song, M. Nitrogen Enhances Salt Tolerance by Modulating the Antioxidant Defense System and Osmoregulation Substance Content in Gossypium hirsutum. Plants 2020, 9, 450. [Google Scholar] [CrossRef] [Green Version]
  28. Lichtenthaler, H. Chlorophylls and carotenoids: Pigments of photosynthetic biomembranes. Method Enzymol. 1987, 148C, 350–382. [Google Scholar] [CrossRef]
  29. Rabino, I.; Mancinelli, A.L. Light, temperature, and anthocyanin production. Plant Physiol. 1986, 81, 922–924. [Google Scholar] [CrossRef] [PubMed] [Green Version]
  30. Nakano, Y.; Asada, K. Hydrogen peroxide is scavenged by ascorbate-specific peroxidase in spinach chloroplasts. Plant Cell Physiol. 1981, 22, 867–880. [Google Scholar] [CrossRef]
  31. Hu, L.; Li, H.; Pang, H.; Fu, J. Responses of antioxidant gene, protein and enzymes to salinity stress in two genotypes of perennial ryegrass (Lolium perenne) differing in salt tolerance. J. Plant Physiol. 2012, 169, 146–156. [Google Scholar] [CrossRef]
  32. Zhang, J.; Kirkham, M.B. Enzymatic responses of the ascorbate-glutathione cycle to drought in sorghum and sunflower plants. Plant Sci. 1996, 113, 139–147. [Google Scholar] [CrossRef]
  33. Maehly, A.C.; Chance, B. The assay of catalases and peroxidases. Methods Biochem. Anal. 1954, 1, 357–424. [Google Scholar] [CrossRef] [PubMed]
  34. Bradford, M.M. A rapid and sensitive method for the quantitation of microgram quantities of protein utilizing the principle of protein-dye binding. Anal. Biochem. 1976, 72, 248–254. [Google Scholar] [CrossRef]
  35. Ebell, L.F. Variation in total soluble sugars of conifer tissues with method of analysis. Phytochemistry 1969, 8, 227–233. [Google Scholar] [CrossRef]
  36. Du, H.; You, Y.; Xiong, L.Z. Measurment of proline content in rice tissue. Bio-Protocol 2018, 8, e1010146. [Google Scholar] [CrossRef]
  37. Buege, J.A.; Aust, S. Microsomal lipid peroxidation. Method Enzymol. 1978, 52, 302–310. [Google Scholar] [CrossRef]
  38. Hou, W.F.; Yan, J.Y.; Jakli, B.; Lu, J.W.; Ren, T.; Cong, R.H.; Li, X.K. Synergistic effects of nitrogen and potassium on quantitative limitations to photosynthesis in Rice (Oryza sativa L.). J. Agric. Food Chem. 2018, 66, 5125–5132. [Google Scholar] [CrossRef] [PubMed]
  39. Yang, X.; Chen, X.; Ge, Q.; Li, B.; Tong, Y.; Zhang, A.; Li, Z.; Kuang, T.; Lu, C. Tolerance of photosynthesis to photoinhibition, high temperature and drought stress in flag leaves of wheat: A comparison between a hybridization line and its parents grown under field conditions. Plant Sci. Int. J. Exp. Plant Biol. 2006, 171, 389–397. [Google Scholar] [CrossRef]
  40. Bassi, D.; Menossi, M.; Mattiello, L. Nitrogen supply influences photosynthesis establishment along the sugarcane leaf. Sci. Rep. 2018, 8, 2327. [Google Scholar] [CrossRef] [Green Version]
  41. Zhang, X.; Shangguan, Z. Effect of nitrogen fertilization on photosynthetic pigment and fluorescence characteristics in leaves of winter wheat cultivars on dryland. J. Agric. Sci. 2007, 21, 299. [Google Scholar] [CrossRef]
  42. Zhao, L.-S.; Li, K.; Wang, Q.-M.; Song, X.-Y.; Su, H.-N.; Xie, B.-B.; Zhang, X.-Y.; Huang, F.; Chen, X.-L.; Zhou, B.-C.; et al. Nitrogen starvation impacts the photosynthetic performance of porphyridium cruentum as revealed by chlorophyll a fluorescence. Sci. Rep. 2017, 7, 8542. [Google Scholar] [CrossRef] [Green Version]
  43. Kursar, T.A.; Alberte, R.S. Photosynthetic unit organization in a red alga: Relationships between light-harvesting pigments and reaction centers. Plant Physiol. 1983, 72, 409–414. [Google Scholar] [CrossRef] [PubMed]
  44. Jin, X.; Yang, G.; Tan, C.; Zhao, C. Effects of nitrogen stress on the photosynthetic CO2 assimilation, chlorophyll fluorescence, and sugar-nitrogen ratio in corn. Sci. Rep. 2015, 5, 9311. [Google Scholar] [CrossRef] [Green Version]
  45. Liu, T.; Ren, T.; White, P.J.; Cong, R.; Lu, J. Storage nitrogen co-ordinates leaf expansion and photosynthetic capacity in winter oilseed rape. J. Exp. Bot. 2018, 69, 2995–3007. [Google Scholar] [CrossRef]
  46. Shen, H.; Dong, S.; Li, S.; Wang, W.; Xiao, J.; Yang, M.; Zhang, J.; Gao, X.; Xu, Y.; Zhi, Y.; et al. Effects of warming and N deposition on the physiological performances of Leymus secalinus in Alpine Meadow of Qinghai-Tibetan Plateau. Front. Plant Sci. 2019, 10, 1804. [Google Scholar] [CrossRef] [PubMed]
  47. Yue, K.; Li, L.L.; Xie, J.H.; Fudjoe, S.K.; Zhang, R.Z.; Luo, Z.Z.; Anwar, S. Nitrogen supply affects grain yield by regulating antioxidant enzyme activity and photosynthetic capacity of maize plant in the Loess Plateau. Agronomy 2021, 11, 1094. [Google Scholar] [CrossRef]
  48. Ma, X.; Zheng, J.; Zhang, X.; Hu, Q.; Qian, R. Salicylic acid alleviates the adverse effects of salt stress on Dianthus superbus (Caryophyllaceae) by activating photosynthesis, protecting morphological structure, and enhancing the antioxidant system. Front. Plant Sci. 2017, 8, 00600. [Google Scholar] [CrossRef] [PubMed] [Green Version]
  49. Zhao, C.; Liu, Q. Growth and photosynthetic responses of two coniferous species to experimental warming and nitrogen fertilization. Can. J. For. Res. 2009, 39, 1–11. [Google Scholar] [CrossRef]
  50. Zhang, Z.; Zheng, E.; Wang, C.; Yun, N. Effect of different water and nitrogen levels on chlorophyll fluorescence parameters and photosynthetic characteristics of rice. Nongye Jixie Xuebao/Trans. Chin. Soc. Agric. Machin. 2017, 48, 176–183. [Google Scholar] [CrossRef]
  51. Mu, X.; Chen, Q.; Chen, F.; Yuan, L.; Mi, G. An RNA-Seq analysis of the response of photosynthetic system to low nitrogen supply in maize leaf. Int. J. Mol. Sci. 2017, 18, 2624. [Google Scholar] [CrossRef] [Green Version]
  52. Song, H.; Xu, X.; Wang, H.; Wang, H.; Tao, Y. Exogenous gamma-aminobutyric acid alleviates oxidative damage caused by aluminium and proton stresses on barley seedlings. J. Sci. Food Agric. 2010, 90, 1410–1416. [Google Scholar] [CrossRef]
  53. Kornyeyev, D.; Logan, B.A.; Allen, R.D.; Holaday, A.S. Effect of chloroplastic overproduction of ascorbate peroxidase on photosynthesis and photoprotection in cotton leaves subjected to low temperature photoinhibition. Plant Sci. 2003, 165, 1033–1041. [Google Scholar] [CrossRef]
  54. Zakari, S.A.; Asad, M.-A.-U.; Han, Z.; Zhao, Q.; Cheng, F. Relationship of nitrogen deficiency-induced leaf senescence with ROS generation and ABA concentration in rice flag leaves. J. Plant Growth Regul. 2020, 39, 1503–1517. [Google Scholar] [CrossRef]
  55. Foyer, C.; Lelandais, M.; Kunert, K. Photooxidative stress in plants. Physiol. Plant. 1994, 92, 696–717. [Google Scholar] [CrossRef]
  56. Shin, R.; Berg, R.H.; Schachtman, D.P. Reactive oxygen species and root hairs in Arabidopsis root response to nitrogen, phosphorus, and potassium deficiency. Plant Cell Physiol. 2005, 46, 1350–1357. [Google Scholar] [CrossRef] [PubMed]
  57. Garrido, I.; Llerena, J.L.; Valdes, M.E.; Mancha, L.A.; Uriarte, D.; Prieto, M.D.; Espinosa, F. Effects of defoliation and water restriction on total phenols and antioxidant activities in grapes during ripening. J. Int. Sci. Vigne Vin. 2014, 48, 31–42. [Google Scholar] [CrossRef]
  58. Saigo, T.; Wang, T.; Watanabe, M.; Tohge, T. Diversity of anthocyanin and proanthocyanin biosynthesis in land plants. Curr. Opin. Plant Biol. 2020, 55, 93–99. [Google Scholar] [CrossRef]
  59. Scheible, W.R.; Morcuende, R.; Czechowski, T.; Fritz, C.; Osuna, D.; Palacios-Rojas, N.; Schindelasch, D.; Thimm, O.; Udvardi, M.K.; Stitt, M. Genome-wide reprogramming of primary and secondary metabolism, protein synthesis, cellular growth processes, and the regulatory infrastructure of Arabidopsis in response to nitrogen. Plant Physiol. 2004, 136, 2483–2499. [Google Scholar] [CrossRef] [PubMed]
Figure 1. Experimental design of response to defoliation stress of perennial ryegrass under low (0.05 mM) or moderate (5 mM) nitrate supply.
Agronomy 12 02902 g001
Figure 2. Growth parameters of perennial ryegrass after defoliation under low (0.05 mM) or moderate (5 mM) nitrate supply. (a) Total growth rate; (b) leaf width before and 14 days after defoliation; (c) tiller numbers before and 17 days after defoliation; (d) aboveground biomass 17 days after defoliation; (e) underground biomass 17 days after defoliation. Values in (ac) are means ±SE (n = 10 plants). Values in (d,e) are means ± SE (n = 3 pools of six plants each). Different letters indicate significant differences (p < 0.05); the same letter indicates no significant differences between the treatments.
Agronomy 12 02902 g002
Figure 3. Nitrogen content before defoliation and photosynthetic pigment content after defoliation of perennial ryegrass under low (0.05 mM) or moderate (5 mM) nitrate supply. (a) Nitrogen (N) content before defoliation; (b) Chla content, (c) Chlb content, (d) total Chl content and (e) Car content 17 days after defoliation. Values in (a) are means ± SD (n = 3 pools of six plants each). Values in (be) are means ± SE (n = 3 pools of six plants each). Means in (a) are tested for significance using a two-tailed t-test. Asterisks show significant differences between LN plants (grey bars) and MN plants (black bars; * p < 0.05 and *** p < 0.001). Means in (be) are tested for significance using LSD-test. Different letters indicate significant differences (p < 0.05), and the same letter indicates no significant differences between the treatments.
Agronomy 12 02902 g003
Figure 4. Chlorophyll fluorescence of perennial ryegrass after defoliation under low (0.05 mM) or moderate (5 mM) nitrate supply. (a) Quantum yield of photosystem II (ΦPSII), (b) electron transport rate (ETR), (c) redox state of the QA electron acceptor of PSII (1 − qP) and (d) kinetics of Nonphotochemical quenching (NPQ) induction 15 days after defoliation. Values are means ± SE (n = 6 plants). Different letters indicate significant differences (p < 0.05); the same letter indicates no significant differences between the treatments.
Agronomy 12 02902 g004
Figure 5. Antioxidant enzyme activity of perennial ryegrass after defoliation under low (0.05 mM) or moderate (5 mM) nitrate supply. (a) APX activity, (b) CAT activity, (c) POD activity in leaves on the 10th day after defoliation; (d) APX activity, (e) CAT activity and (f) POD activity in the stubble on the 10th day after defoliation. Values are means ± SE (n = 3 pools of six plants each). Different letters indicate significant differences (p < 0.05); the same letter indicates no significant differences between the treatments.
Agronomy 12 02902 g005
Figure 6. Nitrate uptake rate and NRT transcript levels after defoliation under low (0.05 mM) or moderate (5 mM) nitrate supply. (a) Nitrate uptake rate 2 days after defoliation; (b) expression of high-affinity NO3 transporter gene, LpNRT2.1, in roots of perennial ryegrass 2 days after defoliation. Each data point is corrected using the geometric means of the two reference genes, LpELONGATION FACTOR (eEF1α) and LpGAPDH, and calculated using the 2−∆∆Ct method. Values are means ± SD (n = 3 pools of six plants each). Different letters indicate significant differences (p < 0.05); the same letter indicates no significant differences between the treatments.
Agronomy 12 02902 g006
Table 1. Gas exchange parameters of perennial ryegrass after defoliation under low (0.05 mM) or moderate (5 mM) nitrate supply.
TimeTreatmentsPn
(µmol CO2 m−2·s−1)
Gs
(mol H2O m−2·s−1)
Ci
(µmol CO2 mol−1)
Tr
(mmol H2O m−2·s−1)
6 DaysLN-Intact-LN8.593 ± 1.032 e0.082 ± 0.008 c383.512 ± 14.214 b2.535 ± 0.205 c
LN-Defoliation-LN15.581 ± 1.042 d0.119 ± 0.015 ab467.214 ± 6.361 a3.245 ± 0.391 bc
LN-Defoliation-MN29.605 ± 0.449 a0.179 ± 0.013 a373.478 ± 8.062 b4.683 ± 0.305 a
MN-Intact-MN19.376 ± 0.690 c0.109 ± 0.014 c297.427 ± 24.895 d2.892 ± 0.351 bc
MN-Defoliation-LN20.558 ± 0.872 c0.121 ± 0.009 bc354.892 ± 16.270 bc3.542 ± 0.445 b
MN-Defoliation-MN23.364 ± 0.354 b0.140 ± 0.009 bc309.176 ± 32.182 cd3.767 ± 0.241 ab
10 DaysLN-Intact-LN10.553 ± 0.464 e0.112 ± 0.005 b382.759 ± 9.638 a2.473 ± 0.139 d
LN-Defoliation-LN14.173 ± 0.328 d0.120 ± 0.010 b324.357 ± 18.568 b2.671 ± 0.222 cd
LN-Defoliation-MN27.174 ± 1.730 a0.180 ± 0.010 a301.904 ± 21.455 bc3.980 ± 0.198 a
MN-Intact-MN20.137 ± 0.967 bc0.155 ± 0.022 ab311.940 ± 3.798 bc2.433 ± 0.120 d
MN-Defoliation-LN18.896 ± 1.268 c0.147 ± 0.009 ab303.040 ± 5.690 bc2.931 ± 0.122 c
MN-Defoliation-MN21.411 ± 0.453 b0.160 ± 0.003 a280.452 ± 7.561 c3.437 ± 0.093 b
Pn, net photosynthetic rate; Gs, stomatal conductance; Ci, intercellular carbon dioxide concentration; Tr, transpiration rate. Values are means ± SE (n = 6 plants). Different letters indicate significant differences (p < 0.05); the same letter indicates no significant differences between the treatments.
Table 2. Anthocyanin and soluble sugar content of perennial ryegrass after defoliation under low (0.05 mM) or moderate (5 mM) nitrate supply.
TimeTreatmentsAnthocyanin (µg 100 mg−1 FW)Soluble Sugar (mg g−1 FW)
StubbleLeafStubbleLeaf
5 DaysLN-Intact-LN0.443 ± 0.018 b0.598 ± 0.033 a116.554 ± 10.637 a106.417 ± 6.086 a
LN-Defoliation-LN0.552 ± 0.048 a0.327 ± 0.027 b43.443 ± 5.554 b29.299 ± 1.483 c
LN-Defoliation-MN0.251 ± 0.048 d0.142 ± 0.021 c20.060 ± 2.809 c6.253 ± 0.460 d
MN-Intact-MN0.296 ± 0.020 cd0.303 ± 0.038 b110.861 ± 3.534 a87.136 ± 7.238 b
MN-Defoliation-LN0.386 ± 0.024 bc0.073 ± 0.008 cd40.908 ± 5.279 b12.938 ± 2.700 d
MN-Defoliation-MN0.319 ± 0.009 cd0.041 ± 0.010 d36.851 ± 3.139 bc8.822 ± 1.635 d
10 DaysLN-Intact-LN0.682 ± 0.028 b0.532 ± 0.091 a103.230 ± 12.356 a77.340 ± 3.725 b
LN-Defoliation-LN0.957 ± 0.114 a0.362 ± 0.053 bc61.951 ± 6.470 b29.337 ± 2.549 c
LN-Defoliation-MN0.436 ± 0.081 c0.148 ± 0.018 d24.565 ± 3.502 c14.254 ± 0.490 e
MN-Intact-MN0.527 ± 0.056 bc0.384 ± 0.016 b109.709 ± 10.492 a94.564 ± 2.613 a
MN-Defoliation-LN0.976 ± 0.042 a0.233 ± 0.007 cd48.273 ± 4.655 bc25.396 ± 1.884 cd
MN-Defoliation-MN0.713 ± 0.079 b0.122 ± 0.031 d43.326 ± 4.146 bc21.544 ± 0.818 d
Values are means ± SE (n = 3 pools of six plants each). Different letters indicate significant differences (p < 0.05); the same letter indicates no significant differences between the treatments.
Table 3. Lipid peroxidation, proline and soluble protein concentration of perennial ryegrass on the 10th day after defoliation under low (0.05 mM) or moderate (5 mM) nitrate supply.
TreatmentsMDA (nmol g−1 FW)Proline (µg g−1 FW)Soluble Protein (mg g−1 FW)
StubbleStubbleStubbleLeaf
LN-Intact-LN23.960 ± 1.351 a23.241 ± 1.155 c1.515 ± 0.122 b3.344 ± 0.218 c
LN-Defoliation-LN23.603 ± 2.613 a26.186 ± 2.143 c1.404 ± 0.197 b3.721 ± 0.311 c
LN-Defoliation-MN14.785 ± 1.081 b161.491 ± 12.601 a4.283 ± 0.424 a11.442 ± 0.689 a
MN-Intact-MN17.765 ± 2.985 ab46.084 ± 7.996 b1.841 ± 0.111 b4.017 ± 0.343 c
MN-Defoliation-LN18.755 ± 4.897 ab11.308 ± 0.827 c1.313 ± 0.132 b3.330 ± 0.183 c
MN-Defoliation-MN13.683 ± 1.408 b21.048 ± 2.928 c1.925 ± 0.103 b6.045 ± 0.274 b
Values are means ± SE (n = 3 pools of six plants each). Different letters indicate significant differences (p < 0.05); the same letter indicates no significant differences between the treatments.
Publisher’s Note: MDPI stays neutral with regard to jurisdictional claims in published maps and institutional affiliations.

