Abstract
Agrivoltaics is currently presented as a possible effective solution to one of society’s greatest challenges: responding to the increasing demand for energy and food in an efficient and sustainable manner. To this end, agrivoltaics proposes to combine agricultural and renewable energy production on the same land using photovoltaic technology. The performance of this new production model strongly depends on the interaction between the two systems, agricultural and photovoltaic. In that sense, one of the most important aspects to consider are the effects of the shadows of the photovoltaic panels on the crop land. Therefore, further study of crop behavior under agrivoltaic conditions requires exhaustive knowledge of the spatial distribution of solar radiation within the portion of land between collectors and crops. This study presents a valid methodology to estimate this distribution of solar irradiance in agrivoltaic installations as a function of the photovoltaic installation geometry and the levels of diffuse and direct solar irradiance incident on the crop land. As an example, this methodology was applied to simulate the radiative capture potential of possible photovoltaic plants located in Cordoba, Spain by systematically varying the design variables of the photovoltaic plants. Based on the results obtained, a model correlating the agrivoltaic potential of a photovoltaic plant with its design variables is proposed. Likewise, for the “Alcolea 1” photovoltaic plant (Cordoba, Spain), the solar radiation decay profiles were simulated in the lanes between the photovoltaic collectors where the crops would be planted in the event of converting this plant into an agrivoltaic facility. Thus, the methodology proposed represents an interesting way to determine the agrivoltaic potential of existing grid-connected photovoltaic installations that could be converted into agrivoltaic installations, contributing to the implementation of this new agricultural production model that is more sustainable and environmentally committed to the future.
1. Introduction
World population growth in recent decades [1] is causing an increase in the demand for food and energy around the globe [2]. Given the negative effects of conventional energy and its growing price, institutions are committed to promoting the use of renewable energy to meet this energy demand. Thus, the implementation of renewable energy sources as an alternative to replace energies based on fossil fuels and, in so doing, fight against climate change has become one of the main social challenges of our time.
Among the various renewable energy sources, photovoltaics is experiencing a significant boost [3,4] due to its advantages over other renewable energies [5,6]. However, the use of large tracts of land for grid-connected PV plants conflicts with the use of this land for traditional farms.
Faced with this problem, in accordance with the proposal of Goetzberger and Zastrow [7], agrivoltaics proposes combining PV and agricultural production on the same land. To do this, instead of at ground level, the PV panels are placed on elevated structures, to allow extensive or intensive mechanized crop-growing methods below them. In addition to this, the density of PV panels in an agrivoltaic installation is lower than in a conventional PV installation on the ground to allow solar irradiance to reach the crop planted on the ground.
Moreover, the PV panels cast shadows on the crop, reducing the levels of incident irradiance, as well as the temperature of the crop and on the ground; therefore, although the decrease in irradiance can affect agricultural production [2,8,9,10,11,12], PV panels protect the crop from excessive heat [13]. Likewise, the partial shadows of the panels on the ground reduce water consumption by evapotranspiration, favoring the water balance of the soil [2,14]. This circumstance would be especially advantageous in times of drought. Thus, agrivoltaics can strengthen the agricultural sector in the face of climate change [2,10] complementing other initiatives proposed to incorporate renewable energies in the rural environment and making it a more sustainable environment [15,16,17].
From an economic point of view, Dupraz et al. [8] proposed the use of the land equivalent ratio (LER) [18] to compare the performance of land when it is used for a combined agricultural and PV (agrivoltaic) use and when it is used independently for PV or agricultural production. Several studies have found that the LER for different agrivoltaic plants is always greater than the unit, proving that although agricultural or electrical production decreases individually, agrivoltaics increases the global economic performance of the land [8,19,20,21]. It has been verified that the annual net income on an agrivoltaic farm is always higher than in the case of an exclusive farm [22] and agrivoltaics reduces the financial risk of farmers since the economic benefit reduces their dependence on weather and market volatility [22]. Furthermore, when comparing agrivoltaic systems with traditional PV installations, it has been verified that both have similar economic and environmental costs, while agrivoltaic systems have a lower impact on land occupation and favor the stabilization of agricultural production [23].
In addition to the advantages already mentioned, it should be noted that agrivoltaics favors the reduction of the energy demand of the agricultural sector and the decentralized generation of energy, reduces conflicts over land use, and improves the competitiveness of agricultural products by satisfying the demands of sustainable supply chains both domestically and in export markets [24]. For all these reasons, agrivoltaics must play a fundamental role in promoting a new agricultural model that is sustainable and contributes to the fight against climate change [25] while being capable of supplying the growing food needs of the world population [26].
In this context, it is clear that the future implementation of agrivoltaic installations in rural areas will require energy and environmental integration studies similar to those carried out for the integration of photovoltaic systems in urban electric systems [27,28]. The complexity of these studies, which consider technological [29,30,31,32], geographical [33,34], economic [35,36], meteorological [37,38], sociological, and even political [39] aspects, makes it necessary on many occasions to resort to euristic algorithms and AI techniques [31,40].
Likewise, to guarantee the reception of agrivoltaic systems among agricultural producers and facilitate their widespread implementation, it is necessary to go deeper into the evaluation of the profitability of agrivoltaic plants, considering not only the agricultural and energy production once the agrivoltaic plant is in operation, but also the initial investment for the construction of the plant and its payback period. In this regard, purpose-designed agrivoltaic plants, in which the PV panels are installed on structures 4–5 m above the farmland, involve very high initial costs that considerably lengthen the recovery period of the initial investment over time.
Faced with this situation, as an alternative, the present work proposes taking advantage of the existing PV plants connected to the grid for their reconversion into agrivoltaic plants, thereby reducing the initial cost of building the plant. To do so it is necessary to investigate further into the characterization of this proposal [41]. Thus, for example, it is convenient to identify those crops that present a better performance in this type of installation as well as the geometry of the photovoltaic plants that best adapt to this proposal. In this regard, it is necessary to recognize that the density of PV modules, their height, orientation, or the distance between the rows of collectors are key parameters in the configuration of agrivoltaic systems. This is because they condition not only electricity production but also agricultural production, since the shadows of the panels on the crop and the irradiance levels that reach the ground depend on these parameters [2,10,11]. In accordance with this, in the present work a mathematical model is described that is based on the design characteristics of the photovoltaic plant and which enables the levels of solar irradiance received on the ground to be determined. It consequently helps to evaluate the reconversion potential of the agrivoltaic plant.
2. Materials and Methods
In accordance with the above, to evaluate the reconversion potential of existing grid-connected photovoltaic plants in agrivoltaic installations, this paper describes a mathematical model that simulates solar incidence in a network of representative points on the ground, depending on the geometry and design of the photovoltaic plant to be converted to agrivoltaic.
Specifically, in this work the model focuses on the study of PV plants with rectangular collector planes with a southern tilt and with one side of the rectangle oriented in an east-west direction and parallel to the ground and, normally, much longer than the north-south side or sloped side . The choice of this type of PV plant is due to the fact that it is one of the optimal PV plant configurations connected to the network and, therefore, more common. Figure 1 shows the representative variables of the geometry of the indicated facilities on which this model is based, which, as a generic case, also considers that the land on which the facility is located is horizontal.
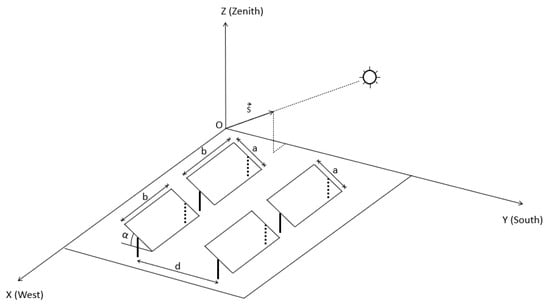
Figure 1.
Geometric characterization of the considered PV installations.
The model proposed in the present work allows characterization of the incidence of solar radiation on different points of the terrain by means of the simulation method. To perform this, first, using vector notation, the representation of the solar position with respect to the geometry of the set of collectors (Section 2.1) together with the geometry of the photovoltaic plant itself (Section 2.2) are defined. Subsequently, the model presented allows determination of the incident solar irradiance at each point on the ground and instant of time (Section 2.3.4) To enable this, the Collares-Pereira equations are used to estimate the expected values at each time instant t of direct irradiance and diffuse irradiance in a horizontal terrain free of obstructions (Section 2.3.1). Then, for each instant of time, the model determines geometrically whether a certain point on the ground is shaded or exposed to the sun, and from this result it determines the extent to which direct and diffuse irradiances are affected by geometric factors and calculates both components (Section 2.3.2 and Section 2.3.3, respectively). The above process is repeated for the representative days of the year proposed by Klein [42], subdividing each of these representative days into time intervals of 3 min that are depicted by the corresponding mean instant. In this way, the temporal integration of the irradiance at each point makes it possible to obtain the solar radiation at each point for the significant days of the year. Finally, when studying different geometries of photovoltaic installations, it is possible to correlate the radiation at each point and month with the position of each point on the ground (Section 3).
2.1. Astronomy Sun-Earth
For the astronomical characterization of the solar movement, the solar vector is used, which is defined as a unit vector permanently directed towards the solar disk. Equation (1) shows the mathematical expression of this vector in an Oxyz reference system in which, as shown in Figure 1, the Ox axis is directed to the west, the Oy axis to the south and the Oz axis to the zenith. According to Equation (1) it is observed that the solar vector depends on the latitude of the place on the solar declination (Equation (2)), which in turn depends on the daily angle (Equation (3)), and of the solar time , considering that at each solar noon.
2.2. Geometric Characterisation of the Study Facilities
Furthermore, for the geometric characterization of the possible agrivoltaic installation to be simulated, it is chosen to represent the corresponding PV plant that already exists and can be converted into agrivoltaic by means of a set of rectangles.
In this way, for a PV installation with collectors, a certain collector , with , is represented by a rectangle and is characterized by the coordinates of three of its vertices, , , and (Figure 2). From these vertices, according to Equations (4) and (5), the vectors and are defined which, together with the normal vector to the collector , given by the Equation (6), define the orientation of the collector.
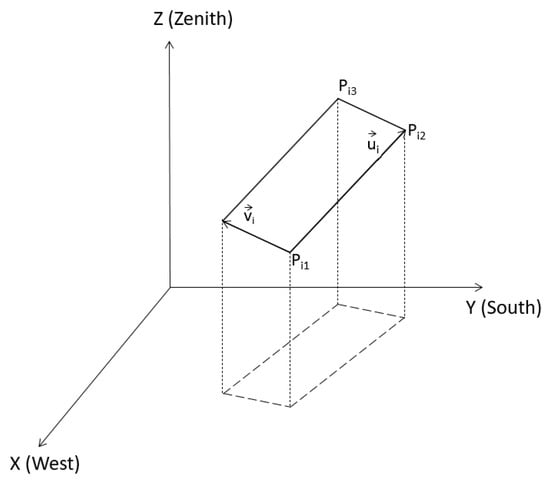
Figure 2.
Geometric representation of a manifold of index i from its vertices Pi1, Pi2, and Pi3.
According to the geometry described, for every collector , the corresponding vectors and must be perpendicular to each other, so Equation (7) must be verified.
2.3. Estimation of the Instantaneous Irradiance at Each Point on the Ground
Once the Earth-Sun motion and the simulated PV installation have been geometrically characterized, the model can be described, as in this section, for estimating global solar irradiance at any point P on the ground between collectors and which would be used for crop-growing in the event of the conversion of the PV plant into an agrivoltaic installation (Figure 1). This irradiance, on whose value the agricultural production of the agrivoltaic plant will depend, is given by the sum of three components: direct solar irradiance, diffuse solar irradiance, and reflected solar irradiance. Regarding the last of these components, it should be noted that this reflected irradiance would be the irradiance which, after reaching the ground, is reflected towards the back of the collectors and from there it is again reflected towards the ground. In that way, according to Amaducci et al. [2], this irradiance comes from the front face of the PV collectors, whose characteristic reflectance is very low , or from the back face, which in turn only receives reflected radiation. Therefore, being a double reflection and considering the low values of the reflection coefficients of the surfaces involved, it can be stated that this component would be very small compared to the direct and diffuse components. Consequently, in the presented model it is considered that the incident solar irradiance at point P will be the sum of the direct and diffuse components incident from the sky dome. In any case, the contribution of this reflected component would always be positive, so the results of the model would correspond to a conservative estimate that does not overestimate the irradiance received and, therefore, in no case would it involve an oversizing of the production of the agrivoltaic plant. Next, the calculation made by the model for the estimation of direct and diffuse solar irradiance is described.
2.3.1. Estimation of Direct and Diffuse Solar Irradiance on Horizontal Terrain without Obstructions
To estimate the solar irradiance incident on the agrivoltaic plant due to the interaction of this irradiance with the PV panels that it finds on its way from the sun to the farmland between the rows of collectors, the model presented considers as a starting point the direct and diffuse solar irradiance on unobstructed horizontal terrain. In this way, we start from the knowledge of the daily solar radiation and, in the first instance, the estimation of its direct components and diffuse is carried out so that Equation (8) is fulfilled
This decomposition of the daily solar radiation into its direct and diffuse components is carried out based on the Collares–Pereira model [43] which enables estimation of the daily diffuse radiation from the daily solar radiation by means of Equation (9).
This equation is a function defined in sections based on the values of the clarity index of given by Equation (10), where is the extraterrestrial solar radiation, dependent on the declination and the latitude of the place.
Once the diffuse radiation has been estimated, the Collares–Pereira model enables the values of solar irradiance and its diffuse and direct components to be obtained. Specifically, for the calculation of the solar irradiance Equations (11)–(15) are used where is the longitude of the place, is the length of the day and is the angular speed of rotation of the Earth
Similarly, the Collares–Pereira model enables calculation of the diffuse irradiance from the diffuse radiation using Equations (16) and (17).
From the solar irradiance and its diffuse component , the direct irradiance is given by Equation (18).
2.3.2. Estimation of Incident Direct Solar Irradiance in the Agrivoltaic Plant
Once the solar irradiance has been obtained on a horizontal plane without obstructions, from the analysis of the geometry of the agrivoltaic installation, the model allows estimation of the diffuse and direct solar irradiance that falls from the sky dome on the land between collectors enabled for crops in the agrivoltaic plant.
Regarding direct solar irradiance, as its name indicates, this component represents the irradiance coming from the direction of the solar disk and, therefore, that falls on P in the direction of the solar vector. In this way, it has to be considered only at the times when the direct solar rays hit point P, and not being blocked in their path by the PV panels. According to this, this component is given by Equation (19) in which the variable is defined in such a way that it takes the value 0 if point P is shaded and 1 if P is exposed to solar incidence.
To determine , we start by considering the vector that from P points to the Sun and that, therefore, is a vector parallel to the solar vector and with origin at point P. In this way, at a given instant of time, P will be shaded and will be null when a point Ii, resulting from the intersection of this vector with the plane containing collector is included in the rectangle that represents the collector (Figure 3b). On the contrary, if Ii is not included in the rectangular area of the collector, the direct irradiance reaches the point P which will not be shaded and will be equal to the unit (Figure 3a).
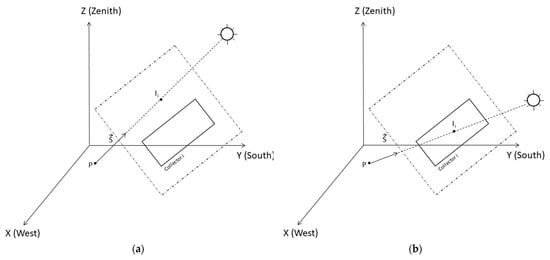
Figure 3.
Graphical representation of the geometric problem to be solved to determine if the point P is shaded. (a) Case where P is not shaded; (b) case where P is shaded.
It will therefore be necessary to analyze the possible intersections for each of the collectors. To perform this, according to the geometry of Figure 4, it is proposed to solve, for all the rectangles i that make up the PV installation, the system of Equation (20) by means of an iterative process in which the value of starts with 1 (situation of no shading) and will take the null value in the case of shading of point P.
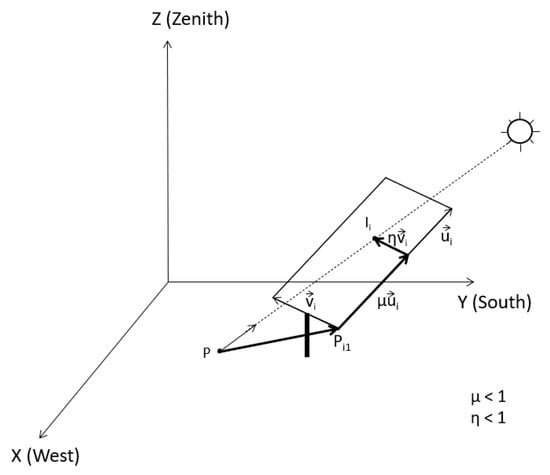
Figure 4.
Geometric representation of mathematical conditions for point P to be shaded.
Applying Cramer’s rules to solve this system of equations, the parameters , , and will be given by Equations (21)–(23).
In this way, the point P will be shaded when the conditions given by Equation (24) are fulfilled simultaneously.
2.3.3. Estimation of Incident Diffuse Solar Irradiance in the Agrivoltaic Plant
For the calculation of the solar irradiance that reaches the possible cultivation land between collectors coming from the entire sky dome and that is not direct, in this work the isotropic model is considered. This model assumes that at all times the radiance or brightness associated with any celestial direction is constant. Thus, if a diffuse irradiance (W/m2) is incident on an unobstructed horizontal, the model determines that the radiance in any direction is (W/m2sr). In this way, on tilted and/or partially obstructed surfaces, the incident diffuse radiation is given by Equation (25)
In this equation or sky view factor is a factor less than 1 that represents the fraction of incident irradiance at a point P due to the obstructions that such irradiance encounters on its way from the Sun to the incidence surface. In addition, this model has the advantage that can be estimated equal to the percentage of rays of the isotropic beam that emerge from the ground and reach the sky dome. Several authors have described the procedure for the construction of isotropic beams of rays [44]. In this work, the model that is used consists of rasterizing the surface of the horizontal unitary circle centered at point P into regular cells assigned the index (Figure 5). Considering the center of each cell , the direction of the ray associated with cell is given by the vector which is obtained mathematically from Equation (26). In this way, the isotropic beam of rays is obtained by going through the index all of the cells that are included in the circle of the base (Figure 5).
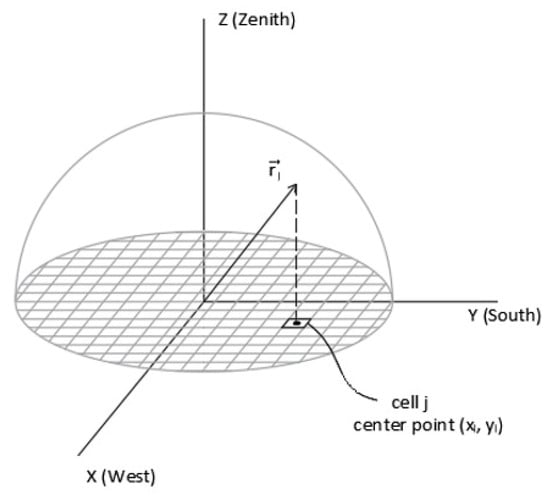
Figure 5.
Geometric construction to obtain the set of isotropic rays .
From the beam of isotropic rays, the procedure to check if a beam reaches the sky dome or is intercepted by any of the installation’s rectangles is identical to the procedure set out for calculating the interception of the solar ray in the previous section. In this way, the vision factor is calculated as the quotient between the rays that reach the sky dome without intercepting any collector and the total number of rays of the isotropic beam.
2.3.4. Estimation of Irradiance and Incident Solar Radiation in the Agrivoltaic Plant
Once the direct and diffuse components of the incident solar irradiance at point P, , have been estimated, the global irradiance received at a point P will be given by the sum of both (Equation (27)).
From the global solar irradiance, the daily solar radiation at each point is obtained by integrating Equation (26) over the time corresponding to the astronomical day (Equation (28)). However, this integration can be approximated by means of Equation (29), in which temporary increases are considered
The incident global solar radiation throughout the year at point P of the land between collectors and that would be dedicated to agricultural cultivation, , is obtained from the daily radiation estimated with Equation (29) for the twelve representative days of the year proposed by Klein [42], , in which each representative day belongs to each one of the twelve months of the year . In this way, the annual radiation in P is determined by Equation (30) in which represents the number of days of the month .
2.3.5. Description of Area Studied
The proposed methodology was applied to develop an exhaustive study of the radiative distribution on the field of photovoltaic installations with fixed collectors located in Córdoba, Spain (latitude = 37.916055° N; longitude = 4.672133° W). Cordoba was chosen as a study area because it is a region with an important agricultural activity where agroforestry could be an interesting proposal to combine agricultural and renewable energy production in a sustainable way. Cordoba is a region of the south of Spain (Figure 6) typical of a Mediterranean climate (‘Gossypium hot’ according to Papadakis’ classification of summer types [45]). From the point of view of agricultural production, the main crops in the Cordoba region are permanent crops of olive, almond, and pistachio trees, and extensive crops of wheat, sunflower, and cotton.
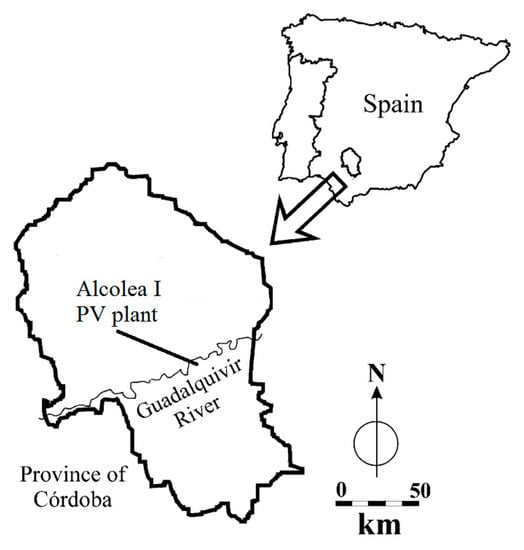
Figure 6.
Area of study.
Table 1 shows for each month the representative days of Klein [42] and the daily radiation data on a horizontal plane without obstructions in Córdoba. These radiation values were obtained as the average of the daily radiation values for the days of each month. Based on these data and the proposed methodology, the potential for conversion of grid-connected PV installations in Cordoba (Spain) into agrivoltaic plants was analyzed.

Table 1.
Daily radiation on the horizontal plane (H) in Córdoba (Spain) taken from Posadillo et al. [46], and representative day considered for each month [42].
3. Results
This section presents the results obtained by applying the proposed methodology to the previously described case study.
Figure 7 shows the main geometric variables that determine the geometry of the plants under study and that are considered for the simulation: width of collectors , height of supports of the collectors , angle of inclination of the collectors , distance between collectors , width of the lane not covered by the collectors and distance of a study point P with respect to the end of the lane . Likewise, Table 2 shows the intervals considered for the variation of each of these variables. It is necessary to point out that, based on the geometric similarity of the problem, the radiation values at a point P do not depend on the absolute values of the PV collector width , but on the relative values , , , . Consequently, the width of the PV collectors was considered constant, with a value , and only the remaining magnitudes were varied. In addition, it is important to note that, as can be seen from Figure 7, the variable depends on , , and according to Equation (31). Thus, although it is not explicitly included in Table 2, it varies likewise as , , and .
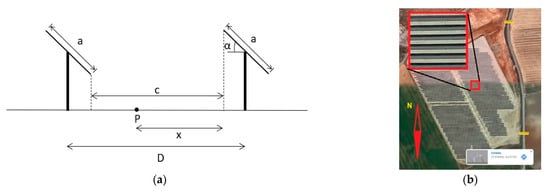
Figure 7.
(a) Geometric variables considered to define the geometry of the type of PV plant under study; (b) aerial photograph of type of installation.

Table 2.
Considered values of the design variables.
Likewise, it should be noted that, although the number of geometric combinations resulting from systematically crossing all the possibilities listed in Table 2 (5 values for , 7 values for and 12 values for ) is 420 , those combinations that imply an exposure without shade in the month of December of less than two hours were not considered. Thus, the number of geometric combinations considered in the simulation is 405 cases. For each of these 405 installations, the methodology described in epigraph 2 was applied in 11 significant points of the lanes between collectors and in the 12 representative days of the year, simulating, therefore, the solar irradiance , given by Equation (29), in 53,460 study cases. From these results, monthly distribution maps of incident solar radiation on the ground were generated for each of the facilities resulting from the combinations of geometric parameters.
By way of example, the results obtained for the “Alcolea 1” plant, whose design variables are included in the set contemplated in Table 2 (, , , ), are shown in Figure 8 and Figure 9. Specifically, Figure 8 shows the contour lines of the irradiance received at the agricultural plant in a three-dimensional representation. The representation includes the horizontal projection of the collector rows (represented by green rectangles) including the end of the rows, which makes it possible to appreciate the edge effect on the radiative reception at the collector end. Furthermore, this representation makes it easier to see the irradiance variation profile in the lanes between collectors. Thus, it can be seen that the irradiance reaches its maximum value in the central part of the lane between collectors. Similarly, Figure 9 shows a three-dimensional representation of the percentage reduction in the solar irradiance received by the agrivoltaic crop compared to that which would be received by a traditional crop without PV panels and, therefore, unaffected by the shade of the panels.
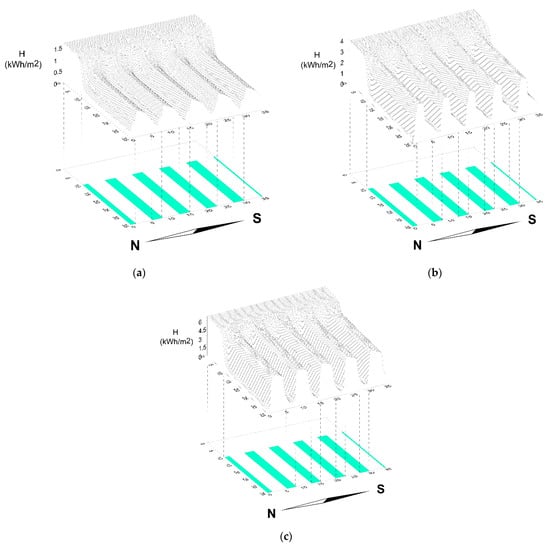
Figure 8.
Representation of solar radiation at the “Alcolea 1” installation by means of contour lines and three-dimensional representation on a synoptic day of (a) December, (b) March, (c) June.
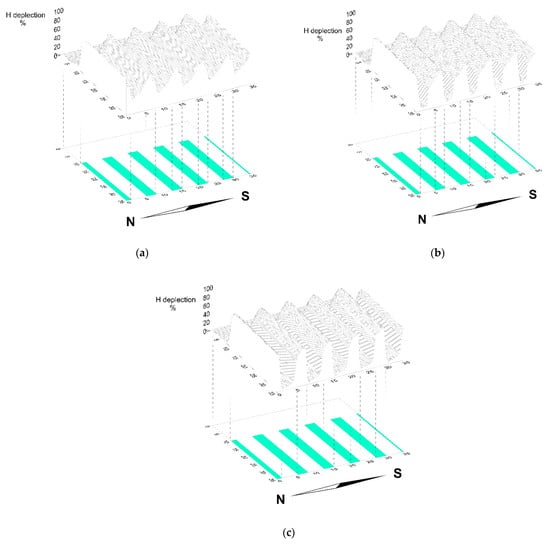
Figure 9.
Representation of solar irradiance reduction on agrivoltaic plant in comparison to a traditional crop without PV panels at the “Alcolea 1” installation on a synoptic day of (a) December, (b) March, (c) June.
Finally, in order to simplify and generalize the set of results obtained, a way of characterizing them mathematically was sought. In this sense, it should be remembered that the model described and used (for each of the 53,460 cases studied) can be considered as a mathematical function to obtain the radiation incidence variables from the initial geometric design values of the agrivoltaic installation. However, the complexity of the model and the need to add results on the different representative days makes it difficult, in principle, to know the weight or influence of each variable on the final results. Thus, to overcome this difficulty, in the present work a mathematical function of simple expression is proposed that allows the estimation, with an acceptable error, the influence of the different design variables considered in the final irradiance received in the crop field and, therefore, in the potential of the agrivoltaic plant. To do this, statistical methods were used to correlate the radiation values obtained in each of the 53,460 cases studied with the geometric variables of the corresponding PV installations, obtaining Equation (32). Specifically, Equation (32) shows the dependence on the design variables of the PV plant of the quotient between the incident solar radiation at point P of the agrivoltaic plant, HP, and the incident radiation at this point by not considering the obstructions derived from the PV panels, that is, the radiation values that are collected in Table 1. In this equation, , , , , , , , , , , and are the model coefficients
Table 3 shows the values obtained for these coefficients for the study carried out in Córdoba, together with the corresponding adjustment coefficient obtained. From these results, Equation (32) allows us to understand and quantify the effect of geometric variables on solar radiation at each point.

Table 3.
Coefficients corresponding to the adjustment of Equation (32) for the prediction of solar radiation in the space between PV collectors.
Thus, for example, the adjustment shows that within the crop lanes, the solar radiation in each month shows a relative decrease as the study points approach the south. Globally, when comparing the points at the northern end of the lanes with those at the southern end , Equation (32) establishes an increase in solar gain of 30%. of the north with respect to the south.
Similarly, the influence of the angle of tilt is also reflected in a global way. Thus, the coefficient is interpreted as the relative rate of daily radiation decay for all points of the crop space for each degree of increase in the module tilt.
With regard to the influence of the relative height of the modules compared to their width (), this influence is described by the coefficients and that reflect a decreasing dependence of the second degree. Thus, it can be interpreted that there is a relative radiation decrease rate with respect to . This rate (−0.803 + 0.738 · (h/a)) is not constant, but rather, in turn, depends on the ratio . Similarly, it occurs with respect to the dependence of the ratio . In this case, the coefficients and reflect a higher rate of increase in layouts with narrow lanes, since with the rate of increase is 1.26. However, for values of the rate of increase vanishes.
Finally, the values of and , both positive, mark the greatest penetration of solar radiation in the crop lanes at times when the declination angle is greatest.
The model expressed in Equation (32) can be improved by making 12 adjustments corresponding to each of the 12 representative days of the year. In all cases, an adjustment of the type expressed in Equation (32) is used. Thus, the explanatory variables would be the same as those used in (32) except for the declination δ on the synoptic days while the number of cases that each adjustment synthesizes is 4455 . Table 4 shows the adjustment coefficients obtained for each month.

Table 4.
Coefficients corresponding to the adjustment of Equation (32) for the prediction of solar radiation in the intercollector space for the representative day of each month of the year.
4. Conclusions
Agrivoltaics, defined as the combination of agricultural and photovoltaic production on the same land, has important advantages, including the following: it optimizes land yields [8,20,21], favors the expansion of photovoltaics without compromising food production [26], protects the crop from excess heat [13], benefits the water balance of the land [2], promotes a new, more sustainable and efficient agricultural system [25], and boosts the economy of rural areas [26]. For all these reasons, the expansion of this new agricultural model must be supported, since, together with other initiatives developed to incorporate renewable energies in the rural environment [15,16,17], it contributes to the fight against climate change [2,10]. However, this progress must go in parallel with the advancement of scientific and technical knowledge of the system [41] in order to identify its weaknesses and strengths, solving the former and strengthening the latter. In that sense, further studies of the behavior of crops under agrivoltaic conditions require an exhaustive knowledge of the spatial distribution of solar radiation within the portion of land between collectors allocated to crops [41].
In this work, a valid methodology was developed and presented to estimate this distribution in agrivoltaic installations. The method considers that the incident solar irradiance at a point on the ground is given by the sum of the direct and diffuse radiation, the reflected component being negligible (Equation (27)). Thus, the methodology for estimating both components is described, taking into account the geometry of the problem. Specifically, the beam component is defined as dependent of the factor which takes the value 0 if the point of interest is shaded and 1 if it is exposed to solar incidence (Equation (19)). Likewise, for the calculation of the diffuse component, it is considered as a starting hypothesis that this component is distributed isotropically in the sky dome. In this way, the sky view factor at each point on the ground can be estimated as the fraction of rays of an isotropic beam that, emerging from the point of study, reach the sky dome without intersecting with any of the collectors of the PV installation (Equation (25)). It is, therefore, a numerical method that determines the irradiance at the points of interest at certain times. From the irradiance, the incident radiation is obtained in certain periods of time by means of temporal integration (Equation (28)). In this way, the proposed methodology can help to assess the feasibility of transforming an existing PV plant with fixed collectors connected to the grid into an agrivoltaic plant by calculating the solar radiation incident on the streets between the rows of collectors that could be used for crop cultivation.
As the study of the agrivoltaic potential of already designed PV installations is currently of great interest, the presented methodology was applied to the study of the solar access of the spaces between collectors of fixed PV installations with fixed tilt on structures in the E–W direction (Figure 7b). In order to know the effect of the design variables of the PV plant on the distribution of radiation in the streets between collectors, a study of facilities in Córdoba, Spain (latitude = 37.916955° N; longitude = 4.672133° W) was carried out using the systematic crossing of design variables. This crossing gave rise to 53,460 simulations. In order to know, in a global and quantitative way, the influence of the design variables on the fraction of radiation incident on the ground between collectors, a simple mathematical adjustment (Equation (32)) between these variables was sought and the values were interpreted from the coefficients obtained. It is expected that the introduction of agricultural use within existing PV plants will not alter their electrical production, which can be estimated as a function of the installed collector power using the conversion ratio of 1650 kWh/kWp. Finally, the case of the “Alcolea 1” installation (Cordoba, Spain) was studied in greater depth, obtaining the profiles of the curves representing the decay of solar radiation that does not reach the crop when it is planted on the land between the rows of photovoltaic collectors that shade it.
The authors consider that the presented methodology is useful for the knowledge and design of the conversion of PV to agrivoltaic plants. In this line, in future works the agrivoltaic potential of PV plants with solar trackers will be studied.
Author Contributions
Conceptualization, R.L.-L.; methodology, R.L.-L. and J.S.P.-M.; software, R.L.-L. and L.M.F.-A.; validation, J.C.R.-F. and M.V.-M.; formal analysis, J.S.P.-M. and M.V.-M.; investigation, J.S.P.-M. and L.M.F.-A.; resources, J.C.R.-F. and F.J.G.-U.; data curation, J.S.P.-M., J.C.R.-F. and F.J.G.-U.; writing—original draft preparation, R.L.-L., J.C.R.-F. and M.V.-M.; writing—review and editing, L.M.F.-A. and M.V.-M.; visualization, J.S.P.-M. and F.J.G.-U.; supervision, R.L.-L. and M.V.-M.; project administration, J.C.R.-F.; funding acquisition, L.M.F.-A. All authors have read and agreed to the published version of the manuscript.
Funding
This research received no external funding.
Institutional Review Board Statement
Not applicable.
Informed Consent Statement
Not applicable.
Data Availability Statement
Not applicable.
Conflicts of Interest
The authors declare no conflict of interest.
References
- United Nations. World Population Prospects 2019; Department of Economic and Social Affairs: New York, NY, USA, 2019. [Google Scholar]
- Amaducci, S.; Yin, X.; Colauzzi, M. Agrivoltaic systems to optimise land use for electric energy production. Appl. Energy 2018, 220, 545–561. [Google Scholar] [CrossRef]
- IEA Photovoltaic Power Systems Programme. Snapshot of Global PV Markets 2021; IEA: Paris, France, 2021. [Google Scholar]
- International Energy Agency-IEA. Renewables 2020; IEA: Paris, France, 2020. [Google Scholar]
- Kavlak, G.; McNerney, J.; Trancik, J.E. Evaluating the causes of cost reduction in photovoltaic modules. Energy Policy 2018, 123, 700–710. [Google Scholar] [CrossRef]
- Victoria, M.; Haegel, N.; Peters, I.M.; Sinton, R.; Jäger-Waldau, A.; del Cañizo, C.; Breyer, C.; Stocks, M.; Blakers, A.; Kaizuka, I.; et al. Solar photovoltaics is ready to power a sustainable future. Joule 2021, 5, 1041–1056. [Google Scholar] [CrossRef]
- Goetzberger, A.; Zastrow, A. On the Coexistence of Solar-Energy Conversion and Plant Cultivation. Int. J. Sol. Energy 1982, 1, 55–69. [Google Scholar] [CrossRef]
- Dupraz, C.; Marrou, H.; Talbot, G.; Dufour, L.; Nogier, A.; Ferard, Y. Combining solar photovoltaic panels and food crops for optimising land use: Towards new agrivoltaic schemes. Renew. Energy 2011, 36, 2725–2732. [Google Scholar] [CrossRef]
- Marrou, H.; Wery, J.; Dufour, L.; Dupraz, C. Productivity and radiation use efficiency of lettuces grown in the partial shade of photovoltaic panels. Eur. J. Agron. 2013, 44, 54–66. [Google Scholar] [CrossRef]
- Weselek, A.; Ehmann, A.; Zikeli, S.; Lewandowski, I.; Schindele, S.; Högy, P. Agrophotovoltaic systems: Applications, challenges, and opportunities. A review. Agron. Sustain. Dev. 2019, 39, 35. [Google Scholar] [CrossRef]
- Majumdar, D.; Pasqualetti, M.J. Dual use of agricultural land: Introducing ‘agrivoltaics’ in Phoenix Metropolitan Statistical Area, USA. Landsc. Urban Plan. 2018, 170, 150–168. [Google Scholar] [CrossRef]
- M Homma, T.D.Y.Y. A field experiment and the simulation on agrivoltaic-systems regarding to rice in a paddy field. J. Jpn. Soc. Energy Resour. 2016, 37, 23–31. [Google Scholar] [CrossRef]
- Marrou, H.; Guilioni, L.; Dufour, L.; Dupraz, C.; Wery, J. Microclimate under agrivoltaic systems: Is crop growth rate affected in the partial shade of solar panels? Agric. For. Meteorol. 2013, 177, 117–132. [Google Scholar] [CrossRef]
- Dinesh, H.; Pearce, J.M. The potential of agrivoltaic systems. Renew. Sustain. Energy Rev. 2016, 54, 299–308. [Google Scholar] [CrossRef]
- Eichhorn, M.; Scheftelowitz, M.; Reichmuth, M.; Lorenz, C.; Louca, K.; Schiffler, A.; Keuneke, R.; Bauschmann, M.; Ponitka, J.; Manske, D.; et al. Spatial Distribution of Wind Turbines, Photovoltaic Field Systems, Bioenergy, and River Hydro Power Plants in Germany. Data 2019, 4, 29. [Google Scholar] [CrossRef]
- Kyriakopoulos, G.L. European and international policy interventions of implementing the use of wood fuels in bioenergy sector: A trend analysis and a specific wood fuels’ energy application. Int. J. Knowl. Learn. 2010, 1, 43–54. [Google Scholar] [CrossRef]
- Kolovos, K.G.; Kyriakopoulos, G.; Chalikias, M.S. Co-evaluation of basic woodfuel types used as alternative heating sources to existing energy network. J. Environ. Prot. Ecol. 2011, 12, 733–742. [Google Scholar]
- Mead, R.; Willey, R.W. The Concept of a ‘Land Equivalent Ratio’ and Advantages in Yields from Intercropping. Exp. Agric. 1980, 16, 217–228. [Google Scholar] [CrossRef]
- Elamri, Y.; Cheviron, B.; Lopez, J.M.; Dejean, C.; Belaud, G. Water budget and crop modelling for agrivoltaic systems: Application to irrigated lettuces. Agric. Water Manag. 2018, 208, 440–453. [Google Scholar] [CrossRef]
- Valle, B.; Simonneau, T.; Sourd, F.; Pechier, P.; Hamard, P.; Frisson, T.; Ryckewaert, M.; Christophe, A. Increasing the total productivity of a land by combining mobile photovoltaic panels and food crops. Appl. Energy 2017, 206, 1495–1507. [Google Scholar] [CrossRef]
- Marrou, H.; Dufour, L.; Wery, J. How does a shelter of solar panels influence water flows in a soil-crop system? Eur. J. Agron. 2013, 50, 38–51. [Google Scholar] [CrossRef]
- Cuppari, R.I.; Higgins, C.W.; Characklis, G.W. Agrivoltaics and weather risk: A diversification strategy for landowners. Appl. Energy 2021, 291, 116809. [Google Scholar] [CrossRef]
- Agostini, A.; Colauzzi, M.; Amaducci, S. Innovative agrivoltaic systems to produce sustainable energy: An economic and environmental assessment. Appl. Energy 2021, 281, 116102. [Google Scholar] [CrossRef]
- Brohm, R.; Khanh, N.Q. Dual-Use Approaches for Solar Energy and Food Production—International Experience and Potentials for Vietnam; Green Innovation and Development Centre (GreenID): Hanoi, Vietnam, 2018. [Google Scholar]
- Varo Martínez, M.; Fernández De Ahumada, L.M.; Fuentes García, M.; Fernandez García, P.; Casares De La Torre, F.; López-Luque, R. Characterization of an experimental agrivoltaic installation located in a educational centre for farmers in Cordoba (Spain). Renew. Energy Power Qual. J. 2022, 20, 111–115. [Google Scholar] [CrossRef]
- Fernández de Ahumada, L.M.; Varo-Martinez, M.; Lopez-Luque, R.; Ramírez-Faz, J.; Gomez-Uceda, J.; Casares de la Torre, F.J. New Tracking/Backtracking Strategy for Agrivoltaic Plants with N-S Horizontal Solar Trackers and Tree Crop in Hedge. In Proceedings of the 3rd World Congress on Agrivoltaic Systems, Piacenza, Italy, 15–17 June 2022. [Google Scholar]
- Wu, H.; Yuan, Y.; Zhu, J.; Qian, K.; Xu, Y. Potential Assessment of Spatial Correlation to Improve Maximum Distributed PV Hosting Capacity of Distribution Networks. J. Mod. Power Syst. Clean Energy 2021, 9, 800–810. [Google Scholar] [CrossRef]
- Gupta, R.; Pena-Bello, A.; Streicher, K.N.; Roduner, C.; Thöni, D.; Patel, M.K.; Parra, D. Spatial analysis of distribution grid capacity and costs to enable massive deployment of PV, electric mobility and electric heating. Appl. Energy 2021, 287, 116504. [Google Scholar] [CrossRef]
- Al-Saadi, H.; Zivanovic, R.; Al-Sarawi, S. New risk analysis considering spatial correlations among connected PVs for bidirectional distribution feeders. Int. Trans. Electr. Energy Syst. 2020, 30, e12319. [Google Scholar] [CrossRef]
- Zhu, H.; Wang, H.; Kang, D.; Zhang, L.; Lu, L.; Yao, J.; Hu, Y. Study of joint temporal-spatial distribution of array output for large-scale photovoltaic plant and its fault diagnosis application. Sol. Energy 2019, 181, 137–147. [Google Scholar] [CrossRef]
- Pukhrem, S.; Basu, M.; Conlon, M.F. Probabilistic Risk Assessment of Power Quality Variations and Events under Temporal and Spatial Characteristic of Increased PV Integration in Low-Voltage Distribution Networks. IEEE Trans. Power Syst. 2018, 33, 3246–3254. [Google Scholar] [CrossRef]
- Kawano, S.; Fujimoto, Y.; Wakao, S.; Hayashi, Y.; Takenaka, H.; Irie, H.; Nakajima, T.Y. Voltage Control Method Utilizing Solar Radiation Data in High Spatial Resolution for Service Restoration in Distribution Networks with PV. J. Energy Eng. 2017, 143, F4016003. [Google Scholar] [CrossRef]
- Ihsan, K.T.N.; Anggraini, T.S.; Adrian, M.; Rohayani, P.; Sakti, A.D. Spatial Modeling of Multi-Scenario Optimal Solar pv Power Plant Distribution to Support Indonesia’s Clean Energy Achievement Targets. ISPRS-Int. Arch. Photogramm. Remote Sens. Spat. Inf. Sci. 2022, 46, 119–126. [Google Scholar] [CrossRef]
- Tidwell, J.H.; Tidwell, A.; Nelson, S. Surveying the Solar Power Gap: Assessing the Spatial Distribution of Emerging Photovoltaic Solar Adoption in the State of Georgia, U.S.A. Sustainability 2018, 10, 4117. [Google Scholar] [CrossRef]
- Lin, A.; Lu, M.; Sun, P. The Influence of Local Environmental, Economic and Social Variables on the Spatial Distribution of Photovoltaic Applications across China’s Urban Areas. Energies 2018, 11, 1986. [Google Scholar] [CrossRef]
- Balta-Ozkan, N.; Yildirim, J.; Connor, P.M. Regional distribution of photovoltaic deployment in the UK and its determinants: A spatial econometric approach. Energy Econ. 2015, 51, 417–429. [Google Scholar] [CrossRef]
- Visser, L.; AlSkaif, T.; van Sark, W. Operational day-ahead solar power forecasting for aggregated PV systems with a varying spatial distribution. Renew. Energy 2022, 183, 267–282. [Google Scholar] [CrossRef]
- Lin, A.; Lu, M.; Li, C. On Spatial Distribution and Determinants of Urban Photovoltaic Utilization in China. Energy Procedia 2017, 134, 470–479. [Google Scholar] [CrossRef]
- Kwan, C.L. Influence of local environmental, social, economic and political variables on the spatial distribution of residential solar PV arrays across the United States. Energy Policy 2012, 47, 332–344. [Google Scholar] [CrossRef]
- Sun, T.; Shan, M.; Rong, X.; Yang, X. Estimating the spatial distribution of solar photovoltaic power generation potential on different types of rural rooftops using a deep learning network applied to satellite images. Appl. Energy 2022, 315, 119025. [Google Scholar] [CrossRef]
- Casares de la Torre, F.J.; Varo, M.; López-Luque, R.; Ramírez-Faz, J.; Fernández-Ahumada, L.M. Design and analysis of a tracking / backtracking strategy for PV plants with horizontal trackers after their conversion to agrivoltaic plants. Renew. Energy 2022, 187, 537–550. [Google Scholar] [CrossRef]
- Klein, S.A. Calculation of monthly average insolation on tilted surfaces. Sol. Energy 1977, 19, 325–329. [Google Scholar] [CrossRef]
- Collares-Pereira, M.; Rabl, A. The average distribution of solar radiation-correlations between diffuse and hemispherical and between daily and hourly insolation values. Sol. Energy 1979, 22, 155–164. [Google Scholar] [CrossRef]
- Torres, J.L.; García, A.; De Blas, M.; De Francisco, A. Calculation of the horizon brightness irradiance in the model of Perez using the unit-sphere method. Renew. Energy 2008, 33, 149–154. [Google Scholar] [CrossRef]
- Papadakis, J. El Clima: Con Especial Referencia a Los de AMÉRICA Latina, Península Ibérica, ex Colonias Ibéricas y Sus Potencialidades Agropecuarias; Albatros: Buenos Aires, Argentina, 1980. [Google Scholar]
- Posadillo, R.; López Luque, R. A sizing method for stand-alone PV installations with variable demand. Renew. Energy 2008, 33, 1049–1055. [Google Scholar] [CrossRef]
Publisher’s Note: MDPI stays neutral with regard to jurisdictional claims in published maps and institutional affiliations. |
© 2022 by the authors. Licensee MDPI, Basel, Switzerland. This article is an open access article distributed under the terms and conditions of the Creative Commons Attribution (CC BY) license (https://creativecommons.org/licenses/by/4.0/).