Article

Strip Tillage Improves Grain Yield and Nitrogen Efficiency in Wheat under a Rice–Wheat System in China

1
Jiangsu Key Laboratory of Crop Genetics and Physiology, Jiangsu Key Laboratory of Crop Cultivation and Physiology, Agricultural College of Yangzhou University, Yangzhou 225009, China
2
Co-Innovation Center for Modern Production Technology of Grain Crops, Wheat Research Institute, Yangzhou University, Yangzhou 225009, China
*
Author to whom correspondence should be addressed.
These authors contributed equally to this work.
Agronomy 2022, 12(11), 2698; https://doi.org/10.3390/agronomy12112698
Submission received: 26 September 2022 / Revised: 20 October 2022 / Accepted: 28 October 2022 / Published: 30 October 2022

Abstract

:
To characterize the adaptability of strip tillage for wheat production in a rice–wheat rotation system in China, a two-year experiment was conducted. Three methods of tillage and sowing were designed, including broadcast and drill sowing following full tillage (TS1 and TS2) as well as drill sowing following strip tillage (TS3), under two planting densities. Compared to TS2, TS1 only increased seedling tiller number (by 17%–54%) at the beginning of the over-wintering stage, while TS3 improved tiller number, leaf area, and shoot weight (by 17%–39%, 14%–15%, and 19%–27%, respectively), achieving individual seedlings with improved growth vigor. An increased planting density (300 vs. 225 plants m−2) significantly promoted culms, leaf area, and shoot weight per m2 seedlings (by 8%–14%, 7%–23%, and 11%–19%, respectively) under TS3, improving seedling growth quality. The present results indicate that vigorous seedling growth promoted the potential and synergy of the source and sink (maximum leaf area, grains per m2, and sink–source ratio), thereby increasing grain yield. Furthermore, TS3 promoted nitrogen (N) uptake (by 7%–9%) compared with TS1 and TS2. The present study highlights the good adaptability and applicability of strip tillage for the environmentally conscious and efficient production of wheat in rice–wheat rotation systems.

1. Introduction

Tillage practice directly involves the treatment of previous crop residues and the selection of seeding methods, thereby determining seedling emergence and growth and grain yield formation. The dominant tillage methods in wheat production include rotary tillage, plow tillage, and no-tillage; the former two methods are generally used for the full tillage of the whole field. The use of the tillage method depends on numerous factors relating to production, ecology, economics, and society, each of which is associated with its advantages and disadvantages in wheat production [1,2,3].
Full tillage is conducive to breaking hardpan, mixing crop residues with soil to improve soil porosity, as it promotes the extension of the roots into the subsoil, which contributes to nutrient uptake and wheat yield improvement [1,4,5,6,7]. In arid regions, however, loose soil leads to the rapid evaporation of soil moisture, negatively affecting water use and crop growth [8]. Full tillage can easily result in deep sowing, which makes plants susceptible to high soil moisture, likely causing hypoxia stress [4,9]. No-tillage can stabilize soil structure to reduce water evaporation and improve drought resistance [10,11,12], but it increases the mechanical impediment of the surface soil, thereby limiting the root distribution in the upper soil profile and downward progression [13,14]. However, no-tillage tends to result in shallow sowing, abundant shallow roots, and enriched nutrients in the topsoil [15,16,17], which can help resist soil waterlogging in high-rainfall regions [4,15,18]. In addition, there is low seedling emergence in no-tillage soil due to high bulk density and shallow sowing [19,20,21]. To reduce the weaknesses of no-tillage practice, strip tillage has been proposed as an alternative, which allows for proper seedbed preparation and ensures more favorable conditions for seed germination compared with direct seeding in no-tillage soil [22]. Strip tillage, as a practice of minimal tillage, disturbs the soil in the narrow strip where the seeds are sown. Strip tillage is an environmentally friendly technology that has become increasingly popular, as it reduces the working time and production costs and protects soil compared with full tillage, and it also has the advantages of no-tillage and full tillage [22]. Many studies have reported the effects and successes of strip tillage on wheat production in arid and semi-arid areas [8,23]; however, studies on strip tillage in high-precipitation areas are lacking.
The middle and lower reaches of the Yangtze River Basin (YRB) in China is a typical high-rainfall area with abundant solar and thermal resources, where a rice–wheat rotation system (RWRS) is employed. Traditional rice management practices of puddling, transplanting, and flooding have helped produce high yields of rice, resulting in high soil moisture and a sticky soil texture after rice harvesting [20,24,25]. It is difficult to conduct the full tillage in such poor soil. The poor soil brings the issues of low emergence, weak seedlings, and disappointingly low grain yield [4,26]. In addition, frequent rainfall occurred during the seeding and seedling stages, increasing the risk of waterlogging stress in tillage soil [25], which inhibits root growth, nutrient uptake, and leaf photosynthetic capacity [27,28,29]. In contrast to full tillage, no-tillage has been reported to help produce vigorous seedlings and achieve high yields in high-precipitation YRB areas [4,9].
To resolve the aforementioned issues in wheat production, a two-year experiment was conducted to: (1) identify whether the strip tillage could improve seedling growth, grain yield, and nitrogen uptake and use; (2) investigate the effects of planting density; (3) characterize the mechanisms underlying how strip tillage increases the grain yield. The expected results could provide support for the application of strip tillage in the rice–wheat rotational production system.

2. Materials and Methods

2.1. Experimental Site Description

The experiment was conducted at the Hongchang Farm in Jiangyan City in China (32°51′ N, 120°15′ E) during the wheat-growing seasons of 2018–2019 (2019) and 2019–2020 (2020). This experimental site is classified as a humid north subtropical monsoon climate and is located within a typical RWRS region [30]. The precipitation amount and average temperature per month from sowing to maturity during the two wheat-growing seasons, which were provided by the local meteorological bureau, are shown in Figure 1.
A field that had adopted a rice–wheat rotation system and straw return/retain in full amount for over 10 years was used. The management practices in the rice-growing seasons include conventional puddling, transplanting, and flooding. This causes the soil bulk density to be up to 1.4–1.5 g cm−3 in the 0–10 cm soil layers and 1.5–1.7 g cm−3 in the 10–20 cm soil layers before tillage practice in the wheat seasons. The soil bulk density was measured using the soil samples collected in a 100 cm3 volume cylinder [31]. The soil was sampled using a five-point sampling method. The chemical components in the 0–20 cm soil layer consist of 40.9 g kg−1 organic carbon, 162.6 mg kg−1 available nitrogen, 40.7 mg kg−1 available phosphorus, and 123.0 mg kg−1 available potassium in 2019, and 48.1 g kg−1 organic carbon, 194.5 mg kg−1 available nitrogen, 41.2 mg kg−1 available phosphorus, and 206.0 mg kg−1 available potassium in 2020. Organic carbon was determined by the external heating oxidation, available nitrogen by the alkaline solution diffusion method (sulfuric acid solution titrates the ammonia absorbed by boric acid), available phosphorus by the NaHCO3 extraction colorimetric method, and available potassium by the NH4OAc extraction and flame photometer [31]. The soil moisture during tillage and sowing reached 85% of soil water content at field capacity due to the high rainfall after rice harvesting in 2019, and during the seedling growth period, the precipitation was also excessive, leading to the soil becoming wet. In 2020, the soil during tillage and sowing was dry, the moisture of which was only 59% of soil water content at field capacity, and irrigation was practiced to ensure seedling emergence, thus resulting in wet soil conditions during the seedling stage along with occasional high rainfall.

2.2. Experimental Design

Yangmai25 was chosen as the experimental material. It was bred by the Jiangsu Lixiahe Agricultural Research Institute and widely cultivated in the YRB region. The rice was harvested by a head-feeding type combined harvester with a straw cutter and separating system to evenly shred (approximately 5 cm) and spread the straw. The rice stubble was <5 cm above the ground. The amount of rice residue incorporation was 9 t ha−1 according to the field measurement.
The experiment combined three methods of tillage and sowing and two planting densities using a spilt-plot design with three times replicates. The planting density as the main plot included 225 plants m−2 (low planting density, LPD) and 300 plants m−2 (high planting density, HPD). The method of tillage and sowing as the subplot included full rotary tillage twice and sowing with a broadcast seeder (TS1), full rotary tillage twice and sowing with a drill seeder (TS2), and no-tillage and sowing with a strip-tillage seeder (TS3). The rotary tillage practice used a professional machine that achieved full tillage with a depth of 12–15 cm. The strip-tillage seeder was equipped with a rotary tillage device that drilled holes of 40 mm width and 3–4 cm depth before seeding. The model, operation procedure, and features of these seeders are shown in Table S1. The average area of the subplots was 44 m2, with slight differences depending on the working range of the seeders. The planting date for the two wheat seasons was 1st November. The seeding rates were 163 kg ha−1 and 217 kg ha−1, respectively, and at the 3-leaf stage, seedlings were removed by hand to achieve the designated planting density of 225 and 300 plants m−2 in three 1 m2 areas in each subplot.
Nitrogen (N) fertilizer was applied before sowing and at jointing stages at a rate of 135 and 90 kg ha−1, respectively. Furthermore, 120 kg ha−1 of phosphorus (P2O5) and potassium (K2O) fertilizers were divided into two equal parts and applied before sowing and at jointing stages [32,33]. Only inorganic compound fertilizers (containing 15% N, 15% P2O5, and 15% K2O) and urea (containing 46% N) were preferentially used, and phosphorus pentoxide (containing 12% P2O5) and potassium chloride (containing 60% K2O) were added to meet the fertilizer requirements. The control was the treatment without N application. Herbicides, pesticides, and fungicides were sprayed according to standard growing practices to avoid yield loss. Wheat was harvested on 3 June 2019, and 4 June 2020.

2.3. Sampling and Measurements

2.3.1. Seedling Growth

At the beginning of the over-wintering stage (the five-leaf stage in both years), 30 seedlings were sampled within a 1 m2 area of each treatment. Tillers per seedling were investigated to calculate the culms per m2 of seedlings. The plants were separated into green leaf blades and other organs. The leaf area per seedling and per m2 seedlings were measured using a leaf area meter (LI-3000, Li-Cor Inc., Lincoln, NE, USA). All samples were dried at 70 °C to a constant weight to determine the shoot weight per seedling and per m2 seedlings.

2.3.2. Grain Yield and Its Components

At the milk-ripening stage, 100 spikes were continuously sampled to investigate the grains per spike. At the maturity stage, the spike number per m2 was counted and harvested. The grains were dried naturally after threshing to measure grain weight and were counted to determine the 1000-grain weight. The grain moisture was measured by a grain analyzer (Infratec™ 1241, Foss, Hillerod, Denmark). The 1000-grain weight and grain yield were converted into 13% moisture content.

2.3.3. Maximum Leaf Area and Sink–Source Ratio

At the booting stage, 30 plants were sampled and the green leaves were separated to measure leaf area using a leaf area meter (LI-3000, Li-Cor Inc., Lincoln, NE, USA). The leaf area at the booting stage was used to represent the maximum leaf area. The sink–source ratio reflects the source and sink relationship and is the ratio of grains to maximum leaf area per m2.

2.3.4. N Accumulation and Use Efficiency

At the maturity stage, 30 plant samples were separated into leaves, stems (culms and sheaths), spikes, vegetative components, and grains. The samples were dried at 70 °C until a constant weight was achieved to determine organ weight. Each dried sample was ground into powder to measure the N concentration using the indophenol blue method [34]. N accumulation in various organs was calculated based on the organ weight and N concentration. Total N accumulation represents the N accumulation in the whole plant. N accumulation in crop residues represents the straw N left (total N accumulation minus grain N accumulation) in the field, which can be used by the following crop. The parameters referring to nitrogen efficiency were defined as follows [35]:
NUE (kg kg−1) = (GYt − GYb)/NR,
NUpE (%) = (NAt − NAb)/NR,
NUtE (kg kg−1) = (GYt-GYb)/(NAt − NAb),
where GYt and GYb refer to grain yield under the treatments and under the control condition without N application, NAt and NAb refer to total nitrogen accumulation under treatments and under the control condition without N application, and NR is the applied nitrogen rate.

2.3.5. Soil N Residue

The 0–20, 20–40, and 40–60 cm soil samples were extracted at the maturity stage in each treatment plot by the five-point sampling method. The soil samples were dried naturally and then ground to pass through a 0.15 mm sieve. The soil N content representing the soil N residue was determined using the alkali-hydrolyzed diffusion method [31].

2.4. Statistical Analysis

The software Data Processing System 7.05 (DPS, Hangzhou, Zhejiang, China) was used for all statistical analyses. Normality and homogeneity of variance were verified using a Shapiro–Wilk normality test and Levene’s test, respectively. Analysis of variance in each year was used to determine the significance of planting density and method of tillage and sowing and their interaction on wheat seedling growth, source and sink performances, N uptake and use, soil N residue, and grain yield and its components according to the model of a split-plot design. Significant differences in the above parameters were found between year and year × treatment interaction, and thus the analysis of variance was conducted separately in each year. The least significant difference test (p ≤ 0.05) was used to analyze the differences among treatments. Pearson’s correlation analyses were performed to calculate the correlation coefficients of source and sink performances with seedling growth and grain yield.

3. Results

3.1. Seedling Growth

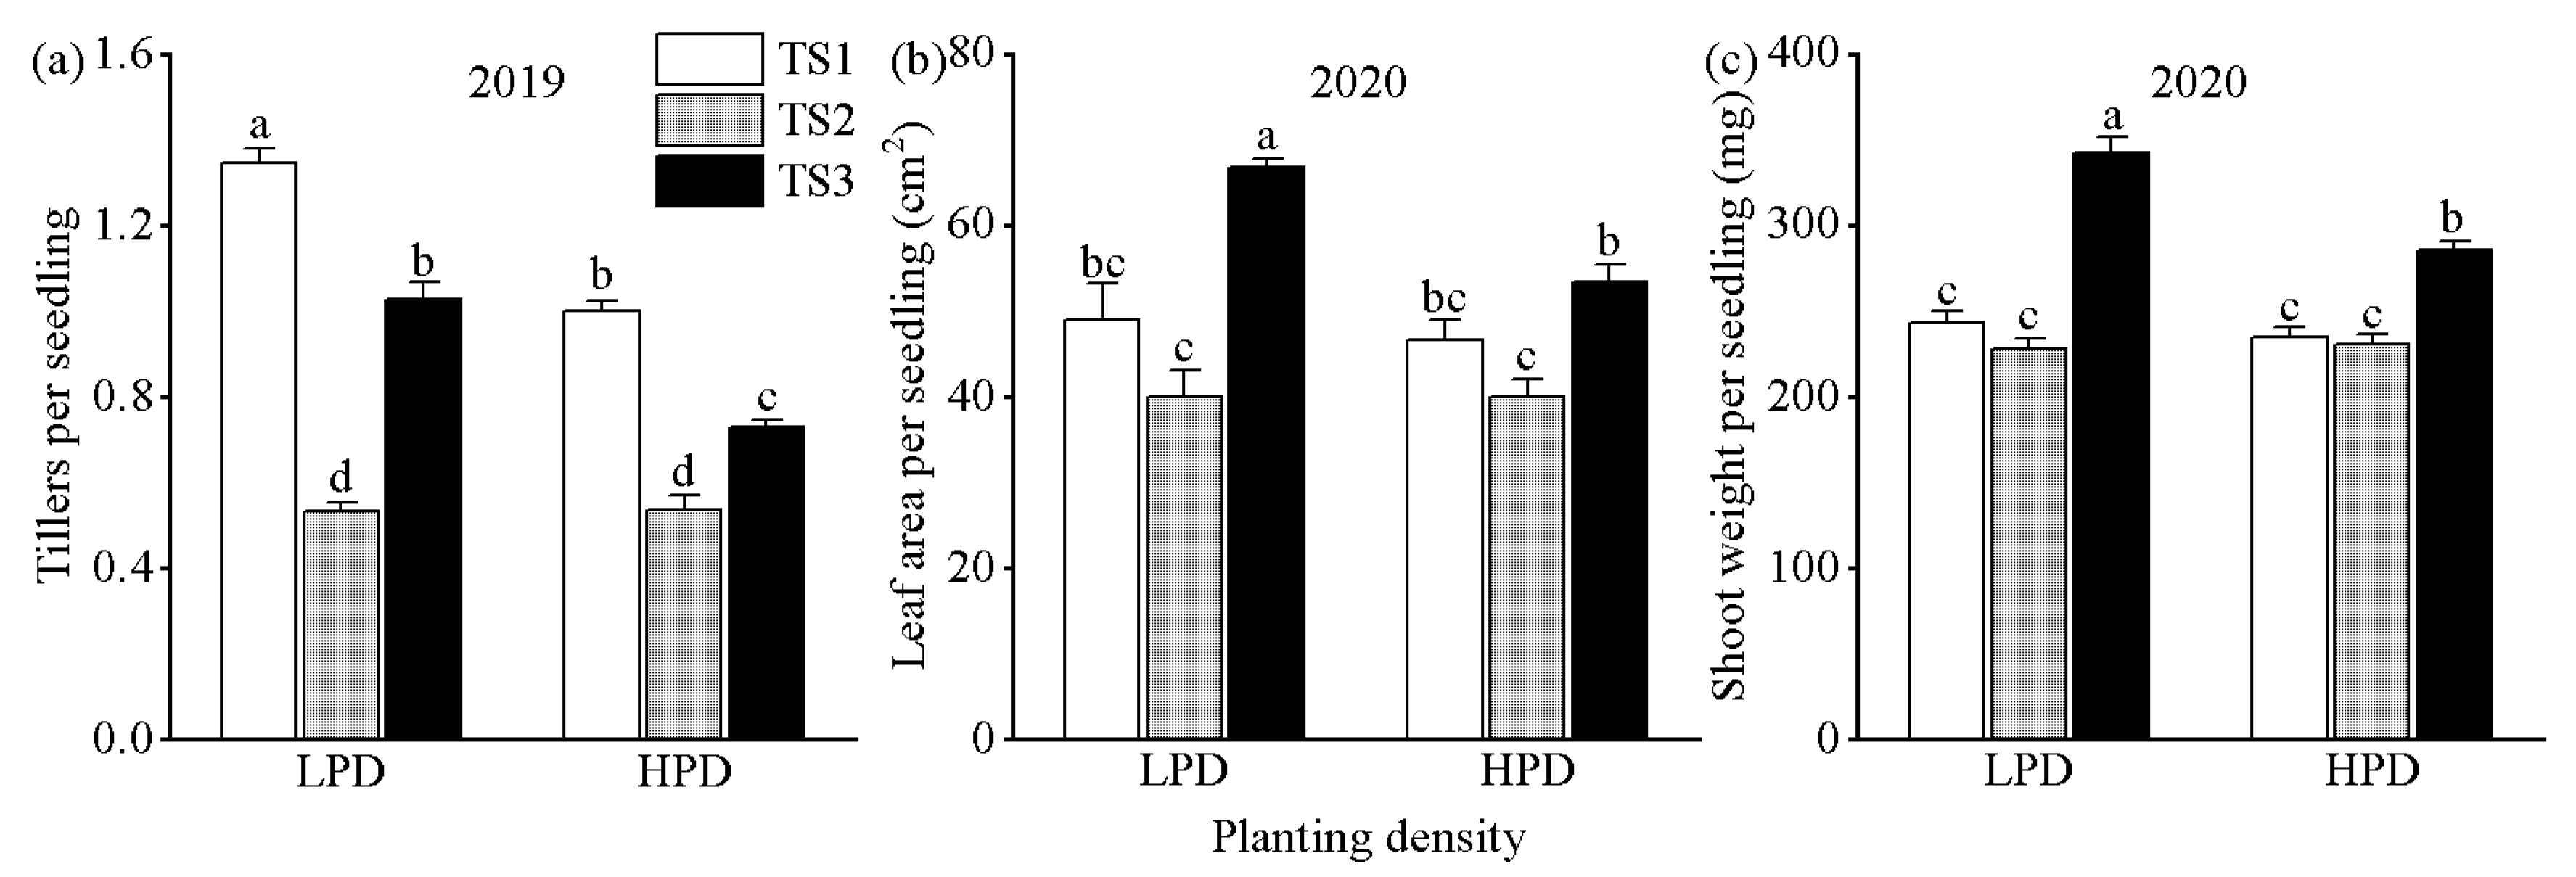
Planting density and the tillage and sowing method significantly affected most of the seedling-growth parameters (Table S2). LPD significantly increased the tillers per seedling compared to HPD (by 22% and 29% in 2019 and 2020, respectively), and achieved a higher leaf area and shoot weight per seedling (by 12% and 13%) only in 2019. However, HPD significantly increased the culms, leaf area, and shoot weight per m2 seedlings (by 19%, 29%, and 18% in 2019, respectively, and by 7%, 20%, and 23% in 2020) (Table 1). TS1 and TS3 promoted culms per m2 seedlings and tillers per seedling than TS2 (by 10%–28% and 17%–54%, respectively, over two years), and significantly more culms per m2 seedlings and tillers per seedling (by 14% and 16%) under TS1 than TS3 in 2019. However, TS3 achieved a higher leaf area and shoot weight per m2 seedlings and per seedling compared with the other treatments, only with a similar leaf area observed between TS1 and TS3 in 2019. This indicated that TS1 could stably promote tiller number, while TS3 contributed to seedling growth vigor.
Significant interactions between planting density × method of tillage and sowing were found in the tillers per seedling in 2019 and leaf area and shoot weight per seedling in 2020 (Table S2). The results show that LPD greatly increased the tillers per seedling under TS1 and TS3 compared with HPD but not under TS2 in 2019, and LPD only significantly improved the leaf area and shoot weight per seedling under TS3 in 2020, with no differences under TS1 and TS2 (Figure 2).

3.2. Grain Yield and Its Components

Grain yield in 2020 was 15.6% higher on average than in 2019. Planting density only significantly impacted grain yield in 2020, and the method of tillage and sowing significantly affected grain yield and yield components in the two years, except for 1000-grain weight in 2019 and spike number per m2 in 2020 (Table S3). HPD contributed to a higher 7% grain yield compared to LPD in 2020, due to slight improvements of 5% and 2% in spike number and grain weight (Table 2). TS1 and TS3 increased grain yield (by 9%–14%) compared to TS2 in both years, and no great difference was observed between TS1 and TS3. The highest spike number per m2 was detected under TS1 compared with other methods, but no great differences were detected between TS1 and TS2 in 2019 and between TS1 and TS3 in 2020. The highest grains per spike was achieved by TS3 in both years. The 1000-grain weight was not significantly different among the methods of tillage and sowing in 2019, and the highest was detected under TS1 in 2020 (Table 2).
Significant interactions between planting density × method of tillage and sowing were found in 1000-grain weight in the two years (Table S3). The results show that TS1 hardly achieved a higher 1000-grain weight compared with other methods under LPD, but it obtained a higher 1000-grain weight under HPD (Figure 3).

3.3. Source and Sink Performances

HPD significantly improved the maximum leaf area (by 10%) compared to LPD in 2020, but there was no significant difference detected in 2019 (Table S3). The method of tillage and sowing significantly changed the maximum leaf area and grains per m2 in the two years (Table 3). TS1 and TS3 increased the maximum leaf area and grains per m2 compared to TS2 (by 7%–9% and 9%–14%, respectively), except there were similar maximum leaf area and grains per m2 values between TS1 and TS2 in 2020 (Table 3). The treatments did not significantly impact the sink–source ratio in the two years, and there were no significant interactions on the above-mentioned parameters between planting density × method of tillage and sowing in both years (Table S3).

3.4. Relationships of Seedling Growth with Source and Sink Performances

The culms, leaf area, and shoot weight per m2 seedlings were closely correlated with maximum leaf area, except that the correlations of leaf area and shoot weight per m2 seedlings with maximum leaf area did not reach a significant level in 2020 (Figure 4a–c). The culms per m2 seedlings were correlated with grains per m2 but did not reach a significant level in 2019 (Figure 4g). The tillers, leaf area, and shoot weight per seedlings were closely related to the sink–source ratio, but the correlations of the sink–source ratio with tillers per seedling in 2019 and leaf area and shoot weight per seedlings in 2020 did not reach a significant level (Figure 4d–f).

3.5. Relationships of Source and Sink Performances with Grain Yield

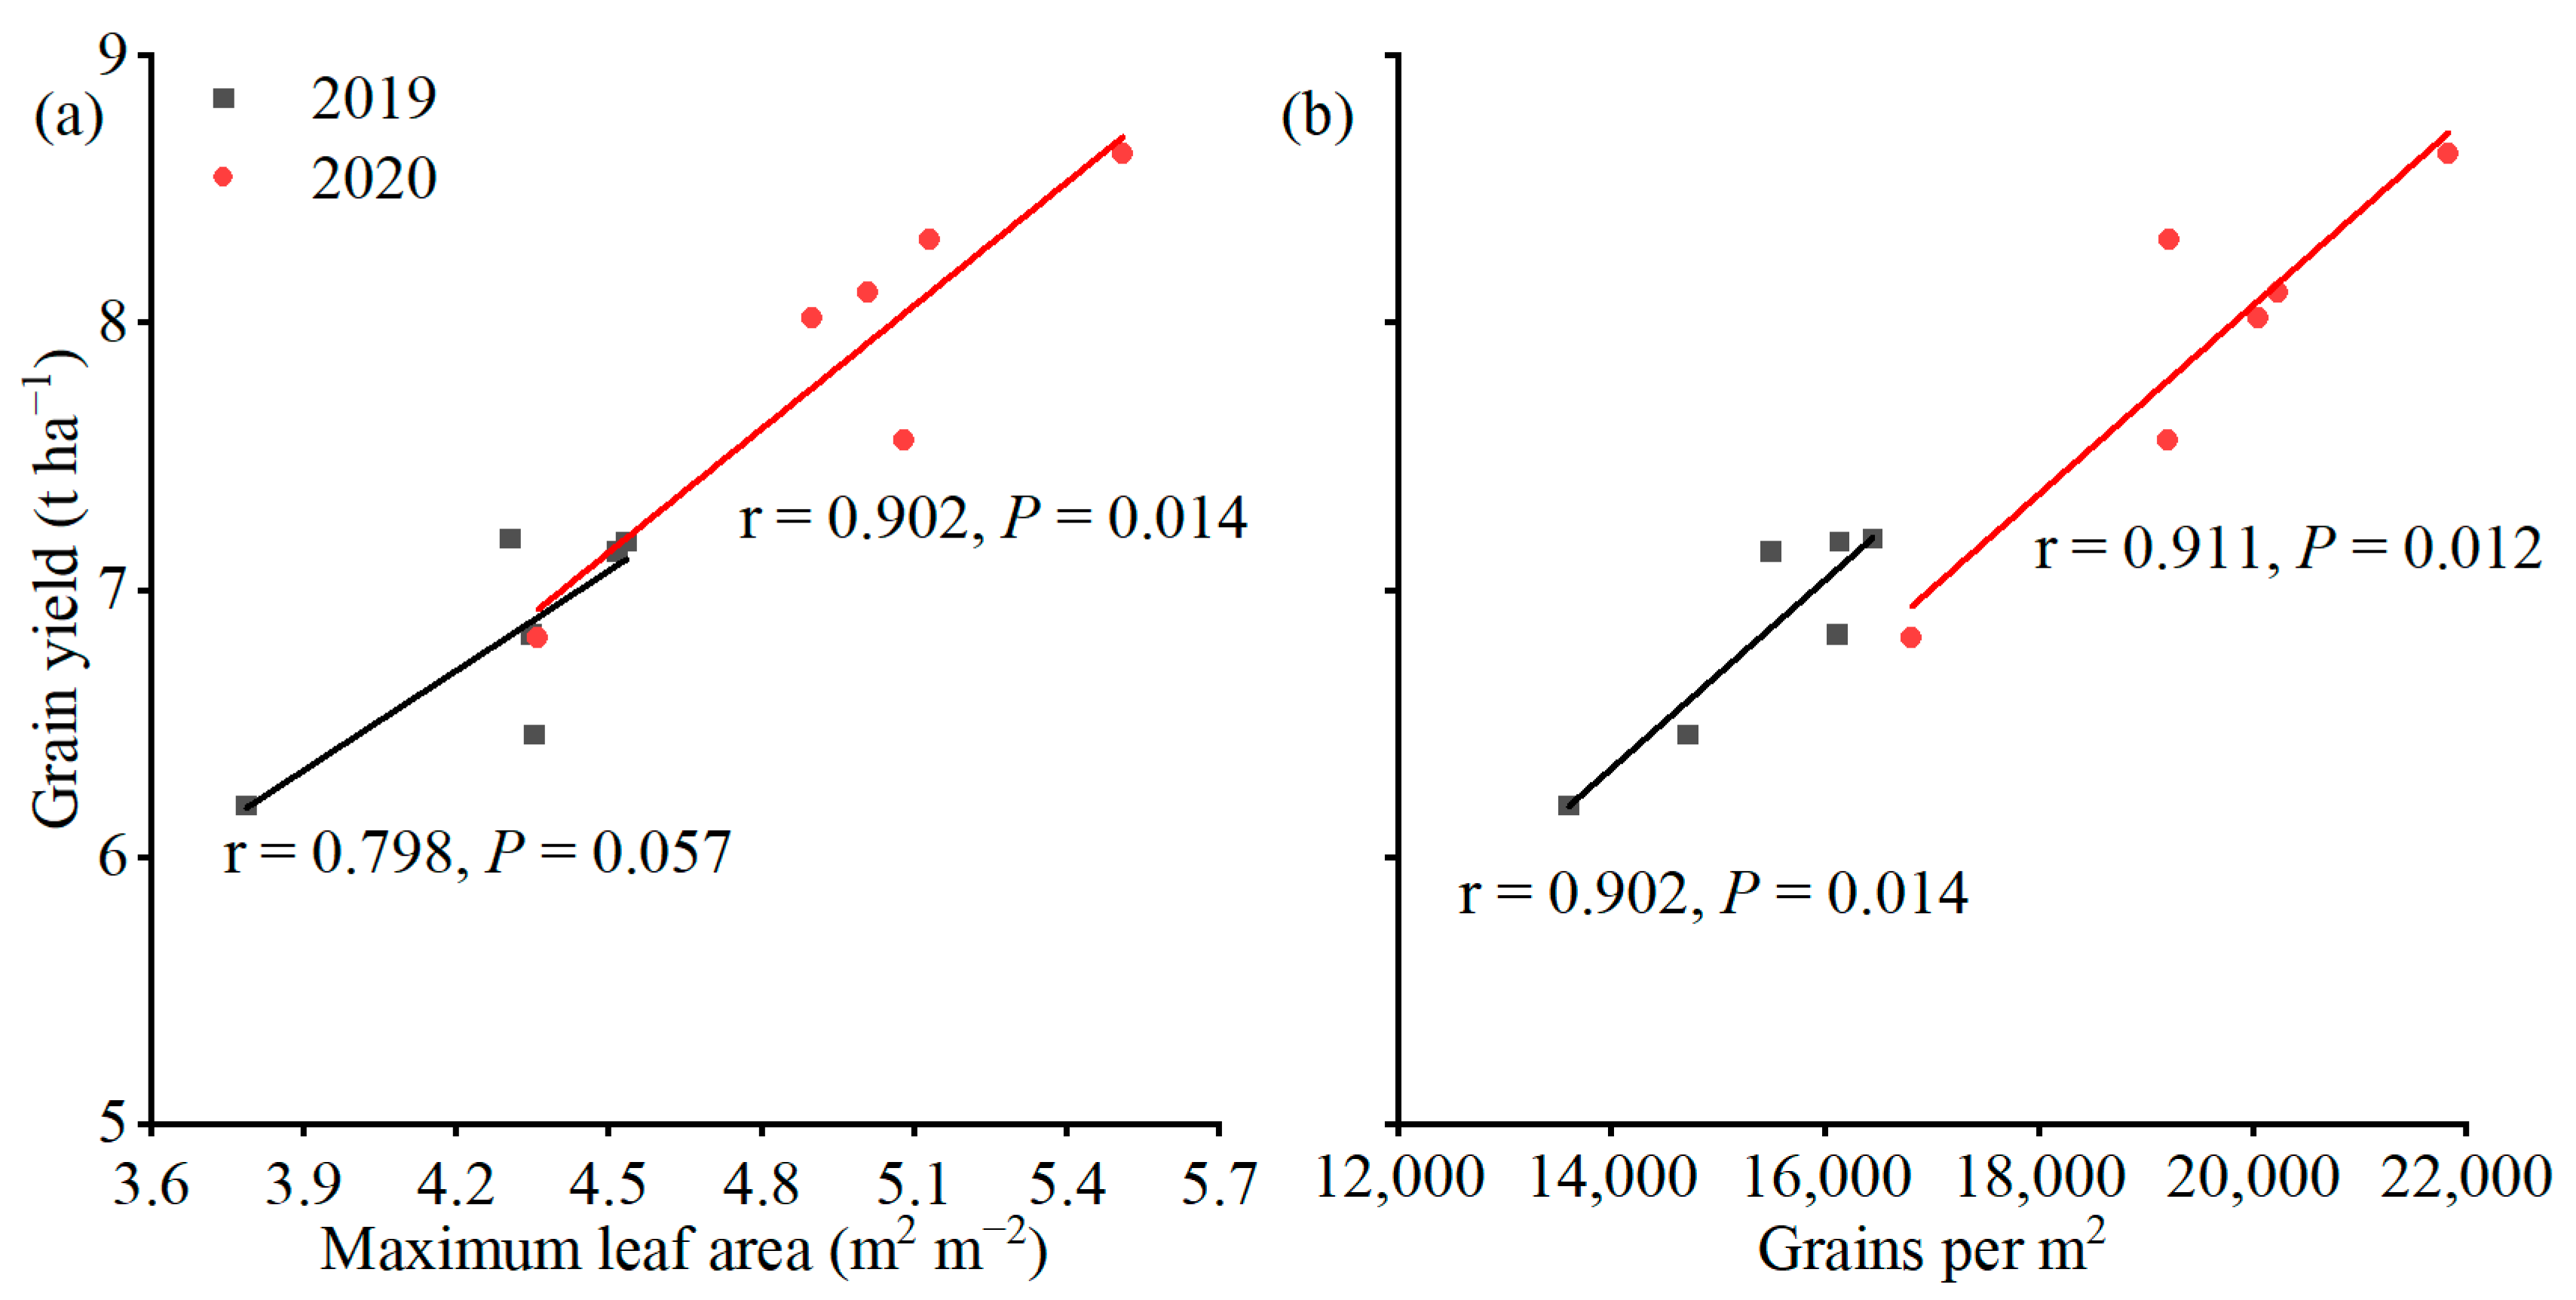
As shown in Figure 5, the increasing maximum leaf area and grains per m2 could improve grain yield, though the correlations of maximum leaf area with grain yield were not significant in 2019.

3.6. N Accumulation

Planting density significantly affected grain N accumulation in 2020, and the method of tillage and sowing significantly affected total and grain N accumulation in the two years and crop residue N accumulation only in 2019; however, there were no significant interactions of these parameters between the treatments (Table S4). HPD significantly promoted grain N accumulation (by 7%) compared to LPD in 2020 (Table 4). TS3 achieved the highest total, grains, and crop residue N accumulation compared with the other methods in the two years, though the difference in crop residues was not great. These parameters were similar between TS1 and TS2, except that the total N accumulation under TS1 was significantly higher (by 5%) in 2020 (Table 4).

3.7. N-Use Efficiency

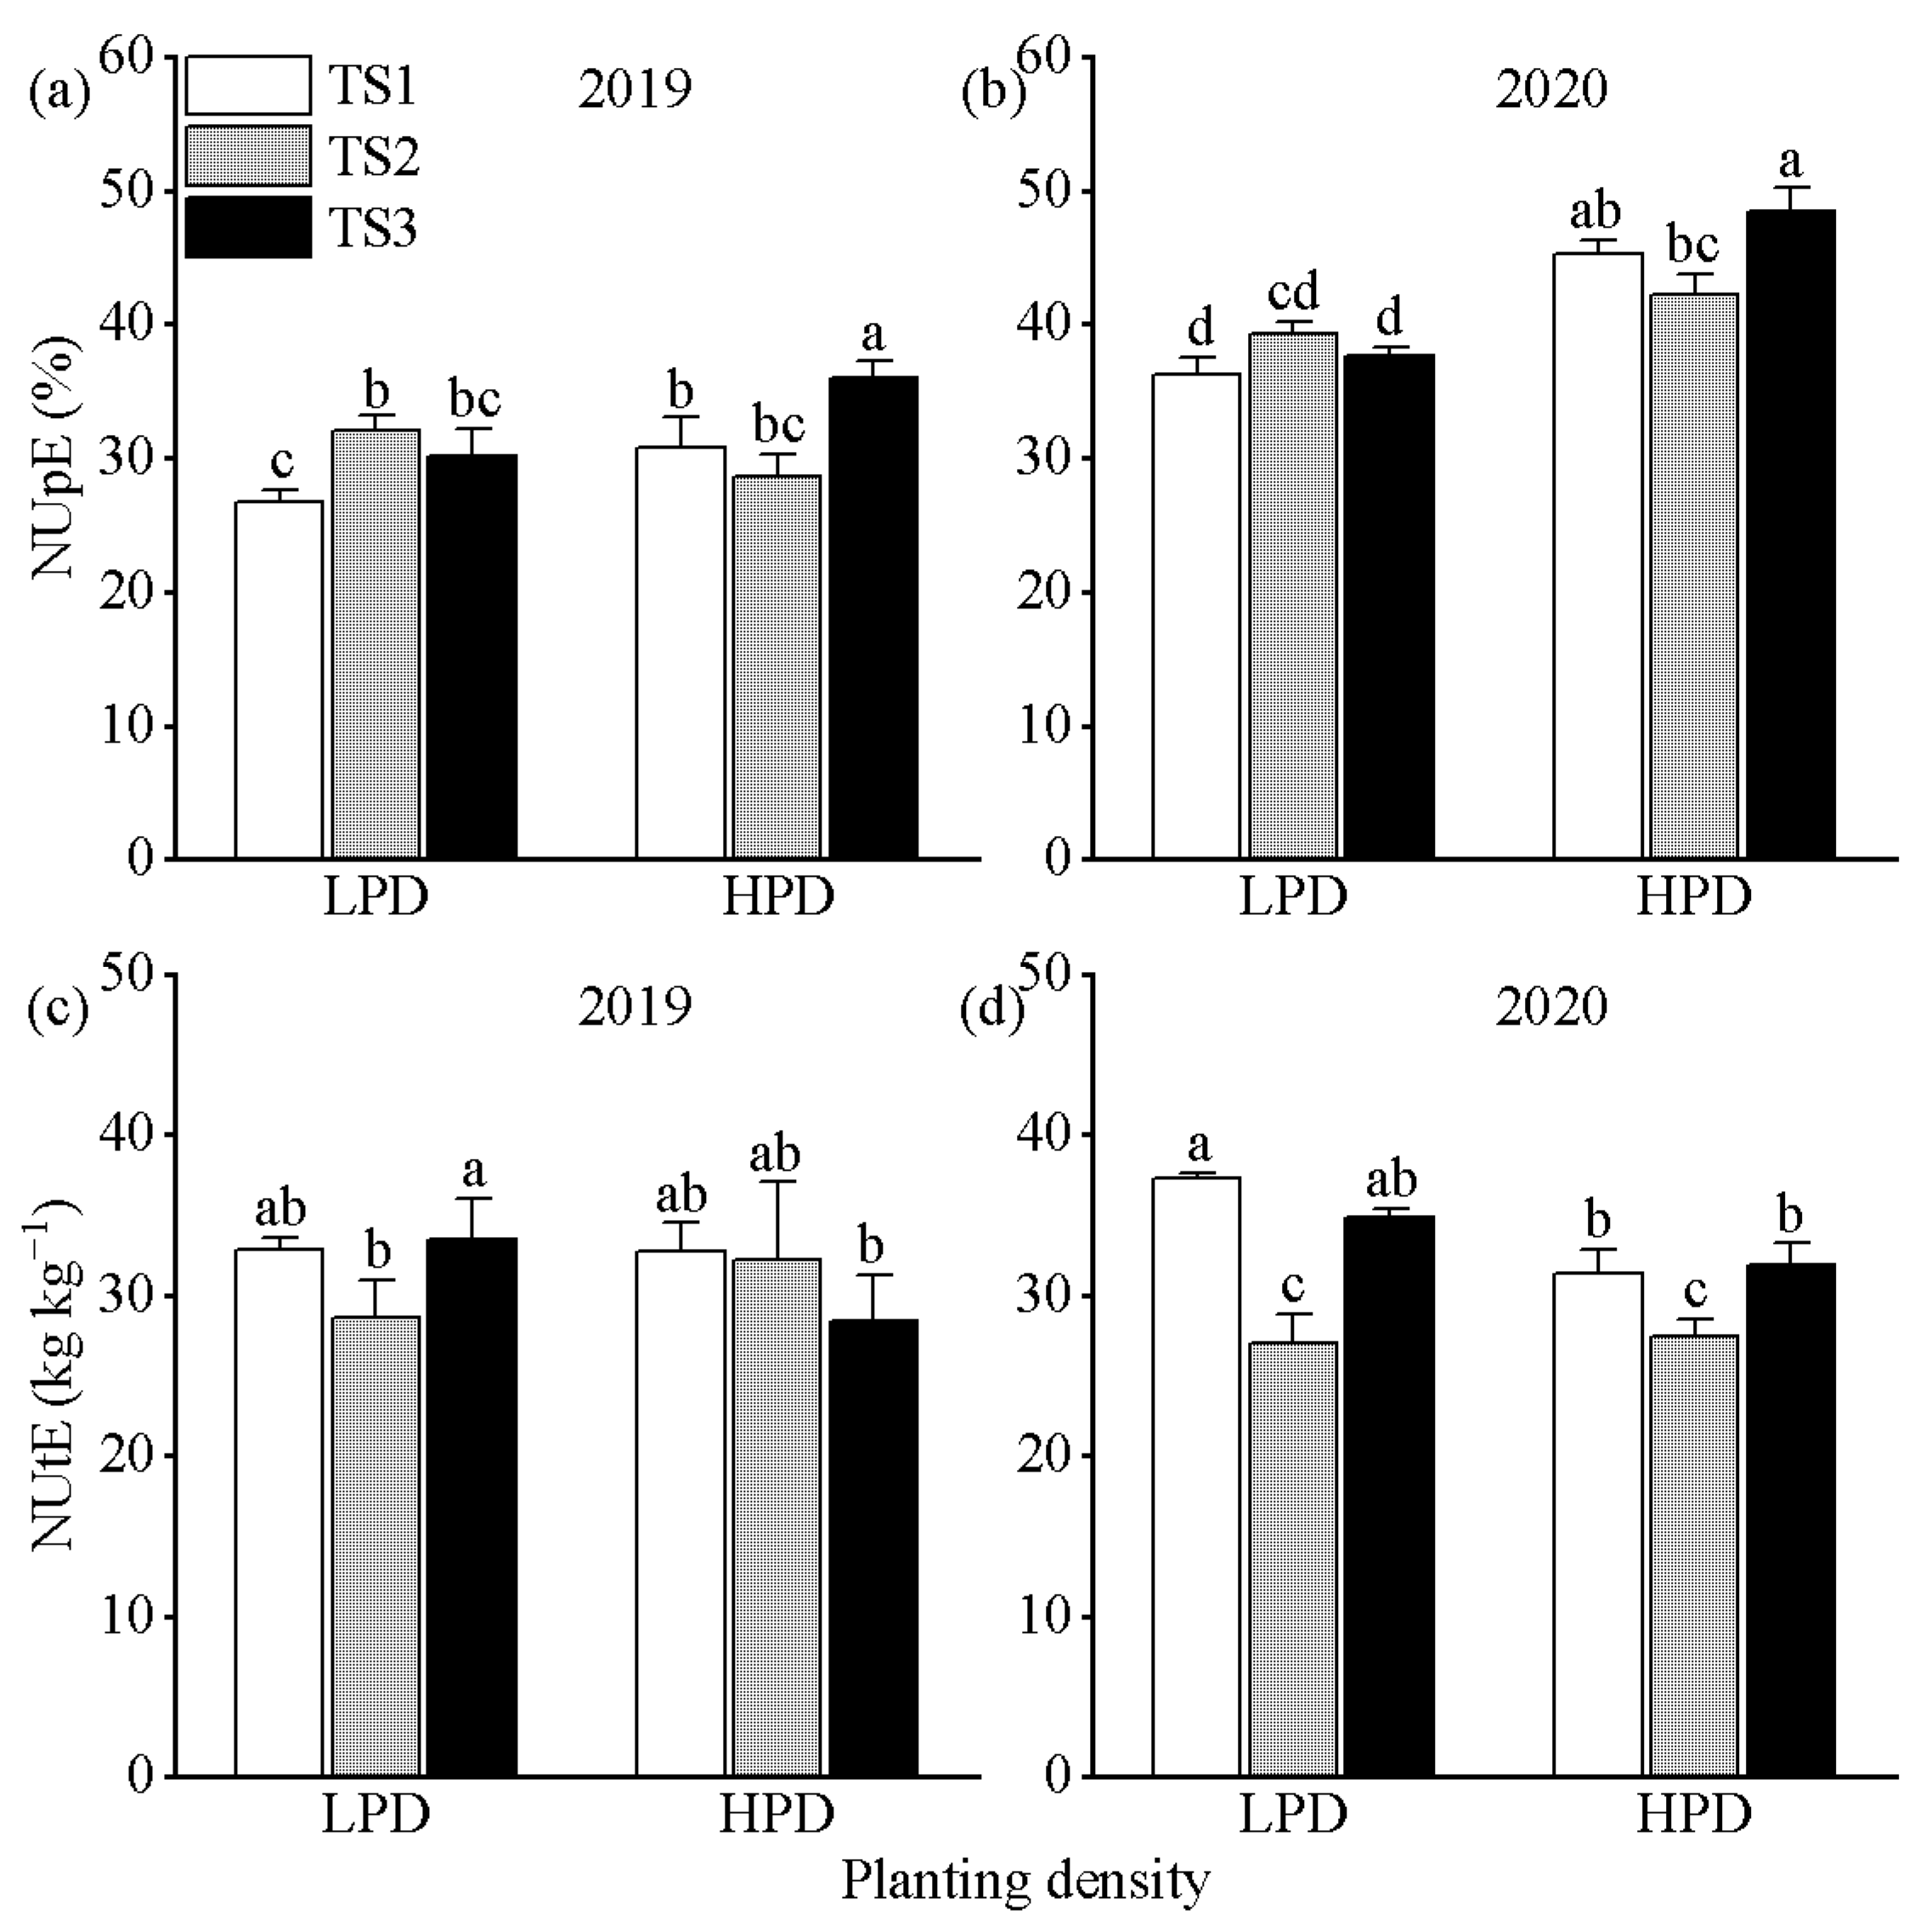
Planting density did not significantly affect NUE and NUtE, and HPD greatly increased NUpE (by 20%) compared to LPD but only in 2020 (Table S4 and Table 4). The method of tillage and sowing significantly impacted NUE in the two years, NUpE in 2019, and NUtE in 2020 (Table S4). TS3 improved NUE and NUpE compared with other methods in 2019, but with no significant difference in NUpE between TS2 and TS3. In 2020, NUE and NUtE were significantly higher under TS1 and TS3 compared to TS2 (by 25%–28% and 22%–26%, respectively), with no significant difference between T1 and TS3 (Table 4). The results show that compared with LPD, HPD only contributed to improving NUpE under TS1 and TS3 in both years and decreased NUtE under TS3 in 2019 and under TS1 in 2020 (Figure 6).

3.8. Soil N Residue

As shown in Figure 7, planting density did not significantly change the soil N residue in the 0–10 and 40–60 cm layers in 2019 and the 20–40 and 40–60 cm layers in 2020, but there was greater residual N under LPD than HPD in the 20–40 cm layer in 2019 and the 0–20 cm layer in 2020. The method of tillage and sowing only significantly influenced soil N residue in 2019. In 2019, there was a significantly higher soil N residue in the 0–60 cm layer under TS3 compared with TS1 and TS2, and a similar N residue was measured in the 0–20 cm soil layer between TS1 and TS2, whereas the soil N residue of the 20–40 and 40–60 cm layers was higher under TS2 compared with TS1.
Significant interactions between planting density and method of tillage and sowing were found regarding soil N residue in the 20–40 and 40–60 cm layers in 2019 and the 40–60 cm layer in 2020. In 2019, HPD facilitated a decrease in N residue in the 20–40 cm layer under TS1 and the 20–60 cm layer under TS3 compared with LPD but did not change the N residue under TS2. Greater N residue was found only in the 40–60 cm layer in TS1 soil under HPD compared with LPD, and the N residue in TS2 and TS3 soil was similar between LPD and HPD in 2020.

4. Discussion

There were more vigorous seedlings (greater seedling tiller number, leaf area, and shoot weight) in 2020 compared to 2019 due to the suitable soil moisture and high daily mean temperature during the seedling growth stage in 2020. The robust growth of these seedlings further improved the subsequent crop growth and grain yield.

4.1. Increased Planting Density Enhances Grain Yield and N-Use Efficiency

Planting density, as a critical cultivation practice, influences grain yield and most agronomical characteristics because of its controllability [36]. Increasing the planting density can improve root length density, N absorption, leaf lush growth, light interception, and aboveground biomass and increase grain yield and N-use efficiency [37,38,39]. The present study also confirmed that a high planting density (HPD vs. LPD) could increase grain yield, grain N accumulation, and NUpE, though a significant difference was only detected in 2020 (Tables S3 and S4). Although a low planting density facilitated tiller number, leaf area, and shoot weight in single seedlings, a moderate increase in seedling numbers produced more culms, a greater leaf area, and increased crop biomass per unit planted area (Table 1), particularly in 2020. The suitable growth conditions produced a comparable vigorous single-plant growth between HPD and LPD. Therefore, robust individual growth and adequate plant numbers together enhanced the photosynthetic area and source level (maximum leaf area), thereby raising the grain yield under HPD in 2020. In addition, these characteristics possibly contributed to an increased root density, which promoted N absorption and NUpE [40]. Additionally, a previous report indicated that increased planting density decreases soil N residue by promoting N uptake as a result of root expansion [40]. Similar to this previous report, our results show that HPD reduced the N residue in the 20–40 cm soil layer in 2019 and the 0–20 cm soil layer in 2020 compared to LPD. The differences between the years might be ascribed to the extreme rainfall in March, which restrained root downward growth in 2020.

4.2. Strip Tillage Promotes Seedlings Growth, Source and Sink Levels, and Grain Yield

A suitable method of tillage and sowing can improve the soil environment and seedbed quality in wheat production, contributing to strong seedling growth and higher grain yield [4,8,26]. The present study shows that compared with TS2 (full tillage and sowing in the drill), TS1 (full tillage and broadcast sowing) increased the tiller number (more culms per m2 seedlings and tillers per seedling), while TS3 (strip tillage and sowing in drill) contributed to vigorous seedling growth (higher leaf area and shoot weight per m2 seedlings and per seedling) in both years and was similar with TS1 in terms of tiller number in 2020 (Table 1). A key reason for the formation of strong seedlings could be due to the shallow sowing under TS1 (near the soil surface) and TS3 (~1.5 cm), which could reduce the nutrient requirements for seedling emergence, thus facilitating leaf and tiller development [15]; promote root growth in the topsoil, thereby increasing nutrient absorption in the shallow soil [16,17]; and alleviate hypoxia/anaerobic stress in soils with a high moisture content during the seedling stage [9,18]. Moreover, the broadcast (TS1) provided sufficient growth space for tillering [41]. Although TS1 used broadcasting with soil surface seeding, thus promoting quick and vigorous seedling growth, TS3 also achieved comparable or even better seedling growth compared with TS1. The crucial reason was that strip tillage, similar to no-tillage, contributed to the enrichment of surface nutrients compared to full tillage, which facilitated the growth of the shallow roots and thus enhanced nutrient absorption efficiency [26]. The results also show that TS1 and TS3 improved the maximum leaf area and grains per m2 compared with TS2, except that there were similar maximum leaf area and grains per m2 values between TS1 and TS2 in 2020 possibly due to the favorable growing conditions during winter and early spring (Table 3). Therefore, there were higher grain yields under TS1 and TS3 than under TS2 in both years, with no great difference detected between TS1 and TS3. The reasons for the high yield under TS1 depend on a sufficient spike number in both years and a high 1000-grain weight in 2020, while TS3 depended on high grains per spike (Table 2). These results indicate that the mechanism achieving high yield differed between strip tillage and full tillage, and the former depended on robust single-stem growth to gain more grains per single-spike rather than more tillers.
A high planting density (HPD vs. LPD) greatly decreased the tillers per seedling under TS1 and TS3 in 2019 and the leaf area and shoot weight per seedling under TS3 in 2020 (Figure 2), but it achieved similar or even higher seedling biomass in the unit area compared with a low planting density. The increasing planting density also improved the 1000-grain weight under TS1 (Figure 3), due to the compensating effect of the low grains per spike resulting from the high spike number under TS1 and a high planting density. The present results show that a moderate increase in planting density could promote seedling growth and source and sink performance under the different methods of tillage and sowing, achieving a high and stable yield. The previous study indicated that an increased plant density promoted the effective tiller rate and inhibited the number of high-position tiller spikes, which promised higher grain yield [42]. Compared with the high-position tiller, the low-position tiller showed higher leaf area and leaf number, increasing light interception [43,44]. The increased source (maximum leaf area) and sink levels (grains per m2) were closely related to the improved grain yield, and the source level highly depended on seedling growth per unit area (culms, leaf area, and shoot weight per m2 seedlings), and the key determining factor was culms per unit area for sink level (Figure 4 and Figure 5). Additionally, the improved growth quality of individual seedlings (tillers, leaf area, and shoot weight) promoted the coordination of the source and sink (sink–source ratio). These findings indicate that vigorous seedlings improve the potential and synergism of the source and sink, thereby increasing grain yield through the use of optimized agricultural machinery and agronomic support technology.

4.3. Strip Tillage Improves Grain N Accumulation, N-Use Efficiency, and Soil N Residue

The present study shows that TS3 achieved higher total N accumulation compared with TS1 and TS2 (Table 4) and did not change with year and planting density, even though there was similar plant growth between methods of tillage and sowing. A feasible explanation is that soil under strip tillage (used by TS3) could have a stable structure on both sides of the tillage/seeding strip zone, which might steer nutrients towards soft tillage/seeding zones under the action of rainwater, resulting in nutrient enrichment [45]. In addition, seedling growth exhibited similar or greater vigor under TS3 compared with TS1 and TS2 (using full tillage). The strong root system in the high-vigor seedlings contributed to soil nutrient absorption and plant nutrition accumulation, particularly under no-tillage, and shallow root growth was coordinated with nutrient enrichment in the surface soil layer [26,45,46]. Moreover, high N uptake under TS3 increased N accumulation in the grains and facilitated N efficiency, whereas NUE, NUpE, and NUtE improvement also depended on crop growth and grain yield. Therefore, the increased N efficiency under TS3 was not consistent between the two years compared with TS1 and TS2, which showed similar or higher levels.
Further investigation showed that there was more soil N residue in the 0–60 cm layer under TS3 compared with TS1 and TS2 in 2019, but the method of tillage and sowing did not greatly influence soil N residue in 2020. Different results have been reported by Wang et al. [45] and Li et al. [47], with the former reporting that the nitrate-N content in 0–20 cm soil layers at maturity under strip tillage was significantly higher than that under rotary tillage in arid and semi-arid regions. By contrast, the latter study indicated that there was no difference in soil N residue between strip tillage and full tillage under sufficient soil nutrient supply. The present study applied the same fertilizer rate in the two years, yet greater seedling growth, source and sink performance, grain yield, N absorption and efficiency, and soil N residue were detected in 2020, implying better growing conditions. The loss of nutrients resulting from the excessive precipitation during the seedling growth period in 2019 may explain this difference. Additionally, the N accumulation in crop residues was greater under TS3 compared with TS1 and TS2, though the difference was not great between TS2 and TS3. These findings suggest that the TS3 method, using strip tillage, facilities high crop N and soil N residues, thereby improving the basic fertility soil of the next-stubble crop [48,49,50]. Our study also indicated that a moderate increase in planting density could promote N uptake, reduce soil N residue, and improve NUpE under TS1 and TS3. This study highlights the advantages of strip tillage in promoting seedling growth, grain yield, and N efficiency, especially under high rainfall during the seedling growth period. However, our comparison was conducted under the same planting density. Therefore, seedling emergence rate and evenness were lower under strip tillage compared with full tillage using specialized tillage machines. Accordingly, a suitable seeding rate needs to be further established.

5. Conclusions

Strip tillage achieved significantly higher or similar grain yield, grain N accumulation, and NUE (by 11%–12%, 5%–13%, and 11%–18%, respectively) compared with full tillage. Strip tillage with a suitable high planting density greatly promoted tiller number, leaf area, and shoot weight of seedlings (by 8%–14%, 7%–23%, and 11%–19%, respectively), improving the potential and synergy of the source and sink (maximum leaf area, grains per m2, and sink–source ratio). The supporting agronomic technologies need to be further confirmed to extend the application of strip tillage for wheat production under rice–wheat rotation systems.

Supplementary Materials

The following supporting information can be downloaded at: https://www.mdpi.com/article/10.3390/agronomy12112698/s1, Table S1: Models, operation procedures, and features of the seeders; Table S2: The significance (p values) of effects of planting density and method of tillage and sowing on seedling growth in the 2019 and 2020 seasons; Table S3: The significance (p values) of effects of planting density and method of tillage and sowing on grain yield, yield components, and source and sink performances in the 2019 and 2020 seasons; Table S4: The significance (p values) of effects of planting density and method of tillage and sowing on N accumulation and N-use efficiency in the 2019 and 2020 seasons

Author Contributions

Conceptualization, D.X., J.D., C.L., W.G., M.Z. and X.Z.; Investigation, D.X., J.D., D.Y., W.J. and F.L.; Writing—original draft preparation, D.X. and J.D.; Writing—review and editing, C.L.; Supervision and Project administration, C.L. All authors have read and agreed to the published version of the manuscript.

Funding

This work was supported by the National Natural Science Foundation of China (32172111; 32071953); the Postgraduate Research & Practice Innovation Program of Jiangsu Province (KYCX21_3244); the Independent Innovative Agricultural Project of Jiangsu Province (CX(22)1001); and the Priority Academic Program Development of Jiangsu Higher Education Institutions.

Data Availability Statement

Not applicable.

Conflicts of Interest

The authors declare no conflict of interest.

References

  1. Gangwar, K.S.; Singh, K.K.; Sharma, S.K.; Tomar, O.K. Alternative tillage and crop residue management in wheat after rice in sandy loam soils of Indo-Gangetic plains. Soil Tillage Res. 2005, 88, 242–252. [Google Scholar] [CrossRef]
  2. Gozubuyuk, Z.; Sahin, U.; Adiguzel, M.C.; Ozturk, I.; Celik, A. The influence of different tillage practices on water content of soil and crop yield in vetch-winter wheat rotation compared to fallow-winter wheat rotation in a high altitude and cool climate. Agric. Water Manag. 2015, 160, 84–97. [Google Scholar] [CrossRef]
  3. Qiang, X.; Sun, J.; Ning, H. Impact of subsoiling on cultivated horizon construction and grain yield of winter wheat in the north China plain. Agriculture 2022, 12, 236. [Google Scholar] [CrossRef]
  4. Ding, J.; Li, F.; Le, T.; Xu, D.; Zhu, M.; Li, C.; Zhu, X.; Guo, W. Tillage and seeding strategies for wheat optimizing production in harvested rice fields with high soil moisture. Sci. Rep. 2021, 11, 119. [Google Scholar] [CrossRef] [PubMed]
  5. Singh, G.; Jalota, S.K.; Sidhu, B.S. Soil physical and hydraulic properties in a rice-wheat cropping system in India: Effects of rice-straw management. Soil Use Manag. 2005, 21, 17–21. [Google Scholar] [CrossRef]
  6. Sharma, P.; Tripathi, R.P.; Singh, S. Tillage effects on soil physical properties and performance of rice-wheat-cropping system under shallow water table conditions of Tarai, northern India. Eur. J. Agron. 2005, 23, 327–335. [Google Scholar] [CrossRef]
  7. Pagnani, G.; Galieni, A.; Egidio, S.D.; Visioli, G.; Stagnari, F.; Pisante, M. Effect of soil tillage and crop sequence on grain yield and quality of durum wheat in Mediterranean areas. Agronomy 2019, 9, 488. [Google Scholar] [CrossRef] [Green Version]
  8. He, J.; Shi, Y.; Zhao, J.; Yu, Z. Strip rotary tillage with subsoiling increases winter wheat yield by alleviating leaf senescence and increasing grain filling. Crop J. 2020, 8, 327–340. [Google Scholar] [CrossRef]
  9. Ding, J.; Li, F.; Xu, D.; Wu, P.; Zhu, M.; Li, C.; Zhu, X.; Chen, Y.; Guo, W. Tillage and nitrogen managements increased wheat yield through promoting vigor growth and production of tillers. Agron. J. 2021, 113, 1640–1652. [Google Scholar] [CrossRef]
  10. Mitchell, J.P.; Shrestha, A.; Mathesius, K.; Scow, K.M.; Southard, R.J.; Haney, R.L.; Schmidt, R.; Munk, D.S.; Horwath, W.R. Cover cropping and no-tillage improve soil health in an arid irrigated cropping system in California’s San Joaquin valley, USA. Soil Tillage Res. 2017, 165, 325–335. [Google Scholar] [CrossRef]
  11. Bhatt, R.; Khera, K.L. Effect of tillage and mode of straw mulch application on soil erosion in the submontaneous tract of Punjab, India. Soil Tillage Res. 2005, 88, 107–115. [Google Scholar] [CrossRef]
  12. Shao, Y.; Xie, Y.; Wang, C.; Yue, J.; Yao, Y.; Li, X.; Liu, W.; Zhu, Y.; Guo, T. Effects of different soil conservation tillage approaches on soil nutrients, water use and wheat-maize yield in rainfed dry-land regions of north China. Eur. J. Agron. 2016, 81, 37–45. [Google Scholar] [CrossRef]
  13. Mosaddeghi, M.R.; Mahboubi, A.A.; Safadoust, A. Short-term effects of tillage and manure on some soil physical properties and wheat root growth in a sandy loam soil in western Iran. Soil Tillage Res. 2008, 104, 173–179. [Google Scholar] [CrossRef]
  14. Ren, B.; Li, X.; Dong, S.; Liu, P.; Zhao, B.; Zhang, J. Soil physical properties and maize root growth under different tillage systems in the north China plain. Crop J. 2018, 6, 669–676. [Google Scholar] [CrossRef]
  15. Qin, R.; Stamp, P.; Richner, W. Impact of tillage on root systems of winter wheat. Agron. J. 2004, 96, 1523–1530. [Google Scholar] [CrossRef]
  16. Gangwar, K.S.; Singh, K.K.; Sharma, S.K. Effect of tillage on growth, yield and nutrient uptake in wheat after rice in the Indo-Gangetic plains of India. J. Agric. Sci. 2004, 142, 453–459. [Google Scholar] [CrossRef]
  17. Song, K.; Yang, J.; Xue, Y.; Lv, W.; Zheng, X.; Pan, J. Influence of tillage practices and straw incorporation on soil aggregates, organic carbon, and crop yields in a rice-wheat rotation system. Sci. Rep. 2016, 6, 36602. [Google Scholar] [CrossRef]
  18. Erenstein, O.; Laxmi, V. Zero tillage impacts in India’s rice-wheat systems: A review. Soil Tillage Res. 2008, 100, 1–14. [Google Scholar] [CrossRef]
  19. Nasr, H.M.; Selles, F. Seedling emergence as influenced by aggregate size, bulk density, and penetration resistance of the seedbed. Soil Tillage Res. 1995, 34, 61–76. [Google Scholar] [CrossRef]
  20. Saharawat, Y.S.; Singh, B.; Malik, R.K.; Ladha, J.K.; Gathala, M.; Jat, M.L.; Kumar, V. Evaluation of alternative tillage and crop establishment methods in a rice-wheat rotation in north western IGP. Field Crops Res. 2010, 116, 260–267. [Google Scholar] [CrossRef]
  21. Šíp, V.; Vavera, R.; Chrpová, J.; Kusá, H.; Růžek, P. Winter wheat yield and quality related to tillage practice: Input level and environmental conditions. Soil Tillage Res. 2013, 132, 77–85. [Google Scholar] [CrossRef]
  22. Vaitauskienė, K.; Šarauskis, E.; Romaneckas, K.; Jasinskas, A. Design, development and field evaluation of row-cleaners for strip tillage in conservation farming. Soil Tillage Res. 2017, 174, 139–146. [Google Scholar] [CrossRef]
  23. Wang, H.; Yu, Z.; Shi, Y.; Zhang, Y. Effects of tillage practices on grain yield formation of wheat and the physiological mechanism in rainfed areas. Soil Tillage Res. 2020, 202, 104675. [Google Scholar] [CrossRef]
  24. McDonald, A.J.; Riha, S.J.; Duxbury, J.M.; Steenhuis, T.S.; Lauren, J.G. Soil physical responses to novel rice cultural practices in the rice-wheat system: Comparative evidence from a swelling soil in Nepal. Soil Tillage Res. 2005, 86, 163–175. [Google Scholar] [CrossRef]
  25. Farooq, M.; Nawaz, A. Weed dynamics and productivity of wheat in conventional and conservation rice-based cropping systems. Soil Tillage Res. 2014, 141, 1–9. [Google Scholar] [CrossRef]
  26. Li, F.; Zhang, X.; Xu, D.; Ma, Q.; Le, T.; Zhu, M.; Li, C.; Zhu, X.; Guo, W.; Ding, J. No-tillage promotes wheat seedling growth and grain yield compared with plow-rotary tillage in a rice-wheat rotation in the high rainfall region in China. Agronomy 2022, 12, 865. [Google Scholar] [CrossRef]
  27. Robertson, D.; Zhang, H.; Palta, J.A.; Colmer, T.; Turner, N.C. Waterlogging affects the growth, development of tillers, and yield of wheat through a severe, but transient, N deficiency. Crop Pasture Sci. 2009, 60, 578–586. [Google Scholar] [CrossRef]
  28. Shao, G.C.; Lan, J.J.; Yu, S.E.; Guo, R.Q.; She, D.L. Photosynthesis and growth of winter wheat in response to waterlogging at different growth stages. Photosynthetica 2013, 51, 429–437. [Google Scholar] [CrossRef]
  29. Malik, A.I.; Colmer, T.D.; Lambers, H.; Setter, T.L.; Schortemeyer, M. Short-term waterlogging has long-term effects on the growth and physiology of wheat. New Phytol. 2002, 153, 225–236. [Google Scholar] [CrossRef]
  30. Timsina, J.; Connor, D.J. Productivity and management of rice-wheat cropping systems: Issues and challenges. Field Crops Res. 2001, 69, 93–132. [Google Scholar] [CrossRef]
  31. Lu, R.K. Soil and Agricultural Chemical Analysis Methods; Chinese Agriculture and Sciences Press: Beijing, China, 1999. [Google Scholar]
  32. Ding, J.; Liang, P.; Wu, P.; Zhu, M.; Li, C.; Zhu, X.; Gao, D.; Chen, Y.; Guo, W. Effects of waterlogging on grain yield and associated traits of historic wheat cultivars in the middle and lower reaches of the Yangtze river, China. Field Crops Res. 2020, 246, 107695. [Google Scholar] [CrossRef]
  33. Ding, J.; Zi, Y.; Li, C.; Peng, Y.; Zhu, X.; Guo, W. Dry matter accumulation, partitioning, and remobilization in high-yielding wheat under rice-wheat rotation in China. Agron. J. 2016, 108, 604–614. [Google Scholar] [CrossRef]
  34. Scheiner, D. Determination of ammonia and Kjeldahl nitrogen by indophenol method. Water Res. 1976, 10, 31–36. [Google Scholar] [CrossRef]
  35. Foulkes, M.J.; Hawkesford, M.J.; Barraclough, P.B.; Holdsworth, M.J.; Kerr, S.; Kightley, S.; Shewry, P.R. Identifying traits to improve the nitrogen economy of wheat: Recent advances and future prospects. Field Crops Res. 2009, 114, 329–342. [Google Scholar] [CrossRef]
  36. Valério, I.P.; Carvalho, F.I.; Oliveira, A.C.; Benin, G.; Souza, V.Q.; Machado, A.A.; Bertan, I.; Busato, C.C.; Silveira, G.; Fonseca, D.A. Seeding density in wheat genotypes as a function of tillering potential. Sci. Agric. 2009, 66, 28–39. [Google Scholar] [CrossRef] [Green Version]
  37. Li, D.; Zhang, D.; Wang, H.; Li, H.; Fang, Q.; Li, H.; Li, R. Optimized planting density maintains high wheat yield under limiting irrigation in north China plain. Int. J. Plant Prod. 2020, 14, 107–117. [Google Scholar] [CrossRef]
  38. Gao, Y.; Zhang, M.; Yao, C.; Liu, Y.; Wang, Z.; Zhang, Y. Increasing seeding density under limited irrigation improves crop yield and water productivity of winter wheat by constructing a reasonable population architecture. Agric. Water Manag. 2021, 253, 106951. [Google Scholar] [CrossRef]
  39. Zheng, B.; Zhang, X.; Wang, Q.; Li, W.; Huang, M.; Zhou, Q.; Cai, J.; Wang, X.; Cao, W.; Dai, T.; et al. Increasing plant density improves grain yield, protein quality and nitrogen agronomic efficiency of soft wheat cultivars with reduced nitrogen rate. Field Crops Res. 2021, 267, 108145. [Google Scholar] [CrossRef]
  40. Dai, X.; Xiao, L.; Jia, D.; Kong, H.; Wang, Y.; Li, C.; Zhang, Y.; He, M. Increased plant density of winter wheat can enhance nitrogen—Uptake from deep soil. Plant Soil 2014, 384, 141–152. [Google Scholar] [CrossRef]
  41. Wu, P.; Li, F.; Yu, Q.; Zhao, W.; Zhu, M.; Li, C.; Zhu, X.; Ding, J.; Guo, W. Effects of tillage and sowing method, planting density, and nitrogen rate on seedling quality of wheat following rice. J. Triticeae Crops 2021, 41, 72–80. (In Chinese) [Google Scholar] [CrossRef]
  42. Yang, D.; Cai, T.; Luo, Y.; Wang, Z. Optimizing plant density and nitrogen application to manipulate tiller growth and increase grain yield and nitrogen-use efficiency in winter wheat. PeerJ 2019, 7, e6484. [Google Scholar] [CrossRef] [PubMed]
  43. Lafarge, T.A.; Broad, I.J.; Hammer, G.L. Tillering in grain sorghum over a wide range of population densities: Identification of a common hierarchy for tiller emergence, leaf area development and fertility. Ann. Bot. 2002, 90, 87–98. [Google Scholar] [CrossRef] [PubMed] [Green Version]
  44. Kebrom, T.H.; Mullet, J.E. Photosynthetic leaf area modulates tiller bud outgrowth in sorghum. Plant Cell Environ. 2015, 38, 1471–1478. [Google Scholar] [CrossRef] [PubMed] [Green Version]
  45. Wang, H.; Guo, Z.; Shi, Y.; Zhang, Y.; Yu, Z. Impact of tillage practices on nitrogen accumulation and translocation in wheat and soil nitrate-nitrogen leaching in drylands. Soil Tillage Res. 2015, 153, 20–27. [Google Scholar] [CrossRef]
  46. Nevens, F.; Reheul, D. The consequences of wheel-induced soil compaction and subsoiling for silage maize on a sandy loam soil in Belgium. Soil Tillage Res. 2003, 70, 175–184. [Google Scholar] [CrossRef]
  47. Li, M.; Li, C.; Liu, M.; Wu, X.; Wei, H.; Tang, Y.; Xiong, T. Effects of different tillage and sowing practices on root growth, soil moisture, and soil nitrate nitrogen content of wheat after rice. China J. Appl. Ecol. 2020, 31, 1425–1434. (In Chinese) [Google Scholar] [CrossRef]
  48. Shah, Z.; Shah, S.H.; Peoples, M.B.; Schwenke, G.D.; Herridge, D.F. Crop residue and fertiliser N effects on nitrogen fixation and yields of legume-cereal rotations and soil organic fertility. Field Crops Res. 2003, 83, 1–11. [Google Scholar] [CrossRef]
  49. Shafi, M.; Bakht, J.; Jan, M.T.; Shah, Z. Soil C and N dynamics and maize (Zea may L.) yield as affected by cropping systems and residue management in north-western Pakistan. Soil Tillage Res. 2006, 94, 520–529. [Google Scholar] [CrossRef]
  50. Bakht, J.; Shafi, M.; Jan, M.T.; Shah, Z. Influence of crop residue management, cropping system and N fertilizer on soil N and C dynamics and sustainable wheat (Triticum aestivum L.) production. Soil Tillage Res. 2009, 104, 233–240. [Google Scholar] [CrossRef]
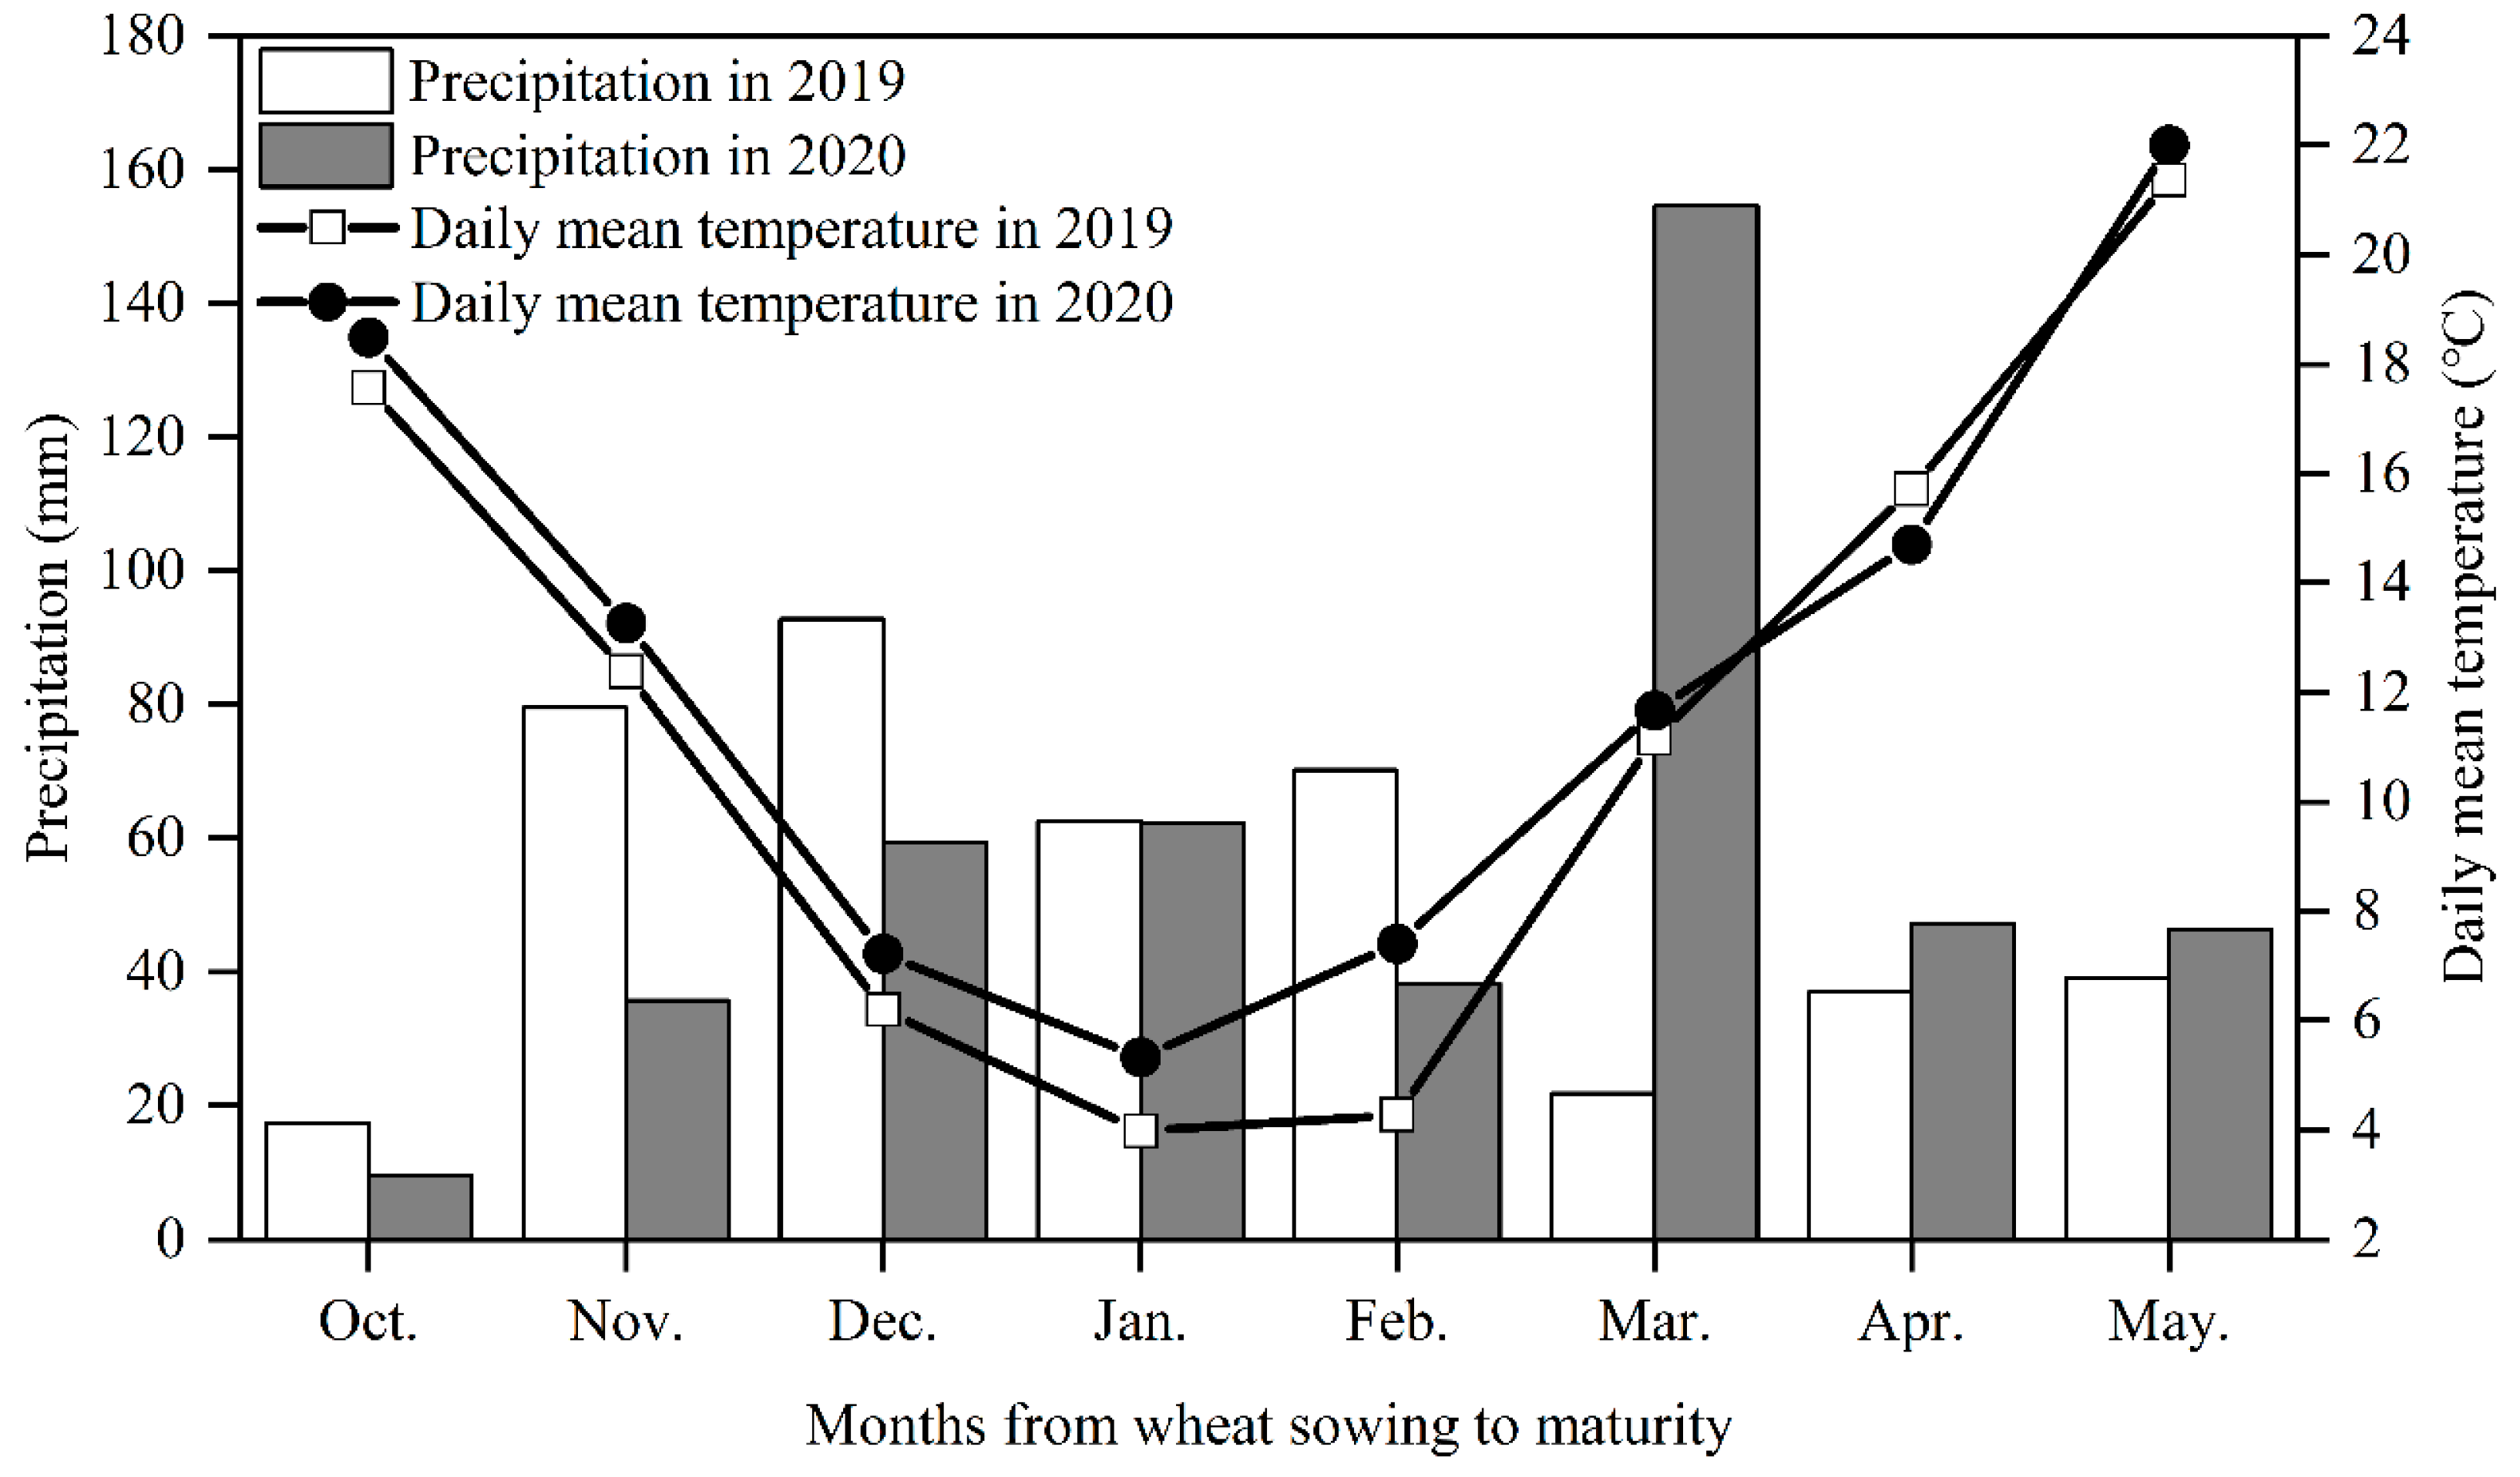
Figure 1. Precipitation and daily mean temperature during the wheat-growing seasons of 2018–2019 (2019) and 2019–2020 (2020).
Agronomy 12 02698 g001
Figure 2. Effects of the combinations of planting density and method of tillage and sowing on (a) tillers per seedling in 2019, (b) leaf area per seedling in 2020, and (c) shoot weight per seedling in 2020 at the beginning of the over-wintering stage in the 2019 and 2020 seasons. Data are presented as means ± standard errors, and the bars above the columns are standard errors. The different letters on the bars indicate significant differences at the 0.05 probability level.
Agronomy 12 02698 g002
Figure 3. Effects of the combinations of planting density and method of tillage and sowing on (a,b) 1000-grain weight at the maturity stage in the 2019 and 2020 seasons. Data are presented as means ± standard errors, and the bars above the columns are standard errors. The different letters on the bars indicate significant differences at the 0.05 probability level.
Agronomy 12 02698 g003
Figure 4. Relationships of (ac) culms, leaf area, and shoot weight per m2 seedlings with maximum leaf area, (df) tillers, leaf area, and shoot weight per seedling with sink–source ratio, and (g) culms per m2 seedlings with grains per m2 under different treatments in the growth seasons of 2019 and 2020.
Agronomy 12 02698 g004
Figure 5. Relationship of (a,b) maximum leaf area and grains per m2 with grain yield under different treatments for both growth seasons.
Agronomy 12 02698 g005
Figure 6. Effects of the combinations of planting density and method of tillage and sowing on (a,b) NUpE and (c,d) NUtE in the 2019 and 2020 seasons. Data are presented as means ± standard errors, and the bars above the columns are standard errors. The different letters on the bars indicate significant differences at the 0.05 probability level.
Agronomy 12 02698 g006
Figure 7. Effects of planting density and method of tillage and sowing on (a,b) soil N residue in different soil layers in the 2019 and 2020 seasons. Data are presented as means ± standard errors, and the bars above the columns are standard errors. The different letters on the bars indicate significant differences at the 0.05 probability level. PD and TS are planting density and the method of tillage and sowing. The data in the tables are p values.
Agronomy 12 02698 g007
Table 1. Effects of planting density and method of tillage and sowing on seedling growth in 2019 and 2020.
YearTreatmentCulms per m2 SeedlingsTillers per SeedlingLeaf Area per m2 Seedlings (m2)Leaf Area per Seedling (cm2)Shoot Weight per m2 Seedlings (g)Shoot Weight per Seedling (mg)
2019Planting density
LPD443 ± 13 b0.97 ± 0.03 a0.52 ± 0.03 b23.0 ± 1.1 a39.8 ± 1.5 b177 ± 7 a
HPD527 ± 13 a0.76 ± 0.02 b0.67 ± 0.03 a20.2 ± 1.0 b47.2 ± 1.5 a157 ± 6 b
Method of tillage and seeding
TS1564 ± 14 a1.17 ± 0.03 a0.62 ± 0.02 ab22.3 ± 0.6 ab44.3 ± 1.4 b171 ± 6 b
TS2403 ± 13 c0.53 ± 0.03 c0.54 ± 0.03 b19.5 ± 1.2 b38.5 ± 1.8 c148 ± 7 c
TS3487 ± 11 b0.88 ± 0.03 b0.63 ± 0.04 a22.9 ± 1.4 a47.7 ± 1.3 a183 ± 5 a
2020Planting density
LPD689 ± 16 b2.06 ± 0.07 a1.17 ± 0.06 b51.9 ± 2.8 a61.1 ± 1.6 b271 ± 7 a
HPD739 ± 20 a1.46 ± 0.07 b1.40 ± 0.07 a46.7 ± 2.2 a75.0 ± 1.7 a250 ± 6 a
Method of tillage and seeding
TS1737 ± 19 a1.87 ± 0.07 a1.25 ± 0.08 b47.8 ± 3.3 b62.6 ± 1.6 b239 ± 6 b
TS2664 ± 16 b1.56 ± 0.06 b1.05 ± 0.06 c40.0 ± 2.5 c60.2 ± 1.6 b229 ± 6 b
TS3742 ± 18 a1.87 ± 0.07 a1.55 ± 0.04 a60.0 ± 1.6 a81.3 ± 1.9 a314 ± 7 a
Data are means ± standard errors. Different letters indicate significant differences between/among the treatments at the 0.05 probability level.
Table 2. Effects of planting density and method of tillage and sowing on grain yield and yield components in 2019 and 2020.
YearTreatmentGrain Yield (t ha−1)Spike Number per m2Grains per Spike1000-Grain Weight (g)
2019Planting density
LPD6.74 ± 0.16 a418 ± 12 a36.8 ± 0.7 a45.7 ± 0.5 a
HPD6.93 ± 0.25 a434 ± 11 a35.6 ± 0.5 a46.1 ± 0.5 a
Method of tillage and sowing
TS16.99 ± 0.29 a449 ± 12 a35.2 ± 0.5 b45.2 ± 0.6 a
TS26.33 ± 0.17 b422 ± 12 ab33.5 ± 0.7 c46.2 ± 0.5 a
TS37.19 ± 0.16 a407 ± 10 b40.0 ± 0.6 a46.2 ± 0.5 a
2020Planting density
LPD7.65 ± 0.07 b514 ± 15 a37.0 ± 1.1 a41.4 ± 0.4 a
HPD8.17 ± 0.13 a541 ± 14 a37.1 ± 1.1 a42.1 ± 0.4 a
Method of tillage and sowing
TS18.22 ± 0.13 a538 ± 15 a36.6 ± 1.1 b43.3 ± 0.4 a
TS27.19 ± 0.07 b506 ± 14 b35.6 ± 1.0 b41.3 ± 0.5 b
TS38.33 ± 0.09 a537 ± 15 a39.0 ± 1.2 a40.7 ± 0.3 b
Data are means ± standard errors. Different letters indicate significant differences between/among the treatments at the 0.05 probability level.
Table 3. Effects of planting density and method of tillage and sowing on the source and sink performances in 2019 and 2020.
YearTreatmentMaximum Leaf Area (m2 m−2)Grains per m2Sink–Source Ratio
2019Planting density
LPD4.15 ± 0.14 a15,373 ± 344 a0.371 ± 0.014 a
HPD4.47 ± 0.12 a15,437 ± 316 a0.346 ± 0.010 a
Method of tillage and sowing
TS14.43 ± 0.14 a15,795 ± 471 a0.357 ± 0.014 ab
TS24.07 ± 0.12 b14,135 ± 159 b0.349 ± 0.009 b
TS34.42 ± 0.13 a16,285 ± 362 a0.370 ± 0.013 a
2020Planting density
LPD4.76 ± 0.14 b19,037 ± 800 a0.400 ± 0.012 a
HPD5.24 ± 0.12 a20,104 ± 1016 a0.384 ± 0.025 a
Method of tillage and sowing
TS15.07 ± 0.13 ab19,745 ± 1005 ab0.390 ± 0.017 a
TS24.72 ± 0.12 b18,026 ± 927 b0.383 ± 0.020 a
TS35.21 ± 0.13 a20,941 ± 792 a0.403 ± 0.019 a
Data are means ± standard errors. Different letters indicate significant differences between/among the treatments at the 0.05 probability level.
Table 4. Effects of planting density and method of tillage and sowing on N accumulation and N-use efficiency in 2019 and 2020.
YearTreatmentN Accumulation (kg ha−1)N-Use Efficiency
TotalGrainCrop ResiduesNUE (kg kg−1)NUpE (%)NUtE (kg kg−1)
2019Planting density
LPD199 ± 9 a142 ± 9 a56.7 ± 5.4 a9.3 ± 0.6 a29.6 ± 1.4 a31.7 ± 1.8 a
HPD215 ± 10 a153 ± 11 a61.7 ± 8.0 a9.8 ± 0.9 a31.8 ± 1.8 a31.1 ± 3.2 a
Method of tillage and sowing
TS1196 ± 10 b144 ± 9 b52.7 ± 5.0 b9.4 ± 0.8 b28.8 ± 1.6 b32.8 ± 1.2 a
TS2205 ± 9 b146 ± 9 b58.8 ± 8.6 ab9.2 ± 0.7 b30.3 ± 1.4 ab30.4 ± 3.6 a
TS3219 ± 9 a153 ± 11 a66.2 ± 6.5 a10.2 ± 0.7 a33.0 ± 1.7 a31.0 ± 2.7 a
2020Planting density
LPD224 ± 7 a179 ± 6 b45.3 ± 1.5 a12.4 ± 0.5 a37.7 ± 0.9 b33.0 ± 0.9 a
HPD240 ± 9 a192 ± 7 a47.5 ± 2.3 a13.7 ± 0.6 a45.3 ± 1.4 a30.2 ± 1.3 a
Method of tillage and sowing
TS1232 ± 8 b188 ± 6 b 43.9 ± 2.0 b13.8 ± 0.6 a40.8 ± 1.1 a34.3 ± 0.9 a
TS2220 ± 6 c173 ± 6 b46.5 ± 0.6 ab11.1 ± 0.6 b40.8 ± 1.1 a27.2 ± 1.4 b
TS3244 ± 10 a196 ± 7 a48.8 ± 3.2 a14.3 ± 0.4 a43.0 ± 1.2 a33.3 ± 1.0 a
Data are means ± standard errors. Different letters indicate significant differences between/among the treatments at the 0.05 probability level.
Publisher’s Note: MDPI stays neutral with regard to jurisdictional claims in published maps and institutional affiliations.