

Supplementation of Soil with Waste Sulfur and Its Effect on Availability of Mn and Zn

 , ,
, ,  and
and
Abstract
:1. Introduction
2. Materials and Methods
2.1. Properties of the Soil Material
2.2. Design of Incubation Experiment and Used Materials
2.3. Methods of Laboratory Analyses
2.3.1. Soil pHKCl
2.3.2. Available Elements
2.3.3. Dehydrogenase Activity
2.3.4. Properties of the Materials Prior to Setting up the Incubation Experiment
2.4. Statistical Analysis
2.4.1. Analysis of Variance (ANOVA)
2.4.2. Linear and Polynomial Regression Analysis
2.4.3. Multiple Regression Analysis
2.4.4. Principal Component Analysis (PCA)
2.4.5. Heatmap Generation
3. Results and Discussion
3.1. Availability of Zinc and Manganese in Soils
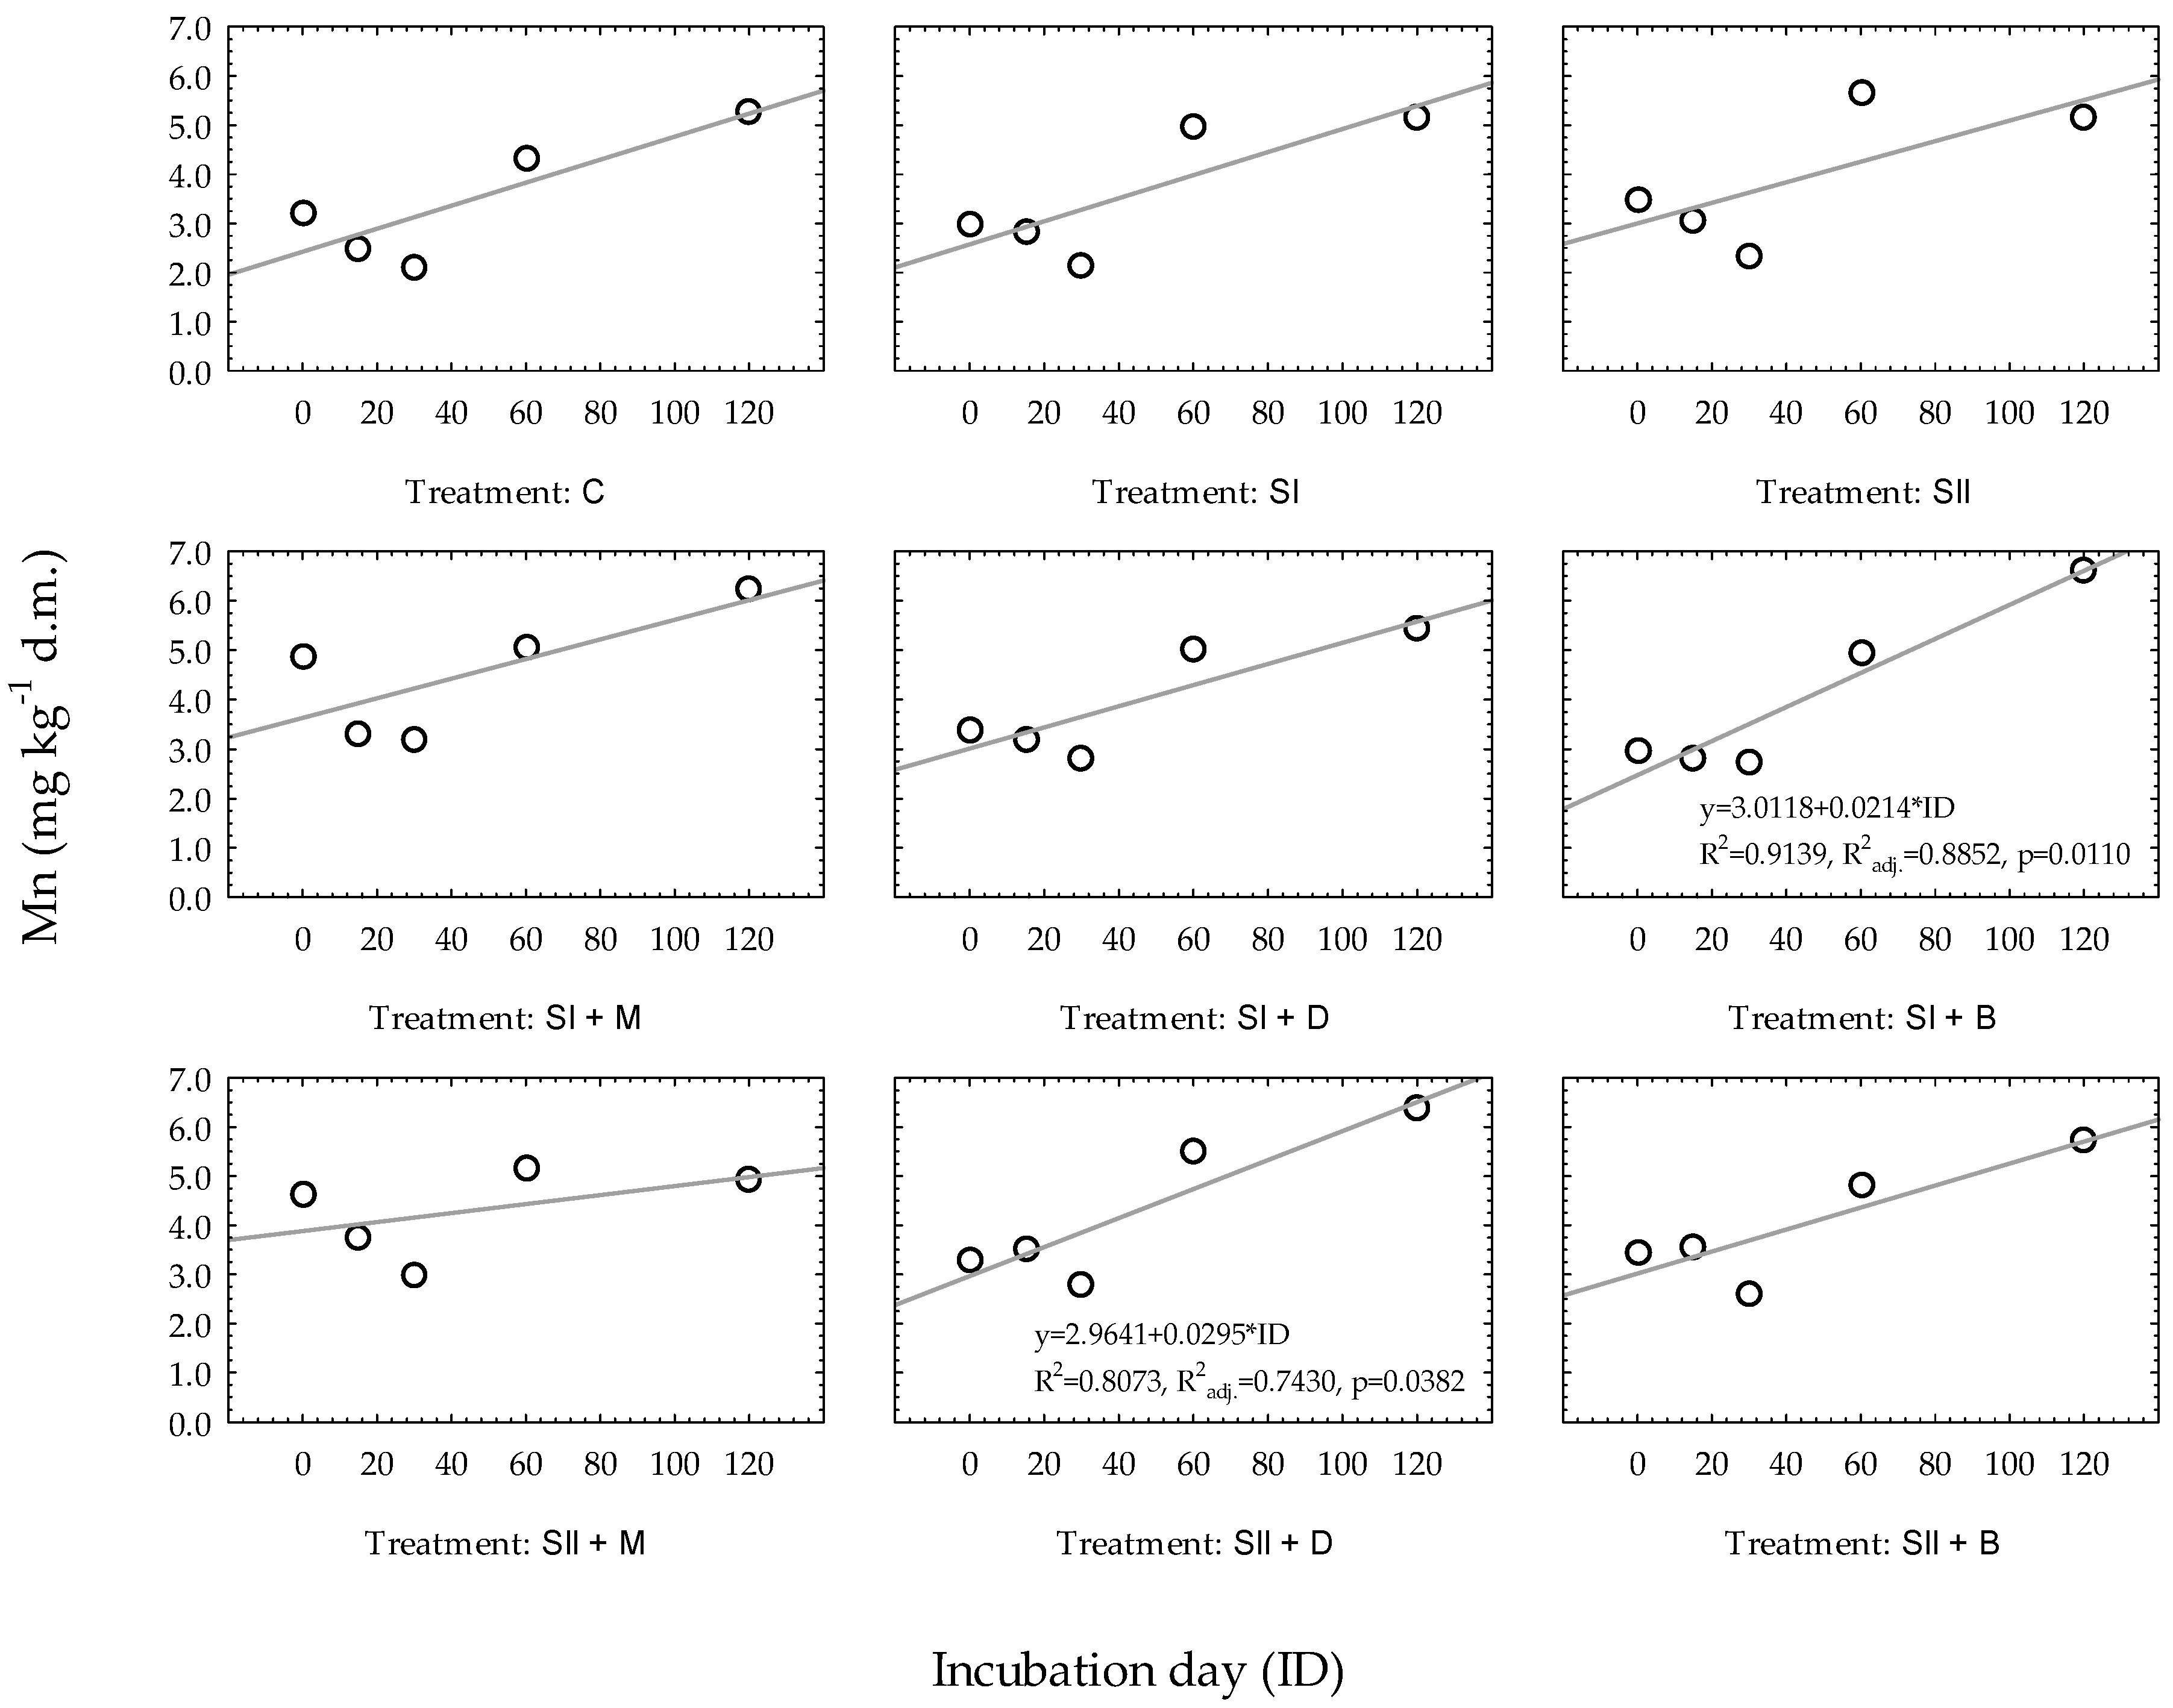
3.2. Regression Models to Predict Changes in Manganese and Zinc Availability over Time
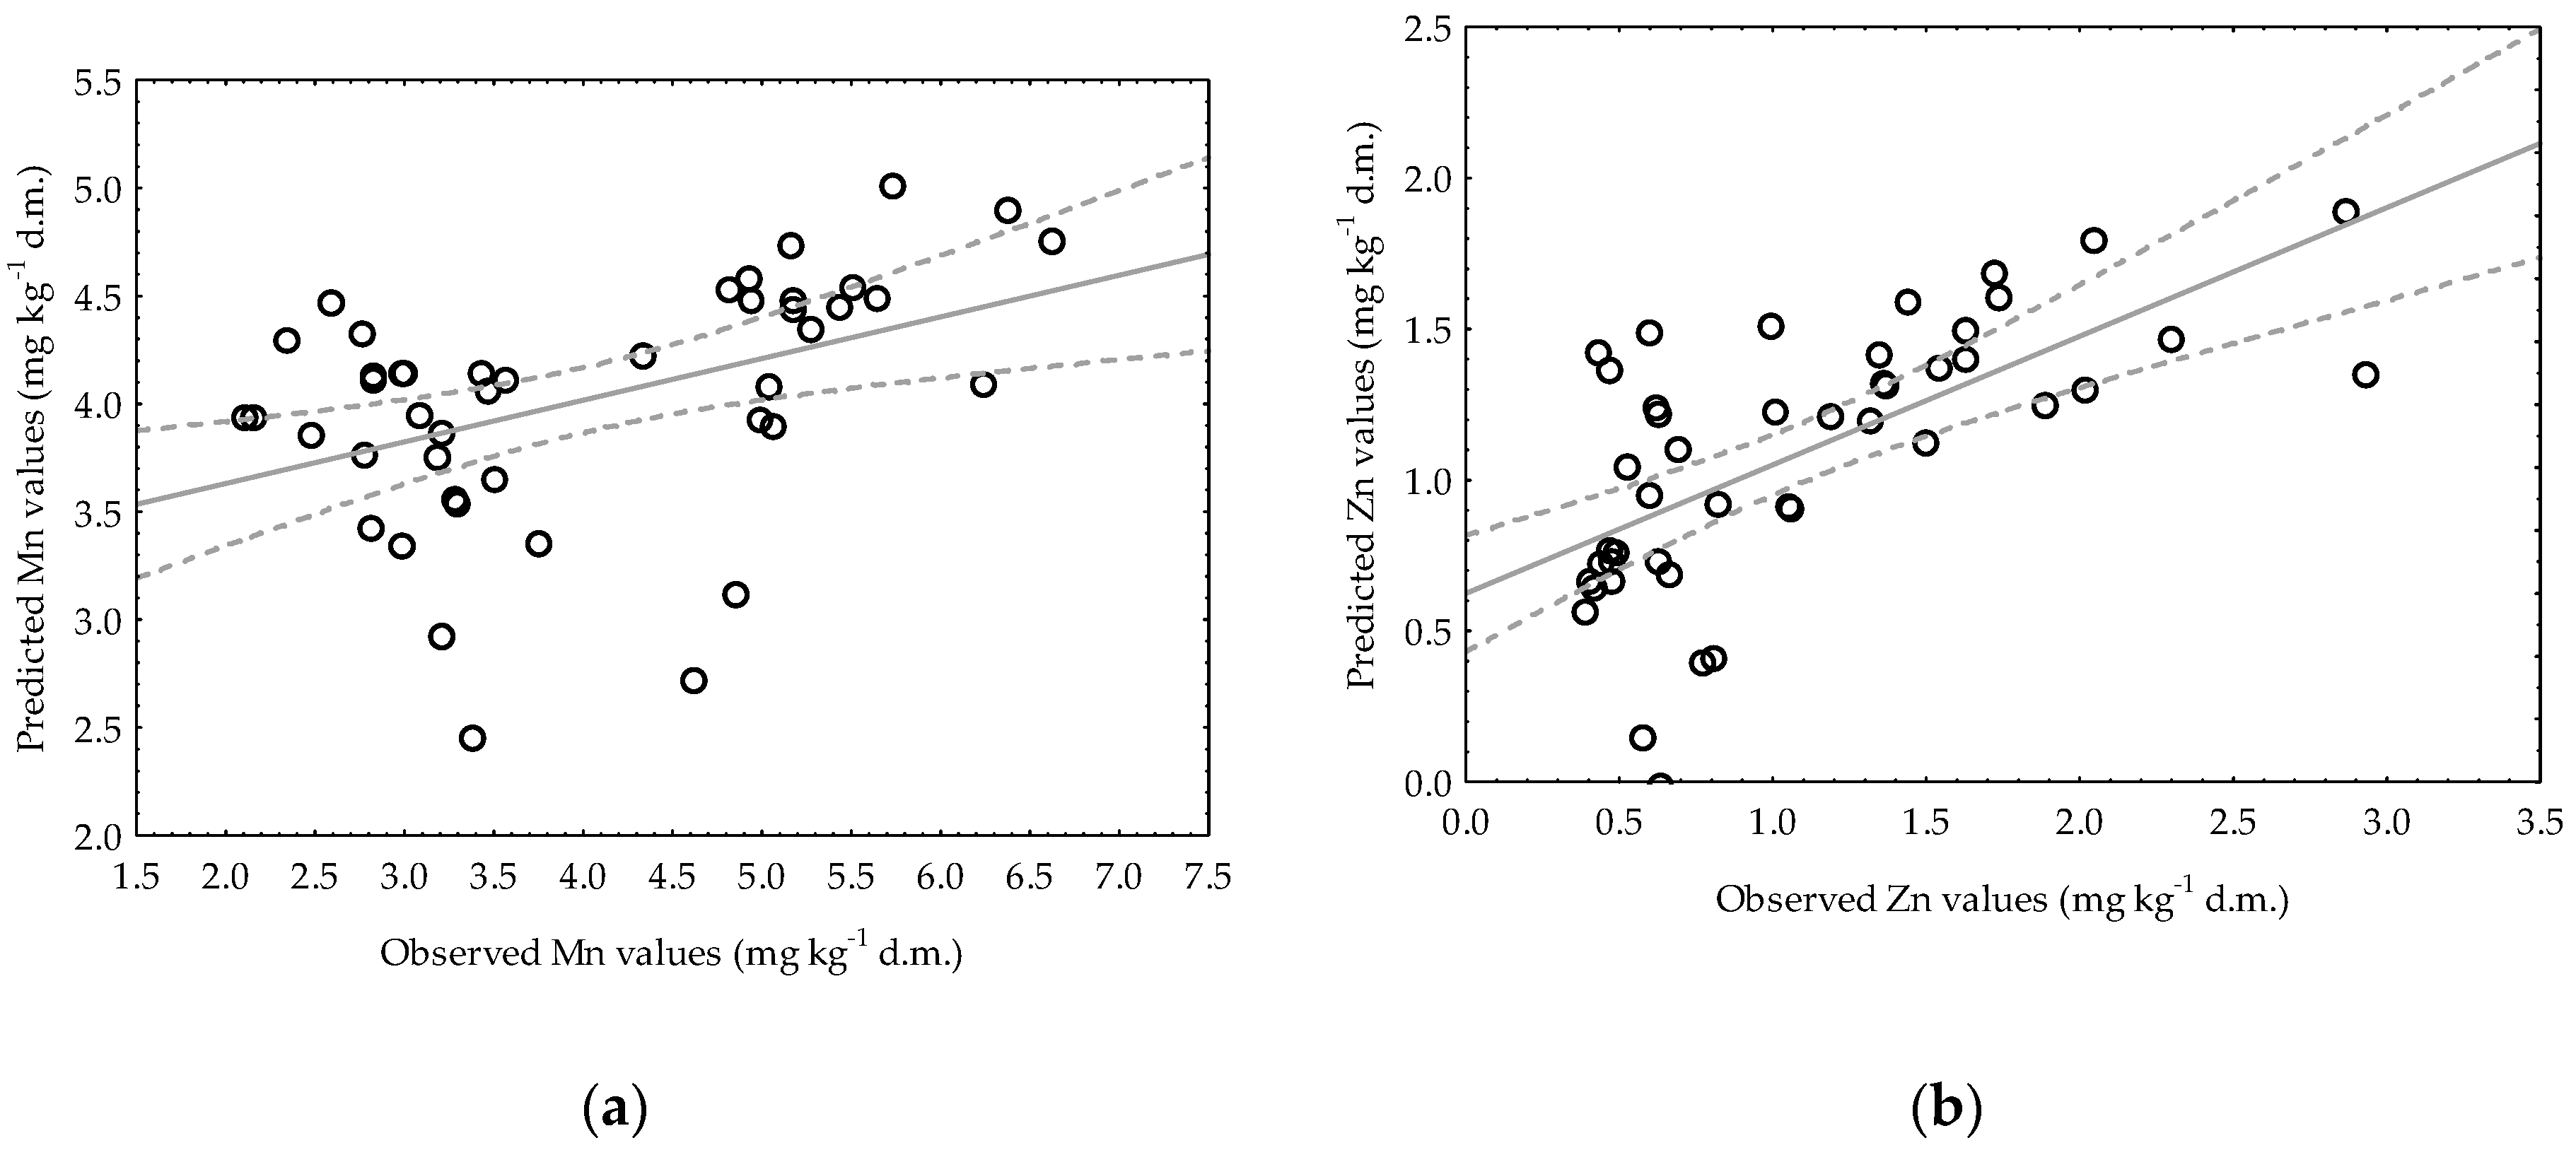
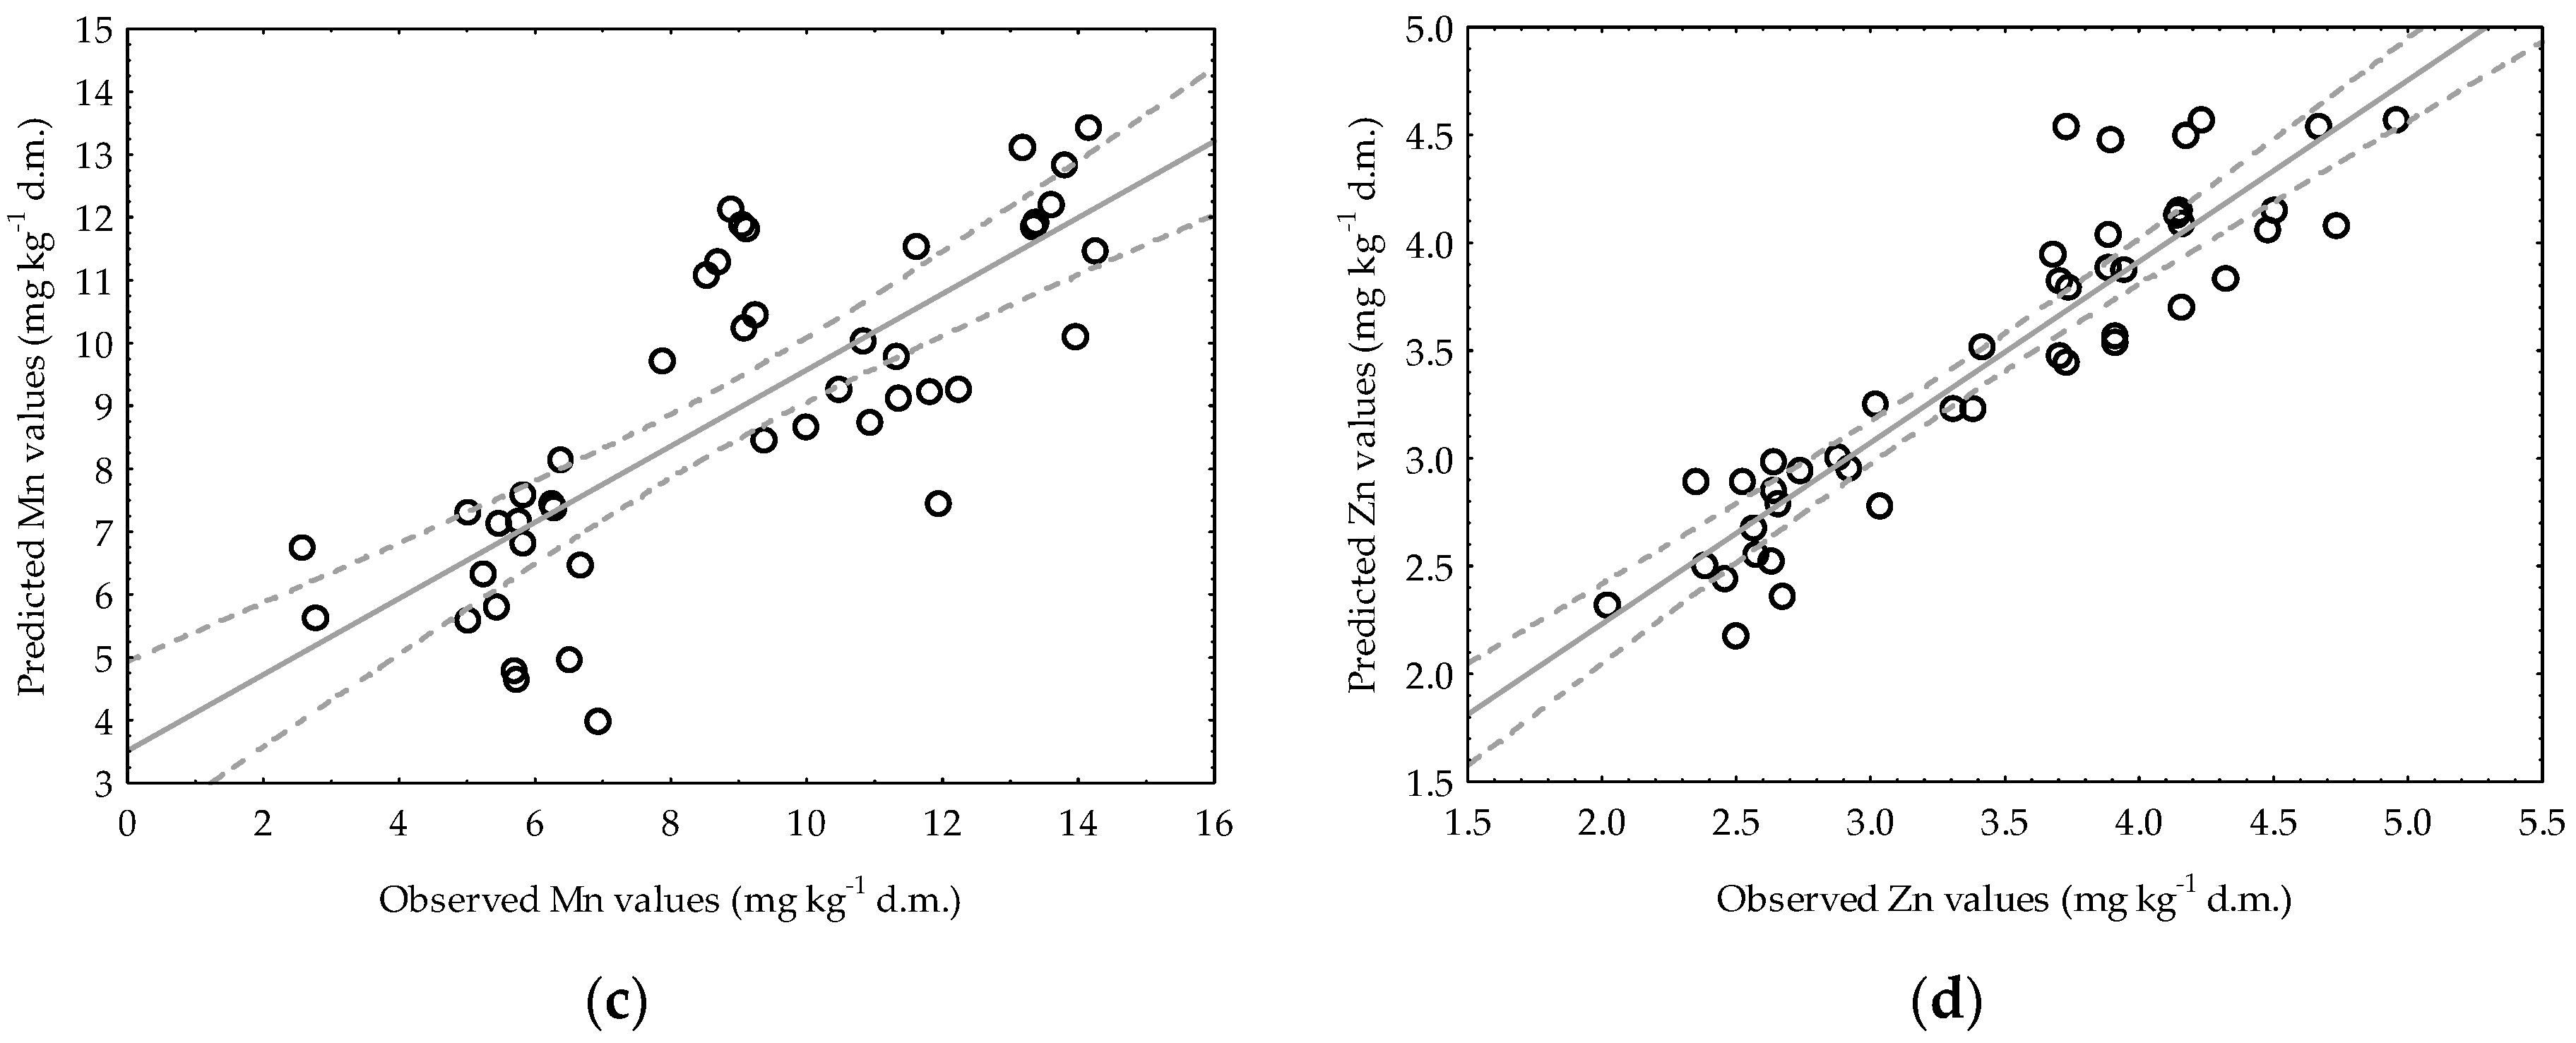
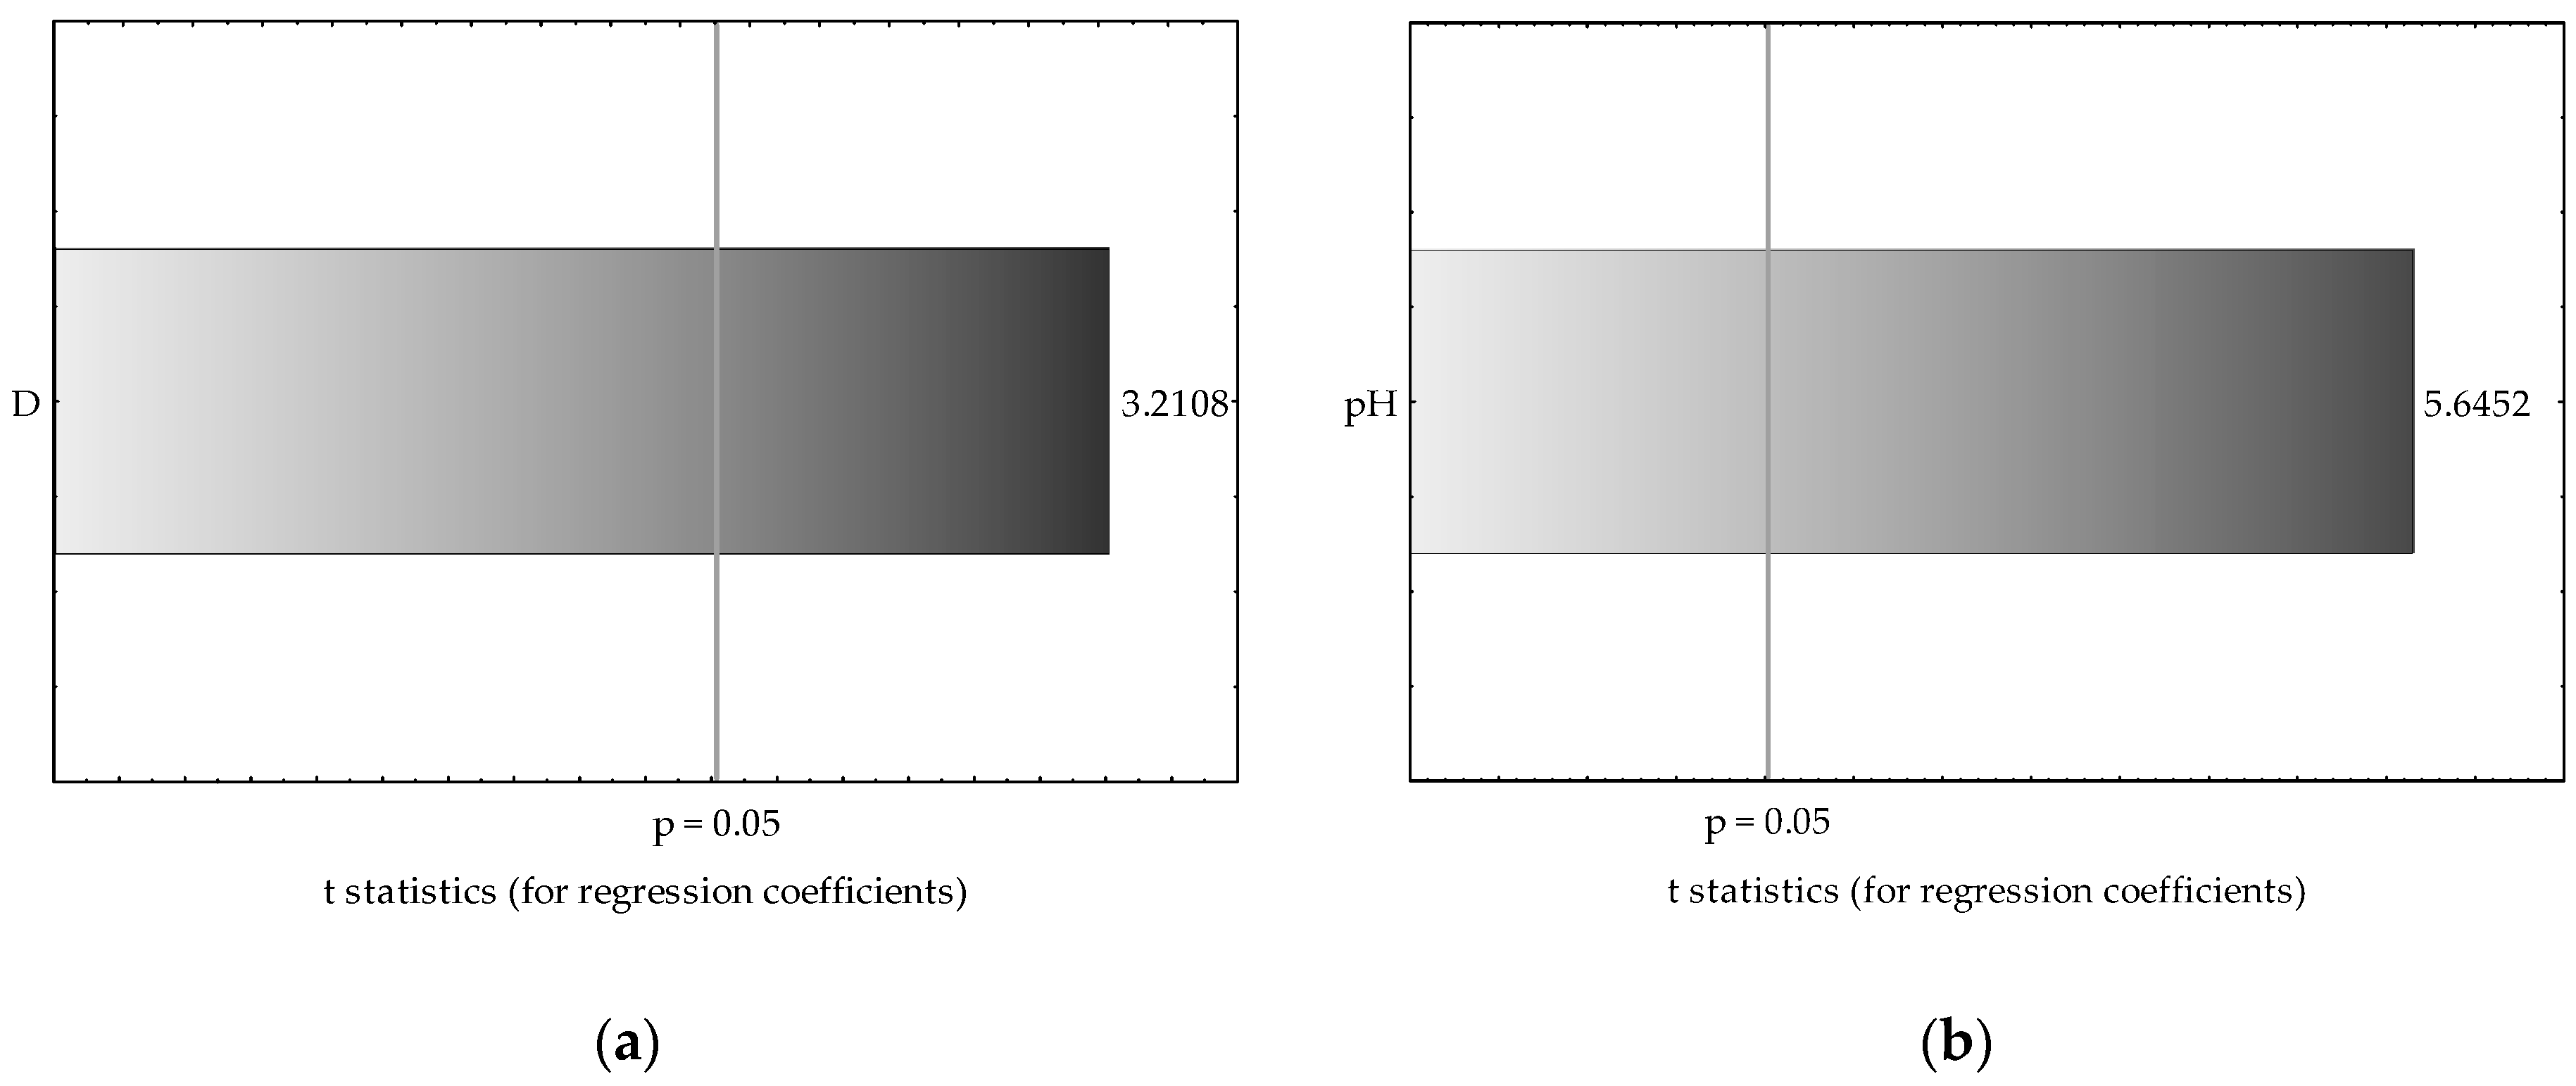
3.3. Application of Multiple Regression Analysis for Predicting Manganese and Zinc Availability in Soils
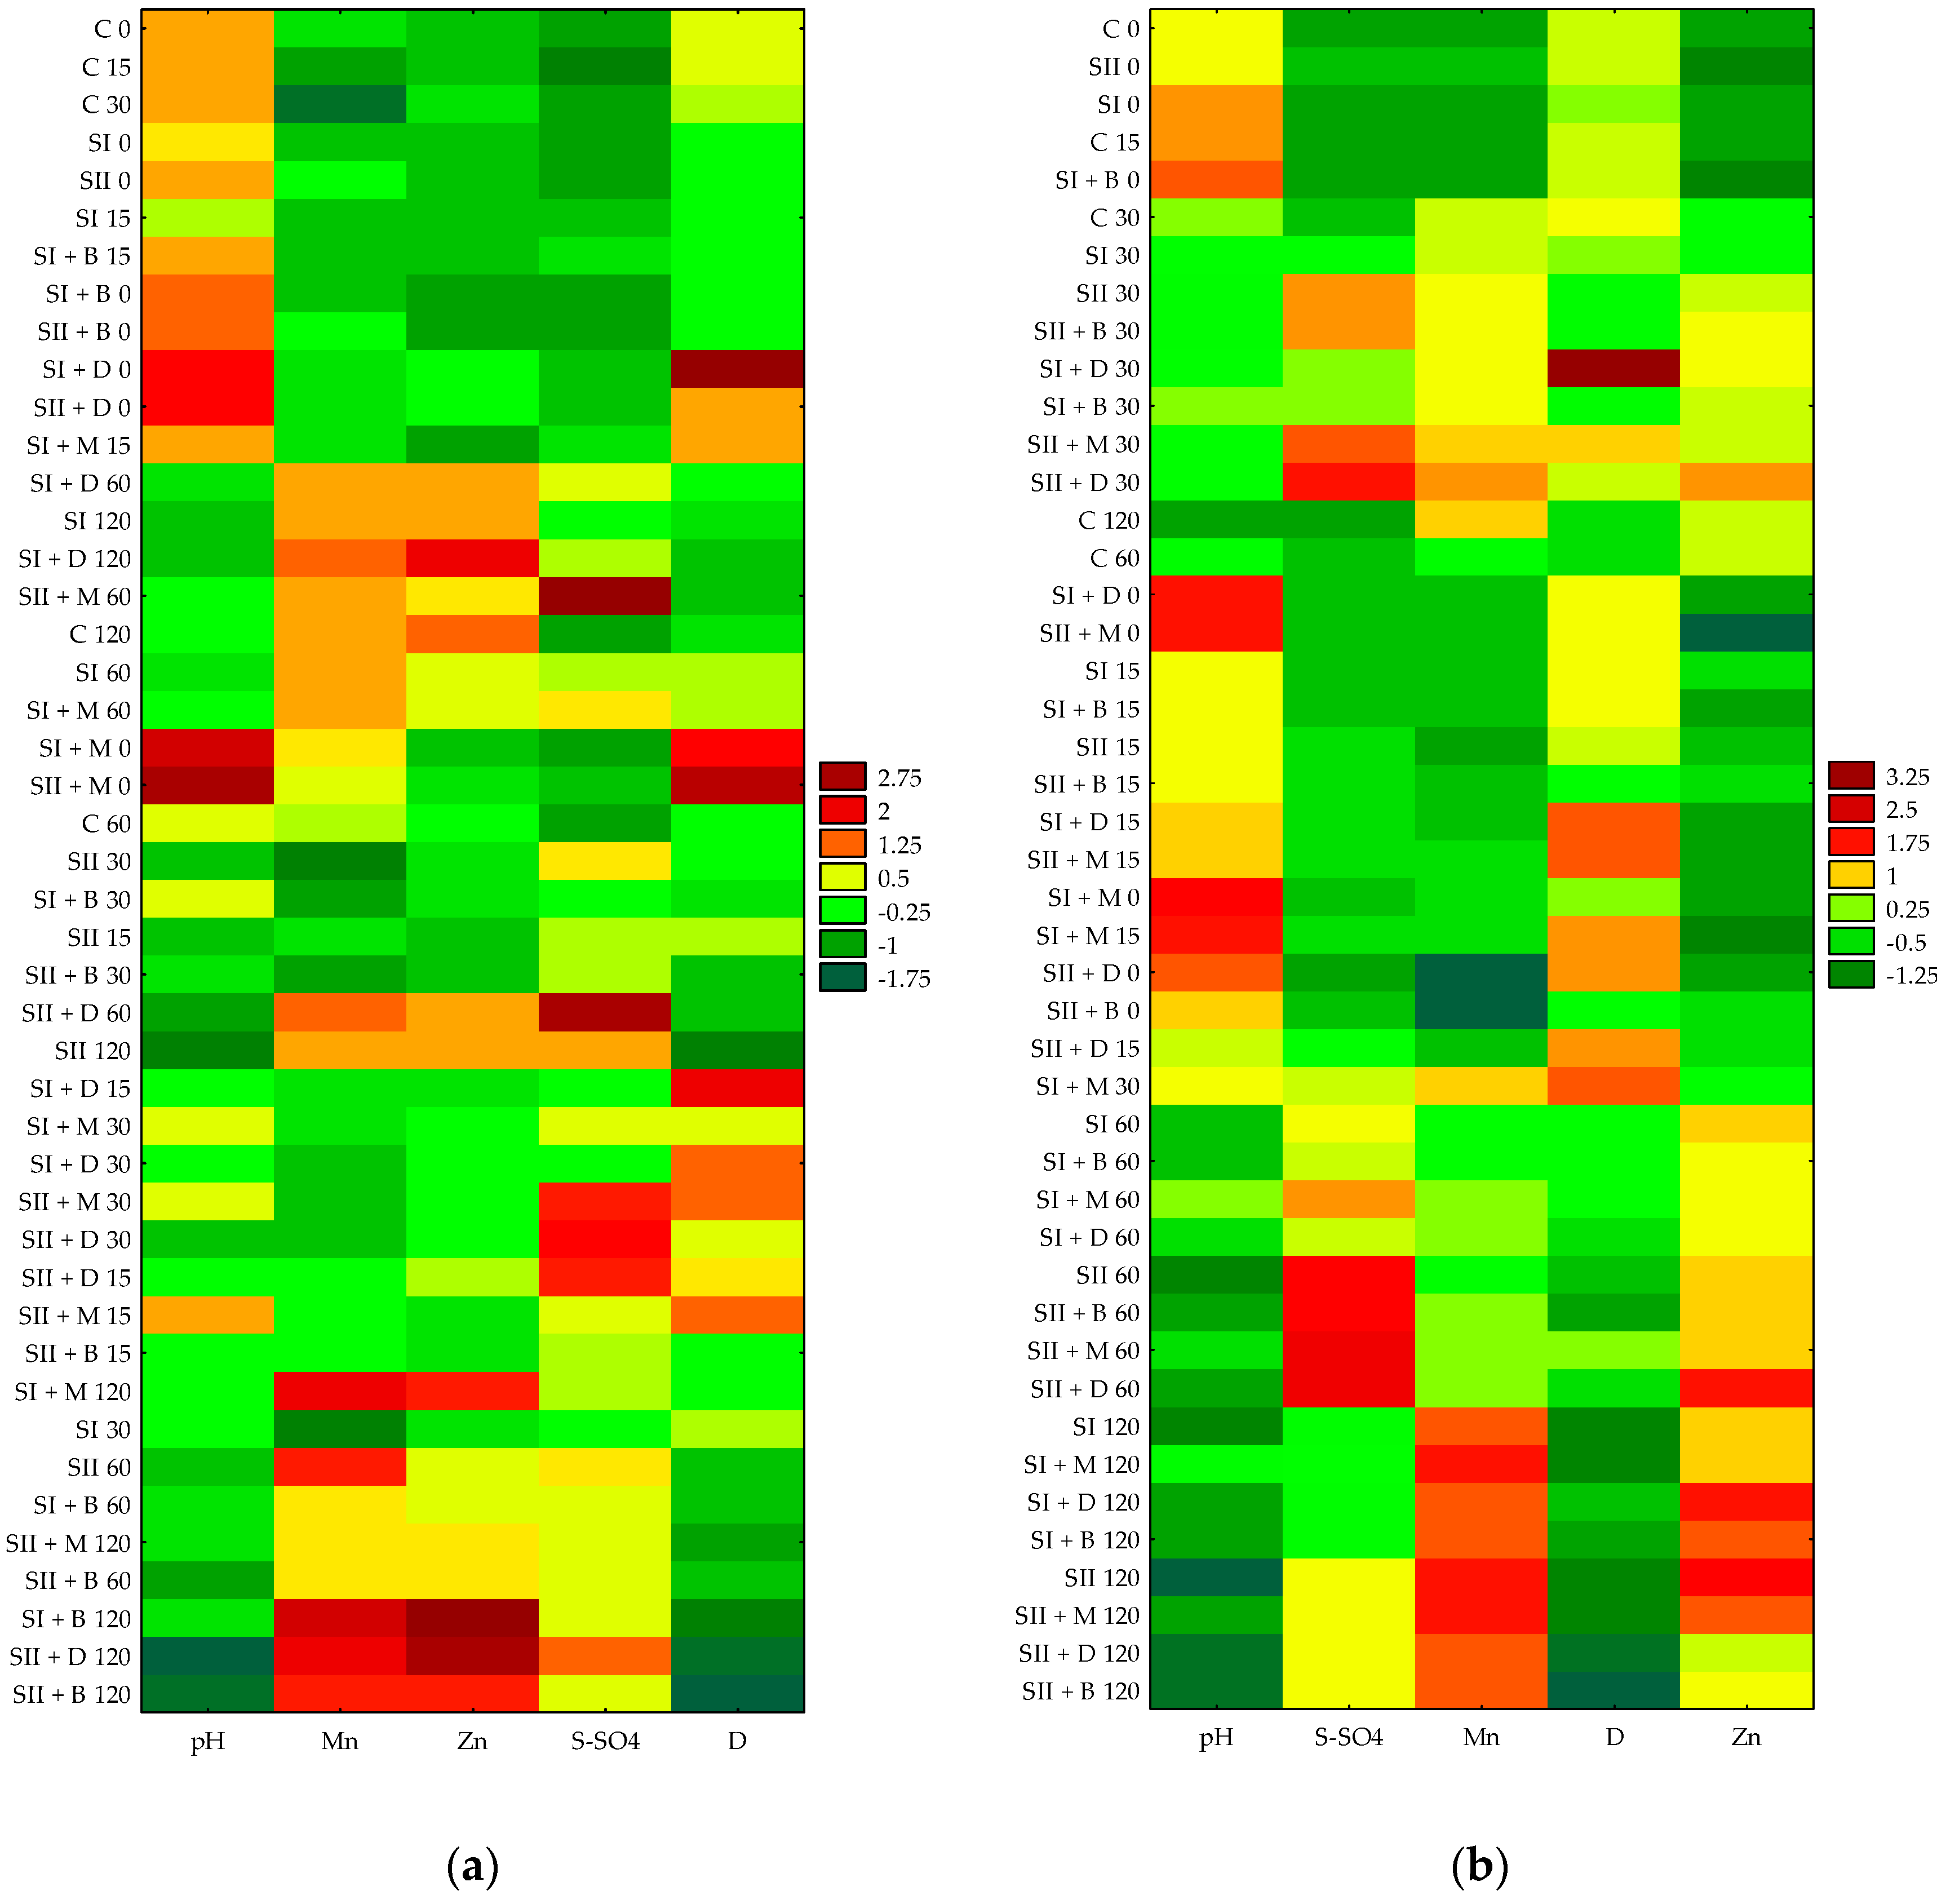
3.4. Heatmaps of Selected Soil Parameters as a Function of Different Treatments
3.5. Principal Component Analysis (PCA) Biplots to Show the Distribution of Experimental Treatments
3.6. Comments on the Results of Advanced Statistical Analyses
4. Conclusions
Author Contributions
Funding
Data Availability Statement
Conflicts of Interest
References
- Gródek-Szostak, Z.; Luc, M.; Szeląg-Sikora, A.; Sikora, J.; Niemiec, M.; Ochoa Siguencia, L.; Velinov, E. Promotion of RES in a Technology Transfer Network. Case Study of the Enterprise Europe Network. Energies 2020, 13, 3445. [Google Scholar] [CrossRef]
- Gródek-Szostak, Z.; Adamczyk, J.; Luc, M.; Suder, M.; Tora, J.; Kotulewicz-Wisińska, K.; Zysk, W.; Szeląg-Sikora, A. Hard Cash in Hard Times—The Effect of Institutional Support for Businesses Shaken by COVID-19. Sustainability 2022, 14, 4399. [Google Scholar] [CrossRef]
- Wojnarowska, M.; Sołtysik, M.; Prusak, A. Impact of eco-labelling on the implementation of sustainable production and consumption. Environ. Impact Assess. Rev. 2021, 86, 106505. [Google Scholar] [CrossRef]
- Nilsson, M.; Griggs, D.; Visbeck, M. Map the interactions between sustainable development goals. Nature 2016, 534, 320–322. [Google Scholar] [CrossRef] [PubMed] [Green Version]
- The Swedish Research Council for Environment, Agricultural Sciences and Spatial Planning (Formas); VINNOVA. Swedish Research and Innovation Strategy for a Bio-Based Economy. 2012. Available online: https://www.formas.se/download/18.462d60ec167c69393b91e60f/1549956092919/Strategy_Biobased_Ekonomy_hela.pdf (accessed on 25 August 2022).
- McCormick, K.; Kautto, N. The bioeconomy in Europe: An overview. Sustainability 2013, 5, 2589–2608. [Google Scholar] [CrossRef] [Green Version]
- Donner, M.; de Vries, H. How to innovate business models for a circular bio-economy? Bus. Strategy Environ. 2021, 30, 1932–1947. [Google Scholar] [CrossRef]
- European Commission. Closing the Loop—An EU Action Plan for the Circular Economy; European Commission: Brussels, Belgium, 2015.
- European Commission. A Sustainable Bioeconomy for Europe: Strengthening the Connection between Economy society and the environment Updated Bioeconomy Strategy; European Commission: Brussels, Belgium, 2018.
- OECD. The Bioeconomy to 2030 Designing a Policy Agenda-Main Findings and Policy Conclusions Organisation for Economic Co-Operation and Development (OECD); OECD: Paris, France, 2009. [Google Scholar]
- UN General Assembly. Transforming our World: The 2030 Agenda for Sustainable Development—Resolution A/RES/70/1 Adopted by the General Sssembly on 25 September 2015. Available online: https://www.un.org/en/development/desa/population/migration/generalassembly/docs/globalcompact/A_RES_70_1_E.pdf (accessed on 25 August 2022).
- Geng, Y.; Sarkis, J.; Bleischwitz, R. How to globalize the circular economy. Nature 2019, 565, 153–155. [Google Scholar] [CrossRef] [Green Version]
- Schroeder, P.; Anggraeni, K.; Weber, U. The relevance of circular economy practices to the sustainable development goals. J. Ind. Ecol. 2018, 23, 77–95. [Google Scholar] [CrossRef] [Green Version]
- European Commission. EU Biodiversity Strategy for 2030–Bringing Nature Back Into Our Lives. 2020. Available online: https://eur-lex.europa.eu/legal-content/EN/TXT/?qid=1590574123338&uri=CELEX:52020DC0380 (accessed on 20 August 2022).
- Jones, A.; Panagos, P.; Barcelo, S.; Bouraoui, F.; Bosco, C.; Dewitte, O.; Gardi, C.; Erhard, M.; Hervas, D.F.; Hiederer, R.; et al. The State of Soil in Europe: A Contribution of the JRC to the European Environment Agency’s Environment State and Outlook Report—SOER 2010; Publications office of the European Union: Luxembourg, 2012; p. 80. [CrossRef]
- FAO; ITPS. Status of the World’s Soil Resources (SWSR)—Main Report; Food and Agriculture Organization of the United Nations and Intergovernmental Technical Panel on Soils: Rome, Italy, 2015; p. 607. Available online: http://www.fao.org/3/i5199e/i5199e.pdf (accessed on 20 August 2022).
- Lal, R. Restoring soil quality to mitigate soil degradation. Sustainability 2015, 7, 5875–5895. [Google Scholar] [CrossRef]
- Oberč, B.P.; Schnell, A.A. Approaches to Sustainable Agriculture. Exploring the Pathways towards the Future of Farming; Iucn, E., Ed.; IUCN EURO: Brussels, Belgium, 2020. [Google Scholar]
- Kandil, A.H.T.; Cheira, M.F.; Gado, H.S.; Soliman, M.H.; Akl, H.M. Ammonium sulfate preparation from phosphogypsum waste. J. Radiat. Res. Appl. Sci. 2017, 10, 24–33. [Google Scholar] [CrossRef] [Green Version]
- Törnwall, E.; Pettersson, H.; Thorin, E.; Schwede, S. Post-treatment of biogas digestate—An evaluation of ammonium recovery, energy use and sanitation. Energy Procedia 2017, 142, 957–963. [Google Scholar] [CrossRef]
- Lamastra, L.; Suciu, N.A.; Trevisan, M. Sewage sludge for sustainable agriculture: Contaminants’ contents and potential use as fertilizer. Chem. Biol. Technol. Ag. 2018, 5, 10. [Google Scholar] [CrossRef] [Green Version]
- Szymańska, M.; Sosulski, T.; Szara, E.; Wąs, A.; Sulewski, P.; van Pruissen, G.W.P.; Cornelissen, R.L. Ammonium sulphate from a bio-refinery system as a fertilizer-agronomic and economic effectiveness on the farm scale. Energies 2019, 12, 4721. [Google Scholar] [CrossRef] [Green Version]
- Lisowska, A.; Filipek-Mazur, B.; Komorowska, M.; Niemiec, M.; Bar-Michalczyk, D.; Kuboń, M.; Tabor, S.; Gródek-Szostak, Z.; Szeląg-Sikora, A.; Sikora, J.; et al. Environmental and production aspects of using fertilizers based on waste elemental sulfur and organic materials. Materials 2022, 15, 3387. [Google Scholar] [CrossRef] [PubMed]
- Blake-Kalff, M.M.A.; Zhao, F.J.; Hawkesford, M.J.; Mcgrath, S.P. Using plant analysis to predict yield losses caused by sulphur deficiency. Ann. Appl. Biol. 2001, 138, 123–127. [Google Scholar] [CrossRef]
- Scherer, H.W. Sulphur in crop production—Invited paper. Eur. J. Agron. 2001, 14, 81–111. [Google Scholar] [CrossRef]
- Mukwevho, E.; Ferreira, Z.; Ayeleso, A. Potential role of sulfur-containing antioxidant systems in highly oxidative environments. Molecules 2014, 19, 19376–19389. [Google Scholar] [CrossRef] [PubMed] [Green Version]
- Engardt, M.; Simpson, D.; Schwikowski, M.; Granat, L. Deposition of sulphur and nitrogen in Europe 1900–2050. Model calculations and comparison to historical observations. Tellus B Chem. Phys. Meteorol. 2017, 69, 1328945. [Google Scholar] [CrossRef] [Green Version]
- Siebielec, G.; Smreczak, B.; Klimkowicz-Pawlas, A.; Kowalik, M.; Kaczyński, R.; Koza, P.; Ukalska-Jaruga, A.; Łysiak, M.; Wójtowicz, U.; Poręba, L.; et al. Report from the third stage of the contract implementation. In Monitoring of Chemistry of Arable Soils in Poland in 2015–2017; IUNG-PIB Puławy: Puławy, Poland, 2017; pp. 1–170. [Google Scholar]
- Giovanelli, J.; Mudd, S.H.; Datko, A.H. Sulphur amino acids in plants. In The Biochemistry of Plants; Miflin, B.J., Lea, P.J., Eds.; Academic Press: New York, NY, USA, 1980; Volume 5, pp. 453–506. [Google Scholar]
- Haq, K.; Ali, M. Biologically active sulphur compounds of plant origin. In Sulphur in Plants; Abrol, Y.P.R., Ahmad, A., Eds.; Springer: Dordrecht, The Netherlands, 2003; pp. 375–386. [Google Scholar] [CrossRef]
- Droux, M. Sulfur assimilation and the role of sulfur in plant metabolism: A survey. Photosynth. Res. 2004, 79, 33–48. [Google Scholar] [CrossRef]
- Durenkamp, M.; De Kok, L.J. Impact of pedospheric, atmospheric sulphur nutrition on sulphur metabolism of Allium cepa L. a species with a potential sink capacity for secondary sulphur compounds. J. Exp. Bot. 2004, 55, 1821–1830. [Google Scholar] [CrossRef] [Green Version]
- Kertesz, M.A.; Fellows, E.; Schmalenberger, A. Rhizobacteria and plant sulfur supply. Adv. Appl. Microbiol. 2007, 62, 235–268. [Google Scholar] [CrossRef] [PubMed]
- Zhao, F.J.; Tausz, M.; De Kok, L.J. Role of sulfur for plant production in agricultural and natural ecosystems. In Sulfur Metabolism in Phototrophic Organisms; Hell, R., Dahl, C., Knaff, D.B., Leustek, T., Eds.; Springer: New York, NY, USA, 2008; Volume 27, pp. 417–435. [Google Scholar] [CrossRef]
- Salvagiotti, F.; Castellarín, J.M.; Miralles, D.J.; Pedrol, H.M. Sulfur fertilization improves nitrogen use efficiency in wheat by increasing nitrogen uptake. Field Crops Res. 2009, 113, 170–177. [Google Scholar] [CrossRef]
- Katerova, Z.; Miteva, L.P.E. Glutathione and herbicide resistance in plants. In Ascorbate-Glutathione Pathway and Stress Tolerance in Plants; Anjum, N.A., Chan, M.T., Umar, S., Eds.; Springer: Dordrecht, The Netherlands, 2010; pp. 191–207. [Google Scholar] [CrossRef]
- Rendig, V.V.; Oputa, C.; McComb, E.A. Effects of sulfur deficiency on non-protein nitrogen, soluble sugars, and N/S ratios in young corn (Zea mays L.) plants. Plant Soil. 1976, 44, 423–437. [Google Scholar] [CrossRef]
- Fuentes-Lara, L.O.; Medrano-Macías, J.; Pérez-Labrada, F.; Rivas-Martínez, E.N.; GarcíaEnciso, E.L.; González-Morales, S.; Juárez-Maldonado, A.; Rincón-Sánchez, F.; Benavides-Mendoza, A. From elemental sulfur to hydrogen sulfide in agricultural soils and plants. Molecules 2019, 24, 2282. [Google Scholar] [CrossRef] [Green Version]
- Marschner, H. Mineral nutrition of higher plants, 2nd ed.; Academic Press: London, UK, 1995; pp. 1–889. [Google Scholar]
- Alejandro, S.; Höller, S.; Meier, B.; Peiter, E. Manganese in plants: From acquisition to subcellular allocation. Front. Plant Sci. 2020, 11, 300. [Google Scholar] [CrossRef] [Green Version]
- PTG. Particle size distribution and textural classes of soils and mineral materials–classification of Polish Society of Soil Science 2008. Rocz. Glebozn.-Soil Sci. Annu. 2009, 60, 5–16. Available online: http://ssa.ptg.sggw.pl/files/artykuly/2009_60/2009_tom_60_2/tom_60_2_005-016.pdf (accessed on 25 August 2022).
- Analiza chemiczno-rolnicza gleby-Pobieranie próbek. pracowana na podstawie PN-R-04031:1997. Available online: http://oschr-bydgoszcz.pl/Dokumenty/Instrukcja%20pobierania%20probek%20glebowych.pdf (accessed on 20 August 2022).
- Kabata-Pendias, A.; Piotrowska, M.; Motowicka-Terelak, T.; Maliszewska-Kordybach, B.; Filipiak, K.; Krakowiak, A.; Pietruch, C. Podstawy oceny chemicznego zanieczyszczenia gleb. Metale ciężkie, siarka i WWA. Biblioteka Monitoringu Środowiska; PIOŚ, IUNG: Warszawa, Poland, 1995; p. 41. [Google Scholar]
- Thalmann, A. Methods of dehydrogenase activity determination with triphenyltetrazoliumchlorid (TTC). Landwirtsch. Forsch. 1968, 21, 249–258. [Google Scholar]
- Warzyński, H.; Sosnowska, A.; Harasimiuk, A. Effect of variable content of organic matter and carbonates on results of determination of granulometric composition by means of Casagrande’s areometric method in modification by Prószyński. Soil Sci. Annu. 2018, 69, 39–48. [Google Scholar] [CrossRef]
- Soaud, A.A.; Al Darwish, F.H.; Saleh, M.E.; El-Tarabily, K.A.; Sofian-Azirun, M.; Rahman, M.M. Effects of elemental sulfur, phosphorus, micronutrients and Paracoccus versutus on nutrient availability of calcareous soils. Aust. J. Crop Sci. 2011, 5, 554–561. [Google Scholar]
- Cifuentes, F.R.; Lindemann, W.C. Organic matter stimulation of elemental sulfur oxidation in a calcareous soil. Soil Sci. Soc. Am. J. 1993, 57, 727–731. [Google Scholar] [CrossRef]
- Skwierawska, M.; Zawartka, L.; Zawadzki, B. The effect of different rates and forms of sulphur applied on changes of soil agrochemical properties. Plant Soil Environ. 2008, 54, 171–177. [Google Scholar] [CrossRef] [Green Version]
- Cui, Y.; Wang, Q. Interaction effect of zinc and elemental sulfur on their uptake by spring wheat. J. Plant Nutr. 2005, 28, 639–649. [Google Scholar] [CrossRef]
- Tabak, M.; Lisowska, A.; Filipek-Mazur, B.; Antonkiewicz, J. The effect of amending soil with waste elemental sulfur on the availability of selected macroelements and heavy metals. Processes 2020, 8, 1245. [Google Scholar] [CrossRef]
- Baikhamurova, M.O.; Sainova, G.A.; Akbasova, A.D.; Anarbekova, G.D.; Ozler, M.A. The influence of the mixture of vermicompost and sulphur-perlite-containing waste on the yield and the quality of crops. J. Water Land Dev. 2021, 49, 213–218. [Google Scholar] [CrossRef]
- Zhao, C.; Degryse, F.; Gupta, V.; McLaughlin, M.J. Elemental sulfur oxidation in Australian cropping soils. Soil Sci. Soc. Am. J. 2015, 79, 89–96. [Google Scholar] [CrossRef]
- Mattiello, E.M.; da Silva, R.C.; Degryse, F.; Baird, R.; Gupta, V.V.S.R.; McLaughlin, M.J. Sulfur and zinc availability from co-granulated Zn-enriched elemental sulfur fertilizers. J. Agric. Food Chem. 2017, 65, 1108–1115. [Google Scholar] [CrossRef] [Green Version]
- Fageria, N.K.; Baligar, V.C. Ameliorating soil acidity of tropical oxisols by liming for sustainable crop production. Adv. Agron. 2008, 65, 345–399. [Google Scholar] [CrossRef]
- Alloway, B.J. Soil factors associated with zinc deficiency in crops and humans. Environ. Geochem. Health 2009, 31, 537–548. [Google Scholar] [CrossRef]
- Sadeghzadeh, B. A review of zinc nutrition and plant breeding. J. Soil Sci. Plant Nutr. 2013, 13, 905–927. [Google Scholar] [CrossRef]
- Kaur, H.; Garg, N. Zinc toxicity in plants: A review. Planta 2021, 253, 905–927. [Google Scholar] [CrossRef]
- Alloway, B.J. Micronutrient Deficiencies in Global Crop Production; Springer: Heidelberg, Germany, 2008; p. 370. [Google Scholar] [CrossRef]
- Antoniadis, V.; Levizou, E.; Shaheen, S.M.; Ok, Y.S.; Sebastian, A.; Baum, C.; Prasad, M.N.V.; Wenzel, W.W.; Rinklebe, J. Trace elements in the soil-plant interface: Phytoavailability, translocation, and phytoremediation–a review. Earth-Sci. Rev. 2017, 171, 621–645. [Google Scholar] [CrossRef]
- Neina, D. The role of soil pH in plant nutrition and soil remediation. Appl. Environ. Soil Sci. 2019, 5794869. [Google Scholar] [CrossRef] [Green Version]
- Harisuseno, D.; Cahya, E.N. Determination of soil infiltration rate equation based on soil properties using multiple linear regression. J. Water Land Dev. 2020, 47, 77–88. [Google Scholar] [CrossRef]
- Pentoś, K.; Mbah, J.T.; Pieczarka, K.; Niedbała, G.; Wojciechowski, T. Evaluation of multiple linear regression and machine learning approaches to predict soil compaction and shear stress based on electrical parameters. Appl. Sci. 2022, 12, 8791. [Google Scholar] [CrossRef]
- Rajan, N.M.; Neelamegam, P.; Thatheyus, A.J. Multiple linear and non-linear regression analyses of various soil and terrain indices with regard to their efficiency in the determination of temporal changes in LST values within Trichy district of Tamil Nadu, India. Environ. Monit. Assess. 2022, 194, 138. [Google Scholar] [CrossRef]
- Brubaker, S.C.; Jones, A.J.; Frank, K.; Lewis, D.T. Regression models for estimating soil properties by landscape position. Soil Sci. Soc. Am. J. 1994, 58, 1763–1767. [Google Scholar] [CrossRef]
- Tabak, M.; Lisowska, A.; Filipek-Mazur, B. Bioavailability of sulfur from waste obtained during biogas desulfurization and the effect of sulfur on soil acidity and biological activity. Processes 2020, 8, 863. [Google Scholar] [CrossRef]
- Attoe, O.J.; Olson, R.A. Factors affecting rate of oxidation in soils of elemental sulfur and that added in rock phosphate-sulfur fusions. Soil Sci. 1966, 101, 317–325. [Google Scholar] [CrossRef]
- Dall’Orsoletta, D.J.; Mumbach, G.L.; Brignoli, F.M.; Gatiboni, L.C. Elemental sulfur recommendation for pH reduction in soils from Southern Brazil. Rev. Bras. Eng. Agricola Ambient. 2022, 26, 212–218. [Google Scholar] [CrossRef]
- Kulczycki, G. The effect of elemental sulfur fertilization on plant yields and soil properties. Adv. Agron. 2021, 167, 105–181. [Google Scholar] [CrossRef]
- Zhao, C.; Gupta, V.V.S.R.; Degryse, F.; McLaughlin, M.J. Abundance and diversity of S-oxidising bacteria and their role in elemental sulphur oxidation in Australian cropping soils. Biol. Fert. Soils 2016, 53, 159–169. [Google Scholar] [CrossRef]
- Harahuc, L.; Lizama, H.M.; Suzuki, I. Selective inhibition of the oxidation of ferrous iron or sulfur in Thiobacillus ferrooxidans. Appl. Environ. Microbiol. 2000, 66, 1031–1037. [Google Scholar] [CrossRef] [PubMed] [Green Version]
- Balík, J.; Kulhánek, M.; Černý, J.; Száková, J.; Pavlíková, D.; Čermák, P. Differences in soil sulfur fractions due to limitation of atmospheric deposition. Plant. Soil Environ. 2009, 55, 344–352. [Google Scholar] [CrossRef] [Green Version]
- Mierzwa-Hersztek, M.; Wolny-Koładka, K.; Gondek, K.; Gałązka, A.; Gawryjołek, K. Effect of coapplication of biochar and nutrients on microbiocenotic composition, dehydrogenase activity index and chemical properties of sandy soil. Waste Biomass Valor. 2020, 11, 3911–3923. [Google Scholar] [CrossRef] [Green Version]
- Scherer, H.W.; Metker, D.J.; Welp, G. Effect of long-term organic amendments on chemical and microbial properties of a luvisol. Plant Soil Environ. 2011, 57, 513–518. [Google Scholar] [CrossRef] [Green Version]
- Cenini, V.; Fornara, D.; Mcmullan, G.; Ternan, N.; Carolan, R.; Crawley, M.J.; Clement, J.C.; Lavorel, S. Linkages between extracellular enzyme activities and the carbon and nitrogen content of grassland soils. Soil Biol. Biochem. 2016, 96, 198–206. [Google Scholar] [CrossRef] [Green Version]
- Siczek, A.; Frąc, M.; Gryta, A.; Kalembasa, S.; Kalembasa, D. Variation in soil microbial population and enzyme activities under faba bean as affected by pentachlorophenol. Appl. Soil Ecol. 2020, 150, 103466. [Google Scholar] [CrossRef]
- Wang, A.S.; Angle, J.S.; Chaney, R.L.; Delorme, T.A.; Reeves, R.D. Soil pH effects on uptake of Cd and Zn by Thlaspi caerulescens. Plant Soil 2006, 281, 325–337. [Google Scholar] [CrossRef]
- Matos Castañon, T.H.F.; de Aquino, B.F.; Bonfim-Silva, E.M.; Almeida Lima, I.M.; Barreto Damasce, A.P.A. Management of sulphur fertilizer in forage sorghum crop cultivated in eutrophic cambisol with alkaline pH. Aust. J. Crop Sci. 2019, 13, 1258–1266. [Google Scholar] [CrossRef]
- Hanousek, O.; Prohaska, T.; Kulhanek, M.; Balik, J.; Tejnecky, V.; Berger, T.W. Fractionation of sulfur (S) in beech (Fagus sylvatica) forest soils in relation to distance from the stem base as useful tool for modeling S biogeochemistry. Model. Earth Syst. Environ. 2017, 3, 1065–1079. [Google Scholar] [CrossRef]


| Soil | Soil Texture, % | Maximum Water Capacity, % | pHKCl | Hydrolytic Acidity, mmol (+) kg−1 d.m. | Available S, mg kg−1 d.m. | |||||||
|---|---|---|---|---|---|---|---|---|---|---|---|---|
| 1–0.1 | 0.1–0.02 | <0.02 | ||||||||||
| mm | ||||||||||||
| Very light | 85 | 10 | 5 | 20.5 | 5.04 | 14.9 | 3.57 | |||||
| Heavy soil | 10 | 49 | 41 | 43.9 | 4.35 | 41.6 | 10.37 | |||||
| Total Forms, mg kg−1 d.m. | ||||||||||||
| N | C | S | Fe | Mn | Zn | Cu | Cr | Ni | Pb | Cd | Hg | |
| Very light | 0.605 × 10³ | 8.23 × 10³ | 97.6 | 2.70 × 10³ | 106 | 23.9 | 4.27 | 3.86 | 3.18 | 7.13 | 0.683 | Traces |
| Heavy soil | 1.59 × 10³ | 19.7 × 10³ | 231 | 7.56 × 10³ | 396 | 67.6 | 9.48 | 16.8 | 6.74 | 25.5 | 0.792 | Traces |
| No. | Experiment Treatments | Abbreviation |
|---|---|---|
| 1. | Control soil (without additions) | C |
| 2. | Soil with the addition of waste sulfur (sulfur dose: I) | SI |
| 3. | Soil with the addition of waste sulfur (sulfur dose: I) and manure | SI + M |
| 4. | Soil with the addition of waste sulfur (sulfur dose: I) and digestate | SI + D |
| 5. | Soil with the addition of waste sulfur (sulfur dose: I) and biochar | SI + B |
| 6. | Soil with the addition of waste sulfur (sulfur dose: II) | SII |
| 7. | Soil with the addition of waste sulfur (sulfur dose: II) and manure | SII + M |
| 8. | Soil with the addition of waste sulfur (sulfur dose: II) and digestate | SII + D |
| 9. | Soil with the addition of waste sulfur (sulfur dose: II) and biochar | SII + B |
| Parameter | Waste Sulfur | Manure | Digestate | Biochar |
|---|---|---|---|---|
| d.m., % | 32.3 | 93.7 | 25.1 | 98.7 |
| Organic matter, g kg−1 d.m. | – | 652 | 552 | 954 |
| Total N, g kg−1 d.m. | 4.19 | 31.3 | 35.7 | 4.63 |
| Total C, g kg−1 d.m. | 20.3 | 330 | 311 | 516 |
| Total S, g kg−1 d.m. | 864 | 5,19 | 9.00 | 0.199 |
| Total Fe, g kg−1 d.m. | 2.95 | 1.68 | 9.09 | 0.999 |
| Total Mn, mg kg−1 d.m. | Traces | 377 | 337 | 363 |
| Total Zn, mg kg−1 d.m. | Traces | 266 | 716 | 42.9 |
| Total Cu, mg kg−1 d.m. | Traces | 57.0 | 169 | 6.83 |
| Total Cr, mg kg−1 d.m. | Traces | 7.34 | 51.5 | 46.9 |
| Total Ni, mg kg−1 d.m. | Traces | 4.42 | 24.6 | 26.4 |
| Total Pb, mg kg−1 d.m. | Traces | 1.05 | 22.2 | 0.816 |
| Total Cd, mg kg−1 d.m. | Traces | 0.225 | 1.46 | 0.025 |
| Total Hg, mg kg−1 d.m. | Not determined | traces | 0.659 | traces |
| Treatment * | Number of Incubation Days | ||||
|---|---|---|---|---|---|
| 0 | 15 | 30 | 60 | 120 | |
| Very Light Soil | |||||
| C | 0.440 a ** ± 0.040 | 0.477 ab ± 0.012 | 0.626 abc ± 0.062 | 1.063 def ± 0.027 | 1.889 kl ± 0.094 |
| SI | 0.469 ab ± 0.105 | 0. 527 abc ± 0.078 | 0.628 abc ± 0.004 | 1.366 ghi ± 0.371 | 1.628 ijk ± 0.108 |
| SII | 0.487 ab ± 0.035 | 0.434 a ± 0.060 | 0.596 abc ± 0.098 | 1.350 ghi ± 0.186 | 1.722 jk ± 0.112 |
| SI + M | 0.575 abc ± 0.043 | 0.402 a ± 0.084 | 0.818 cd ± 0.191 | 1.318 fgh ± 0.355 | 2.013 l ± 0.252 |
| SI + D | 0.808 cd ± 0.081 | 0.692 abc ± 0.052 | 1.010 de ± 0.030 | 1.625 ijk ± 0.309 | 2.294 m ± 0.123 |
| SI + B | 0.388 a ± 0.092 | 0.472 ab ± 0.088 | 0.597 abc ± 0.050 | 1.358 ghi ± 0.321 | 2.933 n ± 0.076 |
| SII + M | 0.633 abc ± 0.143 | 0.663 abc ± 0.054 | 1.051 def ± 0.064 | 1.496 hij ± 0.276 | 1.538 hij ± 0.127 |
| SII + D | 0.770 bcd ± 0.175 | 1.186 efg ± 0.201 | 0.996 de ± 0.211 | 1.733 jk ± 0.133 | 2.867 n ± 0.180 |
| SII + B | 0.421 a ± 0.101 | 0.622 abc ± 0.006 | 0.470 ab ± 0.105 | 1.444 ghij ± 0.259 | 2.046 lm ± 0.084 |
| Heavy Soil | |||||
| C | 2.52 bc ± 0.08 | 2.56 bcd ± 0.18 | 3.38 fg ± 0.17 | 3.70 ghi ± 0.17 | 3.71 ghi ± 0.18 |
| SI | 2.58 bcd ± 0.27 | 2.92 cde ± 0.27 | 3.41 fg ± 0.25 | 4.16 ijk ± 0.29 | 4.14 hijk ± 0.06 |
| SII | 2.35 ab ± 0.14 | 2.73 bcd ± 0.18 | 3.68 gh ± 0.10 | 4.23 jk ± 0.01 | 4.95 m ± 0.19 |
| SI + M | 2.50 bc ± 0.05 | 2.46 bc ± 0.02 | 3.30 efg ± 0.06 | 3.91 hij ± 0.06 | 4.16 ijk ± 0.11 |
| SI + D | 2.67 bcd ± 0.28 | 2.64 bcd ± 0.22 | 3.91 hij ± 0.28 | 3.89 hij ± 0.14 | 4.73 lm ± 0.27 |
| SI + B | 2.38 ab ± 0.24 | 2.64 bcd ± 0.09 | 3.73 ghi ± 0.10 | 3.88 hij ± 0.23 | 4.48 kl ± 0.25 |
| SII + M | 2.02 a ± 0.11 | 2.66 bcd ± 0.30 | 3.73 ghi ± 0.17 | 4.14 hijk ± 0.26 | 4.51 kl ± 0.25 |
| SII + D | 2.63 bcd ± 0.09 | 3.02 def ± 0.19 | 4.32 jkl ± 0.16 | 4.67 lm ± 0.26 | 3.73 ghi ± 0.52 |
| SII + B | 3.03 def ± 0.39 | 2.88 cde ± 0.47 | 3.94 hij ± 0.58 | 4.17 ijk ± 0.13 | 3.89 hij ± 0.52 |
| Treatment * | Number of Incubation Days | ||||
|---|---|---|---|---|---|
| 0 | 15 | 30 | 60 | 120 | |
| Very Light Soil | |||||
| C | 3.21 defghi ** ± 0.70 | 2.48 abcd ± 0.09 | 2.10 a ± 0.05 | 4.33 jk ± 0.14 | 5.28 lmno ± 0.36 |
| SI | 3.00 cdefgh ± 0.14 | 2.82 bcdefg ± 0.19 | 2.15 ab ± 0.15 | 4.99 klmn ± 0.58 | 5.18 lmno ± 0.02 |
| SII | 3.47 fghi ± 0.64 | 3.08 defghi ± 0.18 | 2.34 abc ± 0.05 | 5.65 nop ± 1.15 | 5.17 lmno ± 0.47 |
| SI + M | 4.86 klm ± 0.24 | 3.29 efghi ± 0.19 | 3.19 defghi ± 0.14 | 5.06 lmno ± 0.46 | 6.24 pq ± 0.31 |
| SI + D | 3.38 fghi ± 0.13 | 3.21 defghi ± 0.16 | 2.82 bcdefg ± 0.14 | 5.04 klmno ± 0.33 | 5.44 mno ± 0.64 |
| SI + B | 2.99 cdefgh ± 0.17 | 2.83 bcdefg ± 0.26 | 2.76 abcdef ± 0.13 | 4.93 klmn ± 0.10 | 6.62 q ± 0.39 |
| SII + M | 4.62 kl ± 0.62 | 3.75 ij ± 0.10 | 2.99 cdefgh ± 0.25 | 5.17 lmno ± 0.97 | 4.93 klmn ± 0.08 |
| SII + D | 3.29 efghi ± 0.41 | 3.51 ghi ± 0.09 | 2.78 abcdefg ± 0.15 | 5.51 mno ± 0.24 | 6.38 q ± 0.28 |
| SII + B | 3.43 fghi ± 0.10 | 3.57 hi ± 0.15 | 2.59 abcde ± 0.07 | 4.81 klm ± 0.36 | 5.73 op ± 0.35 |
| Heavy Soil | |||||
| C | 5.02 a ± 0.09 | 5.25 ab ± 0.14 | 9.98 ghi ± 0.21 | 7.87 de ± 0.12 | 11.62 jk ± 1.09 |
| SI | 5.41 abc ± 0.11 | 6.26 abc ± 1.06 | 10.48 hij ± 0.45 | 8.69 efg ± 0.70 | 13.59 mn ± 2.06 |
| SII | 5.75 abc ± 0.09 | 5.47 abc ± 0.23 | 10.82 ijk ± 0.73 | 8.88 efg ± 0.45 | 14.15 n ± 0.65 |
| SI + M | 6.92 cd ± 0.36 | 6.49 abc ± 0.18 | 11.93 kl ± 0.12 | 9.37 fgh ± 0.43 | 13.95 n ± 0.78 |
| SI + D | 5.70 abc ± 0.49 | 5.83 abc ± 0.31 | 11.36 ijk ± 0.41 | 9.24 efgh ± 0.87 | 13.38 mn ± 1.38 |
| SI + B | 5.00 a ± 0.31 | 5.81 abc ± 0.04 | 10.93 ijk ± 0.31 | 8.51 ef ± 0.55 | 13.32 mn ± 1.17 |
| SII + M | 5.74 abc ± 0.45 | 6.67 bcd ± 0.81 | 11.81 jk ± 0.74 | 9.07 efgh ± 0.40 | 14.26 n ± 0.70 |
| SII + D | 5.19 ab ± 0.16 | 6.38 abc ± 0.26 | 12.23 klm ± 0.35 | 9.11 efgh ± 062 | 13.18 lmn ± 2.00 |
| SII + B | 5.43 abc ± 0.24 | 6.25 abc ± 0.33 | 11.33 ijk ± 1.13 | 9.04 efgh ± 0.27 | 13.81 n ± 2.03 |
| Elements | Regression Equations | R2 1 | R2adj. 2 | Se 3 | p4 |
|---|---|---|---|---|---|
| Very light soil | |||||
| Mn | 0.1934 | 0.1746 | 1.1432 | 0.0025 | |
| Zn | 0.4257 | 0.4123 | 0.5072 | 0.0000 | |
| Heavy soil | |||||
| Mn | 0.6060 | 0.5968 | 2.0888 | 0.0000 | |
| Zn | 0.8409 | 0.8334 | 0.3164 | 0.0013 | |
Publisher’s Note: MDPI stays neutral with regard to jurisdictional claims in published maps and institutional affiliations. |
© 2022 by the authors. Licensee MDPI, Basel, Switzerland. This article is an open access article distributed under the terms and conditions of the Creative Commons Attribution (CC BY) license (https://creativecommons.org/licenses/by/4.0/).
Share and Cite
Lisowska, A.; Filipek-Mazur, B.; Kalisz, A.; Gródek-Szostak, Z.; Kowalczyk, A. Supplementation of Soil with Waste Sulfur and Its Effect on Availability of Mn and Zn. Agronomy 2022, 12, 2679. https://doi.org/10.3390/agronomy12112679
Lisowska A, Filipek-Mazur B, Kalisz A, Gródek-Szostak Z, Kowalczyk A. Supplementation of Soil with Waste Sulfur and Its Effect on Availability of Mn and Zn. Agronomy. 2022; 12(11):2679. https://doi.org/10.3390/agronomy12112679
Chicago/Turabian StyleLisowska, Aneta, Barbara Filipek-Mazur, Andrzej Kalisz, Zofia Gródek-Szostak, and Agnieszka Kowalczyk. 2022. "Supplementation of Soil with Waste Sulfur and Its Effect on Availability of Mn and Zn" Agronomy 12, no. 11: 2679. https://doi.org/10.3390/agronomy12112679
APA StyleLisowska, A., Filipek-Mazur, B., Kalisz, A., Gródek-Szostak, Z., & Kowalczyk, A. (2022). Supplementation of Soil with Waste Sulfur and Its Effect on Availability of Mn and Zn. Agronomy, 12(11), 2679. https://doi.org/10.3390/agronomy12112679