Review

The Role of Radiation in the Modelling of Crop Evapotranspiration from Open Field to Indoor Crops

by
Jorge Flores-Velazquez
1,*,
Mohammad Akrami
2,* and
Edwin Villagrán
3
1
Hydrosciences, Postgraduate Collage, Carr Mex Tex Km 36.5, Montecillo 56230, Edo de Mexico, Mexico
2
Department of Engineering, University of Exeter, Exeter EX4 4QF, UK
3
Corporación Colombiana de Investigación Agropecuaria—Agrosavia, Centro de Investigación Tibaitata, Km 14, Vía Mosquera-Bogotá, Mosquera 250040, Colombia
*
Authors to whom correspondence should be addressed.
Agronomy 2022, 12(11), 2593; https://doi.org/10.3390/agronomy12112593
Submission received: 27 September 2022 / Revised: 16 October 2022 / Accepted: 17 October 2022 / Published: 22 October 2022

Abstract

:
The agricultural sector continues to be the largest consumer of useful water. Despite knowing the volume of water required by plants (evapotranspiration), methodologies must be adapted to current production systems. Based on the energy balance (radiation), it is feasible to establish models to estimate evapotranspiration depending on the production system: extensive crops, closed, and interior systems. The objective of this work was to present related research to measure and model the evapotranspiration of crops under current production techniques, based on the energy balance. The original FAO Penman–Monteith model is considered to be the model that best describes the evapotranspiration process, and with advances in instrumentation, there are sensors capable of measuring each of the variables it contains. From this model, procedures have been approximated for its use in extensive crops through remote sensing to calculate evapotranspiration, which jointly integrates the climatic variables and the type and age of the crop, with which real evapotranspiration is obtained. The same Penman–Monteith model has been adapted for use in greenhouse crops, where given the reduced root space and being in a closed environment, it is possible to know the variables specifically. Keeping the root container saturated, crop transpiration will basically depend on the physiology of the plant (LAI, stomatal resistance, etc.) and the characteristics of the air (radiation, VPD, wind speed, etc.). Models based on computational fluid dynamics (CFD) have been developed, which predict the real evapotranspiration of the crop by activating the discrete ordinate (DO) radiation sub-model. For indoor crops, in the absence of solar radiation, and replaced with artificial lights (LEDs)—although it is true that they are hydroponic crops and water can be estimated through a balance of levels—it would be possible to use CFD to estimate transpiration by transforming flux units (Mmol) into radiation (W m−2). The transpiration of indoor crops works as a cooling system and stabilizes the environment of the plant factory or vertical farm. In each crop production system (from open field to indoor crops) models have been developed to manage water and microclimate. The result is reports that more than 90% of the water is saved.

1. Introduction

The agricultural sector consumes an average of 69% of the available useful water in the world [1]. Among the efforts to reduce this volume of water, the importance of accurately estimating, both spatially and temporally, the transpiration of crops stands out [2]. Transpiration is a primary determinant of the balance of leaf energy and plant water status. This process includes water evaporation from the surface cells within the intercellular spaces and its diffusion outside the plant tissue. Together with the exchange of carbon dioxide (CO2), the water use efficiency of a plant is determined. The leaves lose water through their stomata as a consequence of the photosynthetic activity of the mesophyll cells [3].
Thornthwaite [4] introduces the concept of potential evapotranspiration or losses due to evapotranspiration, which combines the existence of optimal plant development and a permanently full field capacity, so that the crop is always hydrated. Crop water requirements are provided by evapotranspiration (ETo) [5]. This identifies the volume of water that would be effectively evaporated if the mobilizable water resources in the ground were at each instant at least equal to those that can be transformed into vapor by the interplay of hydrometeorological factors and vegetation. The amount of water that actually returns to the atmosphere is real evapotranspiration (evaporation and transpiration) under existing meteorological and soil moisture conditions.
To produce optimal crop yields, the water content in the soil or growing medium must be maintained between the limits when percolation occurs, and a point at which the crop is subject to minimum soil moisture stress. For water management in agricultural areas, models adapted to the type of production systems are created, from extensive open-field crops, semi-protected and protected systems, to current disruptive techniques such as plant factories or indoor crops. Protected agriculture and technological evolution have led to the measurement of environmental variables (°T, HR, Rg, wind), and sensors that make precise measurements together with tools from the Internet of things (IoT), generating records in real-time.
Knowing the detailed information regarding transpiration in a plant is complex due to the interactions between the physiological aspects of the plant and physical aspects in the immediate border of the leaves, as well as atmospheric variations in the surrounding environment. With technological contributions in the areas of data science, electronics, mechatronics, etc., there are currently tools with which it has been possible to accurately measure or estimate the irrigation requirement of crops. The disadvantage in current production systems is that the models were created under conditions of extensive cultivation, in open fields, in soil, and in specific climate conditions; thus, when extrapolating the method, given the inference of climatic data, the model normally over- or underestimates evapotranspiration.
The determination of evapotranspiration can be carried out directly, through the use of weighing lysimeters, eddy covariance (EC), the Bowen ratio or Bowen ratio energy balance system (BREBS), scintillometers, atmometers, sap flow or tension sensors, and crop water content [6]. Direct methods are accurate but provide punctual measurements and are impractical to quantify water needs on a regional scale, since several measurement points are necessary, which increases production costs [7]. Indirectly, there are micrometeorological and agronomic models, among which the Penman–Monteith, Medrano, Montero, Stanghellini, and Fyn models stand out, for different conditions [8,9,10,11]. Methodologies were also developed to define the moment of irrigation and the irrigation volume, depending on the soil, climatic, and crop variables [12,13,14,15]. However, they are still impractical for low and medium technology producers due to the investment they represent.
This work documents the evolution for the estimation of water consumption by plants in order to schedule irrigation through a model that determines what is referred to as evapotranspiration (ETo). In an initial stage, a model was structured that included climate factors that were difficult to measure; therefore, it had to wait for the creation of sensors that could measure, for example, wind speed and its resistance, both in the air and in the leaves of a crop (stomata). After this, simplified models were developed that contemplate only one climatic variable (temperature) or two (relative humidity), but that, in practice, over (or under)-estimate the water requirement for the crop as a function of geographic location. The result of this effort led to a model that was consolidated to estimate this parameter, known as the FAO Penman–Monteith model, considered the standard model for estimating crop evapotranspiration and thereby estimating irrigation requirements and their scheduling. However, its estimation is still complex; first, in the extrapolation of results, and then, in the definition of the application surface, which was resolved by remote sensing using satellite images, which use the refraction of radiation for remote sensing of areas and their handling. In general, solar radiation has been the central climatic factor from which it has been possible to create models that allow estimating the requirement and scheduling of irrigation. The FAO Penman–Monteith model was the starting point for the simplification of models with the same purpose in greenhouses and in urban areas, and radiation is the climatic factor that defines the production of crops indoors, by artificially providing the lengths of wave that are required for the photosynthesis of the plant, transpiration, photosynthesis, and the heat of the environment. Among the problems that current agriculture faces in its different forms of production is the efficient use of resources, the main one being the water–energy–CO2 nexus, for which it is considered that this research contributes to the efficient use of water by presenting conceptual bases for choosing the models that best estimate their use depending on the production system.
The objective of this work is to document the evolution of the radiation variable in the methodologies to estimate crop evapotranspiration, under extensive conditions, in a controlled environment, and what function it adopts in the growing sector of indoor agriculture.

2. Solar Radiation in Evapotranspiration Models

The Penman–Monteith model [2,16] is one of those most used for estimating potential evapotranspiration, since it takes into account the climatology of the place, as showed in Equation (1).
E T 0 = 0.408 ( R n G ) + γ 900 T + 273 u 2 ( e s e a ) + γ ( 1 + 0.34 u 2 )
where E T 0 = potential evapotranspiration, mm   dia 1 ; R n = net radiation in the crop canopy [ MJ   m 2   dia 1 ]; R a = extraterrestrial radiation [ mm   dia 1 ]; G = heat flux in soil [ MJ   m 2   dia 1 ]; T = air average temperature at 2 m height [ ° C ]; u 2 = wind velocity at 2 m height, [ m   s 1 ]; e s = saturation vapor pressure [ kPa ]; e a = real vapor pressure [ kPa ]; e s e a = vapor pressure deficit [ kPa ]; = slope of the vapor pressure curve [ kPa   ° C 1 ], and γ = psychrometric constant [ kPa   ° C 1 ]. Katsoulas and Stanggellini [17] described the physics of the model, highlighting the role of the energy balance from solar radiation and the fluxes derived from it. The energy available for evapotranspiration or net radiation (Rn [W m−2]) is equal to the energy coming from the sun minus the reflected radiation and the thermal radiation emitted into the atmosphere [18]. Part of the net radiation can be felt as sensible heat flux (H [W m−2]), another part is stored in the ground (G1 [W m−2]) and other objects such as woody material (G2 [W m−2]), and the rest of the energy is absorbed by the water, which can be converted into steam or latent heat flux (LE (W m−2)).
It is necessary to have energy available to cause the heat exchange per mass of water to vaporize the water, and this is called the latent heat of vaporization (LE [W m−2]). The LE is the energy required for the phase change to occur, also known as the latent heat of evaporation. When liquid water turns to steam, it absorbs heat, causing a temperature drop in its surroundings. LE removes the more energetic vapor molecules from the liquid, which lowers the mean energy of the remaining molecules, thus lowering the temperature of the liquid. When the vapor condenses back to a liquid or solid, the absorbed energy is released as sensible heat. The energy balance is calculated with Equation (2):
R n = H + L E + G 1 + G 2
Rn Net radiation (W m−2) can be measured directly with a radiation meter (net radiometer) or calculated from latitude. Sensible heat flux (H) can be measured with a thermometer or with eddy covariance; soil heat flux G1 can be measured with soil heat flux plates, and G2 can be measured with a surface infrared thermometer. Therefore, LE can be calculated from the four known measurements. Like the water balance, it can be difficult to close the energy balance. In the energy balance equation, Rn can be considered an upper limit for LE, but this energy does not take into account the phenomenon of advection and the conditions of wind variations.

3. Extensive Crop Evapotranspiration and Advances in Remote Sensing

An important challenge in the agricultural sector, in addition to food safety, is the efficient use of water and energy, which implies the precise calculation of the water that the plant requires and applying it in the same amount. The methodologies (models) were established considering specific aspects of soil, climate, and crop, and in the open field (Penman, Penman–Monteith, FAO Penman–Monteith). Rojas et al. [19] proposed the accumulated thermal time method, with which they were able to calculate an average of 12 irrigations per day. The crop water stress index (CWSI) has also been used, which expresses stress in terms of energy balance and is included in the image analysis to determine the time of irrigation as part of Agriculture 4.0. Smigaj et al. [20,21] indicated that it is possible to detect heat stress by thermography using mini cameras, which is effective for various types of climates and with the same principle of heat balance. Using heat stress indices, it is possible to detect the physiological condition of the crop throughout the day, since heat stress causes a decrease in the activity of the Rubisco enzyme, chlorophyll synthesis, and electron transport [22,23]. This can occur even with sufficient humidity [24,25].

3.1. Energy Balance Using Remote Sensing

Models based on the land surface energy balance convert satellite-detected radiation into land surface features to estimate evapotranspiration as a residual of the land surface energy balance equation [7,26]. With the energy balance models, it is necessary to know the type of crop and its phenological stage. Furthermore, these models can quantify the reduction of LE due to lack of either water, salinity, or frost; they also detect increases in LE due to evaporation from bare soil. Among the energy balance models of land surface, the most widely used are the SEBAL algorithm (surface energy balance algorithm for land) [27,28], its successor METRIC (mapping evapotranspiration at high resolution with internalized calibration) [29,30], and the SSEB algorithm (simplified surface energy balance) [31].

3.1.1. Surface Energy Balance Algorithm for Land (SEBAL)

The SEBAL algorithm was developed to quantify evapotranspiration over large areas using energy fluxes at the Earth’s surface based on remote sensing; it was developed in the Netherlands by [28]. SEBAL estimates the real (instantaneous) evapotranspiration (ETr) for each individual pixel of the image in terms of instantaneous latent heat flux (LE), and is calculated as a residual of the surface energy balance equation at the time the satellite passes by Equation (3):
L E = R n G H
where: LE = latent heat flux (W m−2); Rn = net radiation flux (W m−2); G = heat flux in the soil (W m−2); and H = sensible heat flux (W m−2).
The SEBAL model calculates each of the components of Equation (2) using characteristics of the Earth’s surface, such as surface temperature (Ts), normalized difference vegetation index (NDVI), leaf area index (LAI), the albedo of the surface (a), and emissivity (e). These features of the Earth’s surface are derived from satellite radiation in the visible, near-infrared, and thermal infrared portions of the electromagnetic (EM) spectrum [31].
The net radiation (Rn) at the surface represents the actual rate of radiant energy at the surface, which is divided into G, H, and LE [31]. Rn is estimated from the radiation balance at the Earth’s surface; that is, it is expressed as the difference of all incoming radiant fluxes and all outgoing radiant fluxes, as shown in Equation (4):
R n = ( 1   α )   R s + R L R L   ( 1 ε 0   ) R L
where: RS = incoming shortwave radiation (W m−2); α = surface albedo (dimensionless); RL = incoming long wave radiation (W m−2); RL = outgoing longwave radiation (W m−2); and ε0 = thermal emissivity of the surface (dimensionless). All the components are calculated using standard logarithms and/or Earth surface parameters. Soil heat flux (G) is defined as the rate of heat storage in soil and vegetation by conduction [31]. The soil heat flux is calculated with a function derived by Bastiaanssen [28], as a fraction of the net radiation that includes surface parameters such as surface albedo, surface temperature, and the normalized difference vegetation index (NDVI); hence, in SEBAL, G is calculated as Equation (5):
G R n = Ts α ( 0.0038   α   + 0.0074   α 2   ) ( 1 0.98 NDVI   )
where: Ts = surface temperature (K); α = surface albedo (dimensionless); and NDVI = normalized difference vegetation index (dimensionless). The latent heat flux, H (Equation (6)) was introduced by Monteith in 1963 and 1964, and later in works published by [32,33,34,35,36]. The sensible heat flux (H) is calculated using Equation (6), provided by Senkondo et al. [37,38], and commonly known as the aerodynamic function (or heat transport equation):
H = r air C p   dT r ah  
where ρ air = specific mass of air (kg m−3); Cp = specific heat of air at constant pressure (J kg−1 K−1); rah = aerodynamic resistance to heat transfer (s m−1) between two heights close to the surface; and dT = temperature difference near the surface (K).
The SEBAL model uses the near-surface temperature gradient (dT) between the land surface and the air, estimated as an indexed function of the radiometric surface temperature (Ts), thus eliminating the need for absolutely accurate surface temperature (Ts) or air temperature (Ta), and measurements to estimate sensible heat flux (H) [28], as shown in Equation (7):
dT = aT s + b
The definition of coefficients a and b requires a choice of two pixels, which represent the extreme conditions of temperature and humidity, referred to as hot pixels and cold pixels. The cold pixel is a well-irrigated crop surface with full coverage and surface temperature (Ts) close to air temperature (Ta). The hot pixel is a dry bare agricultural field where λET is assumed to be 0. The two pixels link the calculations for all other pixels between these two points. An iterative form is carried out from neutral stability assumptions for the estimation of sensible heat flux using atmospheric stability corrections based on Monin–Obukhov length [39]. Once the instantaneous latent heat flux, λET, is calculated as the residual of the energy balance, it is used to calculate the instantaneous evaporative fraction (Λ) using Equation (8):
Λ = λ ET λ ET + H   = λ ET R n G  
The instantaneous evaporation fraction (Λ) expresses the relationship between the real evaporation demand and that of the crop when the atmospheric humidity conditions are in equilibrium with the soil humidity conditions. On daily time scales, ET24 (mm day−1) can be calculated with Equation (9):
ET 24 = 86 , 400 × 10 3 λ ρ w Λ R n 24
where: Rn24 = average net radiation in 24 h (W m−2); λ = latent heat of vaporization (J kg−1); and ρ w = especific mass of water (kg m−3). The SEBAL model has been applied in different parts of the world to estimate evapotranspiration in riparian zones, at the basin level, to estimate crop coefficients and to quantify irrigation on demand. However, the main drawback of SEBAL is defining the anchor pixels, since when the conditions in the image do not exist to select these pixels, the assumptions may not be valid and the SEBAL approach may be invalid [7]. On the other hand, the main advantages of SEBAL are the minimal use of ground-based ancillary data; automatic internal correction, which avoids strict correction of atmospheric effects on surface temperature; and internal calibration, which is performed within each image analyzed [40].

3.1.2. Mapping Evapotranspiration at High Resolution and Internalized Calibration (METRIC)

METRIC [41,42] is a model that uses satellite images containing both shortwave bands and thermal bands to estimate evapotranspiration with high resolution (30 m) over large areas, which allows to evaluate the water consumption of crops plot by plot [5]. The estimation of evapotranspiration in METRIC is based on the principle of conservation of energy, so ET is estimated as a residual of the energy balance using Equation (2); in the estimation, the model ignores the minor energetic components and considers only the vertical fluxes (the horizontal adverted flux is not explicitly included) [26]. The energy absorbed in the canopy and the energy used in the photosynthesis of plants corresponds to a very small percentage, so it is neglected in Equation (2) [42].
In METRIC, the net radiation (Rn) is calculated using Equation (4) from the satellite-measured short band reflectance and surface temperature using the algorithms described in [41,42]. Soil heat flux (G) is estimated using the empirical equation developed by Tasumi et al. [43]. Equations (10) and (11).
G R n = 0.05 + 0.18 e 0.521   LAI   ( LAI     0.5 )
G R n = 1.80 ( Ts 273.15 ) R n + 0.084 ( LAI   <   0.5 )
where Rn = net radiation (W m2); LAI = leaf area index (dimensionless); and Ts = surface temperature (K). Equations (10) and (11) suggests that when the leaf area index (LAI) is less than 0.5, the G/Rn ratio increases with higher Ts rates and decreases with increasing LAI [42]. In METRIC, the sensible heat flux (H) is calculated using the aerodynamic function (Equation (6)), in the same way as it is done with the SEBAL model. To do this, both models use the CIMEC procedure (calibration using inverse modeling of extreme conditions) to calibrate the temperature difference function between the surface and the air, dT, based on a regression relationship between dT and radiometric surface temperature, Ts, of two “anchor” pixels. dT can be estimated as a linear function of surface temperature [27]. The anchor pixels ideally represent the conditions of an agricultural field with full plant cover and actively transpiring (“cold” pixel), and a bare agricultural field with no plant cover (“hot” pixel) [5].
The main difference between SEBAL and METRIC is that the latter model uses the reference evapotranspiration for the alfalfa crop (ETr) from the local meteorological station, thus incorporating the climatic conditions, while SEBAL uses the potential evaporation of a body of water in the area, so it is considered that the sensible heat flux and the soil heat flux are equal to zero [44]. The precision in the calculation of LE in these models depends on the precision with which the other components of the energy balance (Rn, G, and H) are calculated [26].

3.1.3. Simplified Surface Energy Balance (SSEB)

The SSEB model is a simplified version of the surface energy balance approach to estimate ET, which retains the main assumptions of SEBAL [27] and METRIC [30]. These last two models assume that the temperature between the land surface and the air varies linearly. This linear relationship is obtained by selecting two anchor pixels, known as cold pixels and hot pixels, which represent well-watered agricultural fields with full coverage where ET is at maximum and bare agricultural fields where ET is at minimum or zero, respectively. The aforementioned linear relationship is used to estimate the sensible heat flux (H). The SSEB model also assumes that the latent heat flux (ET) also varies linearly between hot and cold pixels, since the temperature difference between the ground surface and the air is linearly related to soil humidity, so that ET is estimated from the near-surface temperature difference, which in turn is estimated from the ground surface temperatures of the hot and cold pixels in the study area, i.e., while the hot pixel experiences little ET and the cold pixel experiences maximum ET, the remaining pixels will experience ET in proportion to their earth surface temperature relative to the hot and cold pixels [31].
Under the assumption that hot pixels experience very little ET and cold pixels represent the maximum ET, the average temperature of selected hot and cool pixels is used to calculate proportional fractions of ET per pixel. The ET fraction (ETf) is calculated for each pixel by applying the following Equation (12) [31]:
ET f =   TH Tx TH TC
where TH = average of the selected hot pixels; TC = average of the selected cold pixels; and Tx = surface temperature for each pixel of the area.
The ETf is multiplied by the reference evapotranspiration (ETo) to calculate the real values of ET per pixel in a given area by Senay et al. [31], as shown in Equation (13):
ET = ET f   ×   ETo

4. Radiation in the Transpiration Models for Greenhouses

Although the bases for calculating crop evapotranspiration were established in the middle of the 20th century [2,4,45], it was not until the beginning of this century that research, such as [46,47,48,49,50,51,52,53], have allowed an advance in the estimation of greenhouse crop transpiration, based on the Penman–Monteith equation in the modeling of the phenomenon. Some of these approaches agree on the relationship between transpiration and the energy balance in the greenhouse, which implies that this equation responds mainly to changes in radiation and vapor pressure (T/HR) [54].
Montero et al. [55] approximated an equation to calculate geranium transpiration inside the greenhouse, under conditions of high temperature (greater than 36 °C) and low humidity (VPD of 3.4 kPa). For each crop, the stomatal resistance will be different but, in general, a mean resistance in the canopy can be estimated based on the Leaf Area Index [56]. The internal resistance is related to the transpiration rate [46], which in turn is directly proportional to the difference in vapor pressure between the stomatal cavity and the density of the greenhouse air, and this is inversely proportional to the flow resistance from the substomatal cavity to the greenhouse air. Thus, it is possible to estimate the transpiration rate as a function of stomatal resistance, for which the heat transfer coefficient, h (W m−2 K−1), is calculated for each leaf and applicable to the transport of water vapor (Stanghellini, 1987) [46]. The exchanges of sensible heat between the leaf and the canopy can be related to each other by means of an individual coefficient expressed by Bailey et al. [56]. For this purpose, three air flow conditions are proposed: free convection [57], forced convection [58], and mixed convection [46].
The regressions between the transpiration measured by means of a balance and that estimated with the Penman–Monteith model modified by Montero et al. [55] show statistical congruence. They also found that for VPD values between 1.4 and 3.4 kPa and environmental temperature from 26–36 °C, there was no reduction in canopy strength. The Penman–Monteith model modified by Baille et al. [59] was used by Medrano et al. [13] in cucumber cultivation, contrasting high and low radiation, with ranges of 9 MJ m−2 d−1 (low radiation) and 20 MJ m−2 d−1 (high radiation), and considering climatic conditions and crop development. The results showed congruence in the cucumber leaf transpiration rate related to the ontogeny of said crop between both radiation conditions. With high radiation, nocturnal transpiration is negligible; however, under low radiation conditions, the nocturnal transpiration rate can be as high as 20% [13]. Nevertheless, and despite obtaining adequate values in the regression, the authors mention model deficiencies when only solar radiation is taken into account [13], due to the great seasonality of the sun with respect to time, so it must be calibrated for each place and for different stages.
The model presented by Hamer [60], estimates transpiration as a function of external shortwave radiation and the vapor pressure deficit inside the greenhouse, which was validated under NFT conditions. The model is a simplification of the model presented by Stanghellini and incorporated into the models of Chalabi and Bailey [61], and Hamer [60], used to predict the environmental conditions inside the greenhouse using outside hourly data. The transpiration simulation is referred to as crop water (WC, W m−2), as a function of external radiation (So, W m−2) and the saturation deficit (Da, kPa) of the air inside the greenhouse. In general, this form is based on the expression used by Jolliet [47,49], where a short wavelength transmission coefficient of 0.65 was considered. The model describes the use of water by the crop when it has developed its maximum canopy. When evaluating the model, it was observed that it overestimates the water consumption by the crop when the saturation deficit and the radiation exceed the recommended ranges, and it is sensitive to the saturation deficit when the radiation is decreased [60]. The physical principle is considered to be robust; however, it needs to be calibrated for irrigation control by adding a component that includes the LAI.
Among the models most frequently used to estimate the transpiration of greenhouse crops, the following stand out: (1) Penman, (2) Penman–Monteith fed with external variables, (3) Stanghellini, and (4) Fynn with variables from inside the greenhouse [62]. One result that stands out from this comparison is the difference in the real transpiration value (lysimeter) when the irradiance is maximum and the vapor pressure deficit increases. The Fynn model overestimates the radioactive portion, unlike the Stanghellini model. This is particularly visible in the greenhouse due to radiation interception by the canopy. The Stanghellini model was based on an empirical evaluation of the radiation flux; therefore, the results reflect variations depending on the absorption of radiation in the canopy of the crop in the greenhouse. Consequently, the modification of radiation results in a better approximation of measurement of crop transpiration. When only the portion of radiation that falls on the canopy is incorporated and it is assumed that the temperature of the leaf and the environment are the same, it is not considered an adequate estimate. The leaf area index and the modification of the radiation in the Stanghellini model motivated a better prediction (R2 = 0.872), in contrast to the Fynn model (R2 = 0.848) [62].
When comparing crop transpiration against the models, it was observed that Fynn and Stanghellini have a lower correlation when radiation is low, demonstrating the importance of leaf area in determining vapor pressure deficit (VPD). Transpiration is practically driven by vapor pressure deficit (VPD) when irradiance decreased at the end of the day. Based on a linear regression, VPD correlates well with crop transpiration, while irradiance alone has drawbacks under particular conditions [62]. This suggests that a model to determine transpiration must combine radiation and VPD for a better prediction of water use by crops. Penman and Monteith established the basis for the prediction of crop transpiration; the Penman–Monteith model obtains the best results in a given area. The Penman and Penman–Monteith models obtained a fit of R2 = 0.214 and R2 = 0.481, respectively. Rivera et al. [63] use the Penman–Monteith, Stanguellini, and Boulard and Wang models with the same results.

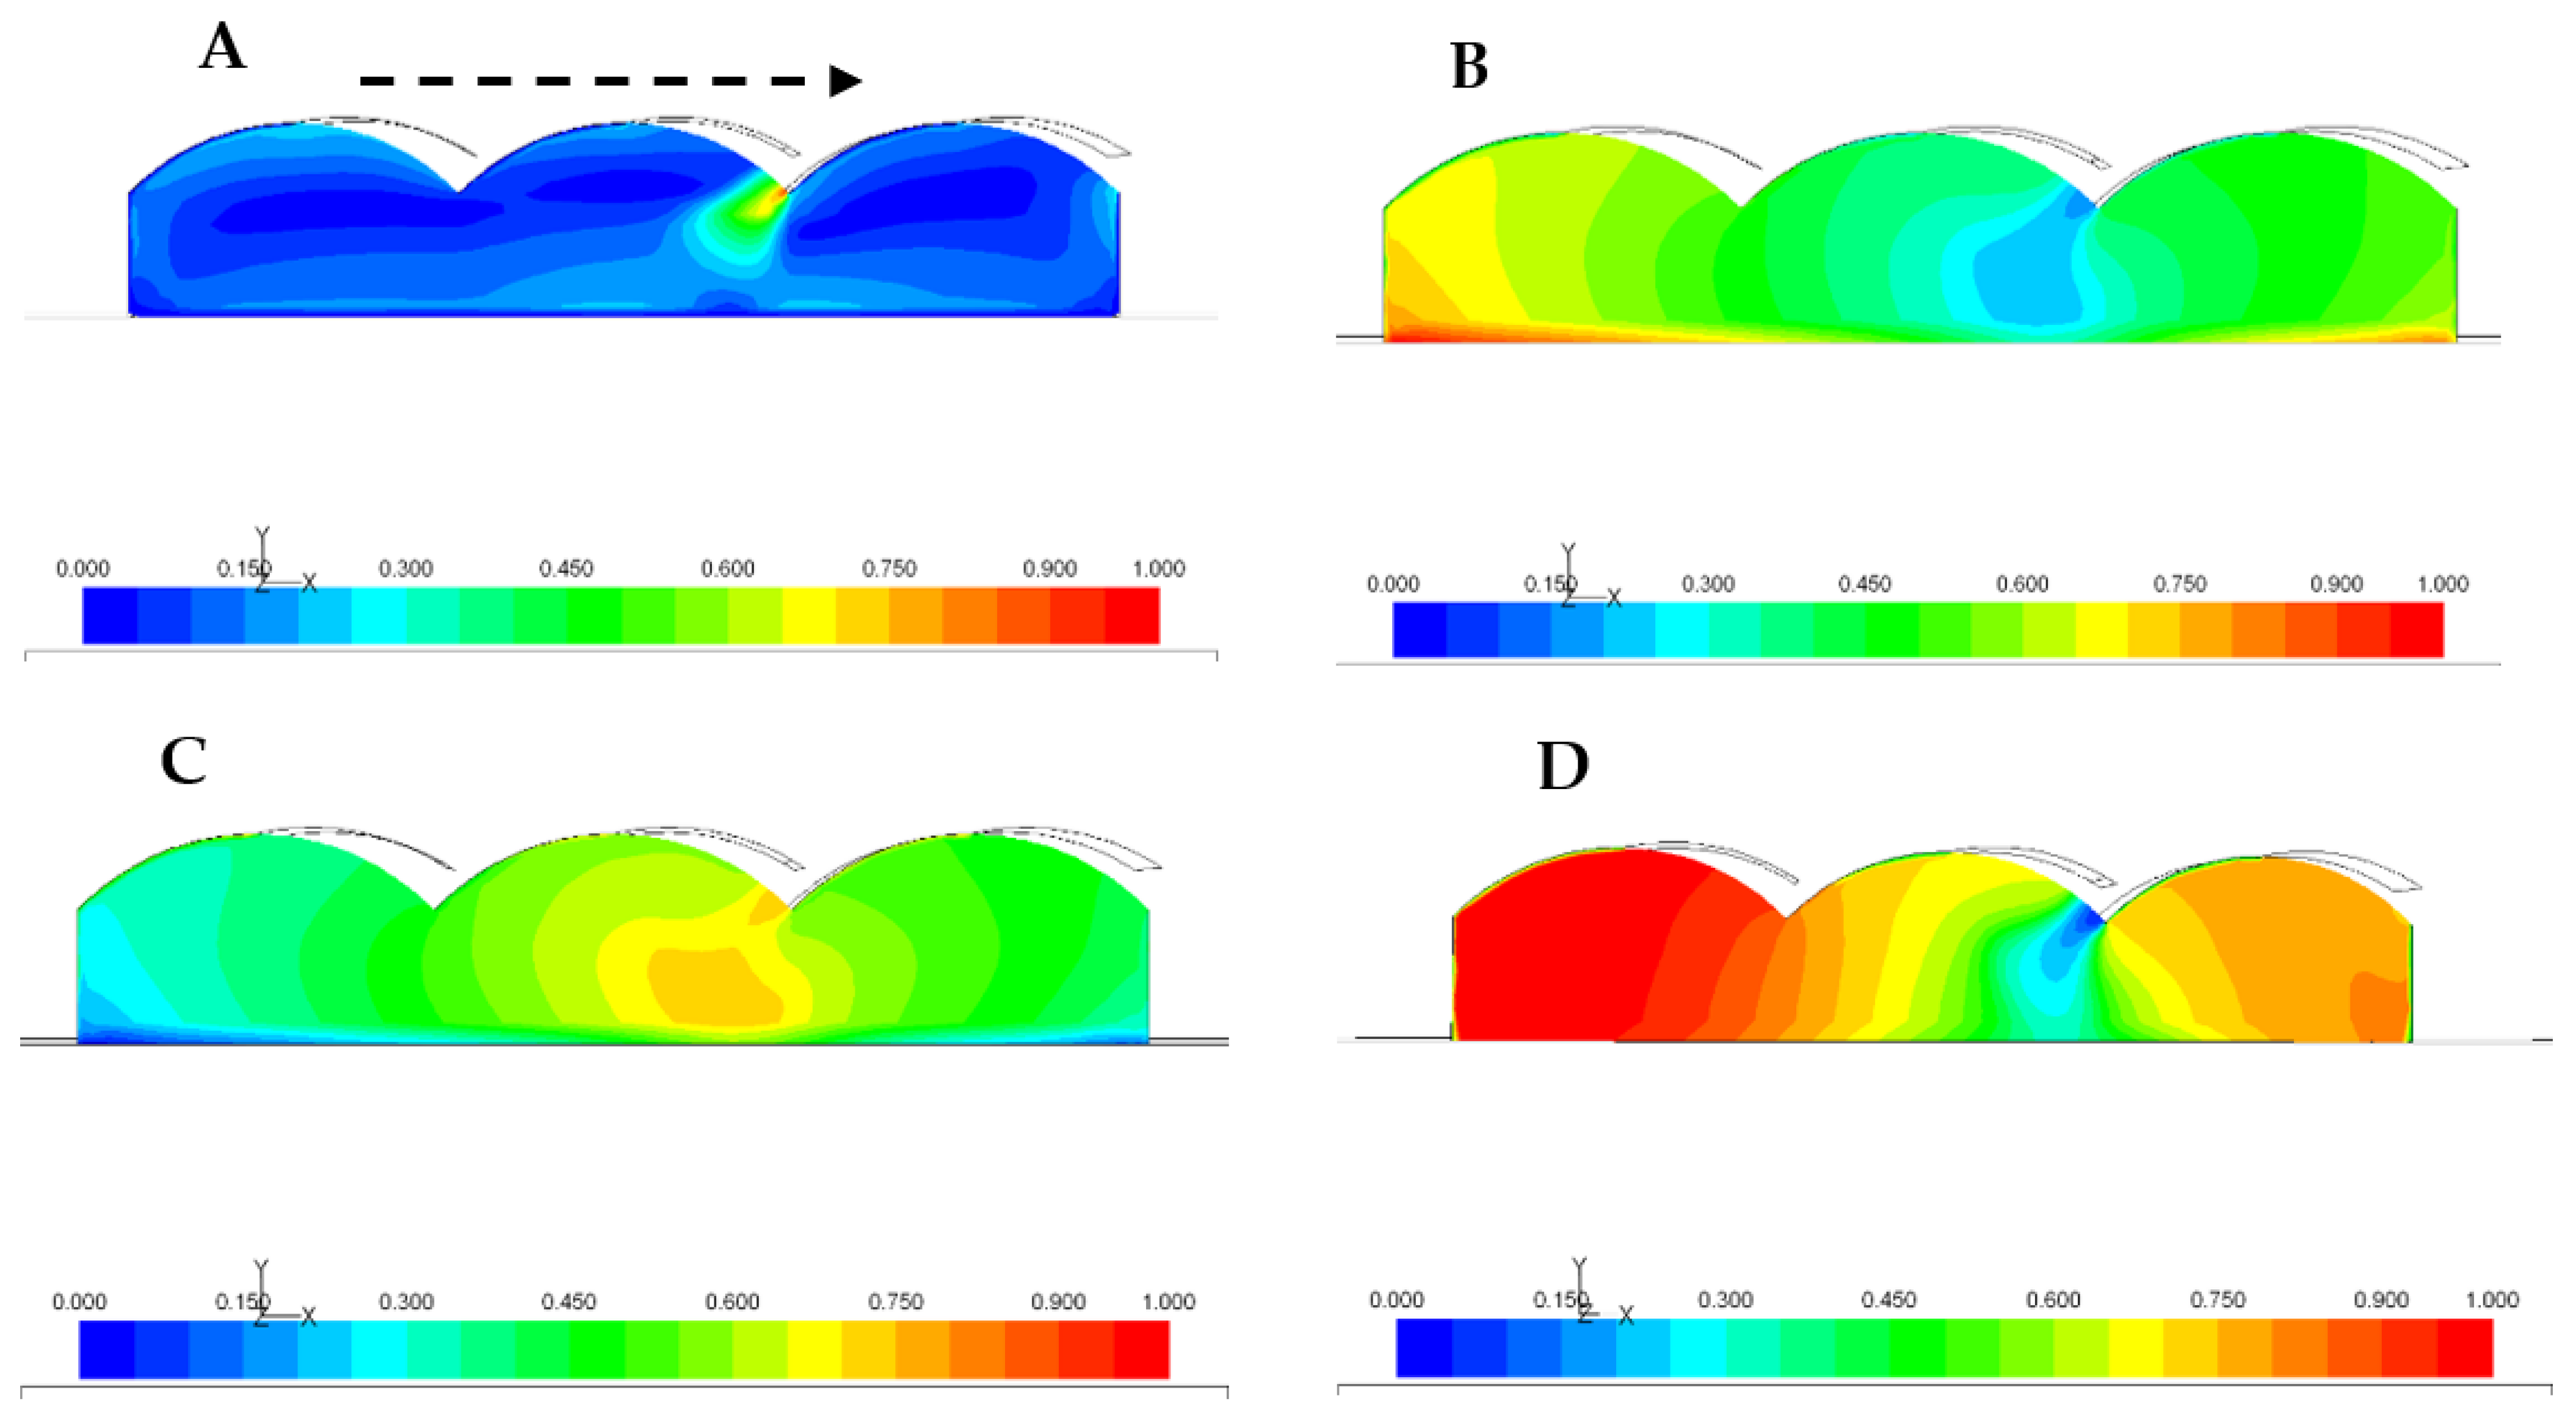
4.1. Environ Analysis in Semi-Closed Biosystems by Using CFD

Computational fluid dynamics (CFD) has been used to carry out simple studies of the behavior of the internal environment of greenhouses (to predict internal flow and temperature distribution)—creating a “virtual reality” of the greenhouse and its internal climate [64]—and to make comparisons with existing experimental data. Outstanding among the first studies inside the greenhouse which include a crop are [65,66,67,68,69], initially considering it as a barrier to the passage of the air, modeled as a porous medium, without considering the gaseous exchange of the crop, CO2, and water vapor, which can be considered the first step to estimate transpiration inside the greenhouse.
In these works, the use of CFD was a tool to analyze the sensitivity of the processes that occur inside the greenhouse, and their interaction with the crop [51,69,70,71]. The Flores–Velazquez [72] model that is currently used considers the gas and energy exchange of the crop with the environment of greenhouses cooled by natural ventilation. Another phenomenon related to the use of CFD is the use of programs to study the efficiency in bee pollination and deposition on the crop of biotic agents, such as fungal spores, associated with ventilation processes [71]. Recently [73,74], there has been a concentration of several works which used numerical methods to simulate many of the processes of inner greenhouses, including radiation as a factor to irrigation application, evapotranspiration, climatic control, and the perspective of future research about better environment management.

4.2. The Discrete Ordenate (DO) Radiation Sub-Model in CFD

To infer the dynamics of the flow, CFD uses the Navier–Stokes equations, expressed as a set of nonlinear partial derivative equations that describe the movement of a fluid and can be applied to describe flows in the Earth’s atmosphere, ocean currents, the flow around vehicles or projectiles, and, in general, any phenomenon involving fluids (air/water). Physical foundations support the Navier–Stokes equations for the balance of mass, momentum, and conservation of energy, this deduction is typically explained through a mass and energy balance on a control volume; Equation (14) is a generalized form of expressing it:
( ρ φ ) t + . ( u ¯ φ ) = . ( Γ φ ) + S φ
where ρ a i r is the air density (kg m−3); u is the flow velocity (m s−1); Γ φ is the diffusion; and S φ is the source term. The four terms that make up this equation are: instability, convection, diffusion, and source term (or sink), which will be where the transpiration model to be simulated is included. The ϕ variable is a form of dependent variable, which may be speed, chemical factor, temperature, or mass fraction (water), describing the characteristics of the flow at a point location at a specific time, in a three-dimensional space, expressed as:
ϕ   =   ϕ   ( x ,   y ,   z ,   t ) .
Numerical modeling allows a more exact quantitative monitoring of climatic variables (speed, pressure, temperature, etc.) inside the greenhouse, under different virtual environmental ventilation conditions. This, without being a substitute, can reduce inconveniences of time, space, and costs involved in the experimentation of physical phenomena. Currently, transpiration models with the greenhouse climate as a boundary condition have been developed in horticultural crops such as tomato [45,46], cucumber [75], and lettuce [76]. For the simulation of the crop, it is necessary to perform an energy balance between the plant and the environment, creating a system of equations implemented in the simulation as a “user-defined function”—UDF—so that the transpiration can be calculated [63]. The calculation with greenhouse variables is especially important because the volume of indoor air is a representation of the climate, and this interferes with the activities of the plant, such as transpiration, photosynthesis, and respiration [77]. The CFD technique allows a detailed analysis of the variables that describe the energy balance and, consequently, of perspiration. Roy et al. [70] built and validated a CFD model on a leaf to identify temperature and moisture fluxes for low light levels and, from there, extrapolate to the crop canopy. Among the first works involving the calculation of greenhouse transpiration through CFD are [77,78,79] which, in addition to estimating crop transpiration, analyzed inherent phenomena of the energy balance, such as condensation as an alternative in the management of the greenhouse climate [80].
A practical procedure is ensuring that the constants the model needs (LAI, density, etc.) are defined, and that the variables of radiation, temperature, humidity, and stomatal resistance (external and internal) are calculated in each of the cells. From these, transpiration is calculated using the Penman–Monteith model, applied in each of the cells into which the computational model was divided.
To exemplify the results, a computational model was built based on a typical three-building greenhouse with roof ventilation. Figure 1 shows the spatial distribution of some variables that were calculated using CFD. Figure 1A shows the distribution of internal wind speeds when a constant wind profile of 6 m s−1 is simulated outside. Similarly, Figure 1B shows the temperature distribution when external radiation of 700 W m−2 is simulated. With a LAI in the crop, Figure 1C,D simulates the relative humidity that occurs in the greenhouse as a result of transpiration (water mass fraction) that exists in the greenhouse, according to Penman–Monteith.
Transpiration is a component of special importance in the energy balance of the crop–greenhouse system; therefore, knowing the space–time variation of transpiration, based on the knowledge of the microclimate that is generated inside the greenhouse due to known external environmental conditions, such as wind speed, solar radiation, and energy source, supposes the capacity for a more precise management of the greenhouse system. This undoubtedly must translate into the reduction of maintenance costs.
As a result of the simulations, the analysis of the water consumption by the plants can be related to the variables involved in said process. The temperature variation in the crop canopy, when a constant wind speed of 3 and 6 m s−1 is simulated outdoors, is a function of the leaf area index (LAI), in this case of a tomato crop. Similarly, an increase in crop transpiration can be observed as the leaf area increases.

5. Radiation in Indoor Crops

Radiation is the basic factor that involves the start of a series of processes that together give rise to the production of crops. In this case, radiation is highlighted as a triggering factor for photosynthesis and as discussed in this work, evapotranspiration, or use of water by the plant, which involves absorption, turgidity, thermal stability, and, finally, the emission of water in the form of steam by stomata, or perspiration. However, the particularity of indoor crops is precisely the absence of solar radiation; consequently, it is provided artificially to fulfill physiological processes. The evapotranspiration in indoor crops is reduced to the transpiration of the crop, and follows the same mechanism, as shown by several authors [17,29,50]. However, this determination is not to recover the transpired water or its scheduling, but rather as a thermal stabilizer of the surrounding atmosphere [81].
In the work developed by [81], the main objective was to analyze the air flows in a commercial plant factory. However, the calculation of evapotranspiration was integrated through the energy balance, due to the fact that transpiration affects the microclimate mainly with the increase in the mass of water that is contributed to the atmosphere. In this research, the energy balance is proposed as a function of radiation, and sensible and latent heat flux, with the model described by [52]. This model involves variables such as the latent heat of vaporization of water (2257 KJ kg1) [82], from which they estimate the sensible heat, which is the factor that causes the change of state of the flow of water from liquid to steam, that is, the microclimate of the environment in the area adjacent to the biosystem. The adaptation of the transpiration model was included by means of a UDF, in which radiation, latent heat, and sensible heat were considered as data. Although it is not mentioned where the radiation was measured (65 W m2), it is entered as data. The use of LED-type artificial lights implies knowing the amount of radiant energy that each diode (D) is emitting, but more important is knowing what type of chlorophyll or cell in the plant will be responsible for photosynthesis. Most lamps provide wavelengths in the red (R), green (G), and blue (B) spectra, and the near (NIR), mid (AIR), and far (FIR) infrared; however, not all plants absorb the wavelength in the green spectra, and the middle and far infrared wavelengths generate energy in the form of heat. Increasing light intensity increases plant growth; however, there is a limit, since excess light absorption causes photooxidative stress. The appropriate relationship between electrical consumption and sufficient intensity to obtain optimal performance must be found.
The production of indoor crops is generally conducted using hydroponic techniques where the root is always in contact with an aqueous solution so that an irrigation schedule is not required to replenish a sheet; in this case, the amount of water consumed is taken out, due to a difference in levels. That is, the container where it is grown acts as a balance lysimeter [82]. Most of the climatic variables are provided artificially and, in the specific case of radiation, are provided as photons in the specific wavelengths that the plant requires, including red–green–blue (RGB) and NIR (near-infrared). Light as an electromagnetic wave exists as packets of discrete energy, referred to as photons. This can be measured in different ways; each photon has a specific wavelength and energy level, as described in Equation (15). Such variables that describe a light measurement are: foot-candles, lux, watts, μmol m−2 s−1, and mol m−2 day−1 [83].
E = h c λ j
where E is the energy of each photon in J, h is Plank’s constant (6.63 × 10⁻³⁴ J), c is the speed of light (3.0 × 10⁸ ms−1), and λj is the length of wave in m. Thus, a 458 nm (blue) LED lamp contains more energy than a 656 nm (red) one. For this and other reasons, LED indoor grow light sources implement fewer such devices in their systems. By providing the wavelengths where photosynthesis or photosynthetically active radiation (PAR) occurs and the thermal infrared that provides heat, depending on the case, an atmosphere is achieved within the ranges of temperature and humidity in the air and in the solution. Thompson et al. [84] showed that, using a root temperature of 24 °C in hydroponic cultivation, growth of the lettuce crop was maximized, and variations and damage were minimized, even with ambient air temperatures above those recommended.
However, similarly to greenhouse crops, if that were the case, crop transpiration could be simulated using computational fluid dynamics [81,85] with the radiation submodule that the software presents, with the challenge of transforming radiation units [W m−2] to those emitted by artificial lights [lux, Mmol m−2 s−2 or others]. The water emitted into the atmosphere in indoor crops is approached from the energy point of view, because the water vapor that is contributed to the atmosphere also contains energy, which will influence the absolute humidity and the vapor pressure deficit. (VPD).
Regarding light radiation topics in indoor crop systems, the main effect of radiation concerns light parameters that influence crop growth, such as wavelength, intensity, and photoperiod [86]. Zhang et al. [87] carried out research in which they tested different wavelengths in lettuce plants, concluding that the height of the lettuce was greater when it was grown under red light, followed by the combinations green and red/blue (9/1 and 4/1); no difference was observed when it was grown under LED B, purple, and yellow compared to LED W. Above-ground fresh weight of lettuce grown under R/B combinations increased significantly compared to G and Y, while other LED light treatments did not result in any difference. In addition, vitamin C, soluble sugar, soluble protein, and GDH were significantly increased under R/B (9/1) and R/B (4/1) combinations compared to lettuce grown under W light. These parameters were especially high when grown under R/B (4/1), indicating that this combination can contribute efficiently to increase quality characteristics in lettuce.
The advantages of an indoor production system are mainly the efficient use of water resources, precise energy management, and the maximum reduction of pollutants from the soil and bodies of water through drainage. With these benefits the highest yield can be achieved, one that is safe to consume and free of toxic substances. This technology is constantly growing and is currently estimated to be worth several million dollars. The peculiarity of this biosystem is that by practically using the water–culture medium–radiation–microclimate inputs in an artificial way, it can be cultivated in virtually all latitudes. The economic and, primarily, energy costs required to provide the inputs will define this biosystem’s viability.

6. Conclusions

The demand for an efficient use of resources has generated the development of analysis tools regarding the precise application of inputs in the production processes, regardless of the environment in which they are applied, as shown by the development of increasingly accurate models to estimate crop transpiration.
The approach for estimating evapotranspiration from the energy balance, which was originally deconstructed to determine the variables that allowed the generation of models such as the Penman–Monteith equation, has been the basis for the development of the current models for estimating transpiration in protected crops.
The phenomenon of radiation from which the necessary processes are produced to cause the change of physical state of the water, for example from liquid to vapor, depends on the energy load, the stomatal conductance, and the foliar development of the crop. Currently, the calculation of radiation values and their discretization in the flows are the input required to make efficient use of water for irrigation, of energy in semi-closed and closed systems, and for the production of crops in closed systems, not only in photosynthesis but in climate control.

Author Contributions

J.F.-V., M.A. and E.V., together designed, investigated, analyzed, and wrote this paper. All authors have read and agreed to the published version of the manuscript.

Funding

This research received no external funding.

Conflicts of Interest

The authors declare no conflict of interest.

References

  1. Martínez-Luna, D.; Mora-Flores, J.S.; Exebio-García, A.A.; Arana-Coronado, O.A.; Arjona-Suárez, E. Valor económico del agua en el Distrito de Riego 100, Alfajayucan, Hidalgo. Terra Latinoam. 2021, 39, e544. [Google Scholar] [CrossRef]
  2. Allen, R.G.; Pereira, L.S.; Raes, D.; Smith, M. Crop Evapotranspiration—Guidelines for Computing Crop Water Requirements; FAO Irrigation and Drainage Paper 56; Food and Agriculture Organization of the United Nations (FAO): Rome, Italy, 1998. [Google Scholar]
  3. Squeo, F.A.; León, M.F. Transpiración. In Fisiología Vegetal; Ediciones Universidad de La Serena; Squeo, F.A., Cardemil, L., Eds.; Universidad de La Serena: La Serena, Chile, 2007. [Google Scholar]
  4. Thornthwaite, C.W. An approach toward a rational classification of climate. Geogr. Rev. 1948, 38, 55–94. [Google Scholar] [CrossRef]
  5. Hankerson, B.; Kjaersgaard, J.; Hay, C. Estimation of Evapotranspiration from Fields with and without Cover Crops Using Remote Sensing and in situ Methods. Remote Sens. 2012, 4, 3796–3812. [Google Scholar] [CrossRef] [Green Version]
  6. Mkhwanazi, M.; Chávez, J.L.; Andales, A.A. SEBAL-A: A remote sensing ET algorithm that accounts for advection with limited data. Part I: Development and validation. Remote Sens. 2015, 7, 15046–15067. [Google Scholar] [CrossRef] [Green Version]
  7. Irmak, A.; Ratcliffe, I.; Ranade, P.; Hubbard, K.G.; Singh, R.K.; Kamble, B.; Kjaersgaard, J. Estimation of land surface evapotranspiration with a satellite remote sensing procedure. Great Plains Res. 2011, 21, 73–88. [Google Scholar]
  8. Li, Y.; Liu, C.; Liang, K. Spatial Patterns and Influence Factors of Conversion Coefficients between Two Typical Pan Evaporimeters in China. Water 2016, 8, 422. [Google Scholar] [CrossRef] [Green Version]
  9. Ta, T.H.; Shin, J.H.; Noh, E.H.; Son, J.E. Transpiration, growth, and water use efficiency of paprika plants (Capsicum annuum L.) as affected by irrigation frequency. Hortic. Environ. Biotechnol. 2012, 53, 129–134. [Google Scholar] [CrossRef]
  10. Tagliaferre, C.; de Oliveira, R.A.; Sediyama, G.C.; Cecon, P.R.; Martinez, M.A.; Materán, F.J.V. Performance of the Minievaporimeter UFV-1 to estimate the reference evapotranspiration in relation to the constant groundwater Table lysimeter. Idesia 2013, 31, 87–99. [Google Scholar] [CrossRef] [Green Version]
  11. Tsitsimpelis, I.; Wolfenden, I.; Taylor, C.J. Development of a grow-cell test facility for research into sustainable controlled-environment agriculture. Biosyst. Eng. 2016, 150, 40–53. [Google Scholar] [CrossRef]
  12. Cuellar-Murcia, C.A.; Suárez-Salazar, J.C. Flujo de savia y potencial hídrico en plantas de tomate (Solanum lycopersicum L.) bajo condiciones de invernadero. Rev. Colomb. De Cienc. Hortícolas 2018, 12, 104–112. [Google Scholar] [CrossRef] [Green Version]
  13. Medrano, E.; Lorenzo, P.; Sánchez-Guerrero, M.C.; Montero, J.I. Evaluation and modelling of greenhouse cucumber-crop transpiration under high and low radiation conditions. Sci. Hortic. 2005, 105, 163–175. [Google Scholar] [CrossRef]
  14. Nikolaou, G.; Neocleous, D.; Kitta, E.; Katsoulas, N. Estimation of Aerodynamic and Canopy Resistances in a Mediterranean Greenhouse Based on Instantaneous Leaf Temperature Measurements. Agronomy 2020, 10, 1985. [Google Scholar] [CrossRef]
  15. Shin, J.H.; Park, J.S.; Son, J.E. Estimating the actual transpiration rate with compensated levels of accumulated radiation for the efficient irrigation of soilless cultures of paprika plants. Agric. Water Manag. 2014, 135, 9–18. [Google Scholar] [CrossRef]
  16. Valipour, M. Calibration of mass transfer-based models to predict reference crop evapotranspiration. Appl. Water Sci. 2015, 7, 625–635. [Google Scholar] [CrossRef] [Green Version]
  17. Katsoulas, N.; Stanghellini, C. Modelling Crop Transpiration in Greenhouses: Different Models for Different Applications. Agronomy 2019, 9, 392. [Google Scholar] [CrossRef] [Green Version]
  18. Fisher, J.B.; Whittaker, R.J.; Malhi, Y. ET come home: Potential evapotranspiration in geographical ecology. Glob. Ecol. Biogeogr. 2010, 20, 1–18. [Google Scholar] [CrossRef]
  19. Rojas, A.; Noriega, A.; Herrera, G.; Chaparro, R. Sistema de riego para invernaderos hidropónicos basado en la evapotranspiración del cultivo. Nat. Y Desarro. 2003, 1, 23–29. [Google Scholar]
  20. Smigaj, M.; Gaulton, R.; Suarez, J.C.; Barr, S.L. Use of miniature thermal cameras for detection of physiological stress in conifers. Remote Sens. 2017, 9, 957. [Google Scholar] [CrossRef] [Green Version]
  21. Zhang, L.; Zhang, H.; Niu, Y.; Han, W. Mapping Maize Water Stress Based on UAV Multispectral Remote Sensing. Remote Sens. 2019, 11, 605. [Google Scholar] [CrossRef] [Green Version]
  22. Hermida-Carrera, C.; Kapralov, M.V.; Galmés, J. Rubisco catalytic properties and temperature response in crops. Plant Physiol. 2016, 171, 2549–2561. [Google Scholar] [CrossRef] [Green Version]
  23. Fahad, S.; Bajwa, A.A.; Nazir, U.; Anjum, S.A.; Farooq, A.; Zohaib, A.; Sadia, S.; Nasim, W.; Adkins, S.; Saud, S.; et al. Crop Production under Drought and Heat Stress: Plant Responses and Management Options. Front. Plant Sci. 2017, 8, 1147. [Google Scholar] [CrossRef] [Green Version]
  24. Lu, T.; Meng, Z.; Zhang, G.; Qi, M.; Sun, Z.; Liu, Y.; Li, T. Sub-high temperature and high light intensity induced irreversible inhibition on photosynthesis system of tomato plant (Solanum lycopersicum L.). Front. Plant Sci. 2017, 8, 365. [Google Scholar] [CrossRef]
  25. Yokoyama, G.; Yasutake, D.; Tanizaki, T.; Kitano, M. Leaf wetting mitigates midday depression of photosynthesis in tomato plants. Photosynthetica 2019, 57, 740–747. [Google Scholar] [CrossRef] [Green Version]
  26. Allen, R.; Irmak, A.; Trezza, R.; Hendrickx, J.M.H.; Bastiaanssen, W.; Kjaersgaard, J. Satellite-based ET estimation in agriculture using SEBAL and METRIC. Hydrol. Process. 2011, 25, 4011–4027. [Google Scholar] [CrossRef]
  27. Bastiaanssen, W.G.M. Remote Sensing in Water Resources Management: The State of the Art; International Water Management Institute (IWMI): Colombo, Sri Lanka, 1998; p. 118. Available online: https://publications.iwmi.org/pdf/H022865.pdf (accessed on 25 May 2022).
  28. Bastiaanssen, W. SEBAL-based sensible and latent heat fluxes in the irrigated Gediz Basin, Turkey. J. Hydrol. 2000, 229, 87–100. [Google Scholar] [CrossRef]
  29. Allen, R.G.; Tasumi, M.; Trezza, R. Satellite-Based Energy Balance for Mapping Evapotranspiration with Internalized Calibration (METRIC)—Model. J. Irrig. Drain. Eng. 2007, 133, 380–394. [Google Scholar] [CrossRef]
  30. Allen, R.G.; Tasumi, M.; Morse, A.; Trezza, R.; Wright, J.L.; Bastiaanssen, W.; Kramber, W.; Lorite, I.; Robison, C.W. Satellite-Based Energy Balance for Mapping Evapotranspiration with Internalized Calibration (METRIC)—Applications. J. Irrig. Drain. Eng. 2007, 133, 395–406. [Google Scholar] [CrossRef]
  31. Senay, G.B.; Budde, M.; Verdin, J.P.; Melesse, A.M. A coupled remote sensing and simplified surface energy balance approach to estimate actual evapotranspiration from irrigated fields. Sensors 2007, 7, 979–1000. [Google Scholar] [CrossRef] [Green Version]
  32. Heilman, J.L.; Kanemasu, E.T. An evaluation of a resistance form of the energy balance to estimate evapotranspiration. Agron. J. 1976, 68, 607–612. [Google Scholar] [CrossRef]
  33. Hatfield, J.L.; Pettier, A.; Jackson, R.D. Estimation of areal evapotranspiration based on remotely sensed surface temperature. Agric. Water Manag. 1983, 7, 341–350. [Google Scholar] [CrossRef]
  34. Reginato, R.; Jackson, R.; Pinter, P. Evapotranspiration calculated from remote multispectral and ground station meteorological data. Remote Sens. Environ. 1985, 18, 75–89. [Google Scholar] [CrossRef]
  35. Hatfield, J.L. Methods of estimating evapotranspiration. Irrig. Agric. Lands ASA Agron. Monogr. 1990, 30, 435–474. [Google Scholar]
  36. Hatfield, J.L.; Fuchs, M. Evapotranspiration models. In Management of Farm Irrigation Systems; ASAE Monograph; Hoffman, G.J., Howell, T.A., Solomon, K.H., Eds.; American Society of Agricultural Engineers: St. Joseph, MI, USA, 1990; pp. 33–59. [Google Scholar]
  37. Senkondo, W.; Munishi, S.E.; Tumbo, M.; Nobert, J.; Lyon, S.W. Comparing Remotely-Sensed Surface Energy Balance Evapotranspiration Estimates in Heterogeneous and Data-Limited Regions: A Case Study of Tanzania’s Kilombero Valley. Remote Sens. 2019, 11, 1289. [Google Scholar] [CrossRef]
  38. Farah, H.O.; Bastiaanssen, W.G.M. Impact of spatial variations of land surface parameters on regional evaporation: A case study with remote sensing data. Hydrol. Process. 2001, 15, 1585–1607. [Google Scholar] [CrossRef]
  39. Sun, Z.; Wei, B.; Su, W.; Shen, W.; Wang, C.; You, D.; Liu, Z. Evapotranspiration estimation based on the SEBAL model in the Nansi Lake Wetland of China. Math. Comput. Model. 2011, 54, 1086–1092. [Google Scholar] [CrossRef]
  40. Liou, Y.-A.; Kar, S.K. Evapotranspiration Estimation with Remote Sensing and Various Surface Energy Balance Algorithms—A Review. Energies 2014, 7, 2821–2849. [Google Scholar] [CrossRef] [Green Version]
  41. Allen, R.G.; Tasumi, M.; Trezza, R.; Waters, R.; Bastiaanssen, W.G.M. SEBAL (Surface Energy Balance Algorithms for Land): Advanced Training and User’s Manual, Version 1.0; Idaho Department of Water Resources: Boise, ID, USA, 2002; p. 98.
  42. Allen, R.G.; Morton, C.; Kamble, B.; Kilic, A.; Huntington, J.; Thau, D.; Gorelick, N.; Erickson, T.; Moore, R.; Trezza, R.; et al. EEFlux: A Landsat-based Evapotranspiration Mapping Tool on the Google Earth Engine. In Proceedings of the ASABE/IA Irrigation Symposium, Long Beach, CA, USA; 2015; pp. 10–12. [Google Scholar] [CrossRef] [Green Version]
  43. Tasumi, M. Progress in Operational Estimation of Regional Evapotranspiration Using Satellite Imagery. Ph.D. Thesis, University of Idaho, Moscow, ID, USA, 2003. [Google Scholar]
  44. Guillermo, F.O.; Ortega-Farías, S.; Daniel, D.; David, F.L.; Fuentes-Peñailillo, F. Water: Tools and functions to estimate actual evapotranspiration using Land Surface Energy Balance Model in R. R J. 2016, 8, 352–369. [Google Scholar] [CrossRef] [Green Version]
  45. Monteith, J.L.; Unsworth, M.H. Principles of Enviromental Physics; Eduard Arnold: London, UK, 1990. [Google Scholar]
  46. Stanghellini, C. Transpiration of Greenhouse Crops: An Aid to Climate Management. Ph D. Thesis, Institute of Agricultural Engineering IMAG, Wageningen, The Netherlands, 1987. [Google Scholar]
  47. Jolliet, O.; Bailey, B.J. The effects of climate ion tomato transpiration in greenhouse: Measurements and models comparison. Agric. For. Meteorol. 1992, 58, 43–62. [Google Scholar] [CrossRef]
  48. Fynn, R.P.; Al-Shooshan, A.; Short, T.H.; McMahon, R.W. Evapotranspiration measurements and modeling for a potted chrysanthemum crop. Trans. ASAE 1993, 36, 1907–1913. [Google Scholar] [CrossRef]
  49. Jolliet, O. HORTITRANS, a model for predicting and optimizing humidity and transpiration in greenhouses. J. Agric. Eng. Res. 1994, 57, 23–37. [Google Scholar] [CrossRef]
  50. Papadakis, G.; Frangoudakis, A.; Kristis, S. Experimental investigation and modelling of heat and mass trasnfer betwen a tomato crop and the greenhouse environement. J. Agric. Eng. Res. 1994, 57, 217–227. [Google Scholar] [CrossRef]
  51. Boulard, T.; Wang, S. Radiative and convective heterogeneity in a plastic tunnel: Consequences on crop transpiration. Plasticulture 2002, 121, 23–35. [Google Scholar]
  52. Boulard, T.; Wang, S. Greenhouse crop transpiration simulation from external climate conditions. Agric. For. Meteorol. 2000, 100, 25–34. [Google Scholar] [CrossRef]
  53. Sbita, L.; Boulard, T.; Baille, A.; Annabi, M. A greenhouse climate model including the effects of ventilation and crop transpiration. Validation for south tunissia condictions. Acta Hortic. 1998, 458, 57–64. [Google Scholar] [CrossRef]
  54. Seginer, I. The Penman-Monteith evapotranspiration equations as an element in greenhouse ventilation design. Biosyst. Eng. 2002, 82, 423–439. [Google Scholar] [CrossRef]
  55. Montero, J.I.; Antón, A.; Muñoz, P.; Lorenzo, P. Transpiration from geranium grow under high temperatura and low humidities in greenhouses. Agric. For. Meteorol. 2001, 107, 323–332. [Google Scholar] [CrossRef]
  56. Bailey, B.; Montero, J.; Biel, C.; Wilkinson, D.; Anton, A.; Jolliet, O. Transpiration of Ficus benjamina: Comparison of measurements with predictions of the Penman-Monteith model and a simplified version. Agric. For. Meteorol. 1993, 65, 229–243. [Google Scholar] [CrossRef]
  57. McAdams, W.H. Heat Transmission; McGraw-Hill: New York, NY, USA, 1954; 532p. [Google Scholar]
  58. Grover, H.; Erk, S. Fundammentals of Heat Transfer; McGraw-Hill: New York, NY, USA, 1961; 696p. [Google Scholar]
  59. Baille, M.; Baille, A.; Delmon, D. Microclimate and transpiration of greenhouse rose crops. Agric. For. Meteorol. 1994, 71, 83–97. [Google Scholar] [CrossRef]
  60. Hamer, P.J.C. Validation of amodel for irrigation control of a greenhouse crop. Acta Hortic. 1998, 458, 75–82. [Google Scholar] [CrossRef]
  61. Chalabi, Z.; Bailey, B. Sensitivity analysis of a non-steady state model of the greenhouse microclimate. Agric. For. Meteorol. 1991, 56, 111–127. [Google Scholar] [CrossRef]
  62. Prenger, J.J.; Fynn, R.P.; Hansen, R.C. A comparison of four evapotranspiration models in a greenhouse environment. Trans. ASAE 2002, 45, 1779–1788. [Google Scholar] [CrossRef]
  63. Zamarripa, J.R.; López Cruz, I.L.; Castillo Salazar, J.A.; Ramírez Arias, J.A. Comparación de tres modelos para estimar la transpiración de un cultivo de jitomate en invernadero. Terra Latinoam. 2013, 31, 9–21. [Google Scholar]
  64. Baeza, E.J. Optimización del Diseño de los Sistemas de Ventilación en Invernadero Tipo Parral. Ph.D. Thesis, Universidad de Almeria, Almeria, Spain, 2007. [Google Scholar]
  65. Lee, I.; Short, T.H. A CFD model of volumetric flow rates for a naturally ventilated, multi-span greenhouse. In Proceedings of the 91st Annual International Meeting of ASAE, Orlando, FL, USA, 12–16 July 1998; ASAE Paper No. 987011. ASAE: St. Joseph, MI, USA, 1998. [Google Scholar]
  66. Lee, I.; Short, T.H. Predicted effects of internal horizontal screens on natural ventilation of a multi-span greenhouse. In Proceedings of the 91st Annual International Meeting of ASAE, Orlando, FL, USA, 12–16 July 1998; ASAE Paper No. 987014. ASAE: St. Joseph, MI, USA, 1998. [Google Scholar]
  67. Lee, I.; Short, T.H. Two-dimensional numerical simulation of natural ventilation in a multi-span greenhouse. Trans. ASAE 2000, 43, 745–753. [Google Scholar] [CrossRef]
  68. Haxaire, R.; Boulard, T.; Mermier, M. Greenhouse natural ventilation by wind forces. Acta Hortic. 2000, 534, 31–40. [Google Scholar] [CrossRef]
  69. Reichrath, S.; Davies, T. Computational fluid dynamics simulations and validation of the pressure distribution on the roof of a commercial multi-span Venlo-type glasshouse. J. Wind Eng. Ind. Aerodyn. 2002, 90, 139–149. [Google Scholar] [CrossRef]
  70. Roy, J.; Boulard, T. CFD predictions of natural ventilation and climate in a tunnel-type greenhouse using a transpiration active crop model. Acta Hortic. 2004, 633, 205–212. [Google Scholar] [CrossRef]
  71. Roy, J.; Boulard, T.; Lee, L.; Chave, M.; Nieto, C. CFD prediction of the distribution and Deposition of fungal spores in a greenhouse. Acta Hortic. 2006, 719, 279–286. [Google Scholar] [CrossRef]
  72. Flores-Velazquez, J. Análisis del Clima en los Principales Modelos de Invernaderos en Mexico Usando CFD. Ph.D Thesis, Universidad de Almeria, Almeria, Spain, 2010. [Google Scholar]
  73. Bournet, P.-E.; Rojano, F. Advances of Computational Fluid Dynamics (CFD) applications in agricultural building modelling: Research, applications and challenges. Comput. Electron. Agric. 2022, 201, 107277. [Google Scholar] [CrossRef]
  74. Badji, A.; Benseddik, A.; Bensaha, H.; Boukhelifa, A.; Hasrane, I. Design, technology, and management of greenhouse: A review. J. Clean. Prod. 2022, 373, 133753. [Google Scholar] [CrossRef]
  75. Yang, X.; Short, T.; Fox, R.; Bauerle, W. Leaf temperature and stomatal resistance of greenhouse cucumber crop. Agric. For. Meteorol. 1990, 5, 197–209. [Google Scholar] [CrossRef]
  76. Pollet, S. Aplication of Penman-Monteith model to calculate the evapotranspiration of head letuce Latuca sativa L. var capitata in glasshouse conditions. Acta Hortic. 1999, 5, 25–30. [Google Scholar]
  77. Bartzanas, T.; Kittas, C.; Boulard, T. Effect of ventilation arrangement on winward ventilation of a tunnel greenhouse. Biosyst. Eng. 2004, 88, 479–490. [Google Scholar] [CrossRef]
  78. Kichah, A.; Bournet, P.; Chassériaux, G. Predicting crop transpiration in a glasshouse using computational fluid dynamics (CFD). Acta Hortic. 2008, 801, 933–940. [Google Scholar] [CrossRef]
  79. Bournet, P.E.; Kichah, A.; Chasseriaux, G. Analysis of radiation and transpiration heterogeneity inside a crop cover using computational fluid dynamics. Acta Hort. 2011, 893, 679–686. [Google Scholar] [CrossRef]
  80. Piscia, D.; Montero, J.I.; Baeza, E.; Bailey, B.J. A CFD greenhouse night-time condensation model. Biosyst. Eng. 2012, 111, 141–154. [Google Scholar] [CrossRef]
  81. Zhang, Y.; Kacira, M. Analysis of climate uniformity in indoor plant factory system with computational fluid dynamics (CFD). Biosyst. Eng. 2022, 220, 73–86. [Google Scholar] [CrossRef]
  82. Fuentes, D.; Flores, J.; Aguilar, A.; Roblero, R. Response of LED lights intensity on lettuce production in a home vertical farm. Rev. Fac. Agron. 2022, 39, e223920. [Google Scholar] [CrossRef]
  83. Ramos Gonzalías, Y.; Ramírez Lasso, E. Desarrollo de un sistema de iluminación artificial LED para cultivos en interiores—Vertical Farming (VF). Inf. Técnico 2016, 80, 111–120. [Google Scholar] [CrossRef]
  84. Thompson, H.C.; Langhans, R.W.; Both, A.-J.; Albright, L.D. Shoot and Root Temperature Effects on Lettuce Growth in a Floating Hydroponic System. J. Am. Soc. Hortic. Sci. 1998, 123, 361–364. [Google Scholar] [CrossRef] [Green Version]
  85. Naranjani, B.; Najafianashrafi, Z.; Pascual, C.; Agulto, I.; Chuang, P.-Y.A. Computational analysis of the environment in an indoor vertical farming system. Int. J. Heat Mass Transf. 2021, 186, 122460. [Google Scholar] [CrossRef]
  86. Zhang, X.; He, D.; Niu, G.; Yan, Z.; Song, J. Effects of environment lighting on the growth, photosynthesis, and quality of hydroponic lettuce in a plant factory. Int. J. Agric. Biol. Eng. 2018, 11, 33–40. [Google Scholar] [CrossRef]
  87. Zhang, T.; Shi, Y.; Wang, Y.; Liu, Y.; Zhao, W.; Piao, F.; Sun, Z. The effect of different spectral LED light son the phenotypics and physiological charactristics of lettuce (Lactuca sativa) at picking stage. J. Biochem. Biotech. 2017, 1, 14–19. [Google Scholar]
Figure 1. Spatial distribution of (A) wind speeds (m s−1), (B) temperatures (° K), (C) relative humidity (%), and (D) fraction of transpired water (gr h−1 m−2).
Agronomy 12 02593 g001
Publisher’s Note: MDPI stays neutral with regard to jurisdictional claims in published maps and institutional affiliations.

