Article

Utility of Comprehensive GC×GC Gas Chromatography in Finding Varietal Markers among Volatile Compounds in Non-Aromatic Red Wines

1
Institute of Agriculture and Tourism, Karla Huguesa 8, 52440 Poreč, Croatia
2
Centre of Excellence for Biodiversity and Molecular Plant Breeding, Svetošimunska 25, 10000 Zagreb, Croatia
3
Metabolomics Unit, Food and Nutrition Area, Research and Innovation Centre, Fondazione Edmund Mach (FEM), Via Edmund Mach 1, 38098 San Michele all’Adige, Italy
*
Author to whom correspondence should be addressed.
Agronomy 2022, 12(10), 2512; https://doi.org/10.3390/agronomy12102512
Submission received: 25 August 2022 / Revised: 11 October 2022 / Accepted: 12 October 2022 / Published: 14 October 2022

Abstract

:
To investigate the utility of comprehensive GC×GC gas chromatography metabolomics in finding varietal markers among volatile compounds in non-aromatic red wines, representative samples of the two most important Croatian monovarietal red wines, Plavac mali and Teran, were subjected to analysis by both conventional gas chromatography–mass spectrometry (GC-MS) and comprehensive two-dimensional gas chromatography with time-of-flight mass spectrometry (GC×GC-TOF-MS) after headspace solid-phase microextraction (HS-SPME). GC-MS was useful for the determination of the basic volatile profile composed mainly of major esters and acids, followed by terpenes and C13-norisoprenoids. GC×GC-TOF-MS allowed the identification of 209 volatiles, among which 49 were significantly different across monovarietal wines. The compounds most characteristic for Teran were two theaspirane isomers, ethyl 3-(methylsulfanyl)propanoate, ethyl methyhexanoate, and ho-trienol, whereas Plavac mali stood out with higher concentrations of tridecane and a 2,3-butanediol isomer. The two monovarietal wines were successfully differentiated between each other by multivariate statistical methods mostly based on GC×GC-TOF-MS data. The presented approach that combines conventional GC-MS and advanced GC×GC-TOF-MS showed a great potential for tracking chemical markers of varietal origin and could be practically applied in managing wine production, quality and typicity, marketing, and protection from forgery.

1. Introduction

Wine is among the most consumed beverages and at the same time, in relative terms, one of the most expensive commodities in the world. In recent years, the global annual wine production reaches between two and three hundred millions of tons, with the largest producers being Italy, France, Spain, USA, Argentina, Chile, Australia, Germany, South Africa, and China [1,2]. Consumers are attracted to a particular wine brand mostly because of its specific quality traits and identity related to several factors, such as grape variety, geographical origin, harvest year or production style/type. Varietal origin strongly determines the commercial value of a wine. In reciprocity with other factors, it strongly affects wine sensory quality and, especially in the case of aromatic and semi-aromatic varieties, is responsible for its recognizable varietal typicity. As shown in previous studies, varietal origin and typicity can be clearly associated with particular aspects of wine chemical composition, mostly volatile aroma and phenolic profiles, which are among the main sensory-active compounds in wine [3,4,5,6,7].
Knowing which volatile aroma compounds and which amounts and combinations drive the sensory typicity of a particular wine is a basis for better vinification management and production of high quality monovarietal wines. Furthermore, as an expensive product, wine is often subject to adulteration and deliberate misdeclaration of, e.g., the variety or region. It was estimated that approximately 10% of total wine sales on the European market were of counterfeit wine [8]. Certain official control mechanisms have already been established, but as counterfeit strategies are becoming more sophisticated [9], more complex and specific approaches are needed. The corresponding methodology followed by many research groups includes (semi)quantification of a large number of volatile compounds in large sets of wines and use of the generated data for production of multivariate statistical models able to classify wines, as well as to predict and confirm their varietal or other origin based on specific markers or fingerprints [2,10].
Volatile profile of wine is extremely complex and consists of several hundreds of compounds from different chemical classes of different origin. Those that mostly determine the varietal character and identity of wine originate from grapes and pertain to the groups of terpenes, methoxypyrazines, and thiols, accompanied by other compounds whose amounts are less dependent on variety, but may have an immense influence on wine aroma, such as, for example, a C13-norisoprenoid β-damascenone. On the other hand, the foundation of the aroma of any fresh wine is made up by compounds formed in fermentation, such as volatile alcohols, fatty acids, aldehydes, and especially esters [11].
Several reports on successful varietal differentiation of wines based on volatile aroma compound composition have been published [12,13,14,15,16]. However, the majority of contemporary methods of analysis, which include the indispensable technique of choice, that is one-dimensional gas chromatography with mass spectrometric detection (GC-MS), were and are mainly focused on the targeted analysis of selected volatiles, leaving a large part of wine volatile metabolome unconsidered. In such cases, a lot of information that would possibly better reflect the variety, but also the environment (terroir), the yeast and bacteria strains that conducted the fermentations, the storage and aging conditions, etc., is lost [2].
A technique that emerged rapidly in the last two decades and became the most powerful tool for in-depth characterization of volatile compound composition of various matrices is comprehensive two-dimensional gas chromatography–mass spectrometry (GC×GC-MS). The corresponding highly sophisticated instrumentation combines two GC columns of different polarity connected in a series by a modulator, which vastly enhances the separation efficiency and identification sensitivity compared with standard GC-MS, resulting with a much higher number of properly identified volatiles [17,18]. Despite its potentials, the utilization of GC×GC-MS technique for studying wine volatile composition is not yet common and such studies are rare in general [19,20,21,22,23,24,25,26], whereas those that aimed to differentiate wines based on variety were just a few [5,27,28].
The aim of this study was to investigate the utility of GC×GC with time-of-flight mass spectrometric detection (TOF-MS) in finding varietal markers among volatile compounds in wines made from non-aromatic red grapes, known to contain almost negligible amounts of varietal aromas. For this case study, wines made from the two most important and widespread Croatian red grape varieties, Plavac mali and Teran, were characterized and differentiated. Each monovarietal wine was deliberately represented by a heterogeneous sample group in terms of geographical microlocations, pedoclimatic and growing conditions, harvest dates, and grape processing and fermentation parameters. It was considered that a powerful technique such as GC×GC-TOF-MS would provide an in-depth description of the volatile metabolome related to the variety and be able to identify subtle differences between such wines. It was expected that this study should contribute to additional valorization of the two monovarietal wines by providing information useful in managing their production, quality, and protection from forgery.

2. Materials and Methods

2.1. Wine Samples

Fourteen wines made from Croatian domestic red grape varieties (Vitis vinifera L.) Plavac mali (PM) and Teran (TE) in harvest 2015 were kindly donated by various producers from Croatian (EU) wine regions Dalmatia (PM) and Istria (TE). The samples were selected from a larger set as typical representatives of each variety by the panel for the sensory analysis of wine of the Institute of Agriculture and Tourism in Poreč (Croatia) consisting of highly trained and experienced tasters. All the wines were labelled by a protected designation of origin (PDO) and with a Croatian traditional term ‘Quality wine’ or ‘Top quality wine’. The region of Istria (located from 44°48′ N to 45°29′ N and from 13°54′ E to 14°18′ E) is characterized by Mediterranean and in a smaller part sub-Mediterranean climate (average annual temperature 13.9 °C, average annual rainfall 918 mm). The region of Dalmatia (located from 42°39′ N to 44°14′ N and from 15°11′ E to 18°50′ E) is characterized by Mediterranean climate (average annual temperature 16.7 °C, average annual rainfall 866 mm). More detailed climatological data for year 2015 are reported in Table S1. None of the vineyards of the producers included in the study were irrigated. Vines included in the study were in most cases trained to vertically shoot positioned Guyot training system with one spur and one cane, which is most common in Istria (TE), and the En Gobelet training system without support wires, with four to five spurs per vine, as a traditional vine training system in Dalmatia (PM). Th maximum yield per hectare was 9 t/ha in both cases.
Wines were produced by standard red winemaking technology typical for the variety in question, were not in contact with wood, and were collected approximately six months after vinification. The results of the basic physico-chemical analyses performed according to the methods proposed by International Organization of Vine and Wine (OIV) are reported in Table 1.

2.2. Standards, Chemicals, and Consumables

Chemical standards were purchased from Sigma-Aldrich (Sigma-Aldrich, St. Louis, MO, USA), Merck (Darmstadt, Germany), Honeywell International Inc. (Morris Plains, NJ, USA), Fluka (Buchs, Switzerland), and AccuStandard Inc. (NewHaven, CT, USA). A stock solution was prepared in methanol, and standard solutions containing different concentrations of targeted volatile compounds were prepared in model wine (pH 3.3, 13 vol.% of ethanol). Divinylbenzene/carboxen/polydimethylsiloxane (DVB-CAR-PDMS, StableFlex, 50/30 μm, 1 cm) SPME fiber used for GC-MS analysis of volatiles was purchased from Supelco, Sigma Aldrich (Bellafonte, PA, USA), whereas the same type of fiber with a length of 2 cm used for GC×GC-TOF-MS analysis was purchased from Supelco, Sigma Aldrich (Milan, Italy).

2.3. GC-MS and GC×GC-TOF-MS Analysis of Volatile Aroma Compounds

The two techniques/methods used (HS-SPME with 1D-GC-MS and GC×GC-TOF-MS, respectively) were validated and used with different setups in two different laboratories, one in Croatia [29] and another in Italy [22,30,31], respectively. The methods were tested many times with papers published from both sides based on the obtained results; therefore, the obviously different method/instrumentation setups were considered appropriate for the purpose, and at the same time complementary. The intention was not to confront the two techniques, but to obtain as much information as possible by combining the two approaches, and to investigate how much benefit the GC×GC-TOF-MS technique/method can bring into research on wine varietal differentiation.
Prior to analysis by GC-MS, volatile aroma compounds were extracted using HS-SPME as proposed by Bubola et al. [29] with slight modifications. Wine samples were four times diluted with deionized water and put in a 10 mL glass vial containing 1 g of ammonium sulfate. A 50 μL aliquot of internal standards solution (2-octanol at 0.84 mg/L, 1-nonanol at 0.82 mg/L, and heptanoic acid at 2.57 mg/L) was added. A DVB-CAR-PDMS SPME fiber was preconditioned above the sample for 15 min at 40 °C and then subjected to the vapors in the headspace for 40 min at 40 °C with stirring (800 rpm). Volatile compounds were desorbed in a GC-MS injector at 248 °C for 10 min (3 min splitless mode). GC-MS identification and quantification was performed using a Varian 3900 gas chromatograph (GC) connected to a Varian Saturn 2100T mass spectrometer with an ion trap analyzer (Varian Inc., Harbour City, CA, USA). The GC was equipped with a 60 m × 0.25 mm i.d. × 0.25 μm d.f. capillary column Rtx-WAX (Restek, Belafonte, PA, USA). The GC column was initially heated at 40 °C, the temperature was then increased at 2 °C/min to 240 °C, and then kept constant for the final 10 min. The carrier gas was helium at a flow rate of 1.2 mL/min. EI mode (70 eV) was used to acquire mass spectra in the 30–350 m/z range. Volatile compounds were identified by comparison of their retention times and mass spectra with those of pure standards and with mass spectra from NIST05 library. A spectra reverse match number (RM) higher than 800 was used as a criterion, whereas in particular cases for spectra with RM < 800 the identification was performed based on the satisfactory ratio of relative intensities of a quantifier ion and next three characteristic ions with the highest intensity. Additional confirmation of the identity of compounds was achieved by comparing linear retention indices calculated relative to the retention times of C10 to C28 n-alkanes to those reported in literature obtained using equal or equivalent capillary columns. An example of a total ion current GC-MS chromatogram is reported in Figure S1. Standard solutions at six concentration levels were analyzed in the same conditions and calibration curves were constructed. Major volatile compounds were quantified based on peak area of the total ion current, whereas minor compounds were quantified based on peak area of quantifier ions. Internal standard normalization was applied prior to quantification using calibration curves. Method validation parameters were published in our previous study [29]. Semi-quantitative analysis was performed for compounds for which pure chemical standards were not commercially available, assuming equal detector response of compounds of similar chemical structure. For major volatile compounds, odor activity values (OAV) were calculated as quotients of their concentrations and corresponding odor perception thresholds (OPT) from the literature.
Similar to the case of GC-MS analysis, prior to analysis by GC×GC-TOF-MS, volatile aroma compounds were extracted using HS-SPME according to the methods described in previous studies [22,30,31] with slight modifications. A 2.5 mL aliquot of wine was put in a 20 mL glass vial containing 1.5 g of sodium chloride. A volume of 50 μL of internal standard solution (2-octanol at 1 mg/L) was added. A DVB-CAR-PDMS SPME fiber was preconditioned above the sample for 5 min at 35 °C and then subjected to the vapors in the headspace for 20 min at the same temperature. Volatile compounds were desorbed in a GC injector at 250 °C for 3 min in splitless mode and the fiber was reconditioned at 270 °C for 7 min between each microextraction. Identification and quantification were performed using a GC Agilent 7890N (Agilent Technologies, Palo Alto, CA, USA) coupled to a LECO Pegasus IV time-of-flight mass spectrometer (TOF-MS) (Leco Corporation, St. Joseph, MI, USA) equipped with a Gerstel MPS autosampler (GERSTEL GmbH & Co. KG, Mülheim an der Ruhr, Germany). The carrier gas was helium at a flow rate of 1.2 mL/min. The first dimension GC capillary column was a 30 m × 0.25 mm × 0.25 μm film thickness VF-WAXms (Agilent Technologies), whereas the second dimension one was a 1.5 m × 0.15 mm × 0.15 μm film thickness Rxi 17Sil MS (Restek). The first GC oven was initially heated at 40 °C for 4 min, the temperature was then increased at 6 °C/min to 250 °C, and then kept constant for an additional 5 min. The second GC oven was kept at 5 °C above the temperature of the first one throughout the analysis. The modulator was offset by +15 °C in relation to the secondary GC oven, with modulation time of 7 s with 1.4 s of hot pulse duration, as reported previously [31]. EI mode (70 eV) was used to acquire mass spectra in the 40–350 m/z range. The ion source temperature was 230 °C, detector voltage was 1317 V, acquisition rate was 200 spectra/s, and acquisition delay was 120 s. LECO ChromaTOF software version 4.32 (Leco Corporation, St. Joseph, MI, USA) was used for baseline correction, chromatogram deconvolution, and peak alignment. Baseline offset was set to 0.8 and signal-to-noise ratio (S/N) was set at 100. Traditional, not adaptive integration was used. A mix of pure standards of 122 volatile compounds was analyzed under the same GC×GC-TOF-MS conditions. Volatile compounds were identified by comparison of their retention times and mass spectra with those of pure standards and with mass spectra from NIST 2.0, Wiley 8, and FFNSC 2 (Chromaleont, Messina, Italy) mass spectral libraries, with a minimum similarity match factor of 750 as a criterion. Additional confirmation of the identity of compounds was achieved by comparing linear retention indices calculated relative to the retention times of C10 to C30 n-alkanes to those reported in literature for conventional one-dimensional GC with equal or equivalent capillary columns (NIST 2.0, Wiley 8, FFNSC 2, VCF, ChemSpider). An example of a GC×GC-TOF-MS contour plot is reported in Figure S2. Overall, 209 volatile aroma compounds were (tentatively) identified. Concentrations of volatile compounds (μg/L) were calculated relative to that of the internal standard 2-octanol, assuming an equal detector response.
Prior to HS-SPME GC×GC-TOF-MS analysis, all the wine samples were mixed in equal proportions and the quality control (QC) sample thus obtained was analyzed five times in a row before each wine sample sequence and once after every five wine samples. In preliminary data validation, principal component analysis (PCA) clustered the QC samples very close and separated them from the wine samples, suggesting good method repeatability. Relative standard deviation of the average concentration of the internal standard 2-octanol determined in QC samples was 10.4% which was considered satisfactory for HS-SPME GC×GC-TOF-MS analysis.

2.4. Statistical Data Elaboration

Data obtained by GC-MS and GC×GC-TOF-MS were subjected to analysis of variance (one-way ANOVA) and the average values of concentrations were compared by least significant difference (LSD) post hoc test at p < 0.05 level. The data were further processed by multivariate statistical analysis using principal component analysis (PCA), hierarchical cluster analysis (HCA), and partial least squares–discriminant analysis (PLS-DA). The original dataset used in PCA, HCA, and PLS-DA consisted of all 14 wines and 51 volatile aroma compounds as variables for which significant differences were determined by one-way ANOVA, including two compounds determined by GC-MS and 49 compounds determined by GC×GC-TOF-MS. For such compounds determined by both techniques only GC×GC-TOF-MS data were used. Statistica v. 13.2 software (StatSoft Inc., Tulsa, OK, USA) was used to conduct ANOVA and PCA, whereas MetaboAnalyst v. 5.0 (http://www.metaboanalyst.ca, accessed on 24 September 2022) was applied for HCA and PLS-DA [32].

3. Results and Discussion

3.1. Standard Physico-Chemical Parameters

The results of the standard physico-chemical analysis are reported in Table 1. A statistically significant difference was only determined for alcoholic strength, which was higher in Plavac mali than in Teran wines, which was in line with a previous study [33].

3.2. GC-MS Volatile Metabolome

A total of 40 volatile compounds were identified by GC-MS analysis, including 9 terpenes, 8 C13-norisoprenoids, four alcohols, 4 fatty acids, 13 esters, and 2 compounds with an aromatic ring. Their concentrations are reported in Table 2. The majority of these compounds are commonly present in wine in medium to relatively high concentration; thus, the choice of one-dimensional GC-MS for their analysis was considered appropriate, since no major interferences with other, minor overlapping peaks was expected [5]. Some other compounds, present in lower concentration such as particular monoterpenes, volatile phenols, and especially C13-norisoprenoids, were included either because they were not identified by GC×GC-TOF-MS, or because they were analyzed by both techniques for the purpose of comparison. The compounds in Table 2 were sorted by chemical class and by descending F-ratio obtained by one-way ANOVA within each class.
The most abundant monoterpenes were the major monoterpenols, in descending order: geraniol, citronellol, and linalool (Table 2). Monoterpenes contribute to wine aroma with odors reminiscent of flowers and fruits. Nuances provided by linalool and geraniol are commonly compared to that of roses, whereas citronellol is a carrier of citrus odors. In the investigated wines they were present in sub-threshold concentrations, but relatively close to their odor perception thresholds of 30 µg/L for geraniol [34], 18 µg/L for citronellol [11,35], and 15 µg/L for linalool [34] (Table S2). It is known that the odors of monoterpenols, as well as some other volatile compounds, can act synergistically even when present below their odor perception thresholds [11], so it is possible that the mentioned major monoterpenols, despite having odor activity values (OAV) lower than 1, contributed to the aroma of the investigated Plavac mali and Teran wines in this way. Monoterpenes derive from grapes and are considered among the most useful indicators of wine varietal origin, however mostly in white wines [11]. Among the terpenes identified in this study, a statistically significant difference was found only for limonene with higher concentration found in Plavac mali wines (Table 2). In our previous analogous study on white monovarietal wines, the one-dimensional GC-MS technique was successful in identifying a much larger number of terpenes, among which many were found to discriminate the wines in question [5]. For example, monoterpenols such as α-terpineol and linalool, as well as limonene and others, showed high potential for varietal differentiation, with F-values much higher than that determined in this study.
C13-Norisoprenoids occur in grapes of the majority of varieties. They are formed by degradation of carotenoids, such as β-carotene, lutein and others, through a number of steps and with many intermediates. Their concentrations mostly depend on parameters during pre-fermentation grape processing, fermentation and aging, and less on variety [36,37], but these compounds were nevertheless in some cases found useful for varietal differentiation [5]. In this study, no significant differences were found for C13-norisoprenoids analyzed by GC-MS (Table 2). Among them, β-ionone, and especially β-damascenone were found in concentrations higher than their very low odor perception thresholds determined in alcoholic solution of 0.09 µg/L [38] and 0.05 µg/L [34], respectively. Judging from its high average OAV (Table S2), β-damascenone most probably significantly impacted the aroma of the two investigated monovarietal wines. However, certain authors determined much higher thresholds in experiments with real red wines, implying β-damascenone has more an indirect than a direct impact on red wine aroma [39]. The odor of β-ionone is commonly described as reminiscent of violets, whereas β-damascenone is responsible for odors of stewed apple, dried plum, and honey.
A fraction of C6-alcohols derives from enzymatic cleavage of unsaturated long-chain fatty acids, whereas another portion of these compounds is released into must and wine from the corresponding glycosides from grapes. Both processes take place predominantly during pre-fermentation steps, including harvest, transport, and grape processing, when physical damage to the berries induces the activity of the enzymes from the so-called lipoxygenase pathway. The odors of C6-alcohols are commonly described as green, vegetable, and herbal. They rarely directly participate in wine aroma due to relatively high odor perception thresholds, such as 8000 µg/L for 1-hexanol [34] (Table S2), although there is a general opinion that higher concentrations may impart wine aroma with negative odors. Although some authors found that wines can be differentiated among each other according to variety based on the levels of these compounds [40], no significant differences were found between Plavac mali and Teran wines (Table 2).
The same was observed for 2-phenylethanol, an alcohol mostly a product of alcoholic fermentation, although its smaller fraction also derives from grapes. Its average concentration found in both investigated monovarietal wines was similar and almost five times its odor perception threshold of 10,000 µg/L [34] (Table 2 and Table S1). This implies 2-phenylethanol significantly contributed to the aroma of both Plavac mali and Teran wines with its odor reminiscent of roses.
Acids and esters identified by GC-MS are formed in alcoholic and/or malolactic fermentation thus depend mostly on fermentation conditions, such as yeast strain and fermentation temperature, maceration duration, cap management, degree of pressing, etc. Although much less dependent on the variety than those originating from grapes, fermentation compounds have also been previously shown to be useful in differentiating monovarietal wines [27,28,41]. In our previous report on the varietal differentiation of white wines, the effect of variety was significant for many fermentation aroma compounds determined by both GC-MS and GC×GC-TOF-MS [5]. In this study, among the fermentation compounds identified by GC-MS, a significant difference was determined only for a minor, often neglected ester with unknown sensory relevance, isoamyl lactate. Higher concentration was found in Teran than in Plavac mali red wine (Table 2). Nevertheless, the major fermentation acids and especially esters determined by GC-MS in this study generally belong to a group of volatile compounds with the strongest impact on wine aroma. The concentrations of major volatile acids, i.e., butyric, hexanoic and octanoic acid, were higher than their corresponding odor thresholds of 173, 420 and 500 µg/L, respectively [42], meaning they directly contributed to the aroma of wines of both varieties with odors reminiscent of fats and cheese (Table S2). Ethyl octanoate, ethyl hexanoate and ethyl butyrate among ethyl esters, and isoamyl acetate and 2-phenethyl acetate among acetates, with the corresponding thresholds of 2, 5, 20, 30 and 250 µg/L and OAVs multiply exceeding the unit value [34] (Table S2), certainly defined the fruity-flowery component of the aroma profile of both Plavac mali and Teran monovarietal red wines. The average concentrations of ethyl 2-methylbutyrate and ethyl 3-methylbutyrate significantly surpassed their corresponding odor thresholds of 1 and 3 µg/L [34] as well, respectively. These esters are carriers of forest and berry fruit odors, often encountered in red wine [42] (Table S2). The other two major esters, diethyl succinate and ethyl lactate were in both wines found in average concentrations lower than the corresponding odor detection thresholds of 6000 µg/L [43] and 100,000 µg/L [44], respectively.
The third compound significantly different between the wines was a benzenoid ester, ethyl cinnamate, carrier of odors reminiscent of cloves. Higher average concentration was found in Plavac mali wines (Table 2), but in both wines its level was below the corresponding odor threshold of 1 µg/L [34] (Table S2).
It is obvious that standard, one-dimensional GC-MS, as in numerous previous published reports, was able to provide information about the composition of important major odoriferous volatiles in red wine. It can be said that Plavac mali and Teran wines have, on the average, a similar basis of their volatilomes, with the dominant contribution of fermentation volatile esters to the aroma, as it is common for non-aromatic red wines. Judging by the relative standard deviations, there was a markedly large intra-varietal diversity within the volatile metabolomes of both wines. It was most probably the result of the significant variability in micro-locations with specific pedoclimatic conditions in conjunction with variations in grape cultivation and winemaking practices between different producers.
Contrary to our previous study on white monovarietal wines [5], GC-MS provided rather limited information about the differences between the volatile aroma compositions of Plavac mali and Teran red wines. Statistically significant differences were determined only for three volatiles of doubtful impact on the overall wine aroma, with relatively low F-values (Table 2).

3.3. GC×GC-TOF-MS Volatile Metabolome

In total, 209 volatile compounds identified and semi-quantified by GC×GC-TOF-MS are listed in Table 3, including 27 terpenes, 11 norisoprenoids (a C9-norisoprenoid α-isophorone, a C10-norisoprenoid safranal, and 9 C13-norisoprenoids), 28 benzenoids, 21 aldehydes and ketones, 28 alcohols, 9 acids, 53 esters, 5 volatile phenols, 12 furanoids and lactones, 10 compounds with sulfur, and 5 miscellaneous compounds. As in the case of GC-MS results reported in Table 2, the compounds were sorted in a descending order based on their F-ratio values within each chemical class. Clearly, GC×GC-TOF-MS delivered much more information about the volatile metabolomes of the two investigated wines in terms of the number of compounds identified, owing to its superior separation efficiency, enhanced sensitivity, and clearer mass spectra obtained. On the other hand, particular compounds found in low concentrations by GC-MS, such as β-ionone, ethyl cinnamate, and eugenol, were not identified by automated peak detection and spectral deconvolution after GC×GC-TOF-MS analysis. This confirmed the fact that targeted analysis and identification using chemical standards is necessary in some cases. It should be noted that the results of GC×GC-TOF-MS analysis were semi-quantitative, relative to the internal standard 2-octanol with the detector response factor used equal to one. This means that the obtained values deviated from the actual concentrations to a certain degree depending on the compound [45], but were certainly useful for the comparison of volatile metabolomes and differentiation of the two monovarietal wines. The results obtained by the two instrumental techniques should therefore be considered complementary.
GC×GC-TOF-MS allowed the determination of a much larger number of terpenes (Table 3) than standard GC-MS (Table 2). As well, significant differences between the concentrations were found for a number of them, all being more abundant in Teran then in Plavac mali wines. Ho-trienol emerged as the most important differentiator with the highest F-ratio value, followed by 10,11-epoxycalamenene, linalool, and dihydro-γ-terpineol. Interestingly, the difference between linalool concentrations was statistically significant when determined by GC×GC-TOF-MS, contrary to the result of the analysis of the same compound by GC-MS, although a same trend towards higher concentration in Teran wines was observed by both techniques. It is possible that this discrepancy was a result of the co-elution of linalool with particular unidentified compounds and lower resolution of GC-MS in comparison to GC×GC-TOF-MS instrumentation used, although strict measures have been taken to ensure the quality of the results. As well, different HS-SPME setup was applied in the two methods, which could have influenced the differences observed. Among the terpenes for which significant differences were observed, only linalool is commonly included among the compounds with sensory relevance. It is possible that this monoterpenol plays a more significant role in the aroma of Teran than in Plavac mali red wines, although precise conclusions were not possible at this point, considering the discrepancy between the GC-MS and GC×GC-TOF-MS results. Moreover, the data obtained by GC×GC-TOF-MS were semi-quantitative, meaning putting them in relation with the corresponding odor detection threshold would not be meaningful. The determined differences in terpene profiles of the two monovarietal wines were probably largely a result of different varietal origin. However, it should be stressed out that the grapes of Plavac mali and Teran used for production of the investigated wines were grown in two different geographical regions in Croatia, Dalmatia and Istria, respectively, characterized by different pedoclimatic condition, so variety and location possibly produced a synergistic effect. Lower temperatures favor the accumulation, whereas increased temperatures reduce the content of terpenes in grapes [46], possibly due to reduced expression of 1-deoxy-D-xylulose-5-phosphate synthase, germacrene D synthase, and linalool synthase which regulate the biosynthesis of terpenes, as reported by other authors [47]. It is possible that higher terpene concentrations in Teran wines were at least partly a result of the differences in temperature, with Istria further north being characterized by lower average values (Table S1). Similar results were found in our previous report where Dalmatian white wines contained significantly lower concentrations of monoterpenes in relation to those produced in Istria [5]. Water supply and soil water retention capacity are also important factors that determine the growth and quality of grapes and other fruits [48,49,50]. As the vineyards of the producers involved in this study were not irrigated, the availability of water depended on natural rainfall. During June and July, two months important for the development of grapes, the vines in both regions could have potentially suffered a certain degree of water stress due to relatively low rainfall in this period (Table S1). The effect was possibly more severe in Dalmatia where very low precipitation was recorded, especially in July. This, together with higher temperatures recorded, probably exhibited an influence on the dynamics of ripening and accumulation of sugars and had a consequential impact on the grape composition. As mentioned in Section 2.1., vine cultivation techniques between the two varieties mostly differed, which, among other factors, could have also contributed to the differences observed.
Among the 11 identified norisoprenoids, 2 theaspirane isomers emerged as very potent differentiators according to variety, both of them having higher concentration in Teran than in Plavac mali wines (Table 3). At this point, the corresponding odor perception thresholds of these compounds in wine were unknown; therefore, the conclusions about their contribution to the aroma of Plavac mali and Teran wines could not be made. However, the possibility that they have an impact should not be a priory neglected. The other identified norisoprenoids also showed a tendency towards higher concentrations in Teran wines, although without statistical significance due to large intra-varietal variability. Due to its low odor perception threshold, β-damascenone is considered one of the impact odorants in wine in general [34]. The GC-MS analysis allowed a detection of a prevalent isomer, trans-β-damascenone, which is commonly reported in wine aroma studies. The utilization of GC×GC-TOF-MS enabled the detection of the other isomer as well, that is cis-β-damascenone, found in a much lower concentration compared to trans-β-damascenone (Table 3). Marais et al. [36] stated that the concentration of β-damascenone mostly depend on grape cultivation and winemaking conditions, whereas variety has a weaker influence, which could explain the absence of significant differences for β-damascenone isomers in this study. Among other C13-norisoprenoids, 1,1,6-trimethyl-1,2-dihydronaphthalene (TDN) and trans-1-(2,3,6-trimethylphenyl)buta-1,3-diene (TPB) have often been found in wine at concentrations surpassing their odor perception thresholds [51], so there is a possibility they contributed to the aroma of the investigated wines as well. The sensory relevance of vitispiranes and actinidiols is still generally unknown.
A very large number of benzenoids was identified by GC×GC-TOF-MS. The average concentrations of several compounds from this group were found to be significantly different between the two investigated monovarietal wines, with higher concentrations found in Teran than in Plavac mali wines (Table 3). The highest F-ratio value was obtained for ethyl salicylate. In our previous study with GC×GC-TOF-MS applied for white wine varietal differentiation, many benzenoids have also been shown to be variety specific [5]. By comparing this and the mentioned previous study, it was observed that 2,3-dihydrobenzofuran and 4-ethylbenzaldehyde were statistically significant indicators of varietal origin in both cases, which implies that their potential should be further investigated. The sensory impact of the identified benzenoids has not been, to our knowledge, a subject of scientific research up to date; therefore, no conclusions could be drawn about it.
Among the identified aldehydes and ketones, significant differences were determined only for 3-ethoxy-2-butanone and 3,4-dihydroxy-3-cyclobutene-1,2-dione, two ketones only tentatively identified by comparison of their mass spectra to those from commercial mass spectral libraries. Their concentrations were higher in Teran wines (Table 3). The opposite was found for alcohols, where the concentrations of a 2,3-butanediol isomer, 4-octanol, 1-octen-3-ol, and 4-hepten-1-ol were higher in Plavac mali wines, whereas only the concentration of tentatively identified 2-(1-ethoxyethoxy)-3-methyl-1,4-butanediol was higher in Teran wines. Among these compounds, only 1-octen-3-ol has often been reported among the volatiles relevant for wine aroma with its odor reminiscent of mushrooms due to relatively low odor perception threshold of 1 µg/L [52]. On the other hand, 2,3-butanediol was a subject of many studies since it is a precursor and a major product of yeasts and lactic acid bacteria in alcoholic and malolactic fermentation [53]. No significant differences were found for volatile fatty acids.
Esters generally contribute to wine aroma by fruity and flowery odors [34,42]. Many minor esters were identified by GC×GC-TOF-MS analysis, including those of ethanol and various acids (ethyl esters), esters of various alcohols and acetic acid (acetates), as well as esters of minor alcohols and minor acids. Several esters of ethanol and other alcohols with dicarboxylic acids were also found, such as diethyl oxalate, diethyl fumarate, diethyl malate, diethyl glutarate, diethyl 2-methylsuccinate, and diethyl malonate, as well as various esters of different combinations of alcohols and succinic acid (Table 3). The concentrations of seven esters, namely ethyl methylhexanoate, diethyl oxalate, diethyl fumarate, isoamyl lactate, butyl ethyl succinate, diethyl malate, and isoamyl isobutyrate were higher in Teran, whereas the concentrations of ethyl pentanoate and isoamyl 2-methyl-2-propenoate were higher in Plavac mali wines. The higher concentration of isoamyl lactate in Teran wines was determined by both GC-MS and GC×GC-TOF-MS analysis. Most of the listed above were ethyl esters, which is in line with a thesis that their concentration depends more on the amount of acid precursors, possibly partly predetermined by variety, than it is the case for acetates whose production is influenced by the activity of alcohol acetyltransferases in addition to the availability of nitrogen [21,54,55]. This implied the possibility that variety and grape growing conditions indeed exhibited a particular effect on these particular esters that prevailed over the effects of fermentation parameters. The contribution of the mentioned esters to the aroma of the investigated wines was probably not large, either because of their low concentrations or low volatility.
Furanoids found in the highest concentrations were ethyl 2-furoate and furfural, whereas among lactones γ-butyrolactone was the most abundant (Table 3). However, significant differences were determined for other, minor lactones, with pantolactone, γ-ethoxybutyrolactone, and γ-octalactone found in higher concentration in Teran, and α-methyl-γ-crotonolactone in Plavac mali wines. Lactones from the γ-series, formed by cyclisation of the corresponding γ-hydroxycarboxylic acids, were the most numerous. Their odors are usually described as fruity, sweet, milky, and coconut-like [56].
Three sulfur containing compounds were found to be significantly different between the investigated wines. Ethyl 3-(methylsulfanyl)propanoate emerged as a strong varietal differentiator with a relatively high F-ratio value, with higher concentration found in Teran wines. Teran was also more abundant in dihydro-2-methylthiophen-3-one, whereas Plavac mali wines contained more ethyl methanesulfonate. Sulfur containing volatile compounds are formed during fermentation by the degradation of sulfur containing amino acids or by the reduction of elementary sulfur, sulfite, or sulfate [21], whereas their content and composition depends strongly on the yeast strain used. These compounds are usually associated with negative odors reminiscent of rotten egg, cabbage, garlic, onion, cheese, and burnt rubber and are often referred to as reduced or reductive aromas [57,58]. A sulfur-containing compound found in the highest relative amount was methionol, often found in white and red wines. Its odor perception threshold ranges between 500 to 4500 µg/L, as determined by various authors [59]; therefore, it most probably did not have a significant contribution to the aroma of Plavac mali and Teran wines.
Among other compounds, tridecane showed a significant potential to differentiate the two investigated monovarietal wines. It was found in higher concentration in Plavac mali, whereas 1,5,5,6-tetramethyl-1,3-cyclohexadiene was significantly more abundant in Teran wines (Table 3).

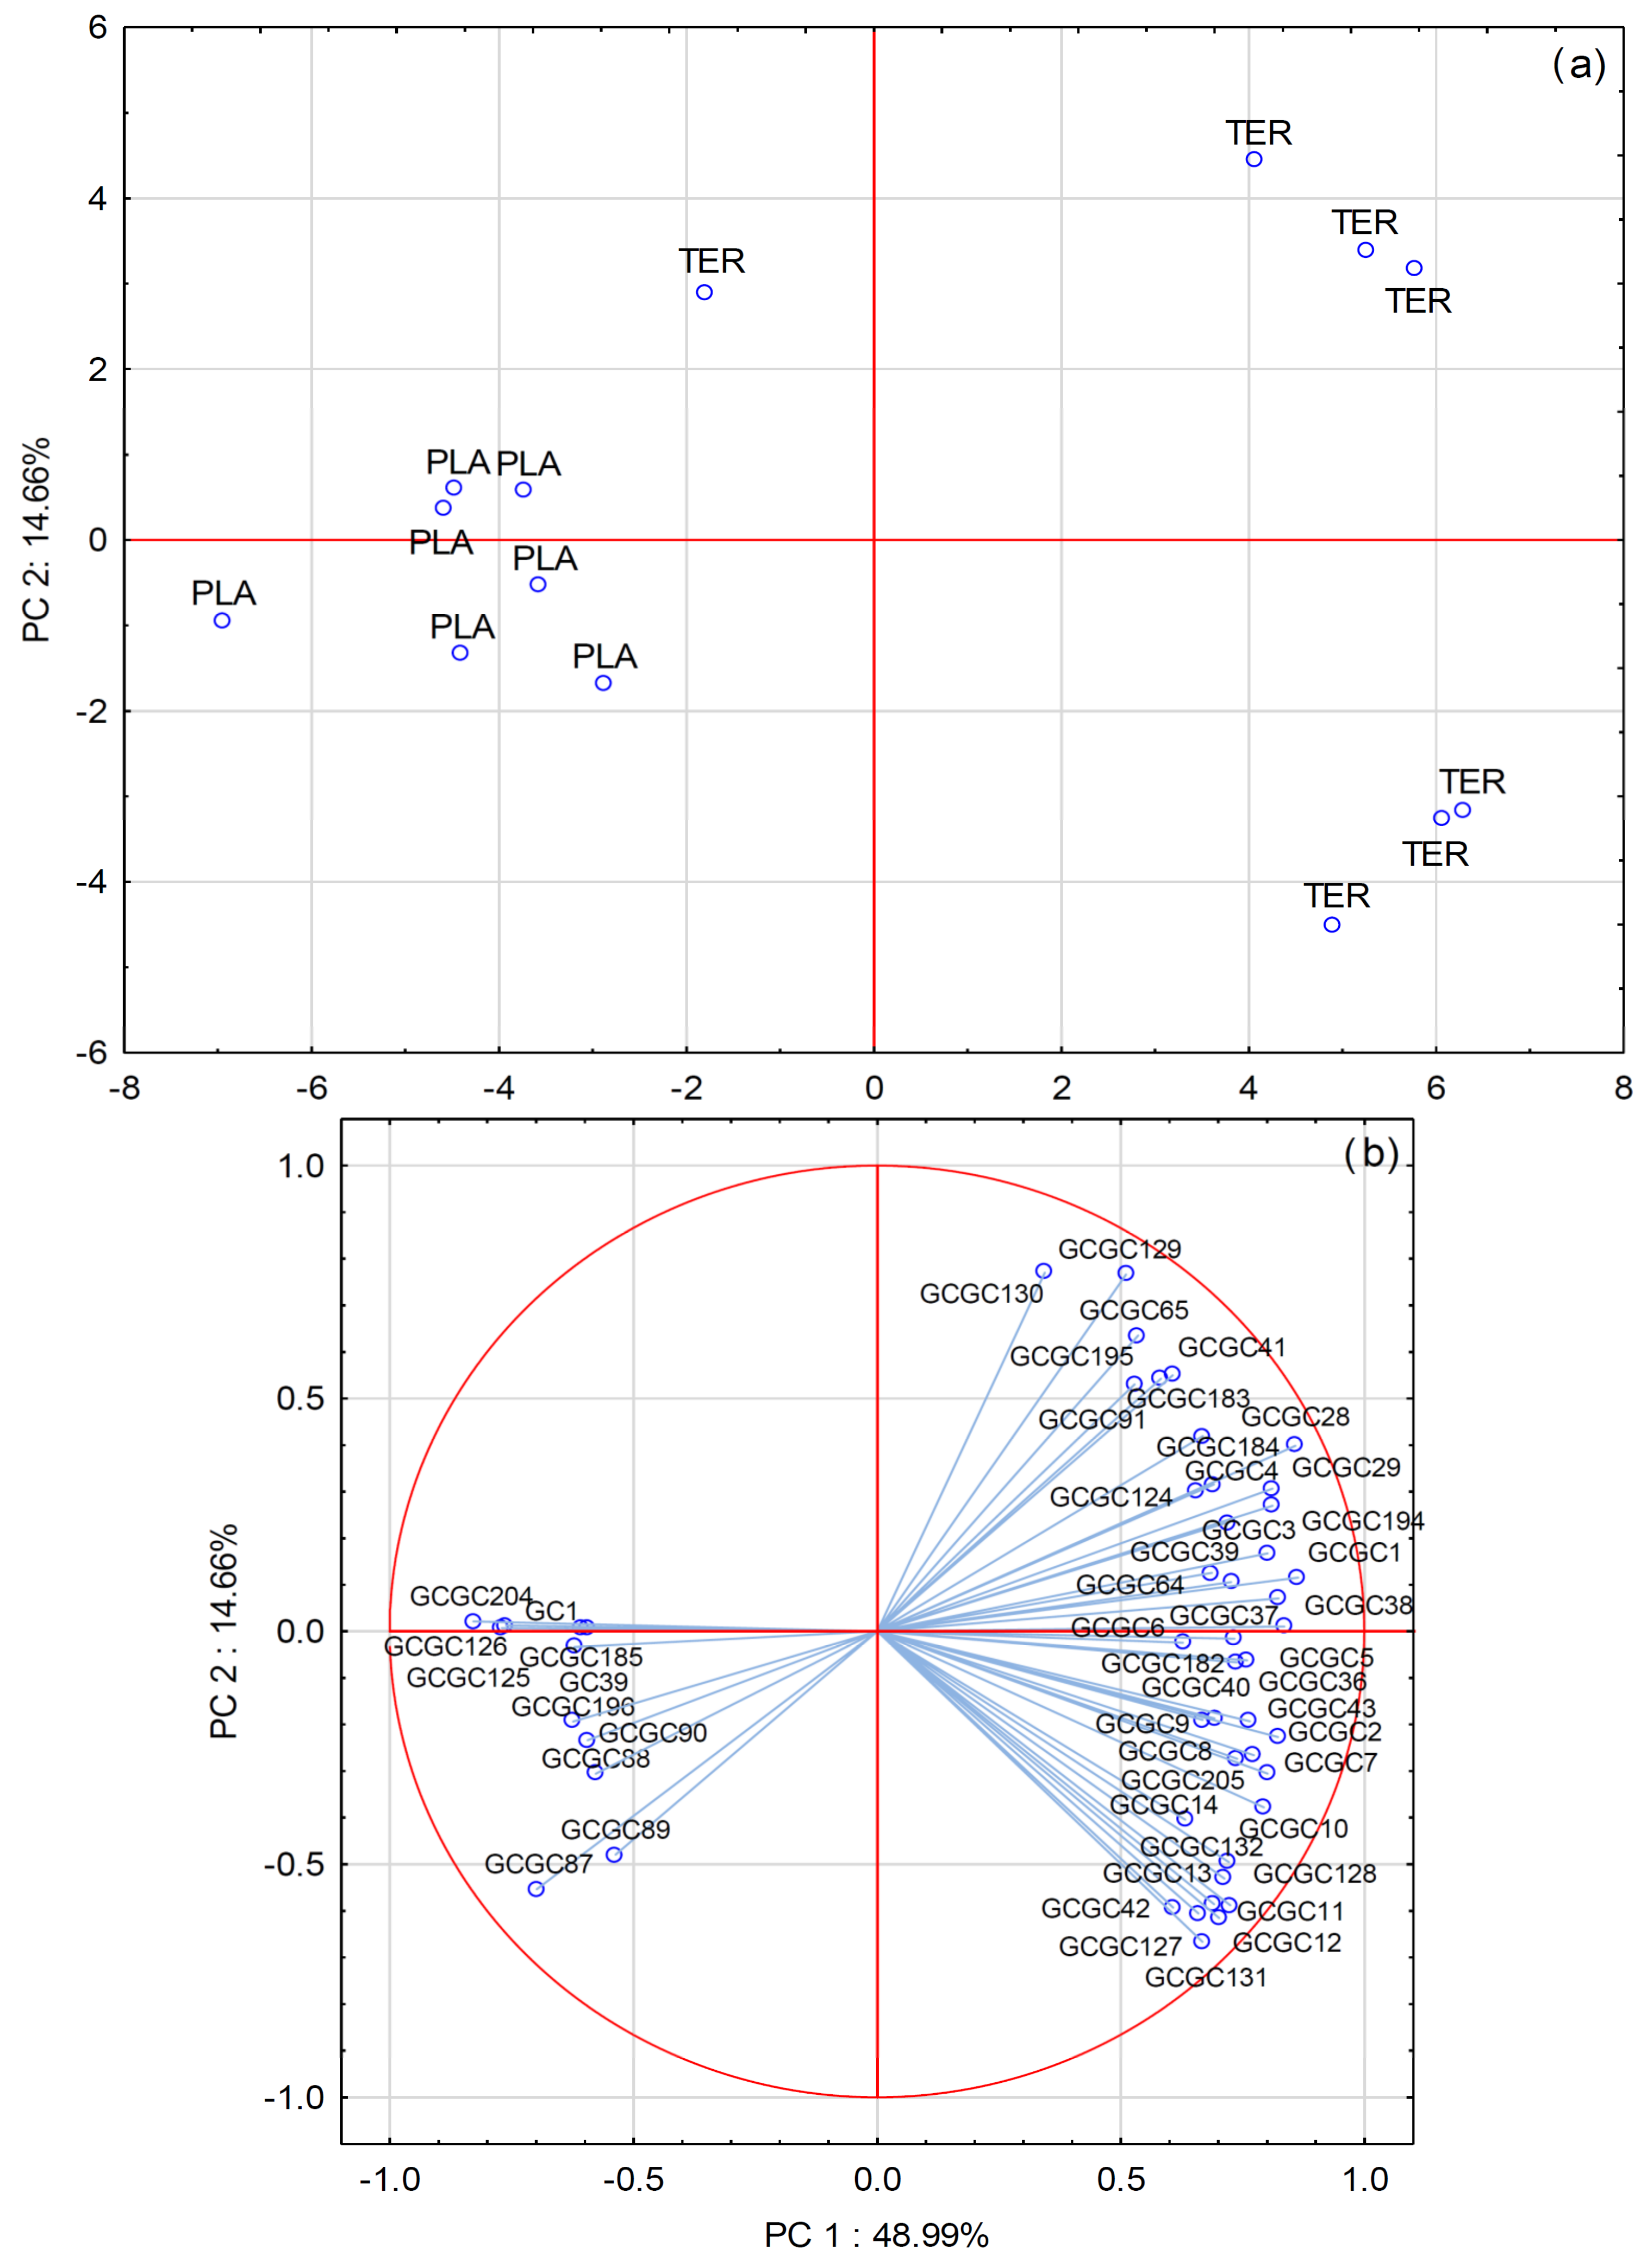
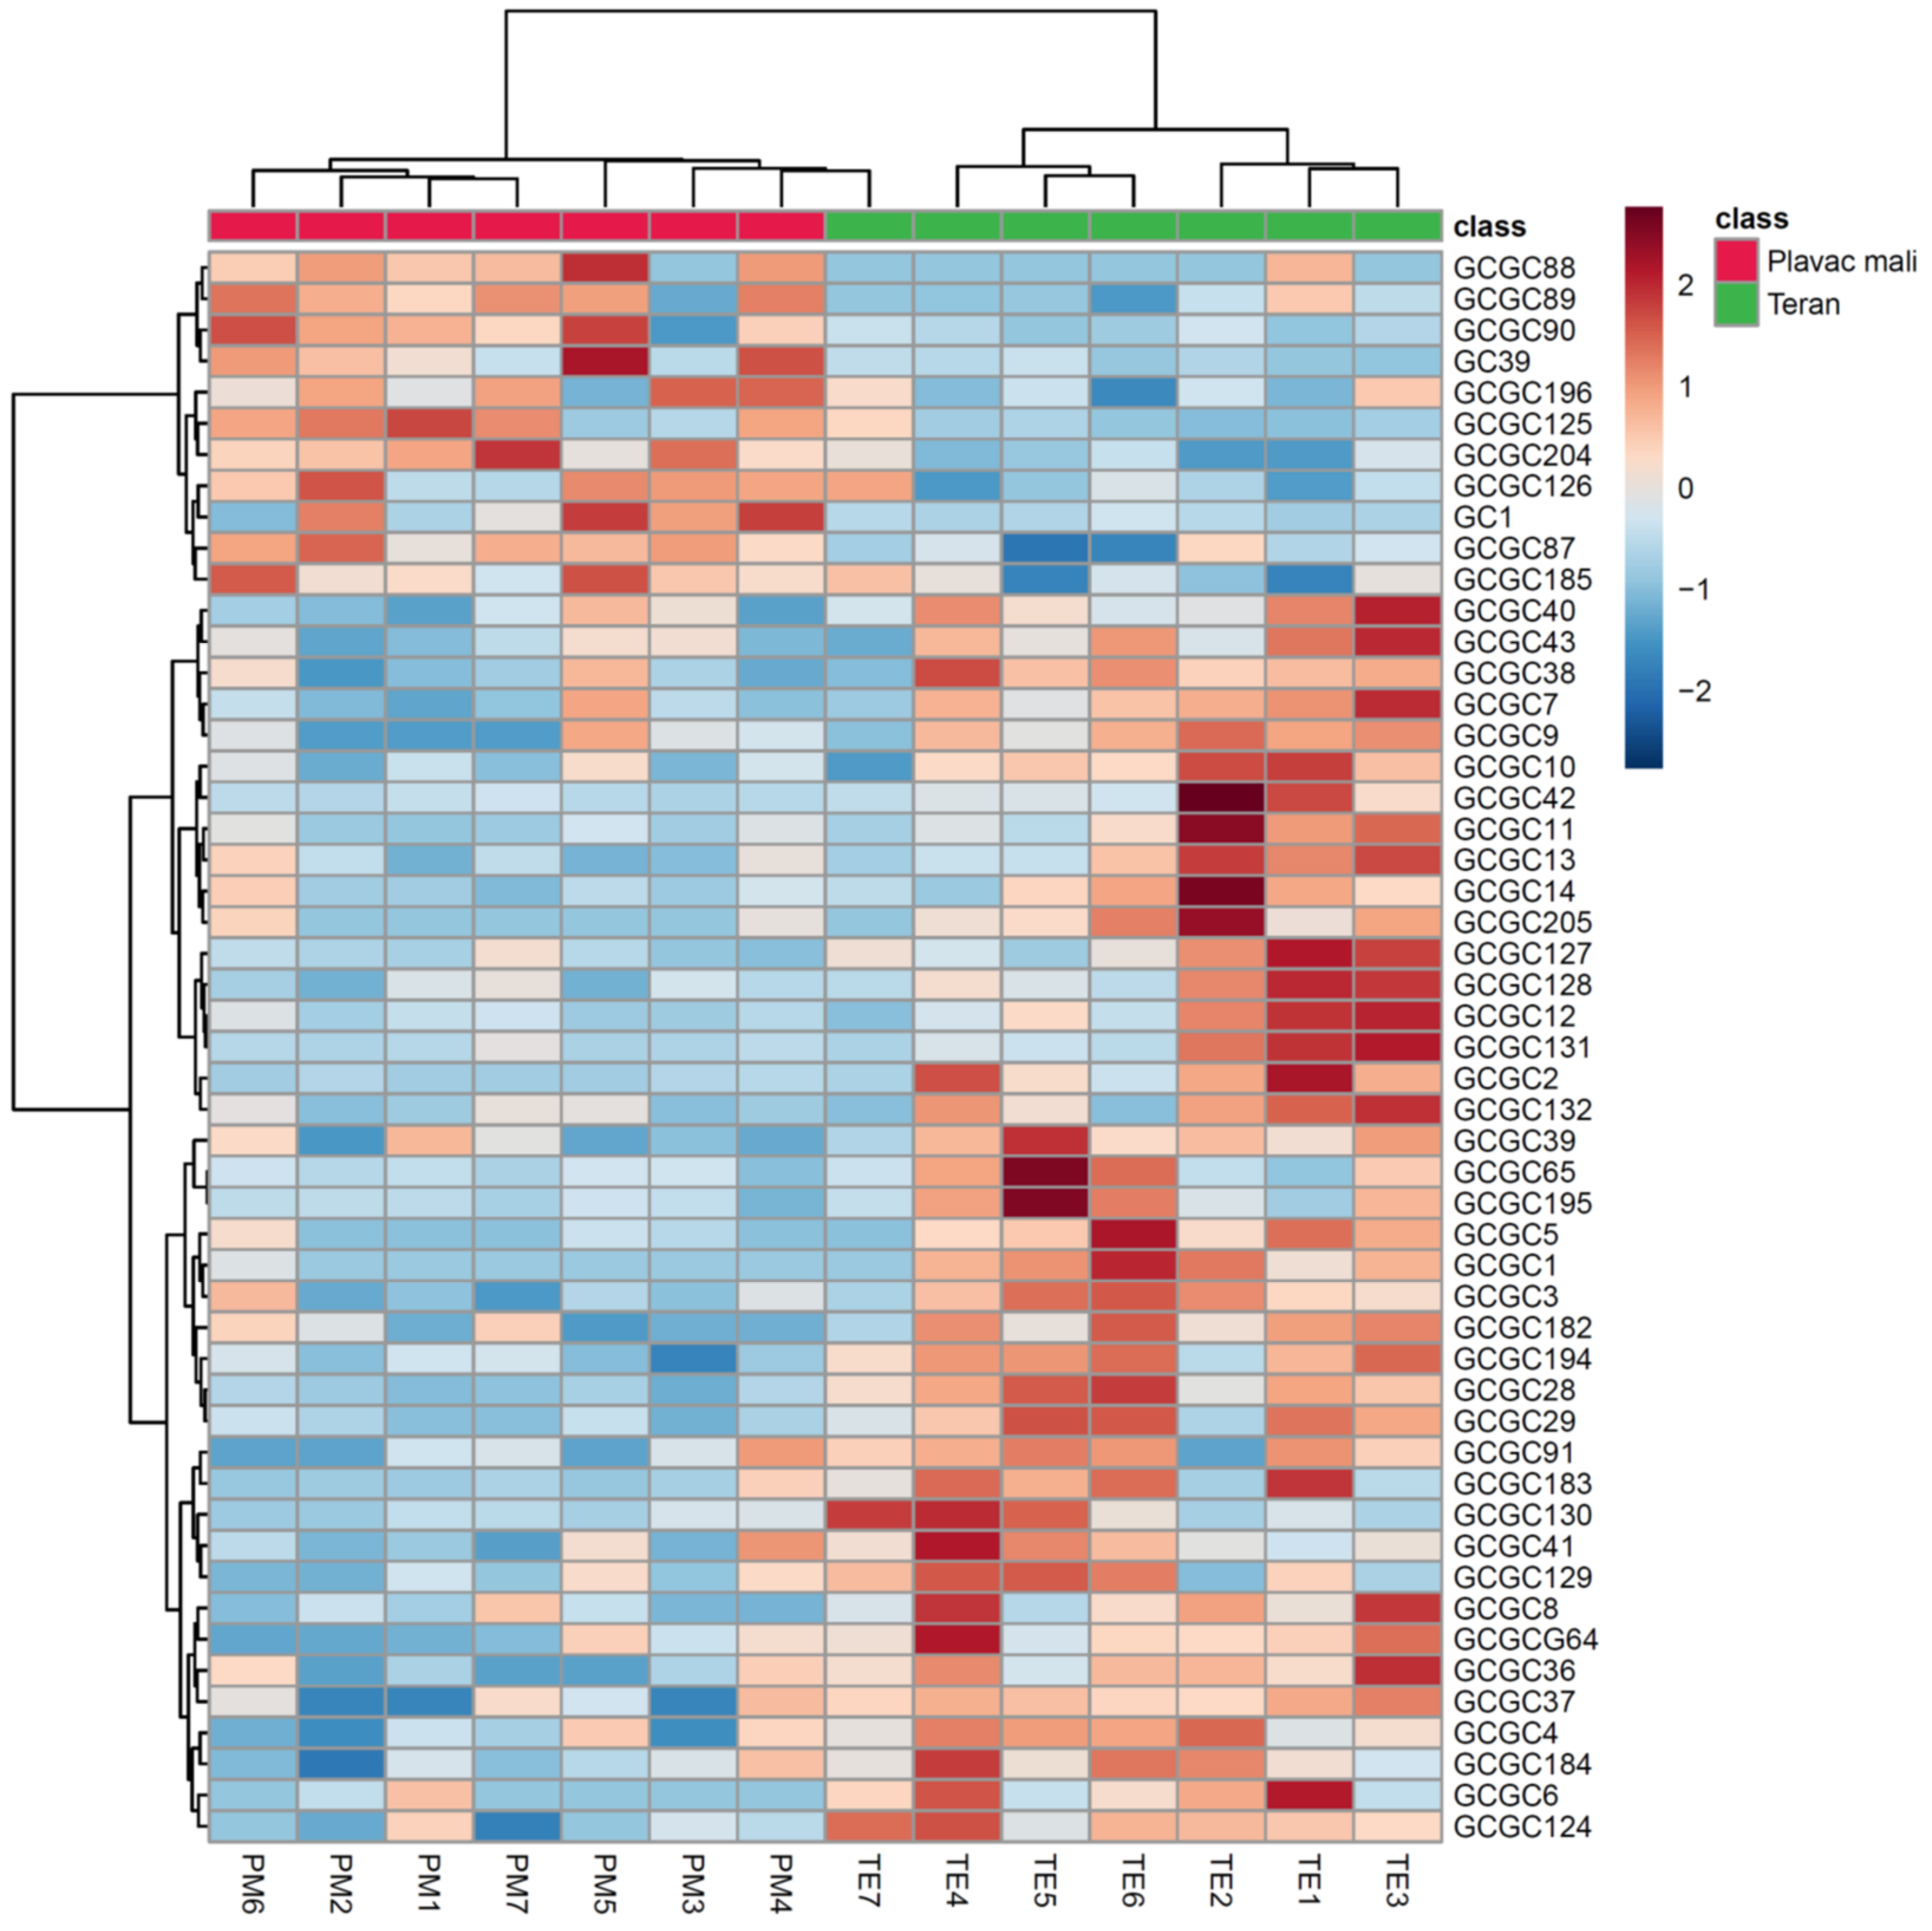
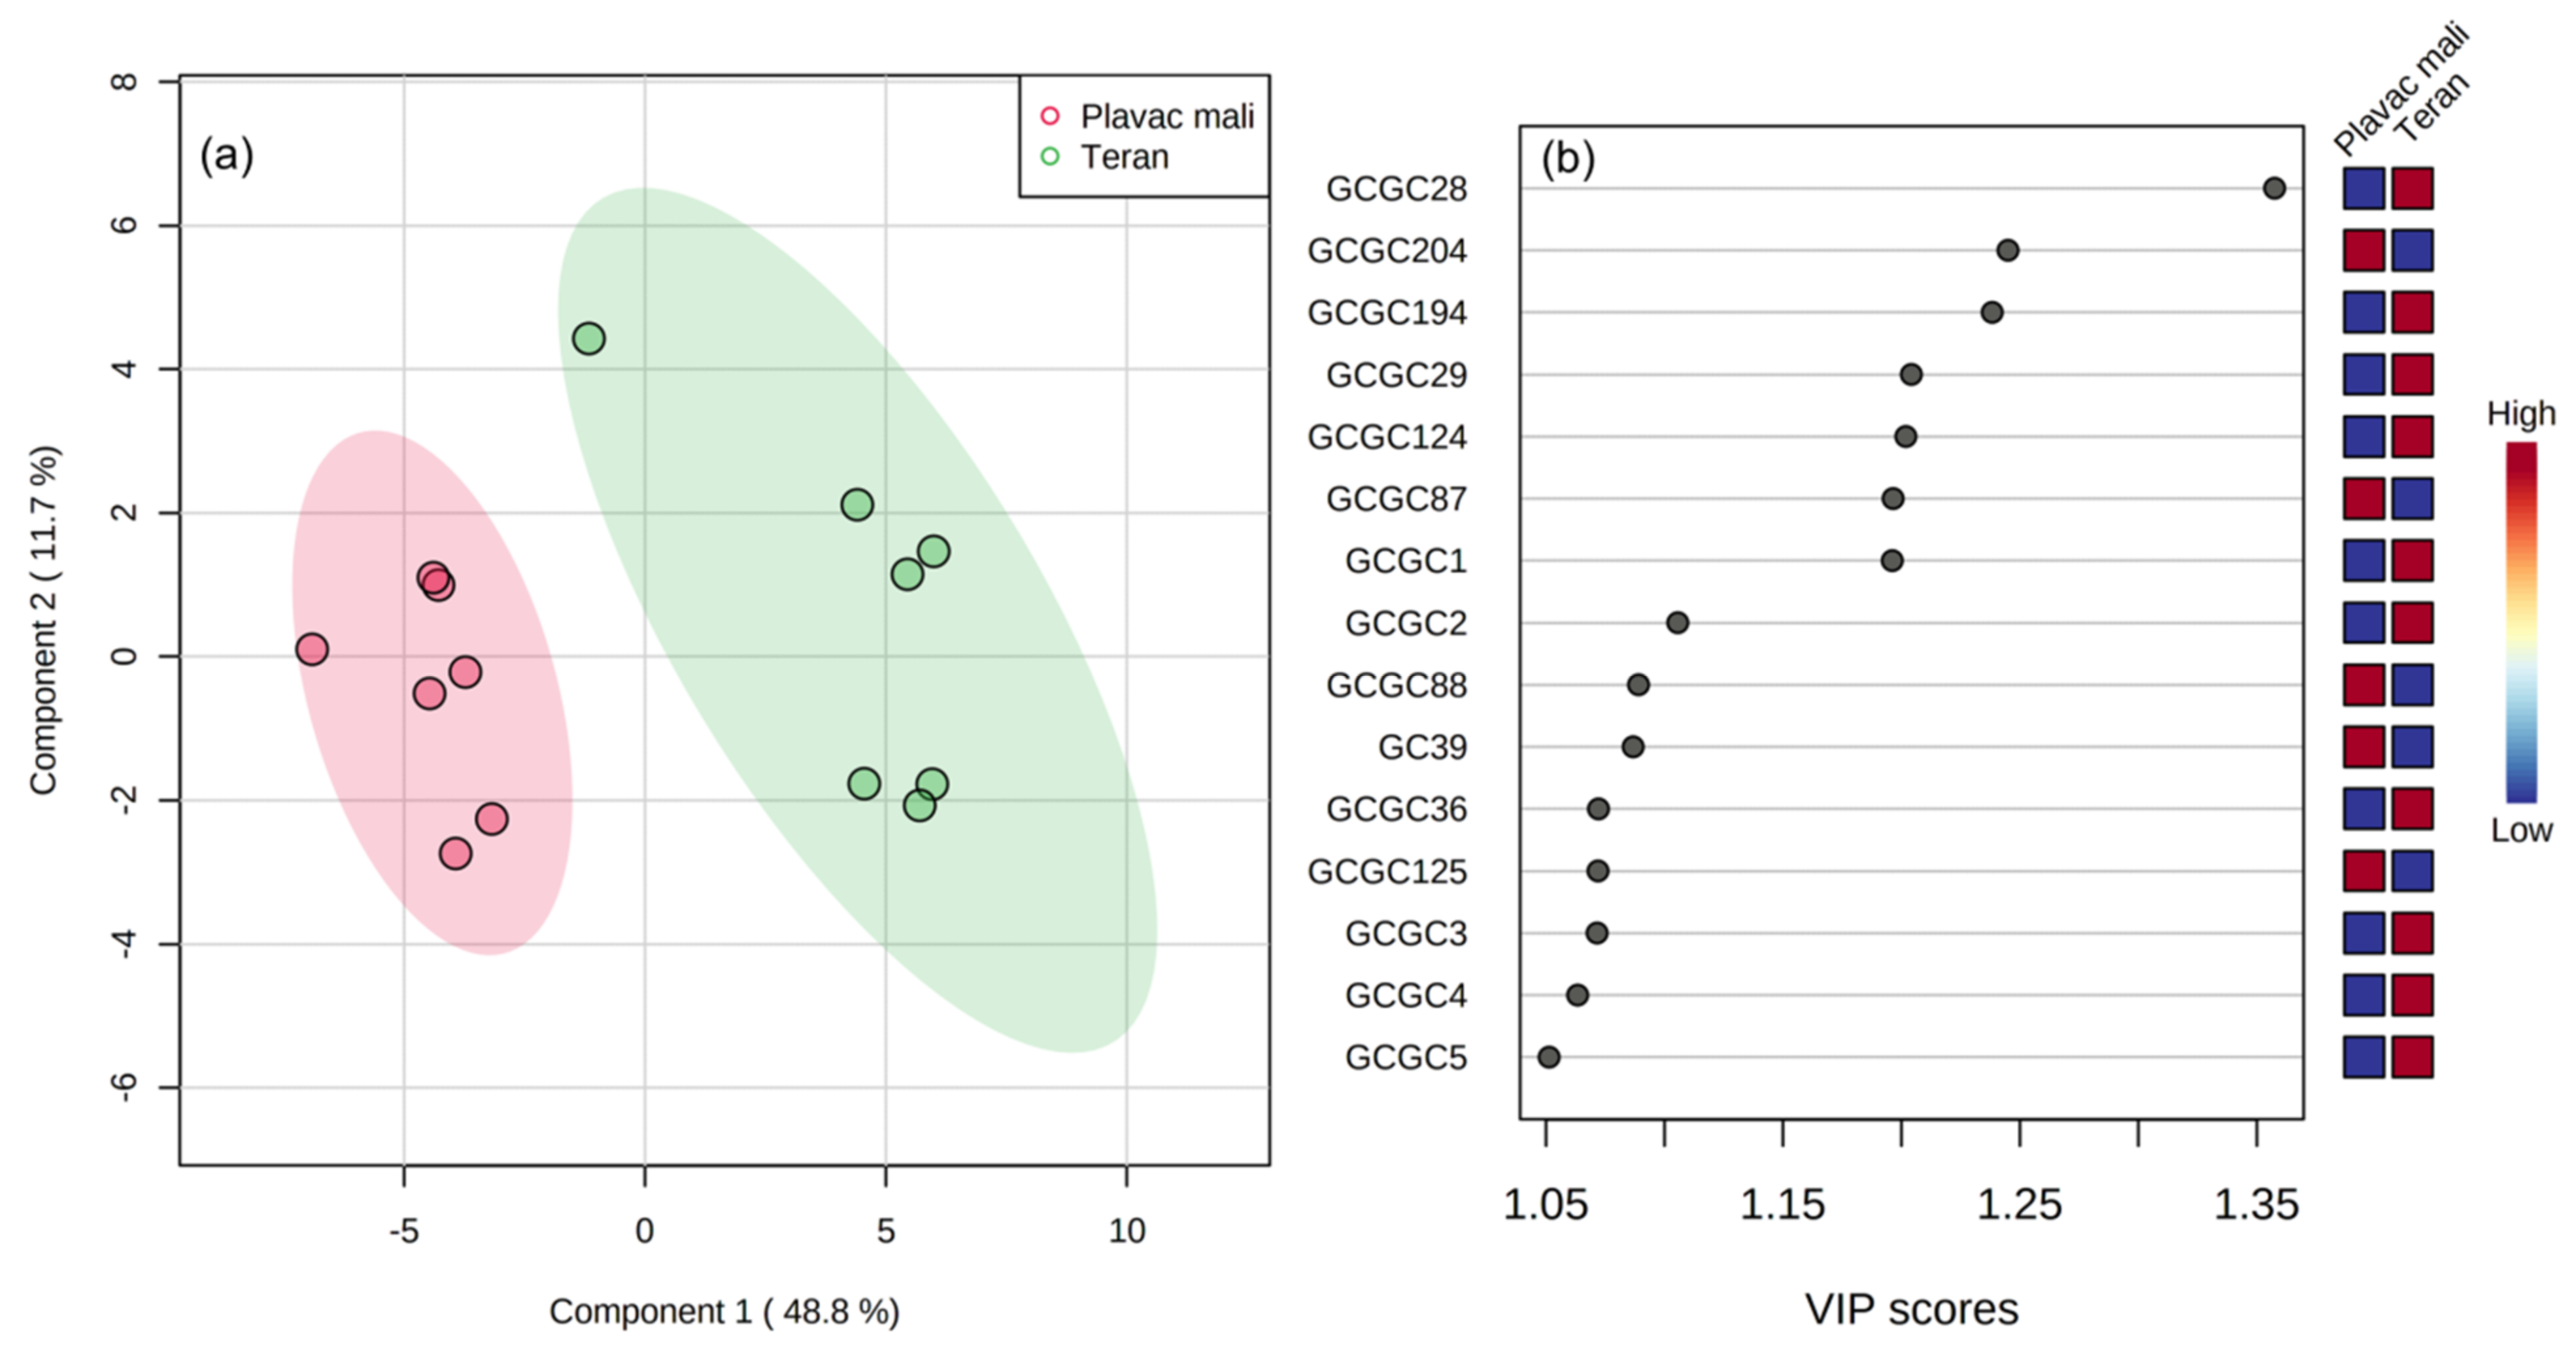
3.4. Multivariate Statistical Analysis

Principal component analysis (PCA) is an unsupervised multivariate statistical method that reduces the number of dimensions of the original dataset, whereas it retains the maximum of variability. It allows the visualization of cases (e.g., wines) in two-dimensional space and explanation of the differences observed between them on the basis of the contributions of variables (e.g., volatile compounds) to the principal components. PCA was applied on the dataset containing 14 wine samples as cases and 51 volatile compounds as variables. The compounds included were those for which statistically significant differences between the monovarietal wines were determined by one–way ANOVA. Only GC×GC-TOF-MS data were used for isoamyl lactate. Figure 1 shows the projection of wine samples, as well as the loadings of the variables on Cartesian coordinate system determined by the first two PCs (PC1 and PC2). The wines were separated relatively clearly according to variety along the direction of PC1, with wines of each variety correlating with the higher concentrations of particular volatiles already found characteristic for them by one–way ANOVA (Table 2 and Table 3). PCA revealed that Plavac mali wines were more homogeneous in terms of the composition of compounds that are possibly more typical for these wines and were grouped very close. On the other hand, Teran wines were further separated in sub-clusters, with a single case positioned relatively near the Plavac mali wines group, revealing a higher degree of intra-varietal heterogeneity. For both varieties local selections of plant material were used in most vineyards. However, among other potential reasons for the observed heterogeneity, a possibility that Teran wines were produced from different clones should not be excluded, although this information was not provided by the producers.
Hierarchical cluster analysis (HCA) is an unsupervised multivariate statistical method in which cases (e.g., wines) are considered as lying in a multidimensional space in which the number of dimensions equals the number of variables (e.g., volatile compounds). Distances between cases are calculated, and cases are grouped into categories based on similar characteristics defined by the variables’ values. HCA was performed on the original dataset (14 cases × 51 variables). Clear clustering of the wines according to variety was obtained, which is shown on a heatmap diagram in Figure 2. The monovarietal wines were related to the volatile compounds previously found as characteristic for a particular variety by ANOVA (Table 2 and Table 3) and PCA (Figure 1). The generated heatmap probably offered the clearest insight into the intra-varietal heterogeneity of the investigated wines, especially considering that the selected compounds were those for which statistical differences were found. Again, a single Teran wine sample was found similar to the Plavac mali cluster.
Partial least squares–discriminant analysis (PLS-DA) is a supervised multivariate statistical method used for classification purposes. It minimizes the variance within and maximizes the variance between different categories (e.g., varieties). It gives information about the most useful variables in the form of variable importance in projection (VIP) scores. The differentiation according to variety achieved by PLS-DA was very successful (Figure 3a). Fifteen volatile compounds with the highest VIP scores are listed in Figure 3b. As expected, the highest VIP scores were attributed to the volatile compounds characterized by the highest F-ratio values in one-way ANOVA, primarily theaspirane I, ethyl 3-(methylsulfanyl)propanoate, theaspirane II, ethyl methyhexanoate, and ho-trienol which were more abundant in Teran, and tridecane and 2,3-butanediol which occurred in higher concentration in Plavac mali wines. Predictive ability of the PLS-DA model was calculated via 10-fold cross-validation. A relatively high Q2 value close to R2 was obtained, suggesting that the predictive ability was very good (Figure S3).
The compounds found to be the most useful for varietal differentiation in this study in the most part did not match those highlighted in previous reports. Diethyl succinate, 2,3-butanediol, nerol, 3-penten-2-one, diethyl malonate, β-santalol, ethyl 9-decenoate, alcohol-C9, 4-carene, tetrahydro-2(2H)-pyranone, dihydro-2(3H)-thiophenone, and α-methyl-γ-crotonolactone were the major differentiators between Chardonnay, Sauvignon Blanc, Pinot Noir, Merlot, and Cabernet Sauvignon wines based on GC×GC-TOF-MS results [28]. Ethyl hexanoate, ethyl octanoate, 1-hexanol, benzyl alcohol, and isoamyl acetate differentiated well Syrah, Malbec, and Bonarda red wines [13], whereas in another study, Cabernet Sauvignon and Merlot wines were successfully discriminated based on the levels of 1-hexanol, ethyl decanoate, and 2-phenylethanol [16]. Such different outcomes of the various studies that had a similar goal indicate the complexity of the interaction of the effects of many different factors, from the varietal and geographical origin inextricably linked to local pedoclimatic conditions, across grape growing conditions, to the parameters applied in wine production and finishing.

4. Conclusions

The investigated non-aromatic Croatian Plavac mali and Teran monovarietal red wines both showed a large degree of intra-varietal heterogeneity in composition, probably resulting from the large diversity in pedoclimatic conditions on different microlocations at which grapes used for production were cultivated, as well as from the variable grape growing and winemaking parameters applied by different producers. As a result, significant differences between the average concentrations were found for a relatively small number of volatile aroma compounds. It can be said that, on the average, the two monovarietal wines are similar in that their volatilomes and probably the resulting sensory properties are dominated by the same compounds, mostly volatile ethyl and acetate esters, followed by fatty acids and alcohols, with a contribution of β-damascenone. Traditional standard GC-MS was confirmed to be useful for determination of such a basic volatile profile. GC×GC-TOF-MS, on the other hand, allowed the identification and semi-quantification of a rather large number of minor and trace volatiles, among which many exhibited a certain discrimination potential. Such an outcome can be considered even more successful knowing that the number of wine samples of each variety was relatively small, and that the investigated sample sets were characterized by the mentioned high intra-varietal heterogeneity. The results of this study once again showed that the approach that combines traditional GC-MS for determination of medium and major volatile compounds and comprehensive GC×GC-TOF-MS for detecting minor and trace volatiles may provide a large amount of information useful in managing wine production, quality, typicity, marketing, and protection from forgery.

Supplementary Materials

The following supporting information can be downloaded at: https://www.mdpi.com/article/10.3390/agronomy12102512/s1, Figure S1: Example of a total ion current chromatogram obtained for a Teran monovarietal red wine using HS-SPME/GC-MS. The chromatographic peaks of the identified volatile compounds are numbered from 1 to 40 and correspond to those in Table 2; Figure S2: Example of a contour plot obtained for a monovarietal red wine using HS-SPME/GC×GC-TOF-MS. Colored areas represent more abundant volatile aroma compounds and black dots represent less abundant and trace volatile aroma compounds; Figure S3: Evaluation of the PLS-DA model by a 10-fold cross-validation. Blue bars indicate the accuracy of the model, pink bars (R2) indicate the goodness of fit (explained variation), and light-blue bars (Q2) indicate the goodness of prediction. Good predictions with a high Q2 value are marked by *; Table S1: Climate parameters in the Istria and Dalmatia regions of Croatia in 2015; Table S2: Odor perception thresholds (OPT, μg/L), odor descriptors, and average odor activity values (OAV = concentration/OPT) of the main odorants among volatile aroma compounds found in Plavac mali and Teran monovarietal red wines after headspace solid-phase microextraction followed by gas chromatography-mass spectrometry (HS-SPME-GC-MS), sorted by compound class and descending Fisher F-ratio (as reported in Table 2).

Author Contributions

Conceptualization, I.L.; methodology, I.L., U.V.; validation, I.L., S.C.; formal analysis, I.L., S.C.; investigation, I.L., S.C.; resources, I.L., U.V.; data curation, I.L., S.C., U.V.; writing—original draft preparation, I.L.; writing—review and editing, I.L., U.V.; visualization, I.L.; supervision, I.L., U.V.; project administration, I.L., U.V.; funding acquisition, I.L., U.V. All authors have read and agreed to the published version of the manuscript.

Funding

This research was funded by Croatian Science Foundation grant number UIP-2014-09-1194 and by the ADP 2017 project funded by the Autonomous Province of Trento.

Data Availability Statement

All data generated or analyzed during this study are included in this published article.

Acknowledgments

The authors would like to thank wine producers from Croatia for donating wine samples, Irena Budić-Leto and Sanja Radeka for assistance in collecting and selection of wine samples, and Ivana Horvat for technical assistance.

Conflicts of Interest

The authors declare no conflict of interest. The funders had no role in the design of the study; in the collection, analyses, or interpretation of data; in the writing of the manuscript; or in the decision to publish the results.

References

  1. International Organisation of Vine and Wine (OIV) State of the World Vitivinicultural Sector in 2020. Available online: https://www.oiv.int/public/medias/7909/oiv-state-of-the-world-vitivinicultural-sector-in-2020.pdf (accessed on 23 August 2022).
  2. Valls Fonayet, J.; Loupit, G.; Richard, T. MS- and NMR-metabolomic tools for the discrimination of wines: Applications for authenticity. In Advances in Botanical Research: Plant Metabolomics in Full Swing, 1st ed.; Petriacq, P., Bouchereau, A., Eds.; Academic Press: San Diego, CA, USA, 2021; Volume 98, pp. 297–357. [Google Scholar]
  3. Cadot, Y.; Caillé, S.; Samson, A.; Barbeau, G.; Cheynier, V. Sensory representation of typicality of Cabernet franc wines related to phenolic composition: Impact of ripening stage and maceration time. Anal. Chim. Acta 2012, 732, 91–99. [Google Scholar] [CrossRef] [PubMed]
  4. Le Fur, Y.; Jaffre, J.; Valentin, D. Sensory space of typical Chardonnay wines and its relation to volatile composition. In Proceedings of the 8th Pangborn Sensory Science Symposium, Florence, Italy, 26–30 July 2009; p. 23. [Google Scholar]
  5. Lukić, I.; Carlin, S.; Vrhovsek, U. Comprehensive 2D Gas Chromatography with TOF-MS Detection Confirms the Matchless Discriminatory Power of Monoterpenes and Provides In-Depth Volatile Profile Information for Highly Efficient White Wine Varietal Differentiation. Foods 2020, 9, 1787. [Google Scholar] [CrossRef] [PubMed]
  6. Parr, W.V.; Green, J.A.; White, K.G.; Sherlock, R.R. The distinctive flavor of New Zealand Sauvignon blanc: Sensory characterization by wine professionals. Food Qual. Prefer. 2007, 18, 849–861. [Google Scholar] [CrossRef]
  7. Schüttler, A.; Friedel, M.; Jung, R.; Rauhut, D.; Darriet, P. Characterizing aromatic typicality of Riesling wines: Merging volatile compositional and sensory aspects. Food Res. Int. 2015, 69, 26–37. [Google Scholar] [CrossRef]
  8. Holmberg, L. Wine fraud. Int. J. Wine Res. 2010, 2, 105–113. [Google Scholar] [CrossRef] [Green Version]
  9. Stupak, M.; Goodall, I.; Tomaniova, M.; Pulkrabova, J.; Hajslova, J. A novel approach to assess the quality and authenticity of Scotch whisky based on gas chromatography coupled to high resolution mass spectrometry. Anal. Chim. Acta 2018, 1042, 60–70. [Google Scholar] [CrossRef]
  10. Villano, C.; Lisanti, M.T.; Gambuti, A.; Vecchio, R.; Moio, L.; Frusciante, L.; Aversano, R.; Carputo, D. Wine varietal authentication based on phenolics, volatiles and DNA markers: State of the art, perspectives and drawbacks. Food Control 2017, 80, 1–10. [Google Scholar] [CrossRef]
  11. Ribérau-Gayon, P.; Glories, Y.; Maujean, A.; Dubourdieu, D. Handbook of Enology: The Chemistry of Wine—Stabilization and Treatments, 1st ed.; John Wiley & Sons Ltd.: Chichester, UK, 2000; Volume 2. [Google Scholar]
  12. Del Barrio-Galán, R.; del Valle-Herrero, H.; Bueno-Herrera, M.; López-de-la-Cuesta, P.; Pérez-Magariño, S. Volatile and Non-Volatile Characterization of White and Rosé Wines from Different Spanish Protected Designations of Origin. Beverages 2021, 7, 49. [Google Scholar] [CrossRef]
  13. Fabani, M.P.; Ravera, M.J.A.; Wunderlin, D.A. Markers of typical red wine varieties from the Valley of Tulum (San Juan-Argentina) based on VOCs profile and chemometrics. Food Chem. 2013, 141, 1055–1062. [Google Scholar] [CrossRef]
  14. Gómez García-Carpintero, E.; Sánchez-Palomo, E.; Gómez Gallego, M.A.; González-Viñas, M.A. Free and bound volatile compounds as markers of aromatic typicalness of Moravia Dulce, Rojal and Tortosí red wines. Food Chem. 2012, 131, 90–98. [Google Scholar] [CrossRef]
  15. Valentin, L.; Barroso, L.P.; Barbosa, R.M.; de Paulo, G.A.; Castro, I.A. Chemical typicality of South American red wines classified according to their volatile and phenolic compounds using multivariate analysis. Food Chem. 2020, 302, 125340. [Google Scholar] [CrossRef]
  16. Ziółkowska, A.; Wąsowicz, E.; Jeleń, H.H. Differentiation of wines according to grape variety and geographical origin based on volatiles profiling using SPME-MS and SPME-GC/MS methods. Food Chem. 2016, 213, 714–720. [Google Scholar] [CrossRef]
  17. Purcaro, G.; Cordero, C.; Liberto, E.; Bicchi, C.; Conte, L.S. Toward a definition of blueprint of virgin olive oil by comprehensive two-dimensional gas chromatography. J. Chromatogr. A 2014, 1334, 101–111. [Google Scholar] [CrossRef]
  18. Tranchida, P.Q.; Donato, P.; Cacciola, F.; Beccaria, M.; Dugo, P.; Mondello, L. Potential of comprehensive chromatography in food analysis. Trends Anal. Chem. 2013, 52, 186–205. [Google Scholar] [CrossRef]
  19. Barbará, J.A.; Primieri Nicolli, K.; Souza-Silva, É.A.; Telles Biasoto, A.C.; Welke, J.E.; Alcaraz Zini, C. Volatile profile and aroma potential of tropical Syrah wines elaborated in different maturation and maceration times using comprehensive two-dimensional gas chromatography and olfactometry. Food Chem. 2020, 308, 125552. [Google Scholar] [CrossRef]
  20. Carlin, S.; Vrhovsek, U.; Lonardi, A.; Landi, L.; Mattivi, F. Aromatic complexity in Verdicchio wines: A case study. OENO One 2019, 53, 597–610. [Google Scholar] [CrossRef]
  21. Šuklje, K.; Carlin, S.; Antalick, G.; Blackman, J.W.; Deloire, A.; Vrhovsek, U.; Schmidtke, L.M. Regional Discrimination of Australian Shiraz Wine Volatome by Two-Dimensional Gas Chromatography Coupled to Time-of-Flight Mass Spectrometry. J. Agric. Food Chem. 2019, 67, 10273–10284. [Google Scholar] [CrossRef]
  22. Šuklje, K.; Carlin, S.; Stanstrup, J.; Antalick, G.; Blackman, J.W.; Meeks, C.; Deloire, A.; Schmidtke, L.M.; Vrhovsek, U. Unravelling wine volatile evolution during shiraz grape ripening by untargeted HS-SPME-GC×GC-TOFMS. Food Chem. 2019, 277, 753–765. [Google Scholar] [CrossRef]
  23. Robinson, A.L.; Boss, P.K.; Heymann, H.; Solomon, P.S.; Trengove, R.D. Influence of Yeast Strain, Canopy Management, and Site on the Volatile Composition and Sensory Attributes of Cabernet Sauvignon Wines from Western Australia. J. Agric. Food Chem. 2011, 59, 3273–3284. [Google Scholar] [CrossRef]
  24. Ryan, D.; Watkins, P.; Smith, J.; Allen, M.; Marriott, P. Analysis of methoxypyrazines in wine using headspace solid phase microextraction with isotope dilution and comprehensive two-dimensional gas chromatography. J. Sep. Sci. 2005, 28, 1075–1082. [Google Scholar] [CrossRef]
  25. Weldegergis, B.T.; de Villiers, A.; McNeish, C.; Seethapathy, S.; Mostafa, A.; Górecki, T.; Crouch, A.M. Characterisation of volatile components of Pinotage wines using comprehensive two-dimensional gas chromatography coupled to time-of-flight mass spectrometry (GC × GC–TOFMS). Food Chem. 2011, 129, 188–199. [Google Scholar] [CrossRef]
  26. Welke, J.E.; Zanus, M.; Lazzarotto, M.; Alcaraz Zini, C. Quantitative analysis of headspace volatile compounds using comprehensive two-dimensional gas chromatography and their contribution to the aroma of Chardonnay wine. Food Res. Int. 2014, 59, 85–99. [Google Scholar] [CrossRef] [Green Version]
  27. Welke, J.E.; Manfroi, V.; Zanus, M.; Lazarotto, M.; Alcaraz Zini, C. Characterization of the volatile profile of Brazilian Merlot wines through comprehensive two-dimensional gas chromatography time-of-flight mass spectrometric detection. J. Chromatogr. A 2012, 1226, 124–139. [Google Scholar] [CrossRef] [Green Version]
  28. Welke, J.E.; Manfroi, V.; Zanus, M.; Lazzarotto, M.; Alcaraz Zini, C. Differentiation of wines according to grape variety using multivariate analysis of comprehensive two-dimensional gas chromatography with time-of-flight mass spectrometric detection dana. Food Chem. 2013, 141, 3897–3905. [Google Scholar] [CrossRef] [Green Version]
  29. Bubola, M.; Lukić, I.; Radeka, S.; Sivilotti, P.; Grozić, K.; Vanzo, A.; Bavčar, D.; Lisjak, K. Enhancement of Istrian Malvasia wine aroma and hydroxycinnamate composition by hand and mechanical leaf removal. J. Food Sci. Agric. 2019, 99, 904–914. [Google Scholar] [CrossRef]
  30. Beckner Whitener, M.E.; Stanstrup, J.; Panzeri, V.; Carlin, S.; Divol, B.; Toit, M.; Vrhovsek, U. Untangling the wine metabolome by combining untargeted SPME–GCxGC-TOF-MS and sensory analysis to profile Sauvignon blanc co-fermented with seven different yeasts. Metabolomics 2016, 12, 53. [Google Scholar] [CrossRef]
  31. Carlin, S.; Vrhovsek, U.; Franceschi, P.; Lotti, C.; Bontempo, L.; Camin, F.; Toubiana, D.; Zottele, F.; Toller, G.; Fait, A.; et al. Regional features of northern Italian sparkling wines, identified using solid-phase microextraction and comprehensive two-dimensional gas chromatography coupled with time-of-flight mass spectrometry. Food Chem. 2016, 208, 68–80. [Google Scholar] [CrossRef]
  32. Xia, J.; Sinelnikov, I.; Han, B.; Wishart, D.S. MetaboAnalyst 3.0—Making metabolomics more meaningful. Nucleic Acids Res. 2015, 43, 251–257. [Google Scholar] [CrossRef] [Green Version]
  33. Lukić, I.; Radeka, S.; Budić-Leto, I.; Bubola, M.; Vrhovsek, U. Targeted UPLC-QqQ-MS/MS profiling of phenolic compounds for differentiation of monovarietal wines and corroboration of particular varietal typicity concepts. Food Chem. 2019, 300, 125251. [Google Scholar] [CrossRef]
  34. Guth, H. Quantitation and sensory studies of character impact odorants of different white wine varieties. J. Agric. Food Chem. 1997, 45, 3027–3032. [Google Scholar] [CrossRef]
  35. Zalacain, A.; Marín, J.; Alonso, G.L.; Salinas, M.R. Analysis of wine primary aroma compounds by stir bar sorptive extraction. Talanta 2007, 71, 1610–1615. [Google Scholar] [CrossRef] [PubMed]
  36. Marais, J.; van Wyk, C.J.; Rapp, A. Effect of sunlight and shade on norisoprenoids levels in maturing Weisser Riesling and Chenin blanc grapes and Weisser Riesling wines. S. Afr. J. Enol. Vitic. 1992, 13, 23–32. [Google Scholar] [CrossRef]
  37. Mendes-Pinto, M.M. Carotenoid breakdown products—The norisoprenoids—In wine aroma. Arch. Biochem. Biophys. 2009, 483, 236–245. [Google Scholar] [CrossRef] [PubMed]
  38. Kotseridis, Y.; Baumes, R.L.; Bertrand, A.; Skouroumounis, G.K. Quantitative Determination of β-Ionone in Red Wines and Grapes of Bordeaux Using a Stable Isotope Dilution Assay. J. Chromatogr. A 1999, 848, 317–325. [Google Scholar] [CrossRef]
  39. Pineau, B.; Barbe, J.-C.; Van Leeuwen, C.; Dubourdieu, D. Which impact for β-damascenone on red wines aroma? J. Agric. Food Chem. 2007, 55, 4103–4108. [Google Scholar] [CrossRef]
  40. Oliveira, J.M.; Faria, M.; Sá, F.; Barros, F.; Araújo, I.M. C6-alcohols as varietal markers for assessment of wine origin. Anal. Chim. Acta 2006, 563, 300–309. [Google Scholar] [CrossRef] [Green Version]
  41. Martínez-Pinilla, O.; Guadalupe, Z.; Ayestarán, B.; Pérez-Magariño, S.; Ortega-Heras, M. Characterization of volatile compounds and olfactory profile of red minority varietal wines from La Rioja. J. Sci. Food Agric. 2013, 93, 3720–3729. [Google Scholar] [CrossRef] [Green Version]
  42. Ferreira, V.; López, R.; Cacho, J.F. Quantitative determination of the odorants of young red wines from different grape varieties. J. Sci. Food Agric. 2000, 80, 1659–1667. [Google Scholar] [CrossRef]
  43. Perestrelo, R.; Fernandes, A.; Albuquerque, F.F.; Marques, J.C.; Câmara, J.S. Analytical characterization of the aroma of Tinta Negra Mole red wine: Identification of the main odorants compounds. Anal. Chim. Acta 2006, 563, 154–164. [Google Scholar] [CrossRef] [Green Version]
  44. Moreno, J.A.; Zea, L.; Moyano, L.; Medina, M. Aroma compounds as markers of the changes in sherry wines subjected to biological ageing. Food Control 2005, 16, 333–338. [Google Scholar] [CrossRef]
  45. Stilo, F.; Del Pilar Segura Borrego, M.; Bicchi, C.; Battaglino, S.; Callejón Fernadez, R.M.; Morales, M.L.; Reichenbach, S.E.; McCurry, J.; Peroni, D.; Cordero, C. Delineating the extra-virgin olive oil aroma blueprint by multiple headspace solid phase microextraction and differential-flow modulated comprehensive two-dimensional gas chromatography. J. Chromatogr. A 2021, 1650, 462232. [Google Scholar] [CrossRef]
  46. Belancic, A.; Agosin, E.; Ibacache, A.; Bordeu, E.; Baumes, R.; Razungles, A.; Bayonove, C. Influence of sun exposure on the aromatic composition of chilean Muscat grape cultivars Moscatel de Alejandria and Moscatel rosada. Am. J. Enol. Vitic. 1997, 48, 181–186. [Google Scholar]
  47. Rienth, M.; Torregrosa, L.; Luchaire, N.; Chatbanyong, R.; Lecourieux, D.; Kelly, M.T.; Romieu, C. Day and night heat stress trigger different transcriptomic responses in green and ripening grapevine (Vitis vinifera) fruit. BMC Plant Biol. 2014, 14, 108. [Google Scholar] [CrossRef] [Green Version]
  48. Boselli, M.; Bahouaoui, M.A.; Lachhab, N.; Sanzani, S.M.; Ferrara, G.; Ippolito, A. Protein hydrolysates effects on grapevine (Vitis vinifera L., cv. Corvina) performance and water stress tolerance. Sci. Hortic. 2019, 258, 108784. [Google Scholar] [CrossRef]
  49. Torres, R.; Ferrara, G.; Soto, F.; López, J.A.; Sanchez, F.; Mazzeo, A.; Pérez-Pastor, A.; Domingo, R. Effects of soil and climate in a table grape vineyard with cover crops. Irrigation management using sensors networks. Ciênc. Téc. Vitiviníc. 2017, 32, 72–81. [Google Scholar] [CrossRef] [Green Version]
  50. Bedbabis, S.; Ben Rouina, B.; Boukhris, M.; Ferrara, G. Effects of irrigation with treated wastewater on root and fruit mineral elements of Chemlali olive cultivar. Sci. World J. 2014, 2014, 973638. [Google Scholar] [CrossRef]
  51. Black, C.A.; Parker, M.; Siebert, T.E.; Capone, D.L.; Francis, I.L. Terpenoids and their role in wine flavour: Recent advances. Aust. J. Grape Wine Res. 2015, 21, 582–600. [Google Scholar] [CrossRef]
  52. Bowen, A.J.; Reynolds, A.G. Odor potency of aroma compounds in Riesling and Vidal blanc table wines and icewines by gas chromatography-olfactometry mass spectrometry. J. Agric. Food Chem. 2012, 60, 2874–2883. [Google Scholar] [CrossRef]
  53. Pietra Torres, M.; Cabrita, M.; Gomes Da Silva, M.; Palma, V.; Costa Freitas, A. The impact of malolactic fermentation on the volatile composition of the Trincadeira wine variety. J. Food Biochem. 2011, 35, 898–913. [Google Scholar] [CrossRef]
  54. Louw, L.; Tredoux, A.G.J.; Van Rensburg, P.; Kidd, M.; Naes, T.; Nieuwoudt, H.H. Fermentation derived aroma compounds in varietal young wines from South Africa. S. Afr. J. Enol. Vitic. 2010, 31, 213–225. [Google Scholar] [CrossRef] [Green Version]
  55. Verstrepen, K.J.; Van Laere, S.D.M.; Vanderhaegen, B.M.P.; Derdelinckx, G.; Dufour, J.-P.; Pretorius, I.S.; Winderickx, J.; Thevelein, J.M.; Delvaux, F.R. Expression levels of the yeast alcohol acetyltransferase genes ATF1, Lg-ATF1, and ATF2 control the formation of a broad range of volatile esters. Appl. Environ. Microbiol. J. 2003, 69, 5228–5237. [Google Scholar] [CrossRef] [PubMed]
  56. Câmara, J.S.; Alves, M.A.; Marques, J.C. Changes in volatile composition of Madeira wines during their oxidative ageing. Anal. Chim. Acta 2006, 563, 188–197. [Google Scholar] [CrossRef] [Green Version]
  57. Jimenez-Lorenzo, R.; Bloem, A.; Farines, V.; Sablayrolles, J.-M.; Camarasa, C. How to modulate the formation of negative volatile sulfur compounds during wine fermentation? FEMS Yeast Res. 2021, 21, foab038. [Google Scholar] [CrossRef] [PubMed]
  58. Smith, M.E.; Bekker, M.Z.; Smith, P.A.; Wilkes, E.N. Sources of volatile sulfur compounds in wine. Aust. J. Grape Wine Res. 2015, 21, 705–712. [Google Scholar] [CrossRef]
  59. Moreira, N.; Guedes de Pinho, P.; Santos, C.; Vasconcelos, I. Volatile sulphur compounds composition of monovarietal white wines. Food Chem. 2010, 123, 1198–1203. [Google Scholar] [CrossRef]
Figure 1. (a) Separation of Plavac mali and Teran monovarietal red wines based on variety along principal components PC1 and PC2; (b) factor loadings of selected volatile aroma compounds, as determined by gas chromatography−mass spectrometry (GC−MS) and two-dimensional gas chromatography with time−of−flight mass spectrometry (GC×GC−TOF−MS) analysis, on PC1 and PC2. Numbers indicating compounds correspond to those in Table 2 (GC, i.e., GC−MS) or in Table 3 (GCGC, i.e., GC×GC−TOF−MS).
Agronomy 12 02512 g001
Figure 2. Clustering of Plavac mali and Teran monovarietal red wines by hierarchical cluster analysis (HCA) based on the composition of volatile compounds obtained by gas chromatography−mass spectrometry (GC−MS) and two-dimensional gas chromatography with time-of-flight mass spectrometry (GC×GC−TOF−MS) analysis. The rows in the heatmap diagram represent compounds and the columns represent wines. Numbers indicating compounds correspond to those in Table 2 (GC, i.e., GC−MS) or in Table 3 (GCGC, i.e., GC×GC−TOF−MS). Colors of the heatmap cells indicate low (dark blue), medium (white), and high (dark red) abundance of a particular compound.
Agronomy 12 02512 g002
Figure 3. (a) Differentiation of Plavac mali and Teran monovarietal red wines according to variety in two-dimensional space by partial least squares−discriminant analysis (PLS−DA); (b) variable importance in projection (VIP) scores of the variables (volatile compounds) most useful for the differentiation.
Agronomy 12 02512 g003
Table 1. Physico-chemical parameters in Plavac mali and Teran monovarietal red wines.
Physico-Chemical ParameterVariety
PMTE
Specific gravity 20 °C/20 °C0.9944 ± 0.00160.9950 ± 0.0010
Alcoholic strength (vol. %)14.2 ± 0.5 a13.0 ± 0.9 b
Total acidity (as mg/L tartaric acid)5.3 ± 0.36.7 ± 1.8
Volatile acidity (as mg/L acetic acid)0.27 ± 0.080.35 ± 0.09
Total dry extract without reducing sugars (g/L)29.9 ± 3.729.0 ± 3.8
pH3.63 ± 0.123.44 ± 0.28
Varieties: PM—Plavac mali, TE—Teran. Different superscript lowercase letters in a row represent statistically significant differences between mean values at p < 0.05 obtained by one-way ANOVA and Fisher’s least significant difference (LSD) test.
Table 2. Concentrations (μg/L) of volatile aroma compounds found in Plavac mali and Teran monovarietal red wines after headspace solid-phase microextraction followed by gas chromatography-mass spectrometry (HS-SPME-GC-MS) sorted by compound class and descending Fisher F-ratio.
No.Volatile CompoundstRIDLRIexpLRIlitF-RatioVariety
(min:sec) PMTE
Terpenes
1Limonene15:39MS, LRI119111967.000.43 ± 0.18 a0.26 ± 0.02 b
2Linalool33:08S, MS, LRI154215423.938.40 ± 3.8411.98 ± 2.85
34-Terpineol35:37MS, LRI159415961.620.85 ± 0.672.05 ± 2.41
4β-Pinene14:06MS, LRI114611451.370.54 ± 0.250.41 ± 0.16
5trans-Nerolidol54:34MS, LRI203120310.582.86 ± 2.302.14 ± 0.99
6Geraniol46:35S, MS, LRI183818380.4812.3 ± 6.618.3 ± 9.1
7Geranyl acetone46:59MS, LRI184518450.433.20 ± 1.293.87 ± 2.36
8Citronellol43:10S, MS, LRI175817580.379.81 ± 1.5710.51 ± 2.63
9α-Terpineol39:58S, MS, LRI168416840.183.02 ± 0.564.37 ± 1.49
C13-Norisoprenoids
10Vitispirane I32:10MS, LRI152115262.760.46 ± 0.160.28 ± 0.25
11β-Ionone50:15S, MS, LRI192319232.270.12 ± 0.050.16 ± 0.05
12β-Damascenone45:25MS, LRI180918091.301.05 ± 0.390.84 ± 0.30
13Actinidol ethyl ether II41:47MS, LRI172317230.640.12 ± 0.070.20 ± 0.25
14Actinidol ethyl ether I40:24MS, LRI169016900.600.21 ± 0.120.34 ± 0.42
15Vitispirane II32:18MS, LRI152315290.330.19 ± 0.090.23 ± 0.16
16Actinidol I49:53MS, LRI191419140.090.10 ± 0.040.11 ± 0.10
17Actinidol II50:25MS, LRI192719270.020.18 ± 0.070.19 ± 0.16
Alcohols
18trans-3-Hexen-1-ol23:57S, MS, LRI136113610.3655.0 ± 25.247.3 ± 22.4
191-Hexanol23:29S, MS, LRI135613570.191385 ± 4411466 ± 228
20cis-3-Hexen-1-ol24:57S, MS, LRI137913790.0372.4 ± 25.680.9 ± 20.1
212-Phenylethanol48:55S, MS, LRI189118930.0041,647 ± 12,06941,712 ± 7813
Acids
22Octanoic Acid54:51S, MS, LRI204320423.701356 ± 2831086 ± 240
23Decanoic Acid62:47S, MS, LRI225722582.65199.1 ± 73.6144.3 ± 50.1
24Butyric acid36:25S, MS, LRI161216121.98934 ± 1091078 ± 248
25Hexanoic acid46:08S, MS, LRI183018280.001588 ± 3771597 ± 321
Esters
26Isoamyl lactate II34:04MS, LRI156215704.968.59 ± 4.40 b16.01 ± 7.63 a
27Isoamyl lactate I33:57MS, LRI156115703.881.52 ± 1.083.05 ± 1.74
282-Phenethyl acetate45:02S, MS, LRI180318013.381369 ± 556912 ± 351
29Isoamyl acetate12:29S, MS, LRI112011222.03879 ± 286659 ± 291
30Ethyl decanoate37:43S, MS, LRI163716381.9755.0 ± 23.540.9 ± 12.4
31Ethyl butyrate09:24S, MS, LRI103010301.75236.0 ± 58.2197.1 ± 51.9
32Hexyl acetate19:30S, MS, LRI127212721.3126.26 ± 33.6711.14 ± 9.40
33Ethyl-3-methylbutyrate10:28S, MS, LRI106510651.2017.29 ± 5.7223.57 ± 8.60
34Ethyl octanoate27:48S, MS, LRI143514351.10153.7 ± 141.596.5 ± 28.1
35Ethyl hexanoate17:38S, MS, LRI123612360.99284.0 ± 313.1165.1 ± 50.6
36Diethyl succinate39:06S, MS, LRI166716690.283375 ± 20944069 ± 2750
37Ethyl 2-methylbutyrate09:57S, MS, LRI104910490.2811.15 ± 4.0615.83 ± 7.39
38Ethyl lactate22:48S, MS, LRI134113410.1777,793 ± 27,76071,695 ± 28,375
Benzenoids and phenols
39Ethyl cinnamate57:31S, MS, LRI2111212211.320.36 ± 0.16 a0.14 ± 0.04 b
40Eugenol58:45S, MS, LRI214821461.120.79 ± 0.721.09 ± 0.25
ID–type of identification: S–comparison with retention time and mass spectrum of pure standards and with NIST05 mass spectra electronic library; LRI—comparison with linear retention index from literature; MS—comparison with mass spectra from the NIST05 library or the literature. Only MS symbol in the ID column = tentative identification. Compounds without symbol S were semi-quantified as equivalents of similar compounds with response factor = 1. LRIexp—experimentally determined linear retention index. LRIlit—linear retention index from the literature. Varieties: PM—Plavac mali, TE—Teran. Statistically significant differences between mean values at p < 0.05, obtained by one-way ANOVA and least significant difference (LSD) test, are marked by different superscript lowercase letters in a row.
Table 3. Concentrations (μg/L) * of volatile aroma compounds found in Plavac mali and Teran monovarietal red wines after headspace solid-phase microextraction followed by gas chromatography–mass spectrometry (HS-SPME-GC-MS) sorted by compound class and descending Fisher F-ratio.
No.Volatile CompoundstR (1D)tR (2D)IDLRIexpLRIlitF-RatioVariety
(min:sec)(min:sec) PMTE
Terpenes
1Ho-trienol17:07.000:01.0MS, LRI1607161217.130.07 ± 0.18 b1.12 ± 0.65 a
210,11-Epoxycalamenene22:14.300:01.7MS, LRI1893190012.110.04 ± 0.06 b0.86 ± 0.62 a
3Linalool15:50.000:01.1S, MS, LRI1541154110.7227.1 ± 11.2 b47.3 ± 11.9 a
4Dihydro-γ-terpineol17:42.000:01.1MS, LRI1644165010.421.43 ± 0.34 b1.95 ± 0.25 a
5cis-Ocimene09:22.700:01.6MS, LRI125312559.990.62 ± 0.90 b3.22 ± 1.98 a
6Pinocarvone16:15.700:01.5MS, LRI156315618.390.04 ± 0.08 b0.21 ± 0.14 a
7α-Curcumene20:16.000:01.8MS, LRI178717827.970.11 ± 0.07 b0.23 ± 0.08 a
8Cadalene27:48.000:01.5MS, LRI>210022567.560.27 ± 0.20 b0.68 ± 0.34 a
9α-Farnesene19:48.000:01.9S, MS, LRI176317625.970.18 ± 0.18 b0.40 ± 0.17 a
10α-Terpineol18:48.000:01.2S, MS, LRI171117095.726.32 ± 2.43 b11.14 ± 4.75 a
11Geranyl ethyl ether15:08.000:01.8MS, LRI150615065.641.37 ± 0.76 b3.69 ± 2.47 a
12o-Cymene09:48.500:01.6S, MS, LRI127212685.551.94 ± 0.74 b5.11 ± 3.48 a
13Linalool ethyl ether11:02.000:01.9MS, LRI132913315.453.71 ± 1.79 b6.95 ± 3.20 a
14trans-Alloocimene12:12.500:01.6MS, LRI138413885.270.29 ± 0.16 b0.63 ± 0.36 a
15β-Cyclocitral17:21.000:01.5S, MS, LRI162216294.361.19 ± 0.511.68 ± 0.34
16p-Cymenene13:37.000:01.4MS, LRI144314383.7611.52 ± 2.6916.06 ± 5.58
17Nerolidol25:03.000:01.3S, MS, LRI204020393.260.71 ± 0.821.45 ± 0.71
18β-Myrcene07:17.400:01.6MS, LRI115811622.611.14 ± 1.042.10 ± 1.18
194-Terpineol17:00.000:01.3S, MS, LRI160016062.528.42 ± 5.5824.75 ± 26.66
20γ-Isogeraniol20:30.000:01.0MS, LRI179918002.431.43 ± 0.982.22 ± 0.92
21Geraniol21:33.000:01.0S, MS, LRI185618571.883.99 ± 2.736.33 ± 3.59
22trans-Menthone14:05.500:01.6MS, LRI146314641.301.01 ± 0.341.34 ± 0.68
231-Terpineol16:25.000:01.2MS, LRI157115651.190.61 ± 0.510.32 ± 0.46
24o-Cymenene13:16.000:01.5MS1429na1.100.87 ± 0.250.98 ± 0.15
25Citronellol20:01.500:01.1S, MS, LRI177517770.6714.94 ± 3.1318.34 ± 10.51
26Cuparene enantiomer21:05.000:02.0MS, LRI183118300.630.17 ± 0.030.20 ± 0.08
27Sesquiterpene (n.i.)19:41.500:01.1MS, LRI1757na0.350.21 ± 0.120.18 ± 0.09
Norisoprenoids
28Theaspirane I14:54.000:02.1S, MS, LRI1496148237.490.54 ± 0.34 b3.03 ± 1.02 a
29Theaspirane II15:43.000:02.0S, MS, LRI1536152017.700.46 ± 0.35 b2.18 ± 1.02 a
30trans-1-(2,3,6-Trimethylphenyl)buta-1,3-diene (TPB)21:12.000:01.5MS, LRI183718163.880.13 ± 0.100.35 ± 0.28
311,2-Dihydro-1,1,6-trimethylnaphthalene (TDN)19:41.000:01.6S, MS, LRI175717513.090.57 ± 0.241.02 ± 0.64
32cis-β-Damascenone20:01.000:01.6MS, LRI177417911.900.52 ± 0.230.75 ± 0.37
33Actinidol ethyl ether II18:52.000:01.9MS, LRI171417231.730.63 ± 0.512.17 ± 3.06
34α-Isophorone16:46.000:01.3S, MS, LRI158815931.351.60 ± 0.621.99 ± 0.63
35trans-β-Damascenone21:05.000:01.5S, MS, LRI183118381.0120.92 ± 7.8326.33 ± 11.89
36Safranal17:49.000:01.4S, MS, LRI165116480.630.80 ± 0.270.90 ± 0.20
37Vitispirane I15:24.600:02.0MS, LRI152015260.310.22 ± 0.410.12 ± 0.24
38Vitispirane II15:29.000:01.9MS, LRI152415290.2538.2 ± 16.746.6 ± 41.2
Benzenoids
39Ethyl salicylate20:51.000:01.2S, MS, LRI1818182010.750.11 ± 0.12 b0.32 ± 0.11 a
40Estragole18:17.000:01.3MS, LRI168116839.920.12 ± 0.11 b0.26 ± 0.04 a
411-Methoxy-4,4a,5,6,7,8-hexahydro-2(3H)-naphthalenone19:34.000:01.5MS1751na7.939.92 ± 2.69 b14.08 ± 2.84 a
422,3-Dihydrobenzofuran16:46.000:01.2MS1588na6.740.47 ± 0.12 b0.63 ± 0.11 a
434-Ethylbenzaldehyde19:34.500:01.2MS, LRI175117476.460.47 ± 0.13 b0.66 ± 0.15 a
44Benzenemethanol22:01.000:00.9S, MS, LRI188118775.3816.7 ± 10.3 b29.5 ± 10.5 a
45Ethyl benzeneacetate20:30.000:01.2S, MS, LRI179917884.8935.4 ± 13.8 b169.0 ± 159.2 a
463-Ethylbenzaldehyde19:01.000:01.2MS, LRI172217324.850.76 ± 0.10 b0.92 ± 0.17 a
472-Methylbenzaldehyde17:27.500:01.1MS, LRI162916223.480.81 ± 0.311.10 ± 0.26
481,2-Dimethylbenzene07:40.000:05.1MS, LRI117511813.186.48 ± 2.258.52 ± 2.04
49Benzeneethanol22:40.100:01.0S, MS, LRI191618972.970.93 ± 1.300.08 ± 0.12
50trans-Anethole21:12.000:01.3S, MS, LRI183718342.882.32 ± 1.603.79 ± 1.64
51cis-Anethole19:55.000:01.3S, MS, LRI176917592.680.09 ± 0.050.13 ± 0.05
52Benzaldehyde15:22.000:01.1S, MS, LRI151815092.5326.5 ± 11.478.2 ± 85.4
532,3-Dihydro-4-methyl-1H-indene14:54.000:01.6MS, LRI149615062.390.40 ± 0.280.57 ± 0.11
54Ethyl hydroxycinnamate22:15.000:01.3MS, LRI189418972.361.27 ± 0.622.40 ± 1.84
55Methyl salicylate20:16.000:01.2S, MS, LRI178717892.0119.1 ± 11.830.5 ± 17.7
56Ethyl benzoate18:17.000:01.2MS, LRI168116781.5510.11 ± 2.7813.47 ± 6.57
57Benzeneacetaldehyde17:49.000:01.1S, MS, LRI165116481.53139.6 ± 39.1167.8 ± 45.8
58Benzonitrile17:00.500:01.0MS, LRI160115911.530.49 ± 0.180.60 ± 0.17
591,4-Dimethoxybenzene19:34.500:01.2MS, LRI175117521.431.44 ± 0.481.69 ± 0.28
60Azulene19:34.000:01.3MS, LRI175117401.371.99 ± 0.532.26 ± 0.30
61m-Dimethoxybenzene19:48.000:01.2MS, LRI176317610.630.35 ± 0.260.71 ± 1.15
62Benzoic Acid30:48.500:00.8S, MS, LRI>210024330.624.05 ± 1.054.50 ± 1.11
63Butylated hydroxytoluene22:43.000:01.5MS, LRI191919140.203.27 ± 2.232.84 ± 1.25
642-Ethyl-m-xylene12:00.000:01.6MS, LRI137413720.161.32 ± 0.651.21 ± 0.39
65Styrene09:28.500:05.0MS, LRI125712570.1214.14 ± 5.4915.16 ± 5.80
66Ethylbenzene06:26.500:05.1MS, LRI111911160.043.30 ± 5.222.72 ± 5.80
Aldehydes and ketones
673-Ethoxy-2-butanone05:55.000:01.1MS1095na9.5223.3 ± 20.1 b59.0 ± 23.1 a
683,4-Dihydroxy-3-cyclobutene-1,2-dione18:10.000:01.1MS1673na4.890.48 ± 0.12 b0.98 ± 0.59 a
692-Dodecanone18:59.000:01.6MS, LRI172017094.690.47 ± 0.350.81 ± 0.24
702-Octanone10:16.900:01.4S, MS, LRI129412944.3814.51 ± 16.071.76 ± 1.31
713-Hydroxy-4-phenyl-2-butanone29:06.400:01.0MS, LRI>210022594.270.01 ± 0.010.24 ± 0.30
72Acetophenone17:56.000:01.1S, MS, LRI165916604.093.28 ± 0.824.24 ± 0.94
73Decanal14:54.000:01.5S, MS, LRI149614973.904.49 ± 1.216.94 ± 3.05
746-Methyl-5-hepten-2-one11:24.000:01.3S, MS, LRI134613433.045.46 ± 5.311.80 ± 1.62
753-Hydroxybutanone10:08.100:00.8MS, LRI128712872.750.89 ± 0.461.67 ± 1.16
762-Hydroxy-5-methylacetophenone27:25.500:01.0MS, LRI>210021881.811.86 ± 0.941.11 ± 1.15
77p-tert-Butylcyclohexanone17:35.000:01.5MS, LRI163716451.360.4 ± 0.311.82 ± 3.21
78Octanal10:21.000:01.4S, MS, LRI129712971.075.61 ± 3.047.42 ± 3.49
793-Penten-2-one06:39.800:01.0MS, LRI112911330.990.33 ± 0.280.64 ± 0.77
802,3-Pentanedione05:22.700:00.9MS, LRI106710720.915.00 ± 3.607.74 ± 6.69
812-Undecanone16:53.500:01.5MS, LRI159515980.592.62 ± 2.012.02 ± 0.44
82trans-2-Decenal17:50.600:01.4S, MS, LRI165116470.590.19 ± 0.400.35 ± 0.38
832-Heptanone07:48.200:01.3S, MS, LRI118111800.5714.26 ± 14.479.15 ± 10.59
84Undecanal17:06.500:01.5S, MS, LRI160716100.560.42 ± 0.230.52 ± 0.30
852,2,6-Trimethylcyclohexanone10:49.600:01.6MS, LRI131913230.522.80 ± 2.002.12 ± 1.54
86Nonanal12:44.200:01.5S, MS, LRI140814040.45217 ± 178273 ± 129
87Dodecanal19:06.000:01.6S, MS, LRI172717220.040.50 ± 0.390.46 ± 0.19
Alcohols
882,3-Butadienol15:43.000:00.8MS, LRI1536154217.1671.96 ± 9.45 a42.82 ± 16.04 b
894-Octanol12:20.000:01.0MS, LRI1390137611.410.13 ± 0.07 a0.02 ± 0.05 b
901-Octen-3-ol13:51.000:01.0S, MS, LRI145314529.93260.5 ± 79.0 a146.5 ± 54.1 b
914-Hepten-1-ol14:51.000:00.9MS, LRI149314879.2126.09 ± 12.48 a11.41 ± 2.83 b
922-(1-Ethoxyethoxy)-3-methyl-1,4-butanediol15:57.000:01.0MS1547na5.061.08 ± 1.17 b2.49 ± 1.18 a
931-Pentylcyclopentanol13:23.000:01.6MS1434na3.441.01 ± 0.550.53 ± 0.39
941-Penten-3-ol07:27.200:00.8MS, LRI116511623.075.47 ± 4.8413.84 ± 11.67
952-Heptanol10:56.000:01.0S, MS, LRI132413202.4236.0 ± 20.361.2 ± 37.7
963-Octanol12:37.000:01.0MS, LRI140314082.1130.81 ± 18.5419.79 ± 7.71
972-Penten-1-ol10:56.000:00.8MS, LRI132413212.060.96 ± 0.351.54 ± 1.00
983-Ethoxy-1-propanol12:13.000:00.9MS, LRI138413892.001.29 ± 1.424.05 ± 4.95
992-Nonanol15:15.000:01.1S, MS, LRI151215101.969.53 ± 5.1914.87 ± 8.63
1002-Octen-1-ol17:18.000:00.9S, MS, LRI161916171.688.50 ± 3.496.62 ± 1.59
1015-Methyl-2-heptanol12:15.000:00.9MS, LRI138613941.578.70 ± 5.685.50 ± 3.68
1022-Undecanol19:13.000:01.2MS, LRI173317381.450.11 ± 0.080.17 ± 0.11
1034-Methyl-3-penten-2-ol13:02.000:01.7MS1420na1.400.93 ± 0.590.59 ± 0.47
1043-Pentanol06:24.200:00.9MS, LRI111711111.221.02 ± 1.472.88 ± 4.20
1056-Methyl-1-heptanol15:35.400:01.0MS, LRI152915240.960.37 ± 0.310.23 ± 0.21
1061-Decanol20:15.400:01.1S, MS, LRI178717830.834.09 ± 3.772.51 ± 2.63
1073-Methylhexanol12:59.700:00.9MS, LRI141814130.632.65 ± 3.471.50 ± 1.57
1086-Methyl-5-hepten-2-ol14:05.500:01.0S, MS, LRI146314660.481.42 ± 1.331.03 ± 0.63
1092,6-Dimethyl-5-hepten-1-ol17:57.600:01.0MS, LRI166016540.412.54 ± 2.711.75 ± 1.80
110cis-3-Hexen-1-ol12:20.000:00.9S, MS, LRI139013840.3846.90 ± 44.7157.47 ± 8.79
111cis-3-Nonen-1-ol18:32.600:01.0MS, LRI169716930.113.78 ± 5.494.54 ± 2.46
1123-Methylpentanol11:06.000:00.9MS, LRI133213320.0946.7 ± 28.442.7 ± 21.4
113cis-2-Hexen-1-ol13:02.000:00.9S, MS, LRI142014200.067.69 ± 2.527.38 ± 2.41
1141-Hepten-4-ol16:53.500:01.0MS, LRI159515850.050.53 ± 0.150.50 ± 0.31
1154-Methylpentanol10:49.000:00.9MS, LRI131913190.0042.3 ± 23.142.6 ± 18.4
Acids
116Isobutyric acid16:18.000:00.7S, MS, LRI156515613.7863.9 ± 34.493.5 ± 20.9
117trans-2-Hexenoic acid23:39.000:00.8MS, LRI196719673.031.01 ± 0.651.64 ± 0.71
118Pentanoic acid19:01.300:00.7S, MS, LRI172217232.350.51 ± 0.642.02 ± 2.52
119Sorbic acid26:46.700:00.8MS, LRI>210021502.136.36 ± 10.910.33 ± 0.32
120Isohexanoic acid20:44.000:00.8MS, LRI181218131.600.04 ± 0.050.07 ± 0.03
121Butyric acid17:28.000:00.7S, MS, LRI162916260.86104.3 ± 15.8112.2 ± 15.8
122Propanoic acid15:43.000:00.7S, MS, LRI153615400.2915.27 ± 2.7216.09 ± 2.99
123Heptanoic Acid23:23.500:00.8S, MS, LRI195419490.011.89 ± 0.341.87 ± 0.57
124Isovaleric acid18:31.000:00.8S, MS, LRI169516800.00295.8 ± 69.1296.0 ± 117.2
Esters
125Ethyl methylhexanoate10:35.000:01.6MS1308na17.540.24 ± 0.17 b0.59 ± 0.14 a
126Ethyl pentanoate06:44.000:01.4MS, LRI1132113610.748.32 ± 3.39 a3.67 ± 1.61 b
127Isoamyl 2-methyl-2-propenoate07:26.500:01.2MS1165na7.2724.23 ± 8.04 a12.88 ± 7.71 b
128Diethyl oxalate14:33.000:01.1MS, LRI148114967.070.31 ± 0.08 b0.56 ± 0.24 a
129Diethyl fumarate17:56.000:01.2MS, LRI165916606.430.13 ± 0.10 b0.37 ± 0.24 a
130Isoamyl lactate16:18.000:01.0MS, LRI156515705.5921.4 ± 16.4 b49.9 ± 27.4 a
131Butyl ethyl succinate20:37.000:01.3MS, LRI180618205.406.16 ± 4.48 b24.01 ± 19.84 a
132Diethyl malate25:36.600:00.9MS, LRI206920604.971.39 ± 1.76 b10.08 ± 10.15 a
133Isoamyl isobutyrate08:02.400:01.7MS, LRI119211944.811.12 ± 1.13 b3.63 ± 2.81 a
134Isobutyl hexanoate11:45.000:01.8MS, LRI136213574.632.39 ± 1.204.90 ± 2.84
135Ethyl 9-decenoate18:45.000:01.6S, MS, LRI170817074.5118.17 ± 15.455.63 ± 2.39
136Isoamyl hexanoate14:05.000:01.8MS, LRI146214584.295.93 ± 2.7811.55 ± 6.63
137Ethyl 2-hexenoate11:35.500:01.4S, MS, LRI135513573.7221.8 ± 11.340.1 ± 22.4
138Heptyl acetate12:13.500:01.5S, MS, LRI138513853.644.00 ± 2.201.84 ± 2.02
139Ethyl 2-methylbutyrate05:07.000:01.4MS, LRI105310503.6317.0 ± 14.936.1 ± 21.9
140Ethyl methyl succinate17:36.000:01.1MS, LRI163816313.297.29 ± 4.5712.88 ± 6.76
141Isoamyl isoamylate10:25.500:01.8MS, LRI130012943.271.12 ± 0.621.74 ± 0.68
142Ethyl isoamyl succinate22:36.500:01.3MS, LRI191319073.2214.5 ± 11.660.0 ± 66.0
143Ethyl propyl succinate20:02.000:01.2MS, LRI177517673.172.10 ± 1.826.43 ± 6.18
144Amyl formate08:32.000:05.6MS, LRI121411873.1212.45 ± 7.316.86 ± 4.09
145Ethyl 3-methylbutyrate05:27.000:01.3S, MS, LRI107010682.7313.91 ± 7.1421.11 ± 9.06
146Ethyl 3-hydroxybutyrate15:15.600:00.9MS, LRI151315122.597.56 ± 3.793.94 ± 4.60
147Phenylmethyl acetate19:27.000:01.2S, MS, LRI174517472.580.25 ± 0.080.53 ± 0.47
148Diethyl glutarate20:23.000:01.2MS, LRI179317802.510.48 ± 0.691.19 ± 0.95
149Diethyl 2-methylsuccinate17:49.000:01.3MS1651na2.260.17 ± 0.120.29 ± 0.17
150Isoamyl propanoate07:58.500:01.5MS, LRI118911882.238.58 ± 3.9013.29 ± 7.38
151Ethyl 2,4-hexadienoate14:36.200:01.3MS, LRI148315011.770.53 ± 0.770.14 ± 0.12
152Hexyl acetate09:58.000:01.4S, MS, LRI127912771.76164.9 ± 210.958.0 ± 30.4
153Ethyl pyruvate09:46.000:04.8MS, LRI127012671.6883.5 ± 59.849.2 ± 36.4
154Isoamyl butyrate09:45.500:01.6S, MS, LRI127012661.6712.04 ± 6.4216.46 ± 6.37
155Octyl formate16:04.900:01.0MS, LRI155415601.6653.2 ± 27.038.9 ± 11.6
1562-Phenylethyl formate20:30.000:01.1MS, LRI179918061.502.31 ± 0.852.98 ± 1.18
157trans-3-Hexenyl acetate10:42.000:01.3MS, LRI131313161.474.52 ± 7.311.05 ± 1.98
158Ethyl 2-octenoate16:04.000:01.6MS, LRI155315571.430.19 ± 0.070.16 ± 0.02
159Ethyl 4-hydroxybutyrate20:50.000:00.9MS, LRI181718191.2242.0 ± 19.031.2 ± 17.9
160Isobutyl acetate04:30.500:01.1S, MS, LRI102110090.8917.00 ± 8.2922.05 ± 11.48
161Propyl octanoate15:22.000:01.8MS, LRI151815040.880.85 ± 0.921.22 ± 0.51
162cis-3-Hexenyl acetate10:57.000:01.3MS, LRI132513200.6715.77 ± 33.945.23 ± 3.11
163Ethyl heptanoate11:17.000:01.6MS, LRI134113420.6456.0 ± 24.868.8 ± 34.4
164Isoamyl octanoate18:08.000:01.9S, MS, LRI167116710.639.32 ± 3.4110.99 ± 4.40
165Propyl hexanoate10:58.600:01.7MS, LRI132613190.540.27 ± 0.280.44 ± 0.53
166Ethyl hydrogen succinate30:09.000:00.8MS, LRI>210023670.46182 ± 128224 ± 102
167Isobutyl octanoate15:57.500:01.9MS, LRI154815510.450.77 ± 0.690.97 ± 0.38
168Ethyl 6-heptenoate12:27.000:01.4MS1395na0.281.48 ± 0.601.28 ± 0.78
169Isobutyl 2-methyl-2-propenoate11:00.200:00.9MS1327na0.250.60 ± 0.610.76 ± 0.57
170Ethyl trans-3-hexenoate10:37.500:01.4MS, LRI131012950.229.86 ± 8.4711.44 ± 2.73
171Methyl decanoate16:53.000:01.6MS, LRI159415990.203.10 ± 1.552.78 ± 1.09
172Ethyl isobutyrate03:49.000:01.1MS, LRI<10009620.194.29 ± 2.135.63 ± 7.96
173Diethyl malonate16:32.000:01.1MS, LRI157715740.184.37 ± 6.463.32 ± 1.03
174Ethyl propanoate03:42.000:01.1MS, LRI<10009490.0958.2 ± 31.252.0 ± 44.7
175Ethyl trans-4-heptenoate12:15.800:01.5MS, LRI138713820.060.95 ± 0.840.82 ± 1.00
176Methyl hexanoate08:10.300:01.3S, MS, LRI119811840.0311.44 ± 5.6811.99 ± 5.59
177Methyl octanoate12:34.000:01.5MS, LRI140114040.0095.7 ± 73.296.1 ± 47.3
Volatile phenols
1782-Methoxyphenol21:47.000:00.9MS, LRI186918692.423.10 ± 1.532.06 ± 0.89
1794-Methylphenol24:14.000:00.8MS, LRI199820002.190.46 ± 0.120.60 ± 0.22
1804-Ethylguaiacol24:42.000:01.0S, MS, LRI202220241.941.33 ± 1.9913.19 ± 22.42
1814-Ethylphenol26:56.000:00.8MS, LRI>210021611.306.99 ± 8.4323.60 ± 37.59
182Phenol24:14.000:00.8S, MS, LRI199819950.0110.04 ± 1.769.94 ± 3.16
Furanoids and lactones
183Pantolactone24:42.000:00.8MS, LRI202220298.383.01 ± 1.27 b4.95 ± 1.25 a
184γ-Ethoxybutyrolactone19:20.000:01.0MS, LRI173917288.122.57 ± 2.48 b9.09 ± 5.53 a
185γ-Octalactone22:50.000:01.1S, MS, LRI192519238.052.63 ± 1.63 b5.15 ± 1.69 a
186α-Methyl-γ-crotonolactone19:13.600:01.0MS, LRI173317266.870.39 ± 0.12 a0.19 ± 0.16 b
187Ethyl 2-furoate17:21.000:01.1MS, LRI162216213.2222.5 ± 11.348.3 ± 36.4
188γ-Crotonolactone19:57.000:00.9MS, LRI177117872.900.83 ± 0.040.97 ± 0.22
189δ-Hexalactone20:37.000:01.1MS, LRI180618161.751.79 ± 0.912.28 ± 0.34
190Furfural14:12.000:00.9S, MS, LRI146714690.9226.8 ± 12.119.9 ± 14.6
1912-Furanmethanol18:04.400:00.8MS, LRI166816710.356.96 ± 15.563.36 ± 4.09
192γ-Pentalactone17:07.000:01.0MS, LRI160716050.310.58 ± 0.360.68 ± 0.31
193γ-Nonalactone25:07.100:01.1S, MS, LRI204420570.056.60 ± 7.345.93 ± 1.80
194γ-Butyrolactone17:28.000:01.0MS, LRI162916260.02102.6 ± 33.3100.6 ± 24.3
Sulfur compounds
195Ethyl 3-(methylsulfanyl)propanoate16:18.000:01.2MS, LRI1565156220.467.58 ± 4.20 b19.39 ± 5.48 a
196Dihydro-2-methylthiophen-3-one15:27.500:01.1MS, LRI152315236.997.15 ± 1.66 b14.72 ± 7.39 a
197Ethyl methanesulfonate18:31.000:00.9MS1695na5.131.44 ± 0.24 a1.18 ± 0.19 b
198Methionol19:08.000:00.9S, MS, LRI172817332.7356.4 ± 19.880.2 ± 32.6
199Isothiocyanatocyclohexane18:17.000:01.6MS, LRI168116701.300.11 ± 0.150.21 ± 0.17
2002-Thiophenecarboxaldehyde18:45.000:01.0MS, LRI170817011.250.66 ± 0.410.96 ± 0.58
2013-(Methylthio)propyl acetate17:29.600:01.2MS, LRI163116331.031.14 ± 0.751.67 ± 1.17
202Methyl isocyanate18:17.900:00.8MS, LRI1682na0.670.12 ± 0.190.23 ± 0.30
2033-(Methylthio)propanal13:58.500:01.0MS, LRI145814550.301.41 ± 0.701.68 ± 1.09
2042-(Methylthio)ethanol15:29.000:00.8S, MS, LRI152415230.224.21 ± 0.603.97 ± 1.24
Miscellaneous
205Tridecane10:33.500:02.7S, MS, LRI1306130021.0718.29 ± 3.01 a11.40 ± 2.59 b
2061,5,5,6-Tetramethyl-1,3-cyclohexadiene12:41.000:01.6MS1405na7.080.12 ± 0.21 b0.57 ± 0.40 a
207Tetradecane12:47.500:02.7S, MS1410na4.510.88 ± 0.340.48 ± 0.36
2081,2-Benzisothiazole23:25.700:01.1MS, LRI195619550.300.11 ± 0.120.15 ± 0.16
209cis-5-Hydroxy-2-methyl-1,3-dioxane14:48.200:00.9MS, LRI149214940.010.65 ± 0.360.62 ± 0.86
ID—type of identification: S—comparison with retention time and mass spectrum of pure standards and with NIST 2.0, Wiley 8, and FFNSC 2 mass spectra electronic libraries; LRI—comparison with linear retention index from literature; MS—comparison with mass spectra from NIST 2.0, Wiley 8, and FFNSC 2 libraries or literature; n.i.—not identified. Only MS symbol in the ID column = tentative identification. * Compounds were semi-quantified as equivalents of internal standard 2-octanol with response factor = 1. LRIexp—experimentally determined linear retention index. LRIlit—linear retention index from literature. Varieties: PM—Plavac mali, TE—Teran. Statistically significant differences between mean values at p < 0.05, obtained by one-way ANOVA and least significant difference (LSD) test, are marked by different superscript lowercase letters in a row.
Publisher’s Note: MDPI stays neutral with regard to jurisdictional claims in published maps and institutional affiliations.

