Article

Soil Chemical Properties Depending on Fertilization and Management in China: A Meta-Analysis

1
School of Geographical Sciences, Nanjing University of Information Science and Technology, Nanjing 210044, China
2
Department of Soil Science of Temperate Ecosystems, University of Göttingen, 37077 Göttingen, Germany
3
Peoples Friendship University of Russia (RUDN University), 117198 Moscow, Russia
4
Institute of Soil Science, Leibniz University of Hannover, Herrenhäuser Straße 2, 30419 Hannover, Germany
*
Authors to whom correspondence should be addressed.
Agronomy 2022, 12(10), 2501; https://doi.org/10.3390/agronomy12102501
Submission received: 14 September 2022 / Revised: 6 October 2022 / Accepted: 10 October 2022 / Published: 13 October 2022

Abstract

:
The long-term overuse of fertilizers negatively affects soil chemical properties and health, causing unsustainable agricultural development. Although many studies have focused on the effects of long-term fertilization on soil properties, few comparative and comprehensive studies have been conducted on fertilization management over the past 35 years in China. This meta-analysis (2058 data) evaluated the effects of the fertilizer, climate, crop types, cultivation duration and soil texture on the soil chemical properties of Chinese croplands. NPKM (NPK fertilizers + manure) led to the highest increase in pH (−0.1), soil organic carbon (SOC) (+67%), total nitrogen (TN) (+63%), alkali-hydrolysable nitrogen (AN) (+70%), total phosphorus (TP) (+149%) and available potassium (AK) (+281%) compared to the unfertilized control, while the sole nitrogen fertilizer (N) led to the lowest increase. The SOC (+115%) and TN (+84%) showed the highest increase under the influence of NPKM in an arid region. The increase in the chemical properties was higher in unflooded crops, with the maximum increase in the wheat–maize rotation, compared to rice, under NPKM. The SOC and TN increased faster under the influence of organic fertilizers (manure or straw) compared to mineral fertilization. Fertilizers produced faster effects on the change in the SOC and TN in sandy loam compared to the control. Fertilizers showed the highest and lowest effects on change in pH, organic C to total N ratio (C/N), TP and TK in clay loam with the cultivation duration. NPKM greatly increased the C/N compared to NPK in an arid region by 1.74 times and in wheat by 1.86 times. Reaching the same SOC increase, the lowest TN increase was observed in wheat, and the lowest increase in TP and AK was observed in rice, compared to the other crops. These results suggest that organic fertilizers (manure or straw) play important roles in improving soil fertility and in acidification. NPKM greatly increased the potential for soil C sequestration in wheat and in the arid region. The small increases in TP and TK can increase the SOC in rice and in the humid region. Therefore, considering the crop types and climatic conditions, reduced fertilization and the combination of mineral fertilizers with manure may be the best ways to avoid agricultural soil deterioration and increase soil carbon sequestration.

1. Introduction

Since the start of the application of mineral fertilizers in the 1950s, crop yields have increased (1950: wheat: 0.6 t ha−1, maize: 1.0 t ha−1, rice: 2.1 t ha−1; and 2021: wheat: 5.8 t ha−1, maize: 6.3 t ha−1, rice: 7.1 t ha−1) [1]. Although fertilizers ensure a short-term, continuous supply of nutrients to facilitate intensive crop production [2], the overuse of fertilizers contributes to serious environmental problems, such as the eutrophication of surface waters, nitrate pollution of groundwater, greenhouse gas emissions and other forms of environmental pollution [3,4].
With the rapid development of agriculture, the N fertilizer per unit area of cropland in China reached 200 kg ha−1 in 2019, which was almost three times the world’s average (70 kg ha−1) [1]. The overuse and inefficient utilization of fertilizer nutrients for crops cause significant alterations in the soil properties [5]. Fertilizers, especially sole N fertilizer, leads to accelerated soil acidification, which subsequently diminishes the soil health, nutrient availability and plant productivity [6,7,8]. Fertilizer has a strong effect on the soil pH (i.e., acidification), which is proportional to the amount of added N fertilizer [9,10]. N fertilizer was found to reduce the soil pH by 0.26 on average in global terrestrial ecosystems [11,12]. The pH decreased by 0.5 units in Chinese croplands during the 1980s–2000s, and the overuse of N fertilizer has caused soil acidification [13,14]. Soil acidification rates vary according to the climatic regions and crop types. For instance, in most soil types in southern China, such as red soil, acidification is severe because of the weak buffering potential at pH values below 6.0 [15]. The soil pH decreased from the initial level of 8.70 to 8.52 with the application of mineral fertilizers in wheat–rice rotations [16]. A decline in the soil pH of 0.1–0.7 units was observed with N addition to the wheat–maize cropping system [14]. Acidification decreases the water and nutrient retention capacity in soils and reduces biotic activity [17]. Soil acidification also causes toxicity in plants due to aluminum, manganese and heavy metals, as well as the loss of carbonates and base cations [18,19], leading to deficiencies in basic nutrients (e.g., Ca, Mg and K) and molybdenum, which ultimately reduces the crop yield [20].
A balanced application of organic fertilizers combined with mineral fertilizers can accumulate SOC and maintain the soil productivity [21,22,23,24]. The rice crop succession, without organic fertilizer addition, led to a greatly reduced SOC content and, hence, resulted in soil degradation [25]. The long-term use of mineral fertilizers alone accelerated the decomposition and mineralization of SOC [26]. Long-term fertilizer application can have a positive [27] or no effect [28,29] on the SOC content. Therefore, the effects of fertilizer application on SOC are variable and not entirely clear.
TN contents in agroecosystems can be increased in crop systems by long-term fertilization [22,30,31,32]. The combined application of manure with mineral fertilizers can rapidly increase the available phosphorus (AP) in soil [33] and the potassium (AK) content [34,35], but it may also increase the risk of P leaching [36,37]. The application of fertilizers with straw was conducive to keeping the AP content at an appropriate level that could not only satisfy the crop P demand but also avoid negative impacts on the environment in the case of sandy loam soil on the Huang-Huai-Hai Plain of China [37]. The average soil AK (mg L−1) in China increased (79.8 to 93.4) with continuous fertilization from 1990 to 2012 [34].
Previous studies on the effects of fertilization on soil properties have generally been conducted on a local or regional scale [38]. The effects of fertilizer on soil properties are uncertain due to specific geographies, fertilizer practices, crop types and soil texture. There have been few long-term comparative and comprehensive studies on the effects of fertilization on the properties of soil under fertilization management in China. To evaluate the influences of fertilizers on soil chemical properties, a meta-analysis was conducted to address the following objectives: (1) to evaluate the effects of the fertilizer regimes on soil chemical properties; (2) to identify the main factors that control the chemical properties; (3) to reveal the changes in soil chemical properties depending on climate, crops and cultivation duration; (4) to explain the modifying effect of the soil texture on the rates of changes in the chemical properties due to fertilizer; and (5) to select the best fertilizer strategies for soil sustainability.

2. Materials and Methods

2.1. Data Collection

Published data were collected from the China National Knowledge Infrastructure (http://www.cnki.net) (accessed on 5 September 2020) and Web of Science (http://isiknowledge.com) (accessed on 6 September 2020) databases using the keyword ‘long-term fertilization’. A collection of peer-reviewed publications from 1999 to 2021 focusing on the responses of soil chemical properties, including the soil organic carbon (SOC), pH, organic C to total N ratio (C/N), total nitrogen (TN), alkali-hydrolysable nitrogen (AN), total phosphorus (TP), total potassium (TK) and available potassium (AK), were obtained. The following criteria were used to select the studies: (1) the experimental sites were located in China; (2) clear study location (site name, latitude and longitude); (3) climatic conditions (mean annual temperature (MAT) and mean annual precipitation (MAP)), crop types (wheat, wheat–maize, maize, wheat–rice , rice) and soil texture were available; (4) fertilizer management measures (cultivation duration, fertilizers) were clear; and (5) the study was conducted based on comparisons with the control (without fertilizer) and between fertilizers, i.e., mineral N fertilizer alone (N) or with phosphorus, potassium and nitrogen (NPK), NPK with straw returning (NPKS) and NPK with manure (NPKM).
According to the abovementioned screening criteria, a total of 318 relevant papers were retrieved, and 2058 data points were subjected to meta-analysis. The 67 fertilization experimental stations in China were classified according to the humidity index (HI = MAP/(MAT + 10)) [39]. The index was then divided into the following categories: HI ≤ 25 was marked as the arid region; 25 < HI < 50 was represented as the semiarid region; and HI ≥ 50 was denoted as the humid region [39] (Figure 1).

2.2. Data Analysis Method

2.2.1. Meta-Analysis

Meta-analysis is a statistical method for the comprehensive quantitative analysis of the results of multiple independent studies. The statistical indicators were expressed by the response ratio of the combined count data (response ratio, RR).
In our study, we chose the log response ratio as the effect size for the soil chemical properties and duration comparisons [40]. The calculation formula of RR was as follows (Formula (1)) [41]:
RR = Xe / Xc
where Xc is the value of a given soil property in the unfertilized control, and Xe is the measured value of that property under the influences of the fertilizers.
The calculation formula of increment was as follow (Formula (2)):
Increment = Xe Xc
To improve the statistical performance, RR was log-transformed [40]:
Ln ( RR ) = ln Xe / Xc = Ln ( Xe ) Ln ( Xc )
The variance (V) was calculated by:
V = S e 2 / n e X e 2 + S c 2 / n c X c 2
where ne and nc represent the sample sizes of the fertilizer and unfertilized control groups, respectively; Se and Sc represent the standard deviations of the fertilizer and unfertilized control groups, respectively; and Xe and Xc represent the mean values of the fertilizer and unfertilized control groups, respectively [42].
We used the weighted (or average) response ratio (RR++) and standard errors of RR++ (s(RR++)), defined as follows [40]:
RR + + = i = 1 m j = 1 k w ij RR ij / i = 1 m j = 1 k w ij
s ( RR + + ) = 1 / i = 1 m j = k k w ij
The wij in Equations (5) and (6) is the weighting factor for each RR++ obtained using the equation wij = 1/V; V is variance; m is the number of groups; and k is the number of comparison groups [40].
The average response ratio of the soil chemical properties was transformed into the percentage change in order to directly evaluate the effects on the soil chemical properties, using the equation below [42]:
%   change = ( e LnRR 1 ) × 100
If the value of the percentage change was greater than 0, it indicated that the fertilizer had a positive effect on the soil properties. When the percentage change was lower than 0, it showed a negative effect of the fertilizer on the soil properties.

2.2.2. Analysis of the Contribution of Explanatory Variables

For a further analysis of the importance of the explanatory variables to the effects on the responses of soil chemical properties (SOC, pH, TN, TP and TK), boosted regression tree (BRT) analysis was used to rank their contributions for different factors (HI, cultivation duration, fertilizer regimes, crop types and soil texture). BRT analysis was performed in R 3.5.2 software, using the “gbm”, “dismo”, “survival”, “lattice”, “splines”, “parallel”, “raster” and “sp” packages in combination [42].

2.2.3. Statistical Analysis

The linear regression method was used to analyze changes in the soil chemical properties depending on fertilizer regime, cultivation duration, climate region, crop type and soil texture. One-way ANOVA and LSD t-tests were applied to test the effects of the fertilizer types on the soil chemical properties. Statistical tests were performed using SPSS software and were accepted as significant when the p value was < 0.05 and highly significant when the p value was < 0.01.

3. Results

3.1. Effects of Different Fertilizers on the Soil Chemical Properties

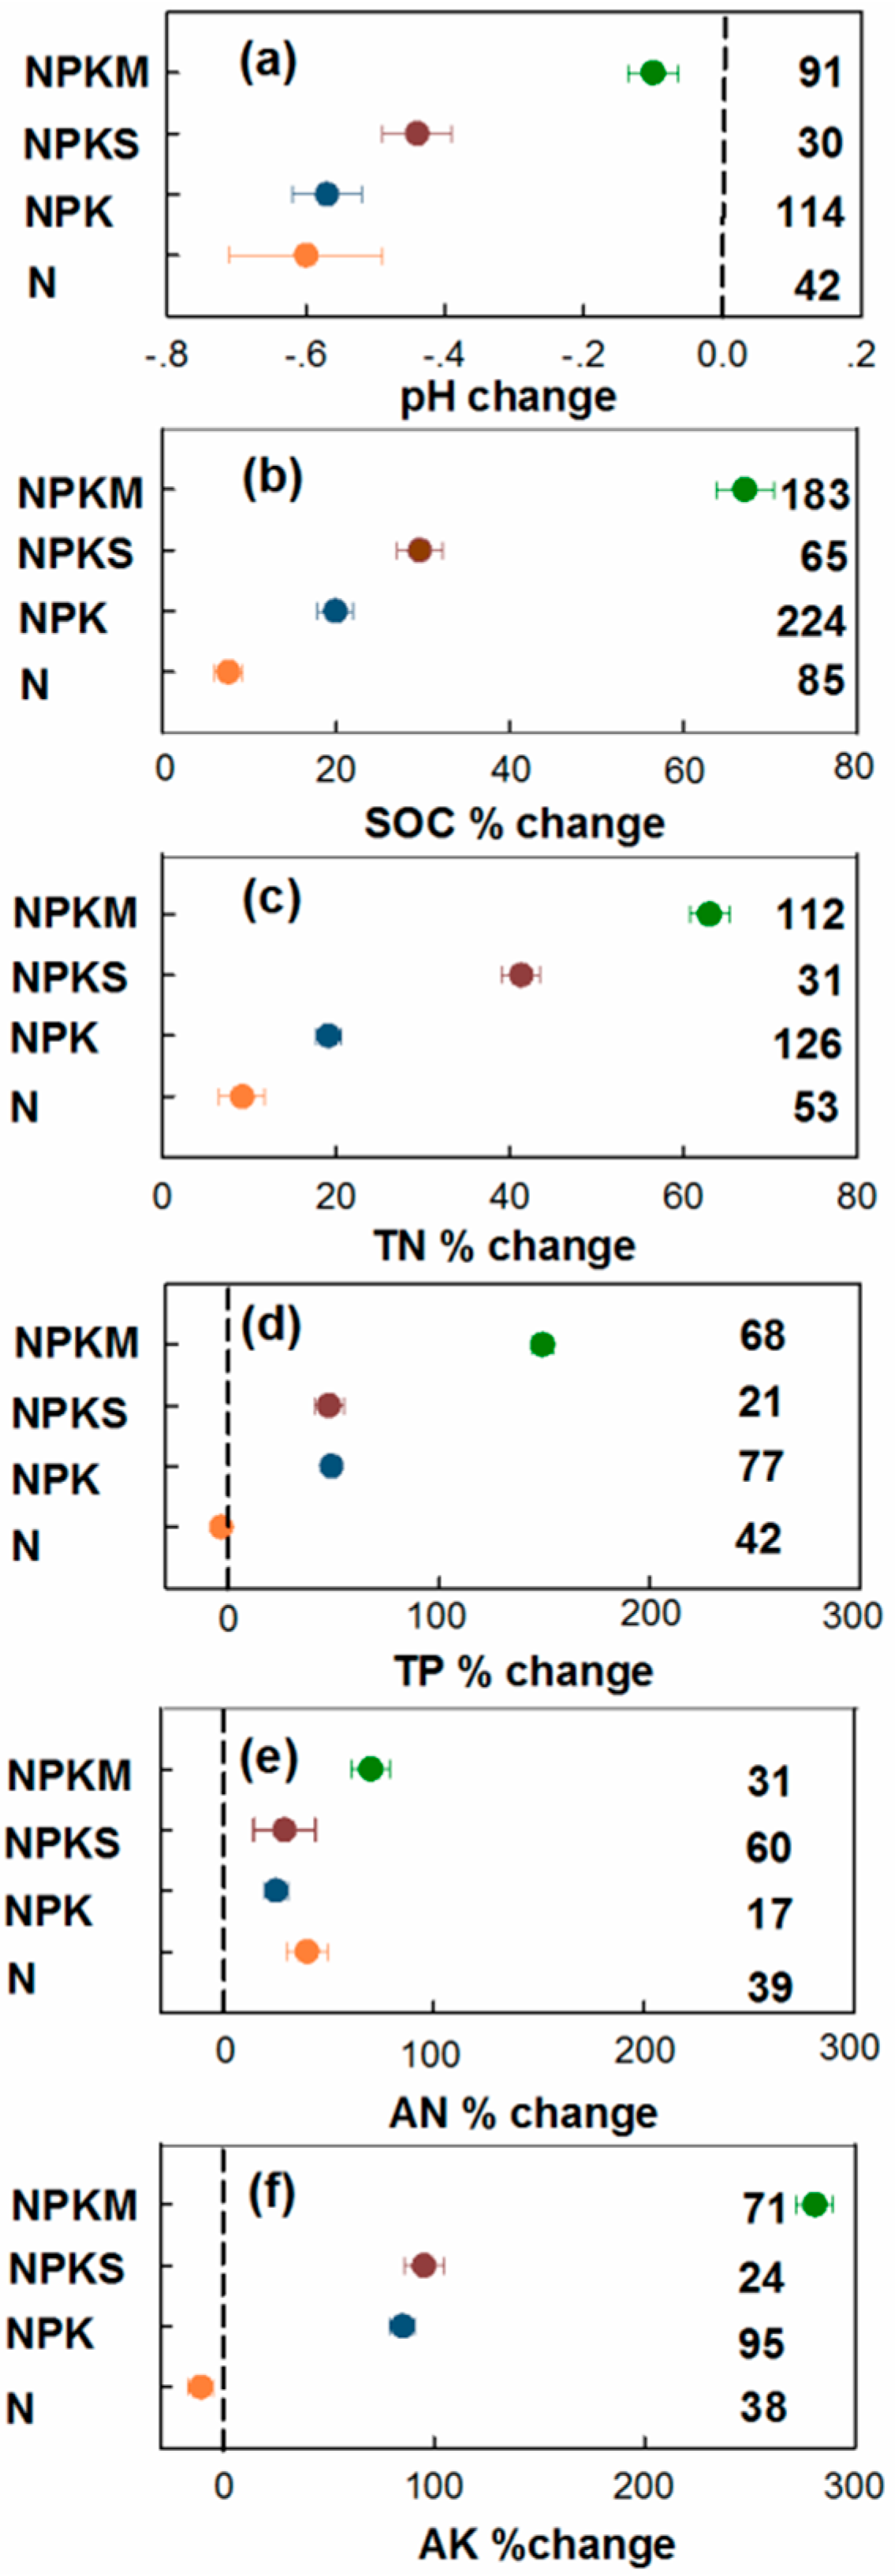
NPKM produced the highest and N produced the lowest increase in the soil chemical properties (pH, SOC, TN, TP, AK) (Figure 2). The N led to the strongest decrease (−0.6) in the pH, while the NPKM showed the lowest (−0.1), followed by NPKS (−0.4) and NPK (−0.58) (Figure 2a). The response order of the increases in SOC, TN and AK, respectively, to fertilizers was NPKM (67%, 63%, 281%) > NPKS (30%, 41%, 95%) > NPK > (20%, 19%, 85%) > N (8%, 9%, −11%) (Figure 2b,c,f). The N, NPK, NPKS and NPKM increased the AN content by 40%, 25%, 29% and 70%, respectively (Figure 2e). Therefore, the NPKM fertilizer had the strongest effects on the soil chemical properties.

3.2. Effects of the Climate Region and Different Fertilizers on the Soil Chemical Properties

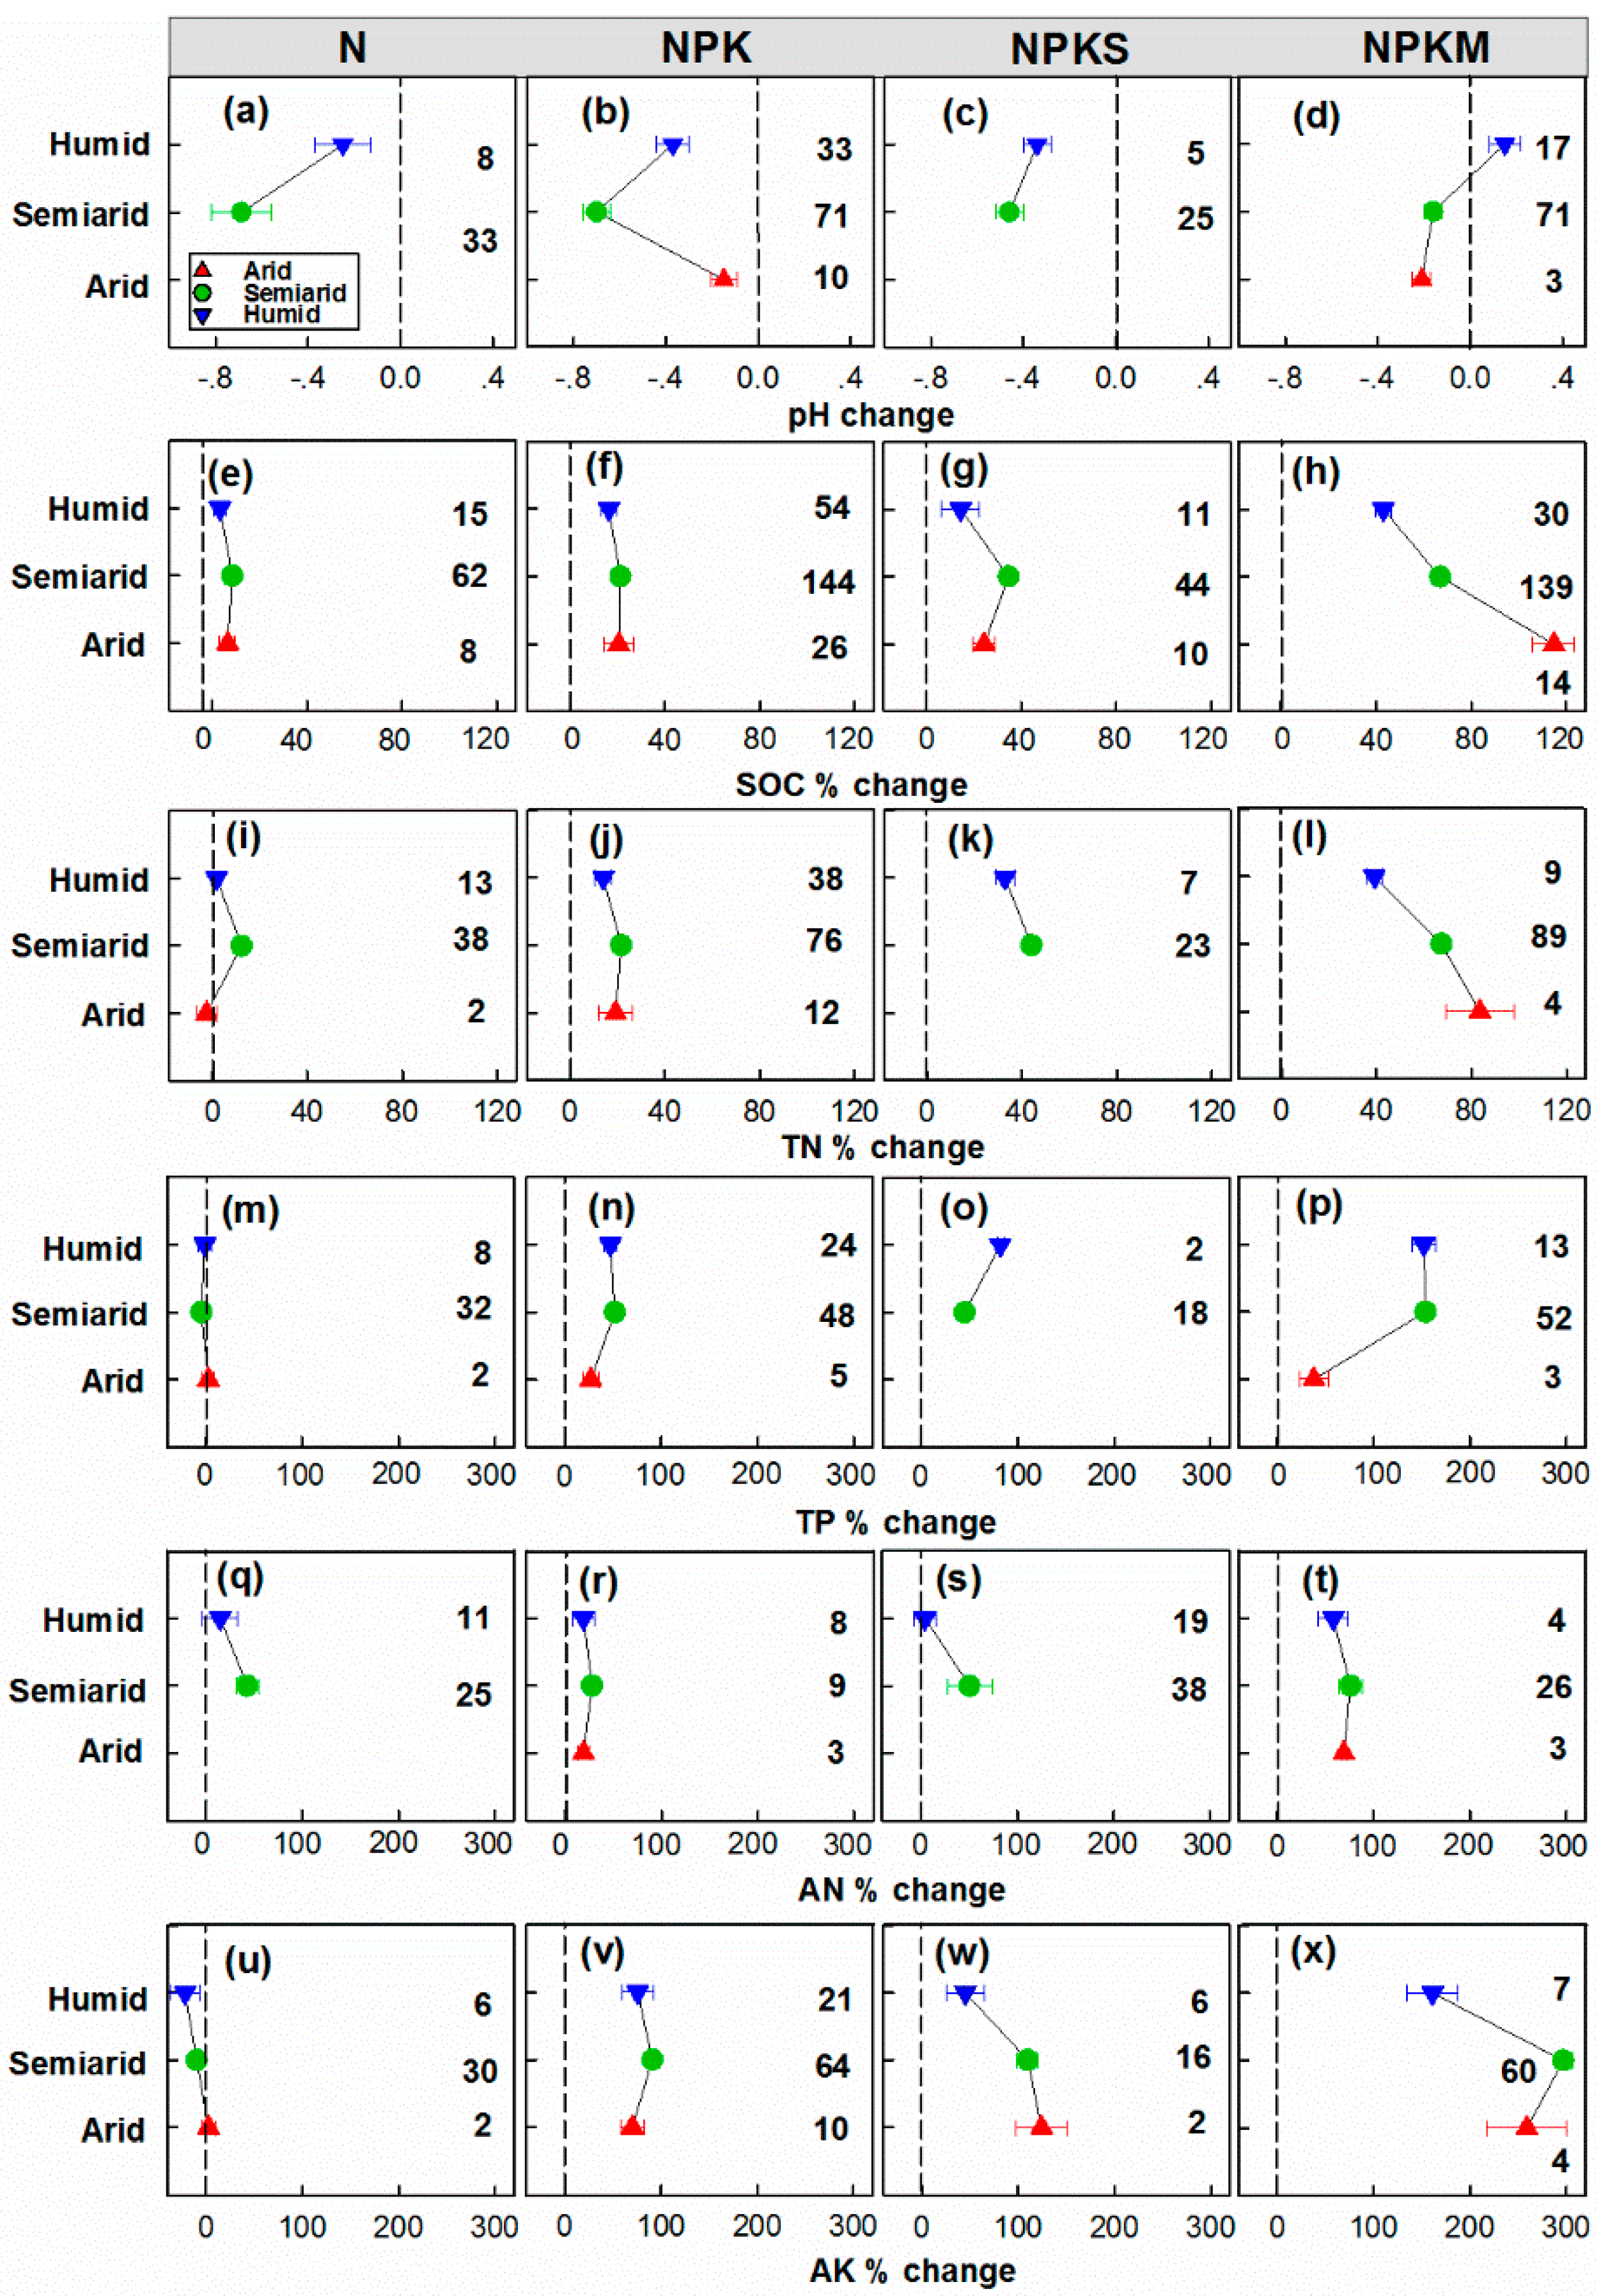
In all climate regions, the increase in soil chemical properties (pH, SOC, TN, TP, AN and AK) was the lowest under the influence of N, but the highest effect was under NPKM (Figure 3). The NPKM had the highest effect (0.15) on the pH in the humid region (HI ≥ 50), while the N and NPK had the lowest effect (−0.7) on the pH in the semiarid region (25< HI< 50) (Figure 3a,b,d). The humid region (HI ≥ 50) had the lowest increases in SOC, AN and AK using all fertilizers compared to other climates (Figure 3e–h,q–t,u–x). The increases in SOC (115%) and TN (84%) reached the maximum in the arid region (HI ≤ 25) under NPKM (Figure 3h,i). The TP content increased with increasing HI under NPK (27% to 47%), NPKS (45% to 82%) and NPKM (38% to 152%) (Figure 3n–p). Thus, the pH reduced faster in the semiarid region. The humid region had an increase in pH under NPKM. The arid region showed the highest effects on the increase in SOC and TN under NPKM. The humid region had the lowest effects on the increase in SOC, TN, AN and AK. The TP increased the least in the arid region.

3.3. Effects of the Crop and Fertilizer Types on the Soil Chemical Properties

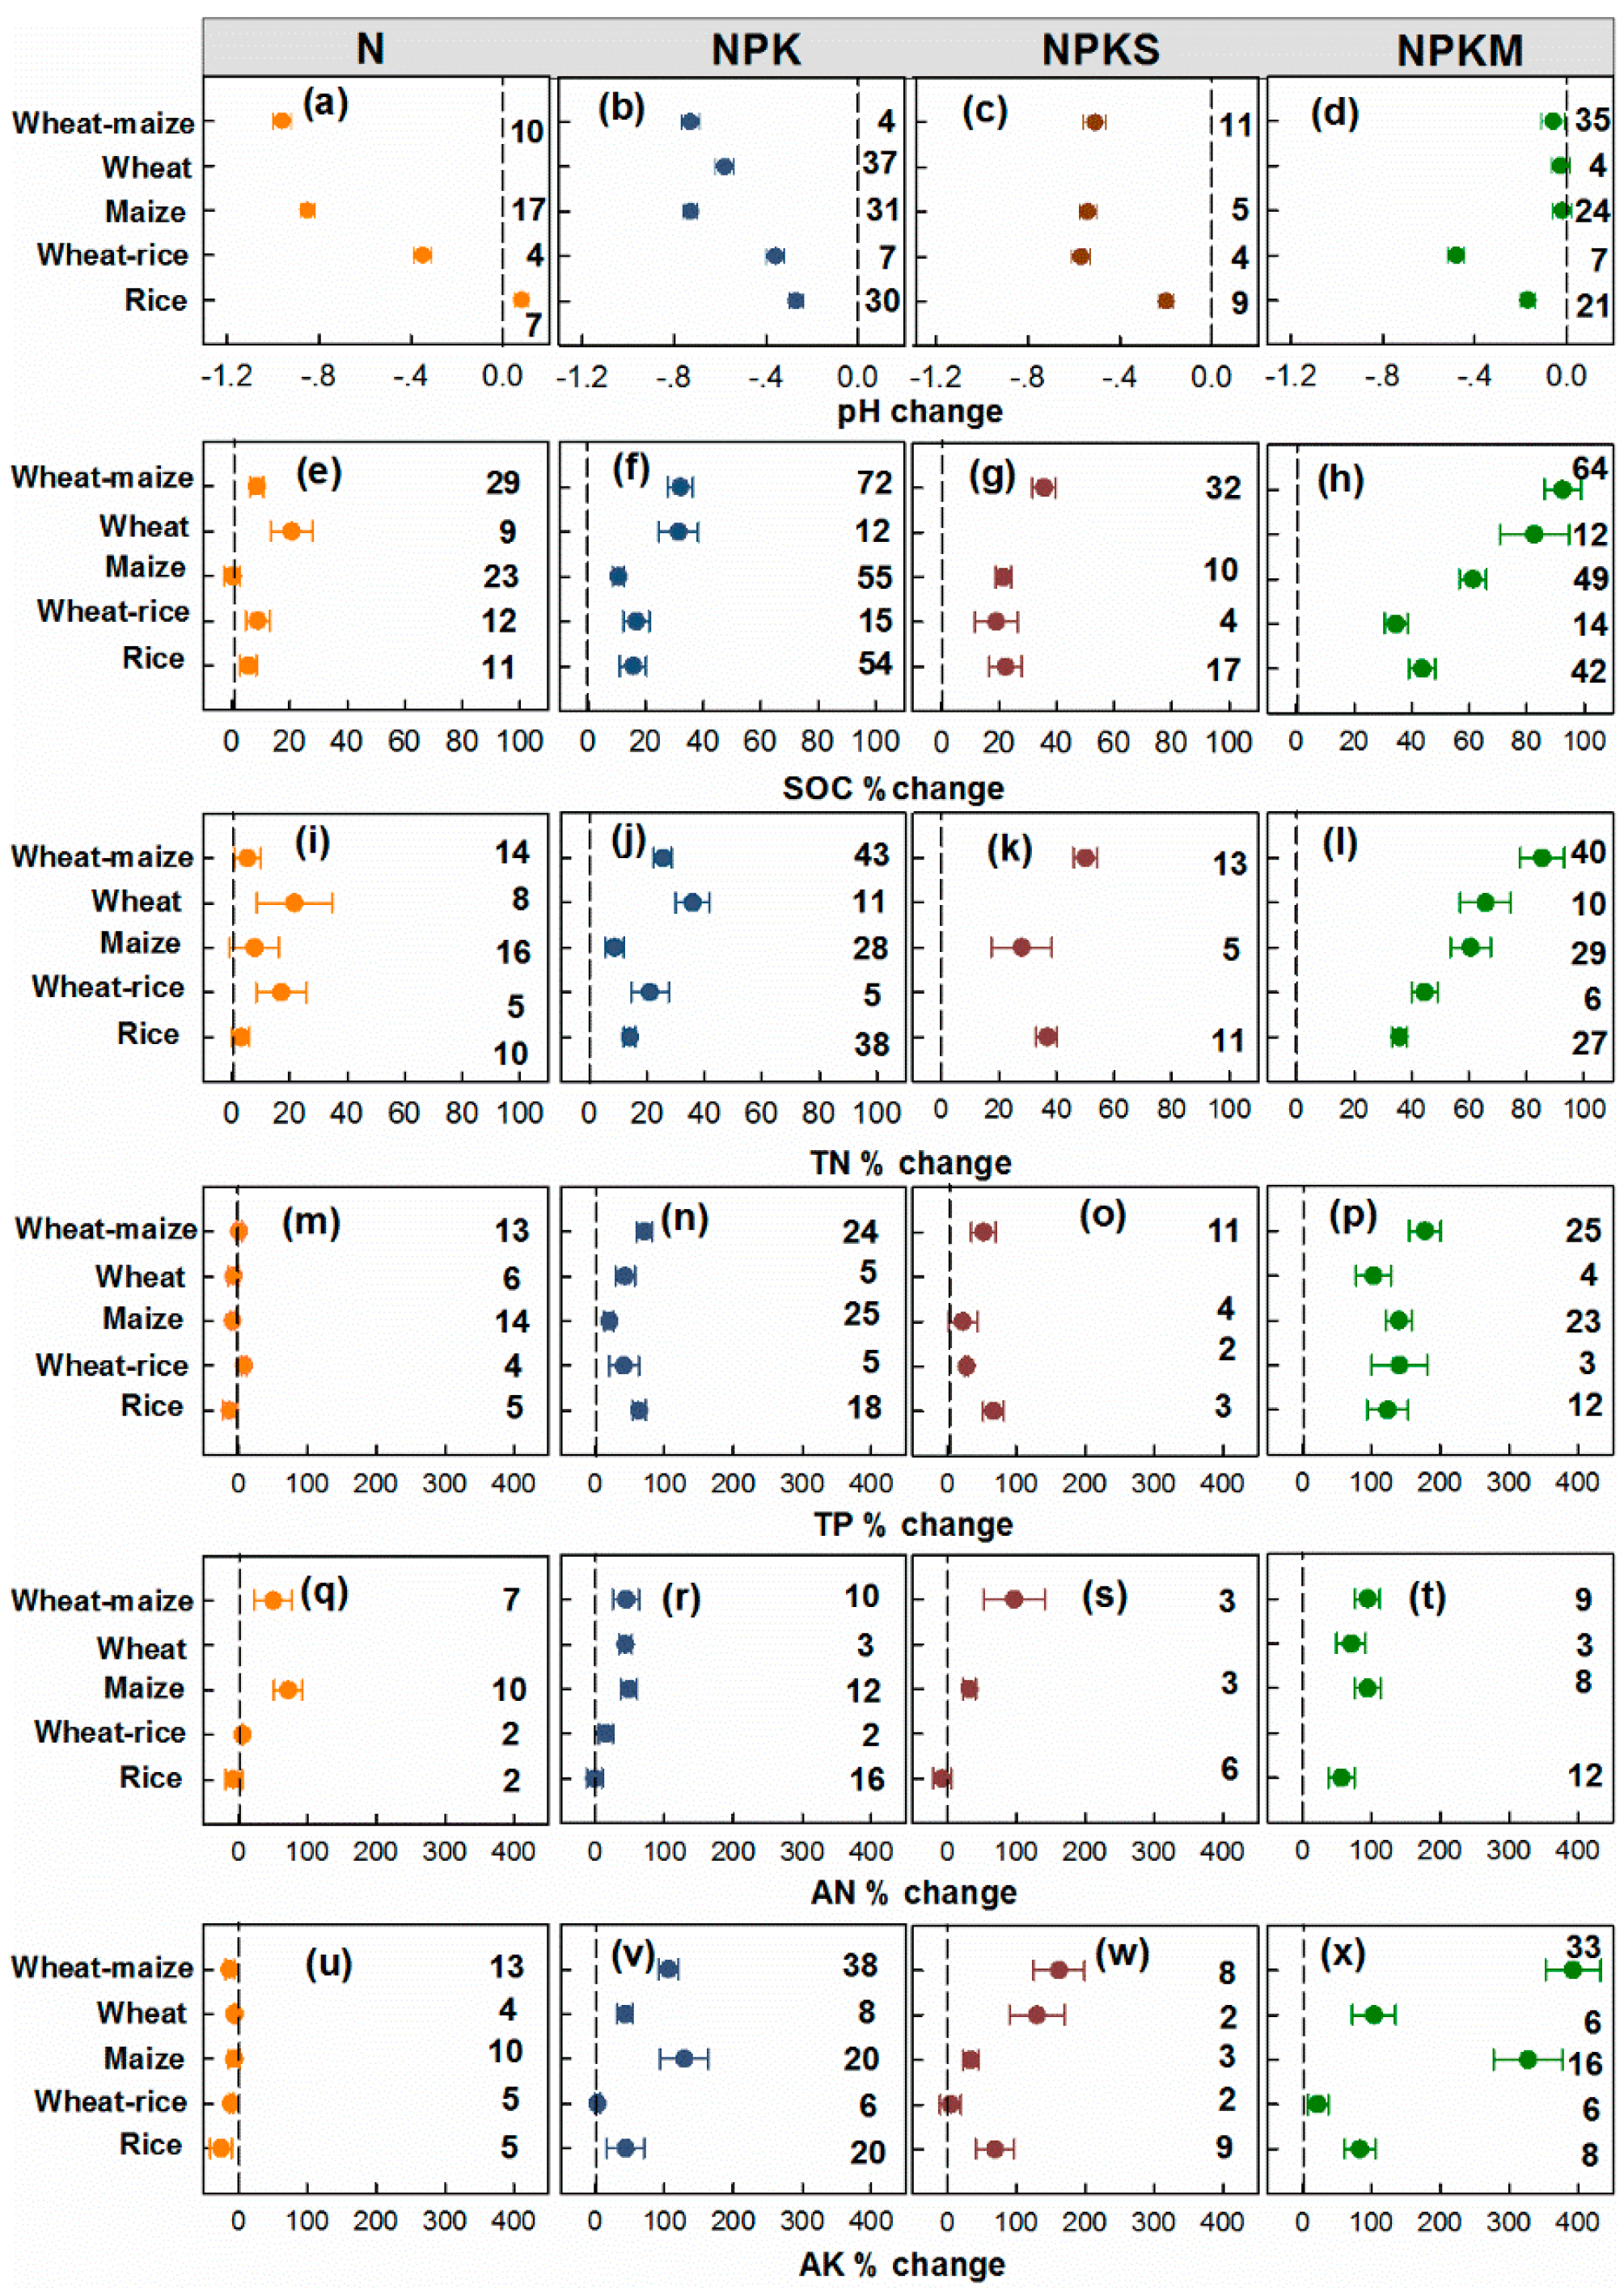
NPKM had the strongest effects on the soil chemical properties (SOC, TN, TP, AN and AK) in all crop types (Figure 4). The pH reduced the least under NPKM in unflooded crops (wheat–maize (−0.06), wheat (−0.03), maize (−0.02)) compared to the flooded crop (rice (−0.2)) and unflooded–flooded crop rotation (wheat–rice (−0.5)) (Figure 4d). The pH decreased the most (−1) in the case of N in the wheat–maize rotation compared to the control and increased the most (0.1) in the case of rice (Figure 4a). The increase in SOC was 9–92% in wheat–maize and 21–83% in wheat, which was higher than that of rice (6–44%) and wheat–rice (9–35%), with the maximum value for NPKM and minimum value for N (Figure 4e–h). The TN of the unflooded crops (wheat–maize: 86%, wheat: 66%, maize: 61%) increased higher than that of the unflooded–flooded crop rotation (45%) and flooded crop (36%) under NPKM (Figure 4l).
The TP content had a higher increase in wheat–maize and reached the highest value (178%) under NPKM (Figure 4p). The minimum increase in the TP value was −12% in rice cultivation under N (Figure 4m). The AN of the unflooded crops (wheat–maize (44% to 95%), wheat (43.5% to 71%)) increased more than that of flooded crop (−6% to 57%), with the maximum value for NPKM and minimum value for NPK (Figure 4q–t). The increased AK of unflooded crops was higher than that of unflooded–flooded and flooded crops (Figure 4u–x). The N decreased the AK in rice by 25% and NPKM increased the AK in wheat–maize by 390%. (Figure 4u,x). Therefore, the increase in the chemical properties (SOC, TN, TP, AN and AK) was higher in unflooded crops, with the maximum value in the wheat–maize rotation compared to flooded crops under NPKM. The application of NPKM in rice ( Δ pH :   −0.2) and wheat–rice ( Δ pH :   −0.5) cultivation could not reduce the soil acidification compared to unflooded crops.

3.4. Effects of the Fertilization Duration and Fertilizer Types on the Soil Chemical Properties

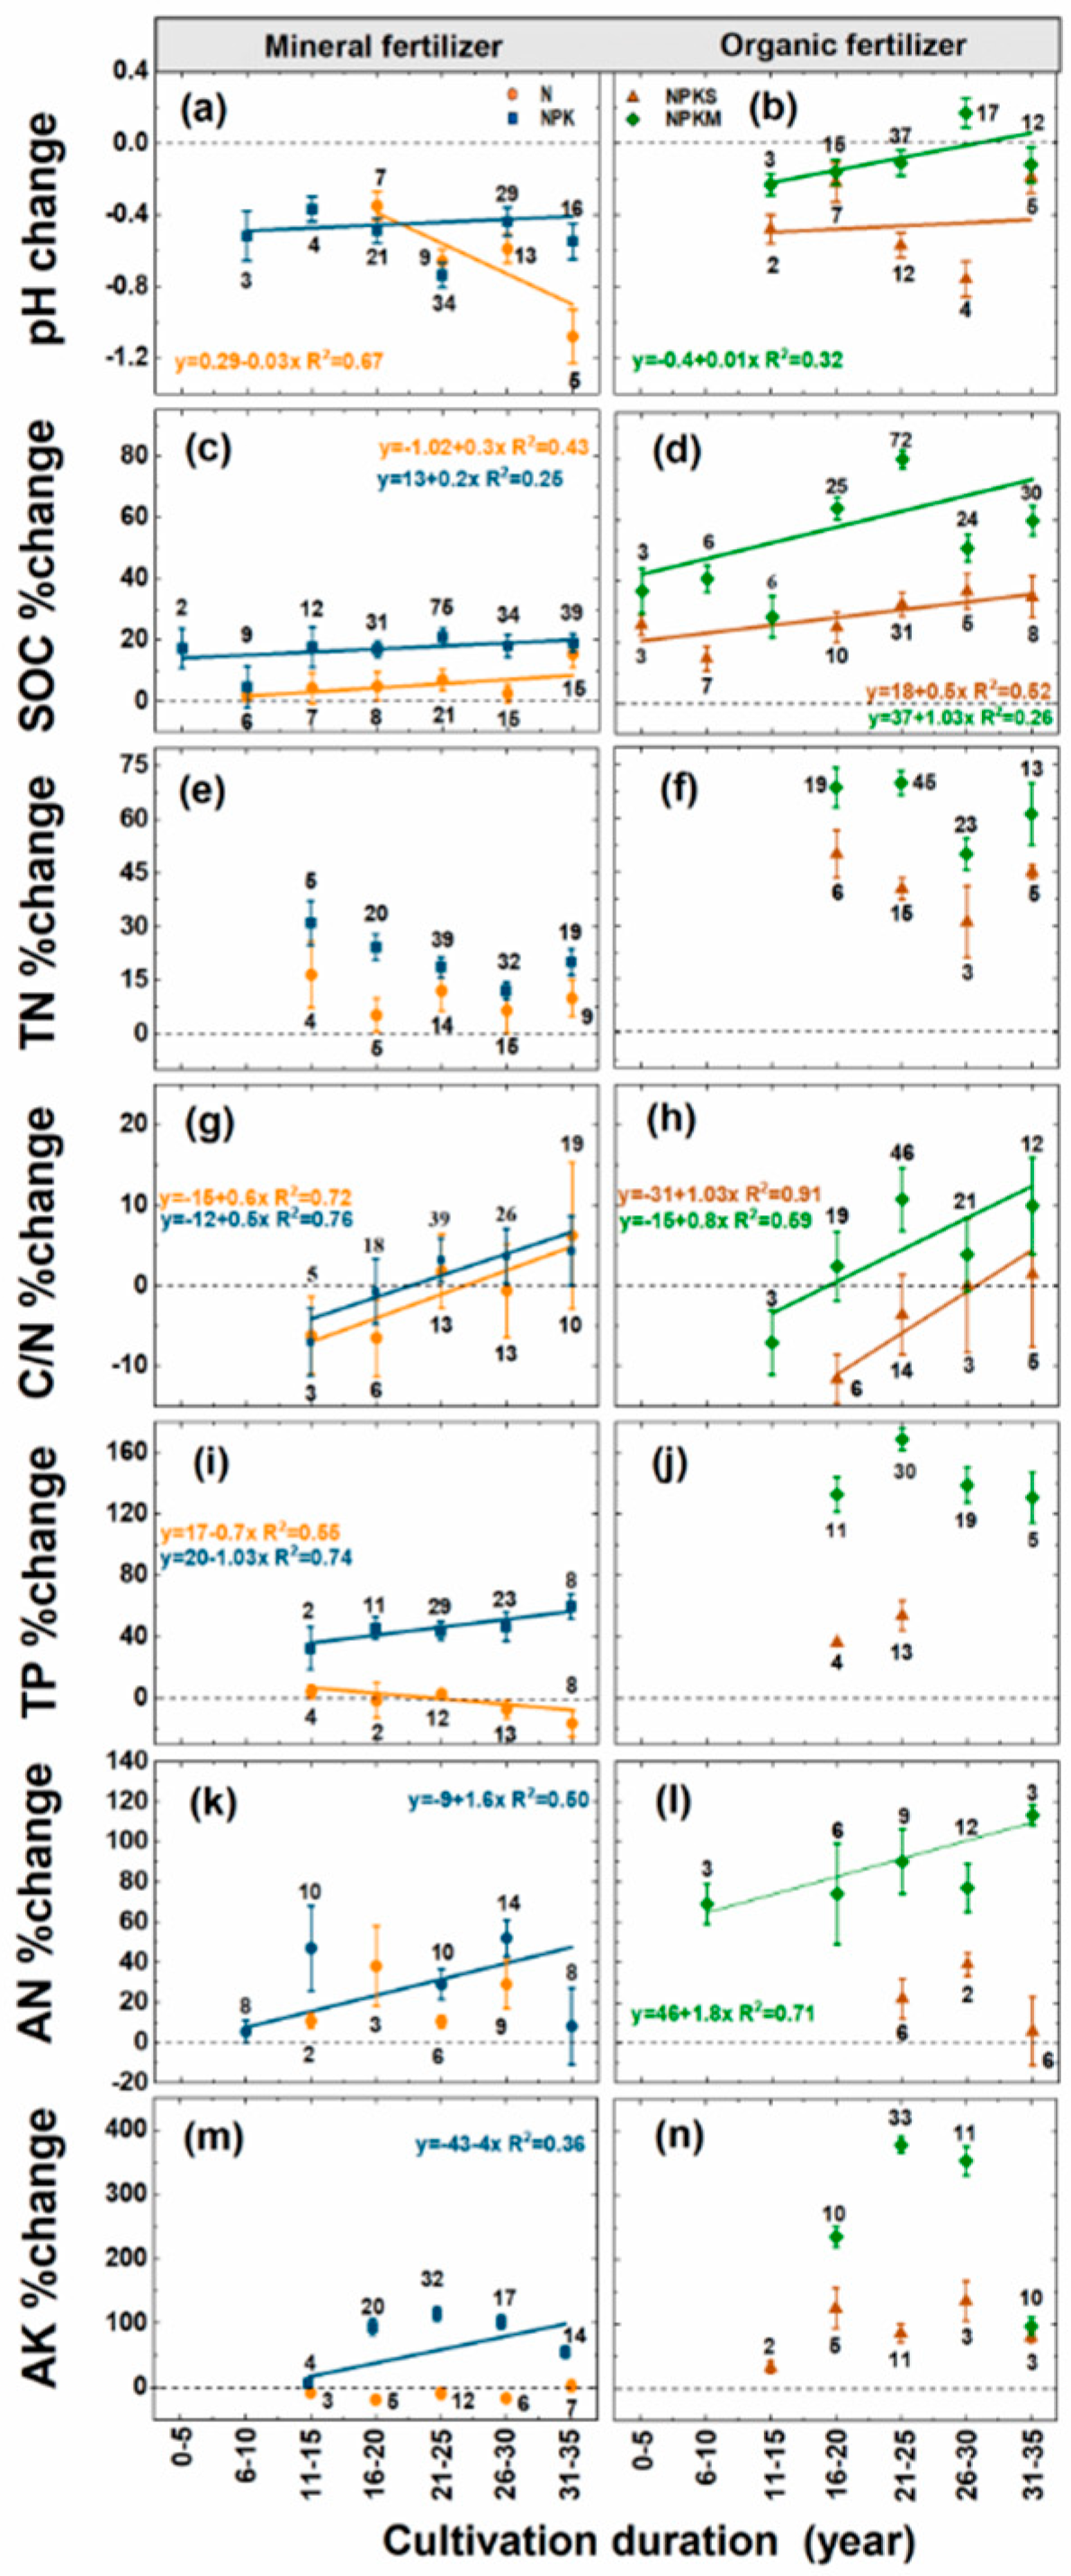
The pH decreased fastest (−1) over 35 years of cultivation under N but increased and reached the highest value (+0.2) between 25 and 30 years under NPKM (Figure 5a,b). The order of the SOC increase was organic fertilizer (NPKM: 37% to 60%, NPKS: 25% to 35%) > mineral fertilizer (NPK: 18% to 20%, N: 2% to 15%) (Figure 5c,d). The N, NPK, NPKS and NPKM decreased the increment in the TN from 17% to 7%, 31% to 12%, 50% to 31%, and 70% to 50%. TN had the lowest increase during the 26–30 years of cultivation (Figure 5e,f). The C/N increased faster from −7% to 2.5% over 20 years and had increased to 10% after 35 years under NPKM. Additionally, the mineral fertilizer increased C/N from −7% to 3% over 25 years and the NPKS increased C/N from −11% to 1.5% after 35 over (Figure 5g,h).
The TP reduced in the case of N (4% to −17%) but increased under NPK (33% to 60%) during 35 years of cultivation (Figure 5i). The TP content increased and reached a maximum change value of 170% after 21–25 years under NKPM (Figure 5j). The AN had the highest increase under NPKM (70% to 113%) compared to the other fertilizers during 35 years of cultivation (Figure 5k,l). The increase in AK was −8% to 2.5% under N, 9% to 57% under NPK and 33% to 80% under NPKS during 35 years of cultivations (Figure 5m,n). The increase in AK showed the highest value under NPKM (380%) after 21–25 years of cultivation (Figure 5n). Thus, the SOC and TN increased faster under the influence of organic fertilizer compared to mineral fertilizer. With the cultivation duration, the pH reduced fast under N and increased faster under NPKM.

3.5. Effects of the Soil Texture on the Soil Chemical Properties under Fertilizer

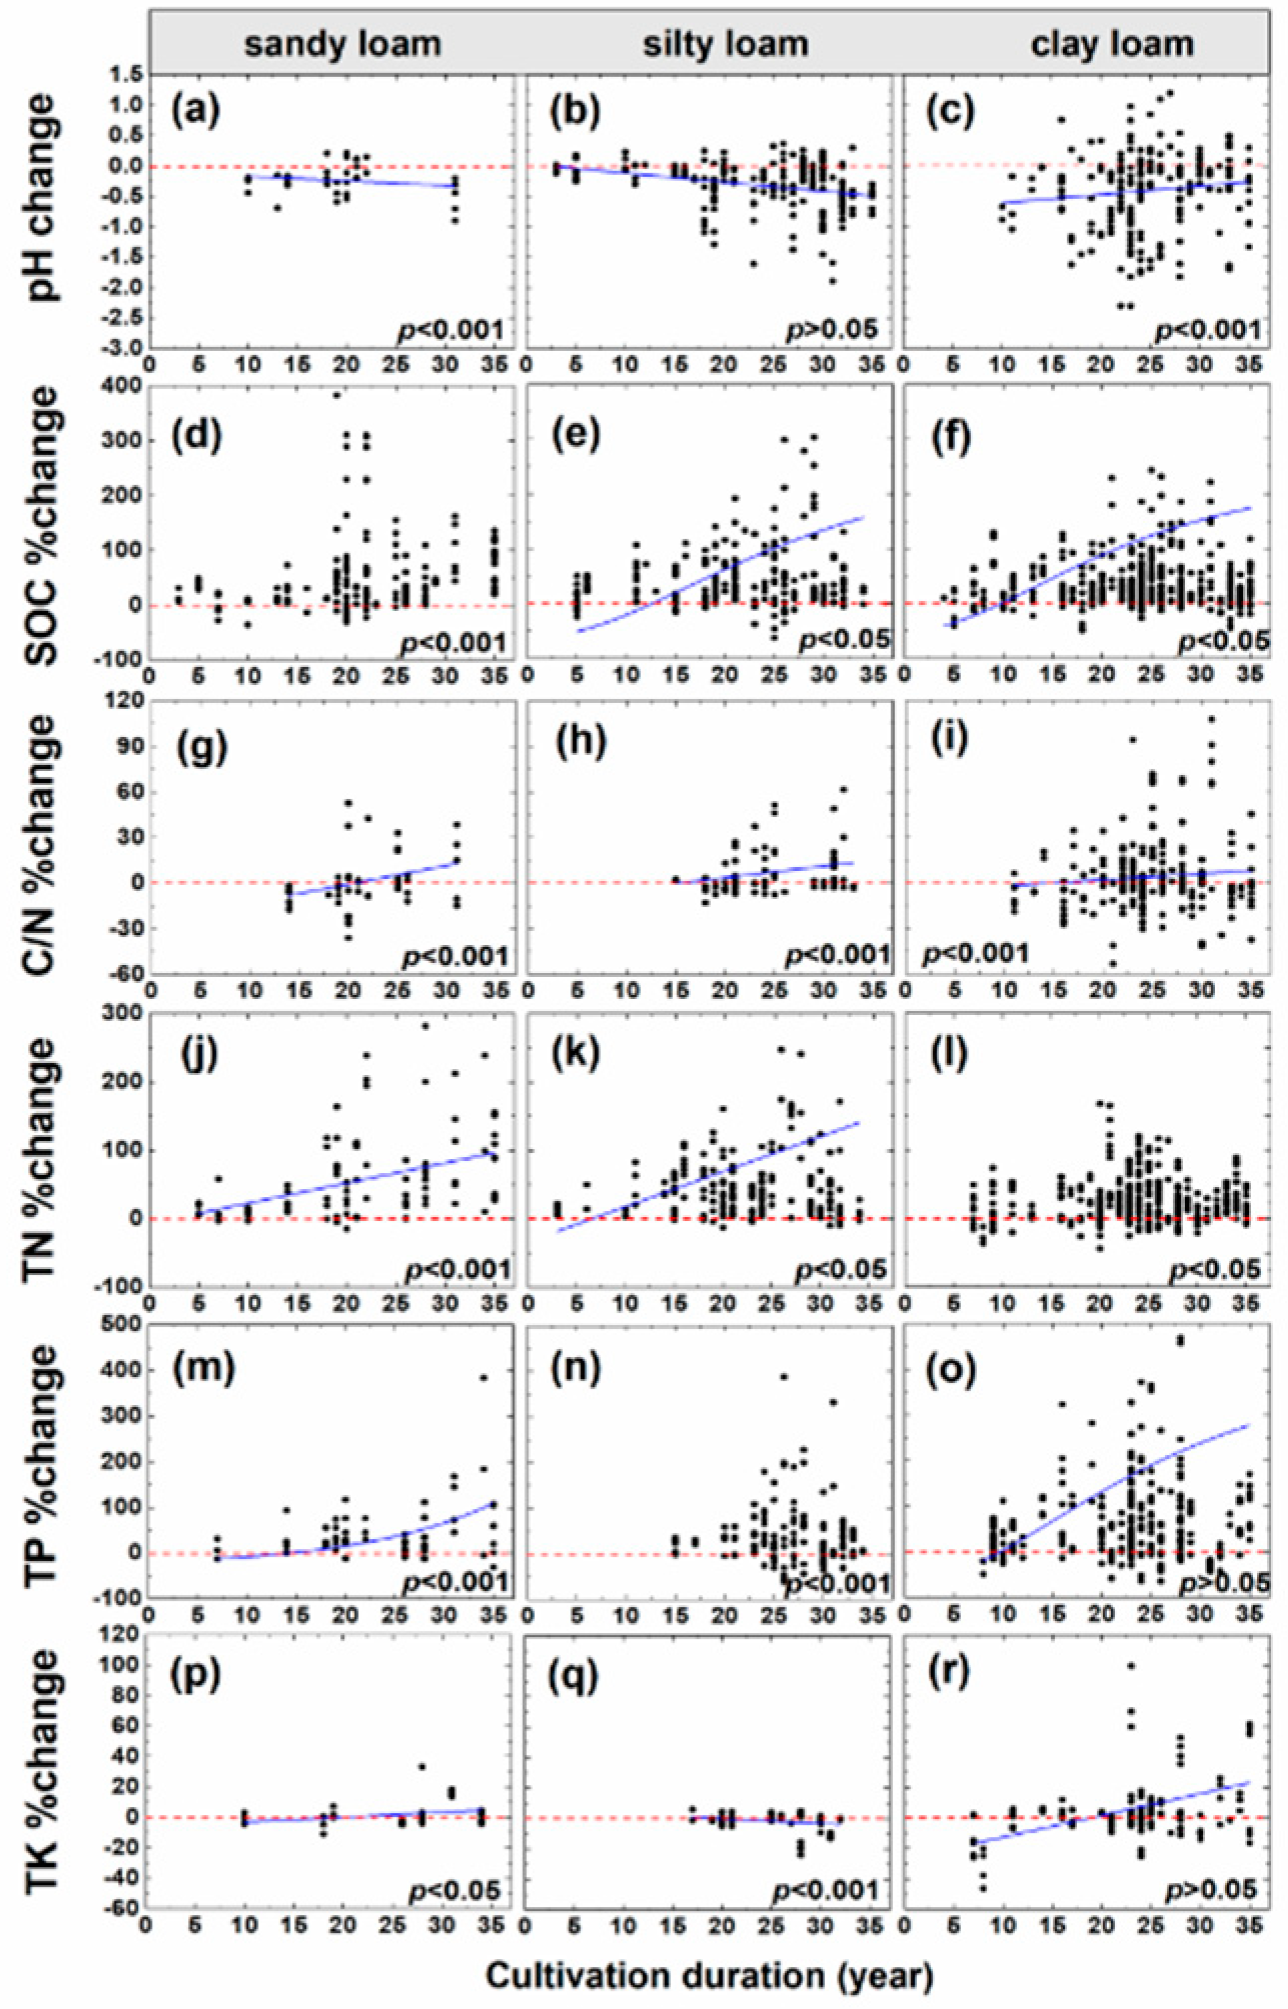
The pH change decreased in the sandy (0.2 to −1), silt (0.2 to −2) and clay loam (1.2 to −2.3) soils with the cultivation duration, and the more alkaline pH values were observed in the clay loam soils (Figure 6a–c). The SOC increased in the three soil texture types under the influence of fertilizer, but maximum values were achieved earlier in the sandy loam soils (390%) after 19 years of cultivation compared to the silty loam soils (300%) after 26 years and clay loam soils (200%) after 25 years (Figure 6d–f). The increase in C/N was highest and lowest in the clay loam soils (Figure 6i). The TN increased strongly in sandy loam soils (−10% to 290%) compared to silty (−10% to 250%) and clay loam (−50% to 175%) soils with the cultivation duration (Figure 6j–l). The TP increased greatly in sandy (−20% to 360%) soils but reached its highest point in silty (350%) and clay loam (450%) soils after 26 years of cultivation (Figure 6m–o). The TK decreased during the initial 10 years in clay loam soils and then increased with the cultivation duration (Figure 6r). The increase in TK had the widest range in clay loam soils (−50% to 100%) compared with the sandy loam (−10% to 35%) and silty loam soils (−30% to 10%) (Figure 6p–r). In summary, the sandy loam texture had faster effects on the SOC and TN, and clay loam had the highest and lowest effects on the pH, C/N, TP and TK with the cultivation duration.

3.6. Correlations between the Percentage Change of the Soil Chemical Properties and the Explanatory Variables

The responses of almost all the soil chemical properties showed that they were positively correlated (p < 0.05) with each other. Thus, TN was negatively correlated with C/N (Table 1). The change in the SOC was correlated with the other soil chemical properties, except for AN (Table 1). In particular, there were strong relationships between the SOC and TN (R2 = 0.70), SOC and TP (R2 = 0.71) and SOC and AK (R2 = 0.54) (p < 0.01) (Table 1). The change in AK was correlated with other soil chemical properties, especially AK and TP (R2 = 0.63) and AK and AN (R2 = 0.64) (p < 0.01) (Table 1).
Among the explanatory variables, MAT was positively correlated with the soil chemical properties (i.e., pH, SOC, TP and AK). The responses of SOC and C/N increased with the increasing cultivation years, while those of TN and TP showed the opposite (p < 0.05) (Table 1). The change in TP increased with HI. On the contrary, the changes in SOC and TN decreased with the increase in HI (p < 0.01) (Table 1).

4. Discussion

4.1. Dynamics of the Soil Chemical Properties Due to Fertilizer Regimes Depending on Climate and Crop Types

The pH values decreased with the cultivation duration (Figure 5a,b and Figure 7) [43,44,45,46]. The slow decrease in pH in the first 25 years after fertilization was due to the presence of a measurable amount of carbonates in most soils, which could neutralize the acidity induced by fertilizer (Figure 5a,b) [6]. Nevertheless, a stronger decrease (−0.6) in the soil pH caused by the application of mineral N fertilizer alone in China, compared to the average (−0.26) for global terrestrial ecosystems under N, according to a meta-analysis, was observed [11,12]. The overuse of N fertilizers decreases the nitrogen use efficiency, resulting in higher levels of nitrate and acidity in the soil solution because of the nitrification process. As a result, a faster reduction in base cations occurs so as to neutralize the added acidity and, thus, a faster and stronger pH decrease occurs [11,18,47,48].
The addition of manure, on the other hand, retards soil acidification because of the large amounts of basic cations in manure and the release of hydroxyl ions (OH) during decomposition [44,49,50,51,52,53]. The pH of flooded crop soils was higher than the pH values of unflooded–flooded and unflooded crop soils under N, NPK and NPKS (Figure 4a–c). Under anaerobic conditions, the soil reduction tends to increase as the denitrification process, as well as the reduction in iron and sulfur, consumes H+ ions or releases OH ions into the soil solution [54]. The lowest decrease in the pH values of soils in the humid regions (HI ≥ 50) (Figure 3a–d and Figure 7) can also be explained by the large areas of paddy rice cultivation in humid regions [55].
The application of organic fertilizer (manure or straw), along with NPK, increased the SOC and TN compared to mineral fertilizer alone (Figure 2,Figure 3,Figure 4,Figure 5 and Figure 7) [5,38,56,57]. Firstly, manure and straw application provides organic carbon compounds to the soil at various decomposition stages, ranging from organic residues to humus. Thus, the SOC increased with the cultivation duration due to the soil aggregation, which physically protects it from microbial decomposition and transformations [58,59,60,61]. Secondly, the application of organic fertilizers increases the activity of microorganisms and their diversity by providing a diversified source of C and N [20,62,63], thereby producing a large number of enzymes and increasing the soil organic carbon content as well [64,65,66]. Manure and straw application also improves the soil physical conditions, enabling better root growth and nutrient uptake by increasing the root biomass and distribution [67,68,69,70]. The increase in the root biomass creates larger concentrations of plant residues in the soil and ensures the better protection of the SOM against microbial decomposition [58,60]. In general, the larger the amounts of organic inputs is, as under NPKM, the higher the level of carbon sequestration is [71]. The C/N, TP, AN and AK increased fastest with the cultivation duration under NPKM (Figure 5h,j,l,n). These trends are also attributed to the greater N, P and K inputs from the manure and the added biomass [22,30,31,34]. In contrast, the deterioration of the soil properties (such as the reductions in pH and TP) which occurs when using sole mineral N fertilizer inhibits root and microbial activity, lowers crop productivity and leads to a reduction in the root biomass and, thus, C transfer to the soil [5].
The SOC increased less in the humid region than in the other regions, and its sharp increase in the arid region occurred under NPKM (Figure 3h). This is because of the low fertility of the arid region under the conditions of a lower mean annual temperature and precipitation [72,73,74], which leads to the greater effect of the fertilizer input. The increase in the SOC of unflooded crops was higher than that of flooded and unflooded–flooded crops (Figure 4e–h), which might be because of the initially higher SOC in the flooded as opposed to unflooded soils [75]. Nevertheless, the observed greater SOC sequestration potential in unflooded soils with a low C content is due to the fact that unflooded soils are further from the saturation level [76,77]. Long-term submergence can also result in the degradation of the soil quality through the breakdown of stable aggregates and deterioration of SOC, resulting in the reduction of C [78].
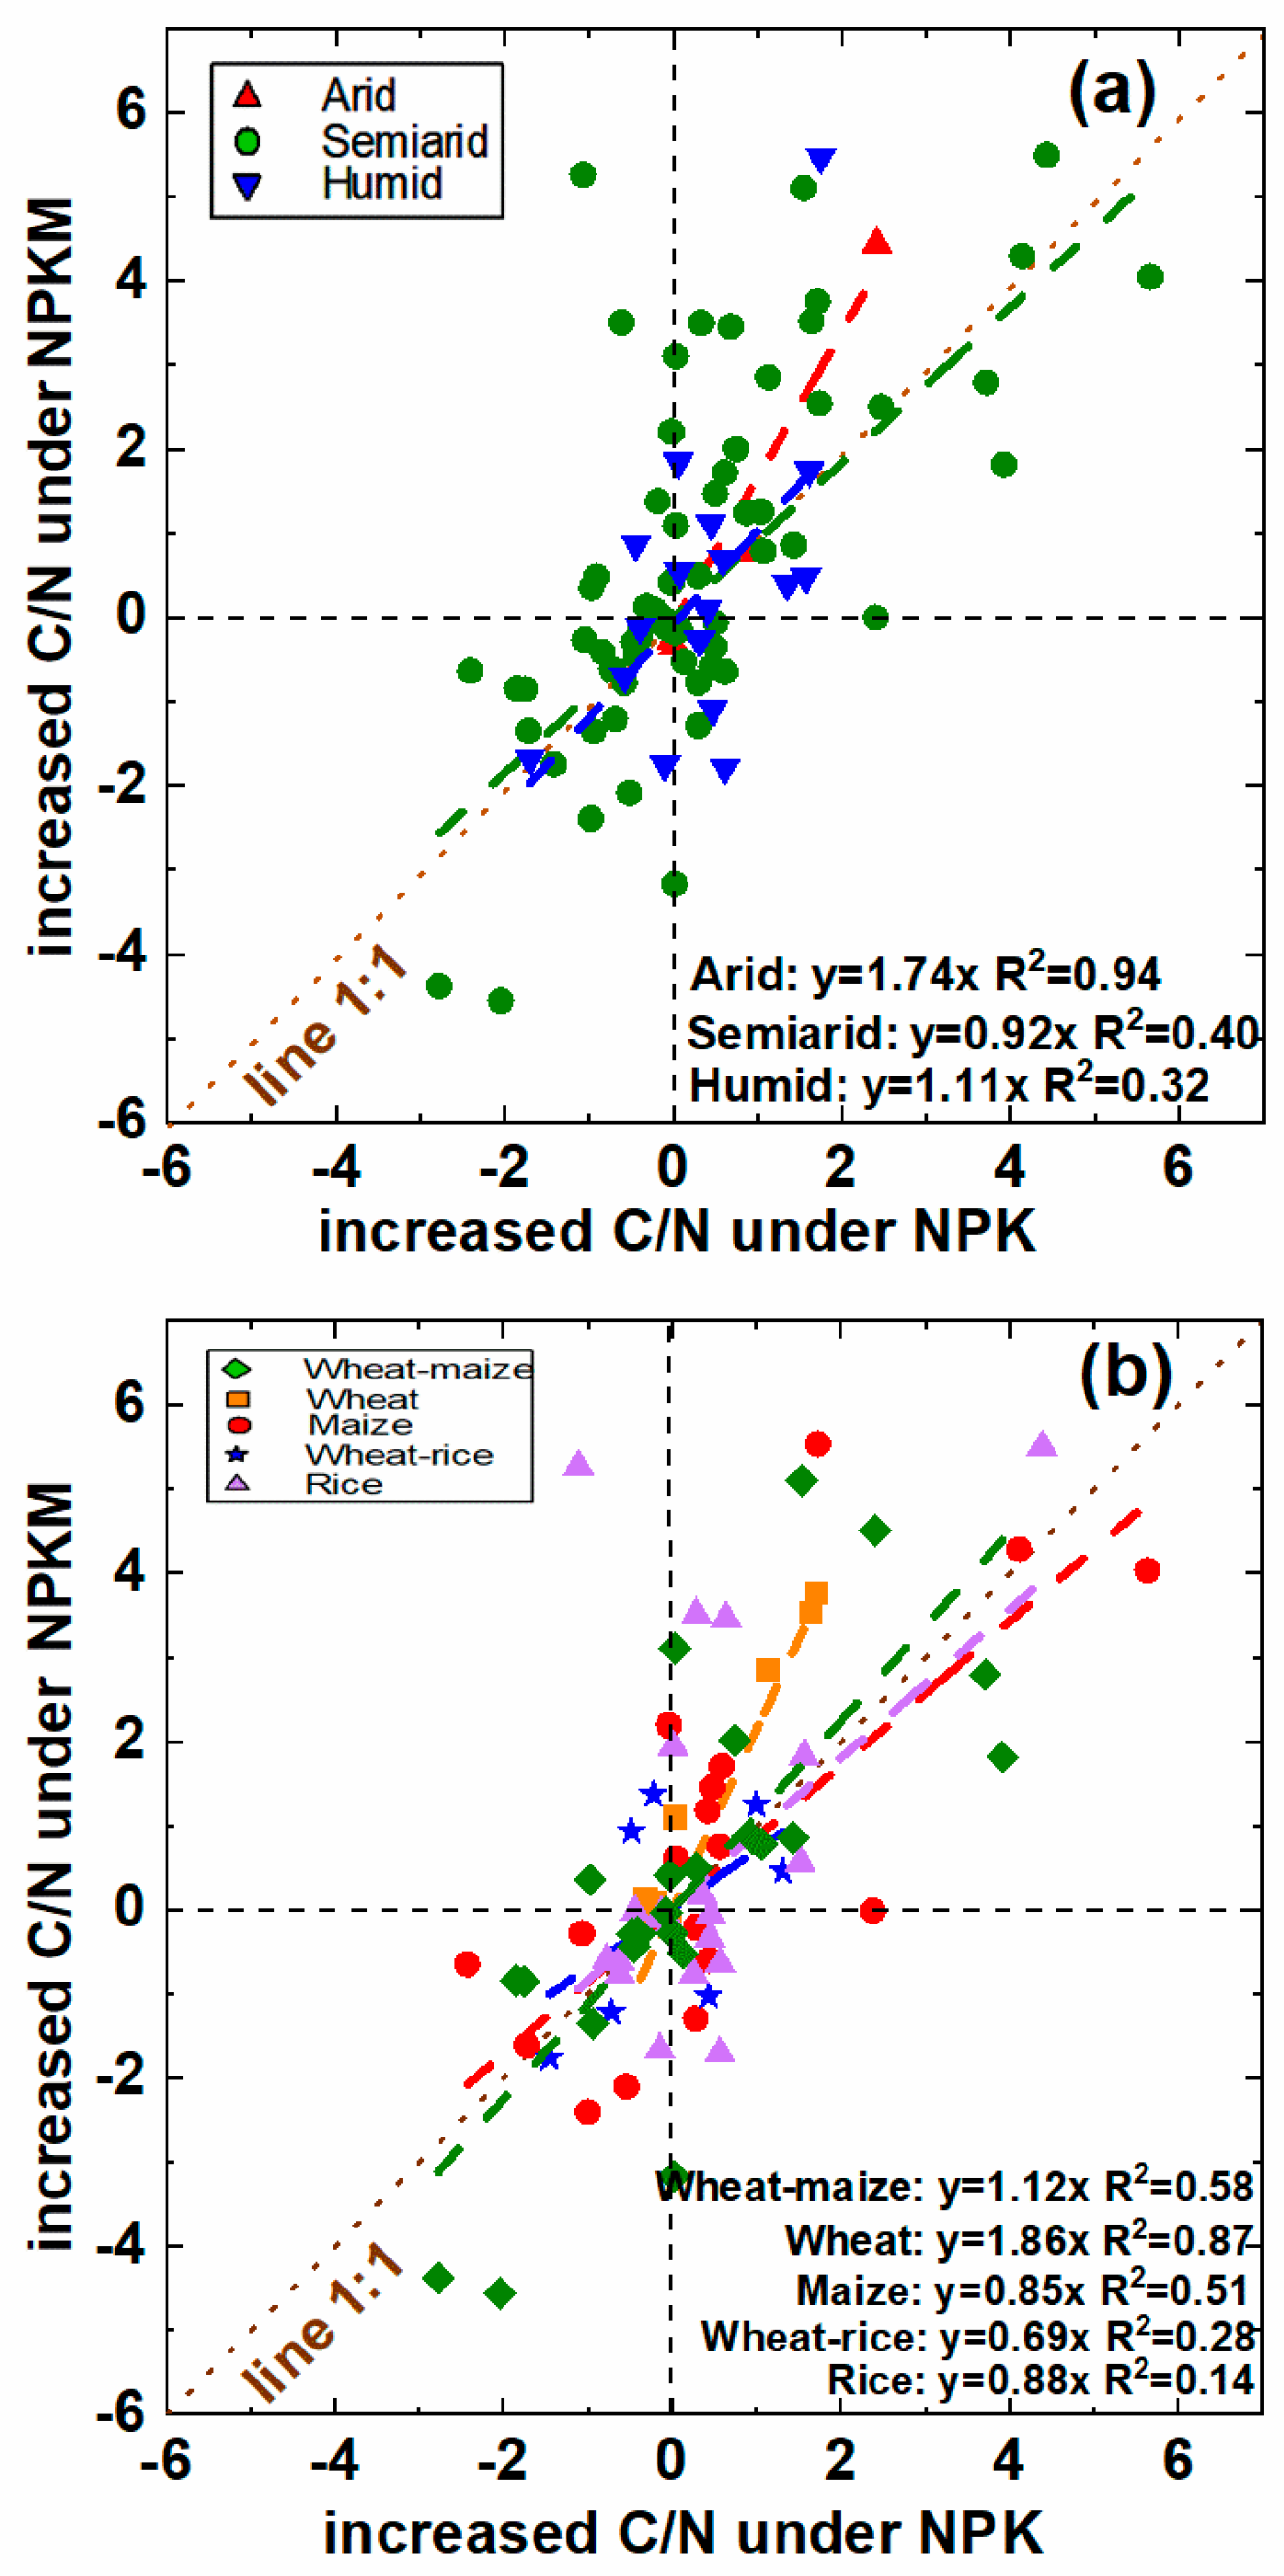
The regression analysis indicated that the increase in the C/N ratio under NPK was linearly correlated with NPKM in the HIs and crops type (Figure 8a,b). The C/N increased and reached a positive value after 20 years of cultivation under NPKM earlier than the other fertilizers (Figure 5). This trend showed that the application of manure had the greatest potential for C sequestration in agricultural soil [76,79]. NPKM increased C/N compared to NPK greatly in the arid region by 1.74 times. The C/N ratio increase under NPKM depending on the crop type was 1.86 times higher than that under NPK in wheat (Figure 8a,b). A higher C/N ratio than that acquired using the other fertilizers also showed the higher potential of NPKM for soil carbon storage. Moreover, the lower accumulated temperature and precipitation in arid regions reduce microbial activity, which inhibits the decomposition rate of SOM [80,81]. When the C/N ratio is higher, the N mineralization activity declines due to increased microbial N immobilization [75,82]. Furthermore, high C/N ratios are favorable for the accumulation of SOC [83]. Thus, manure is important for C sequestration and improving the soil quality in a wheat system in arid region. The same result was found in [79]. The lower C/N ratio accelerates the N mineralization rates, processes that cause greater N2O emissions and release NH4 through mineralization, thus indicating the likelihood of greater and faster N losses [20,84]. The NPK greatly decreased the C/N compared to NPKM in maize by 0.85 times, wheat–rice by 0.69 times and rice by 0.88 times (Figure 8b). Therefore, the manure fertilizer should be employed cautiously in rice, wheat–rice and maize because of the N loss penitential.
Fertilizers such as NPK, NPKS and NPKM increased the TP (Figure 2, Figure 3, Figure 4, Figure 5). This resulted from the immediate and greater P input provided by the mineral and organic P fertilizers [37] and a subsequent increase in microbial activity. A higher microbial activity accelerates phosphorous cycling [85]. The addition of organic fertilizers, particularly NPKS, led to lower TP than NPK (Figure 2e), which is due to the low P concentration in the straw, leading to increased microbial P immobilization [86]. The NPKM increased the P uptake by crops, reduced the accumulation of P in the soil and minimized the P loss [87]. Manure contains a large amount of organic P, which is released slowly and is beneficial for the soil quality and crops over the long term [87,88,89].
The soil AK decreases only with N (Figure 2f) but gradually increases via K fixation when K-containing fertilizers are applied (i.e., NPK, NPKS and NPKM) [35]. Manure addition led to the greatest AK increases compared to the other fertilizers. On the one hand, this is due to the slow release of K via manure decomposition over a longer period [90]. On the other hand, it is due to the additional K applied through NPKM, as well as the solubilizing action of certain organic acids produced during manure decomposition and their greater capacity to hold K in the available form [16]. AK increased more slowly in the humid than in the arid and semiarid regions (Figure 3u–x). Because of the intense leaching of K (and other base cations) and weathering in humid regions with more rainfall, the soil K content is decreased more strongly than in other regions [91]. The change in AK in unflooded crops was higher than that of flooded and unflooded–flooded crops (Figure 4u–x). This was due to the large area of paddy rice cultivation in the humid region.

4.2. The Interaction between the Soil Chemical Properties and Yield Depending on Climate and Crops Type

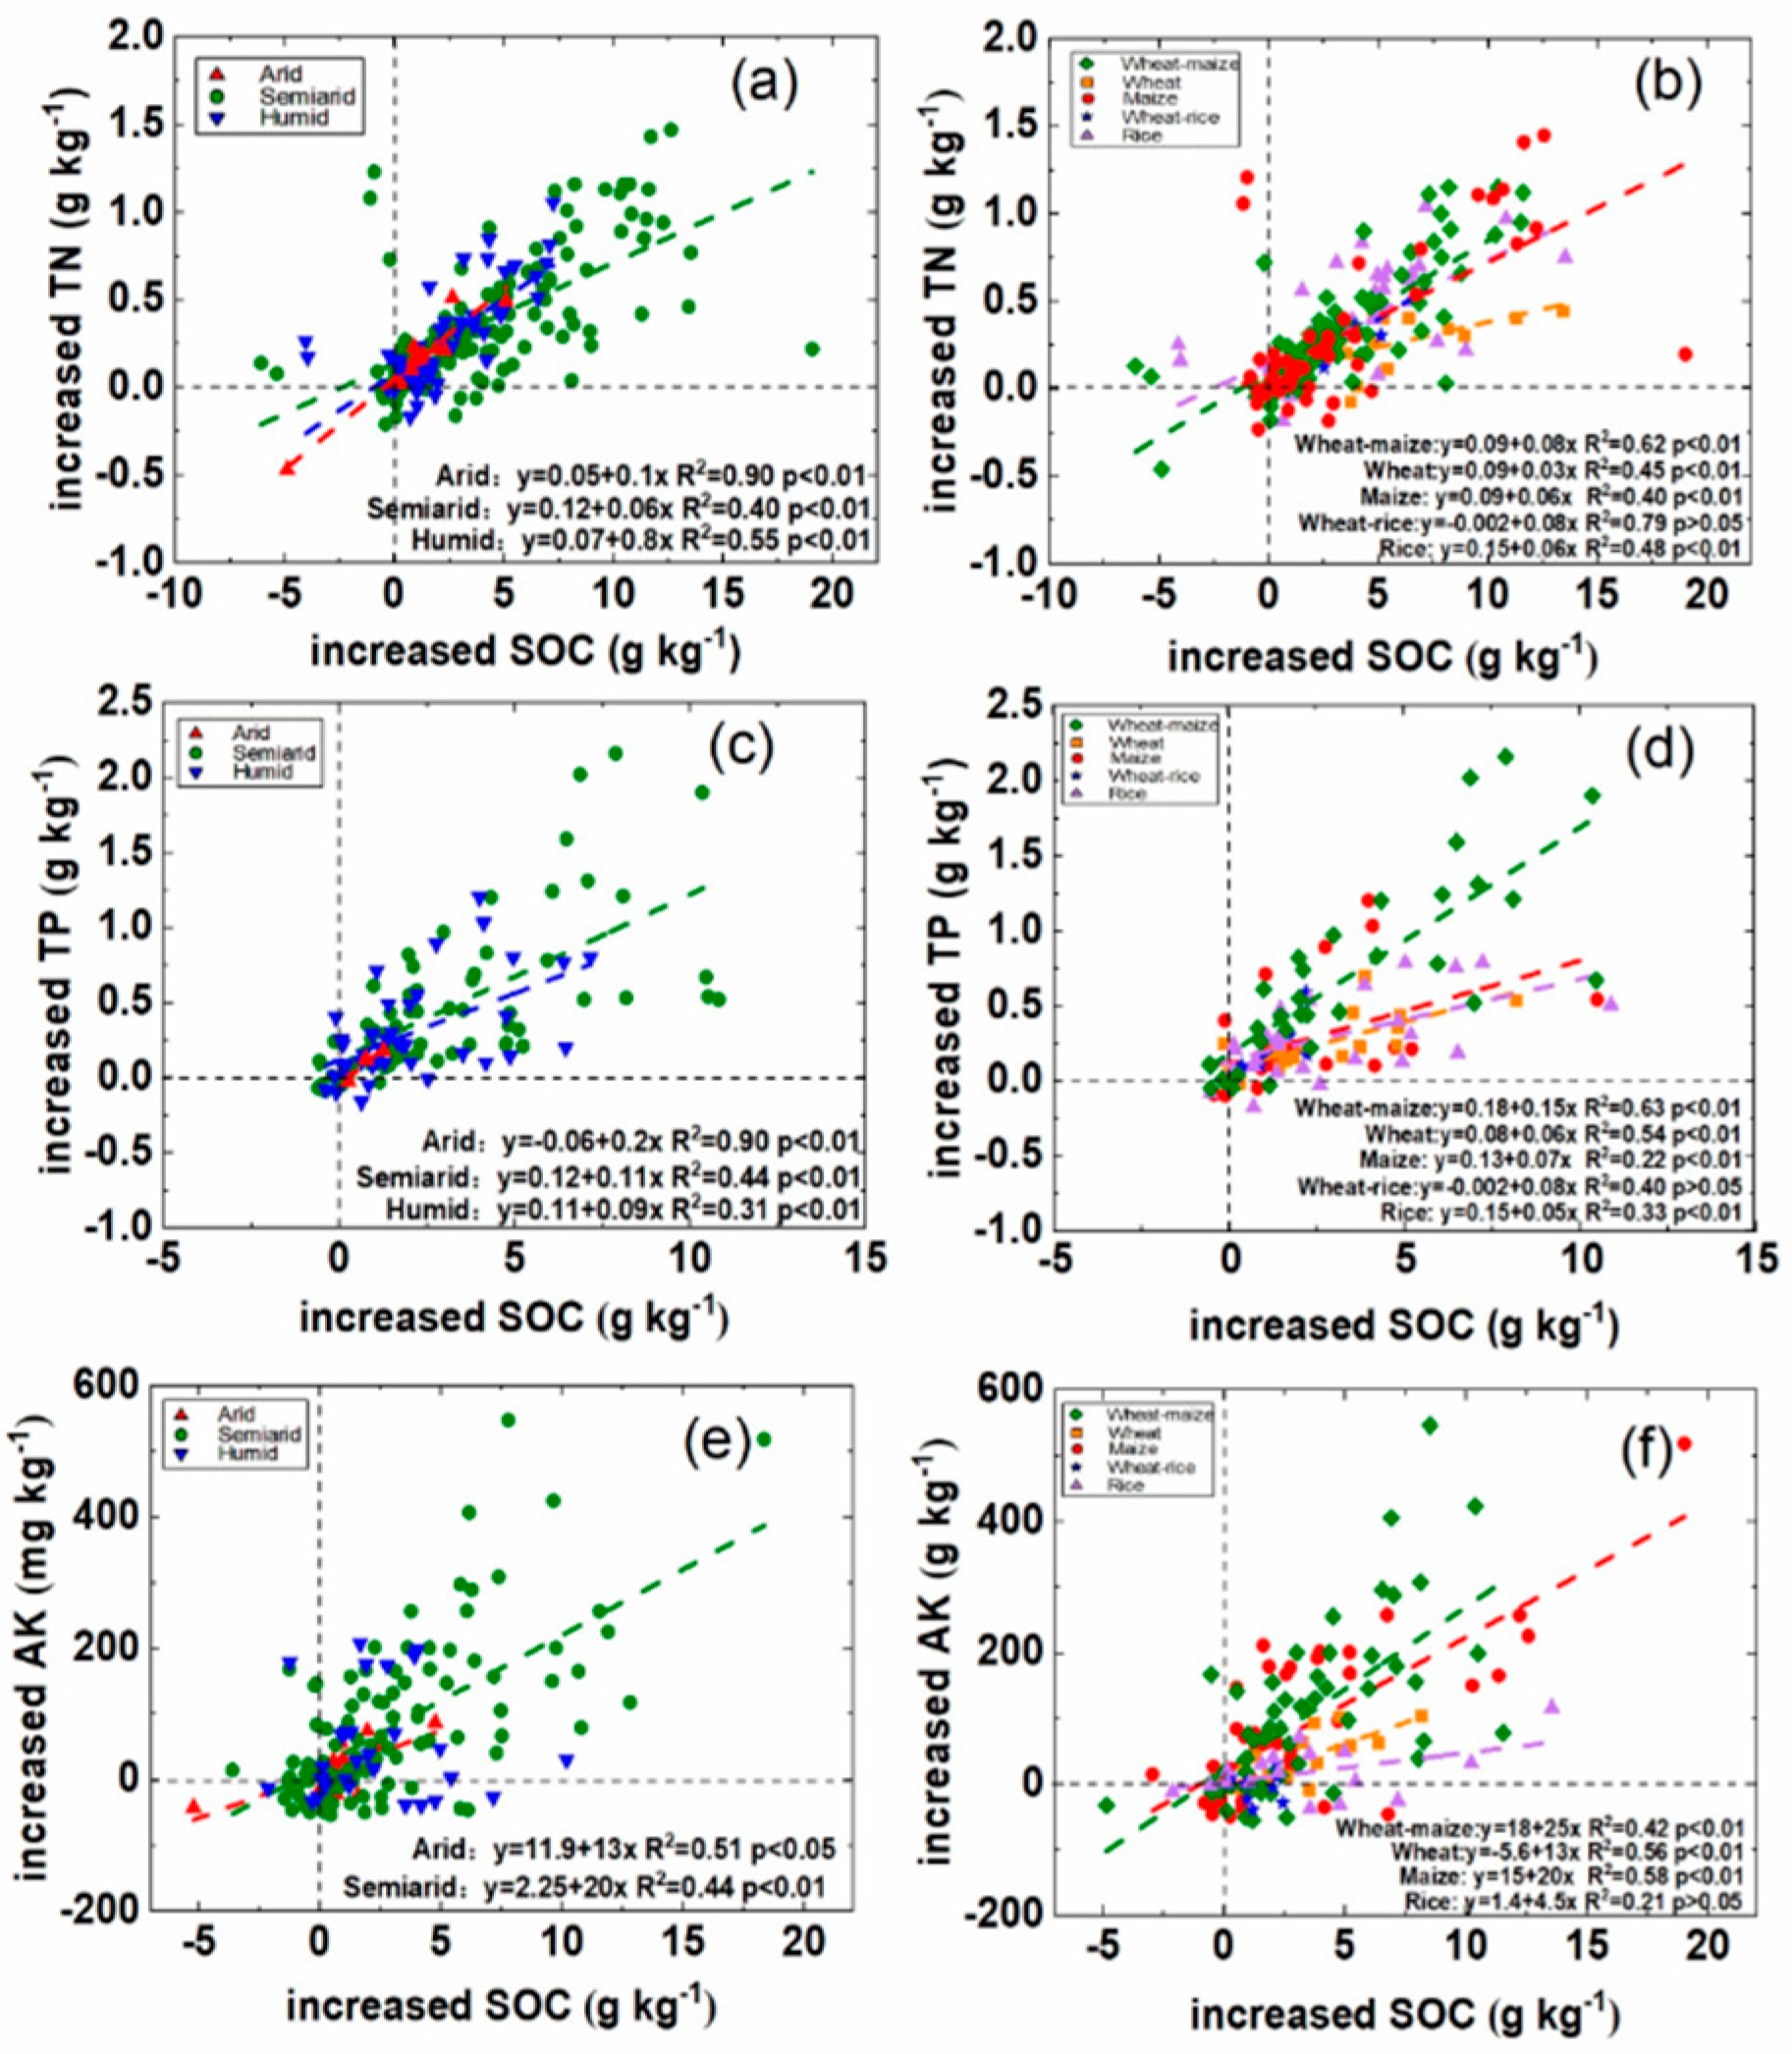
There were linear relationships between the increased SOC and TN following all fertilizer applications depending on the HIs and crops (Table 1, Figure 9a,b). N availability increases due to the enhanced availability of labile soil C [92]. Similarly, increasing the nitrogen content corresponded to a greater increment in SOC in the semiarid region and wheat cultivation compared to the other climates and crops (Figure 9a,b and Figure 7). Thus, N fertilizer in the semiarid regions used for wheat cultivation greatly increased the soil carbon storage and decreased the soil N loss. The same result was found in [83]. The SOC increased the most in the humid region used for wheat and rice cultivation when a similar increase in TP was observed (Figure 9c,d). Therefore, the capacity of carbon sequestration in soil is the strongest after P fertilizer used in wheat and rice cultivation. The SOC increased in the rice crop system more than the unflooded crops when a similar increase in AK was observed (Figure 9f). Hence, the application of K fertilizer to rice crop systems is conducive to the input of carbon.
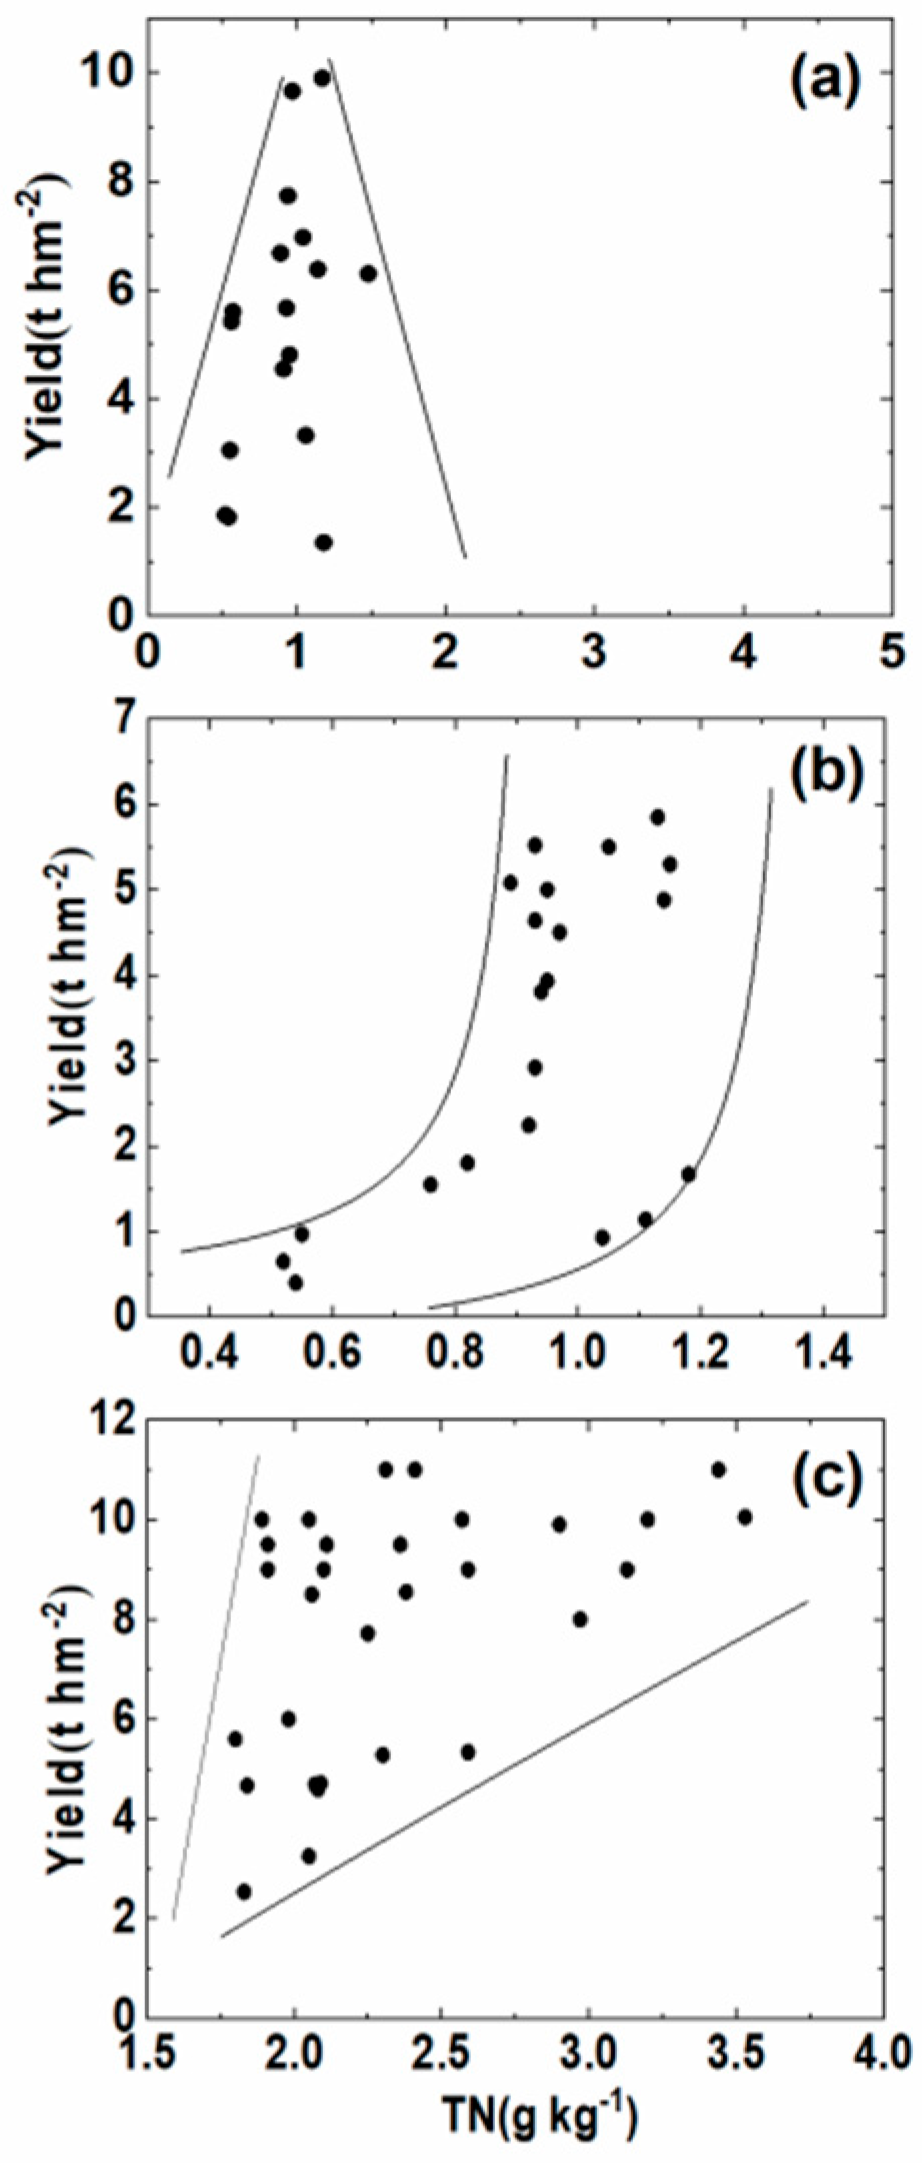
The ranges of the crop yield (t hm−2) were 1 to 10 (maize), 0.5 to 6 (wheat) and 2 to 11(rice) under different soil TN contents (Figure 10). The TN content (g kg−1) thresholds were 0.5 to 1.5 (maize), 0.5 to 1.2 (wheat) and 1.8 to 3.5 (rice), reaching maximum yields in maize (10 t hm−2), wheat (6 t hm−2) and rice (11 t hm−2), respectively (Figure 10). These impacts of the fertilizer on the increased soil and crop productivity have also been reported in previous studies [55,93,94,95,96]. It should also be noted that the crop yield could be increased with reduced fertilization.
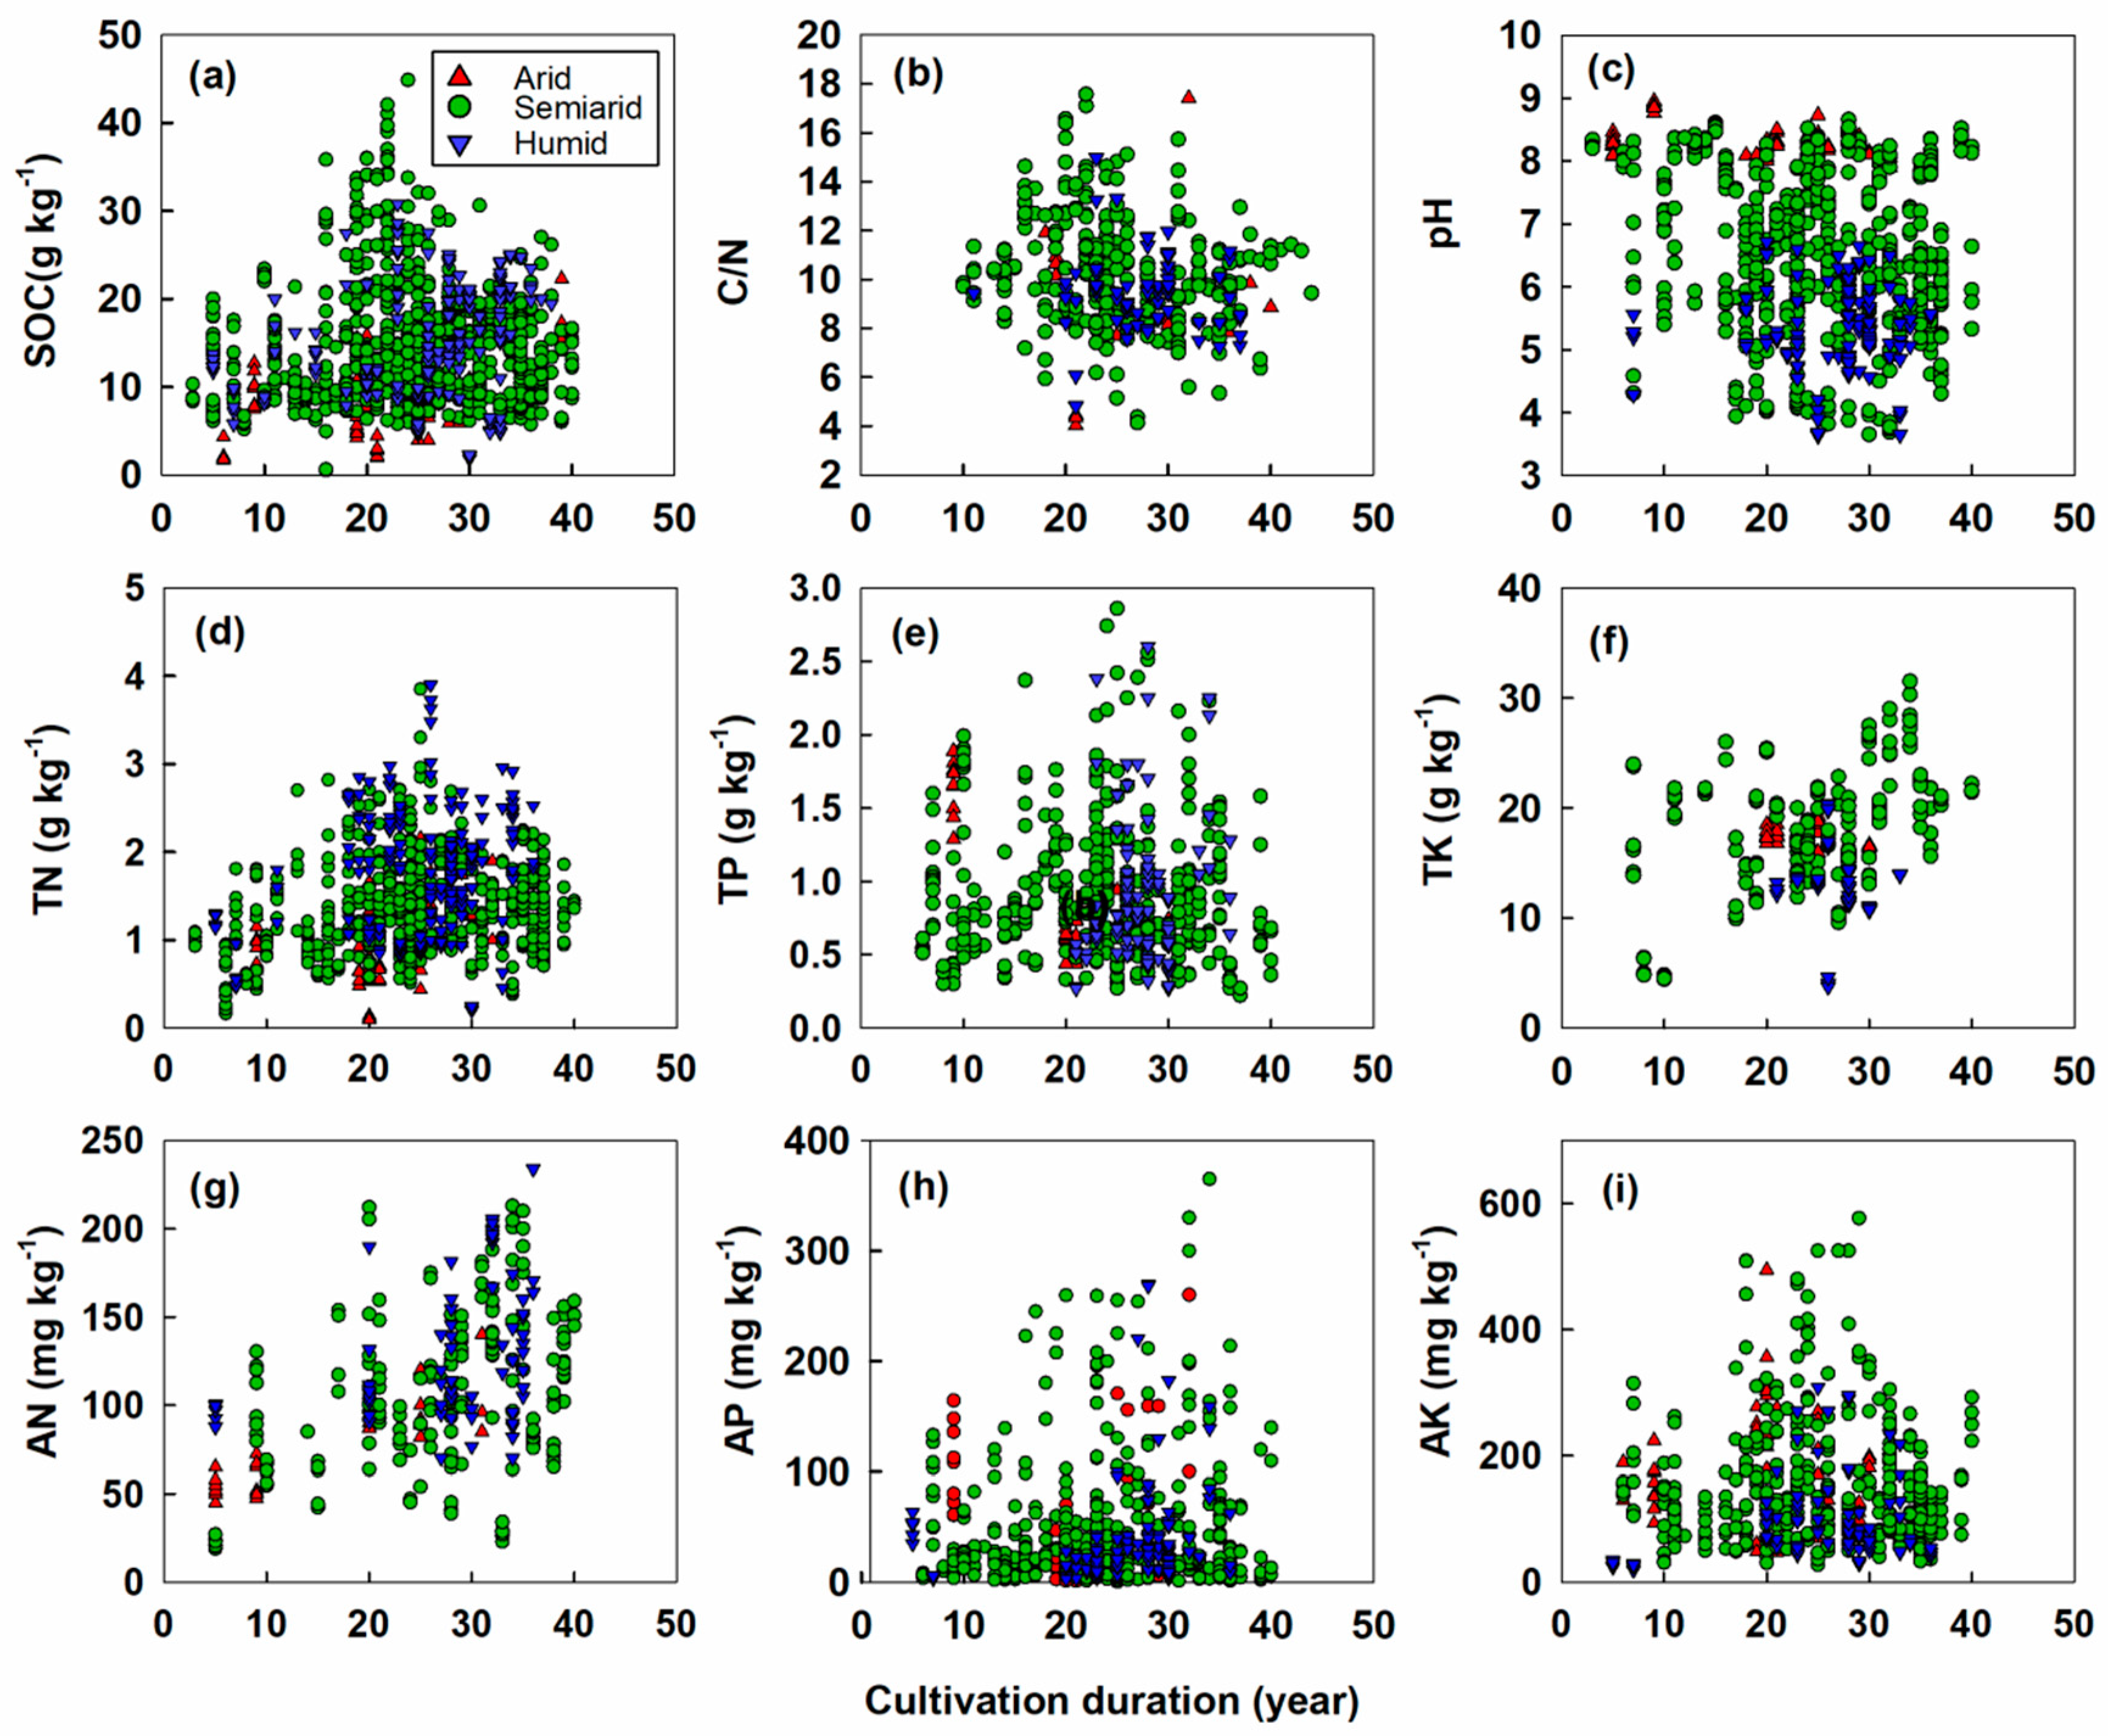
Fertilizer should be managed according to the soil fertility. Over-fertilization cannot guarantee continued increases in the yields [97], and extremely high fertilizer rates harm plants and reduce yields over a long time [97,98]. The TN content reached 4 g kg−1 after 25 years of cultivation, which is higher than the threshold required for the crop to reach the maximum yield (Figure 11d). Supplemental N addition exceeds the plant demands and constrains the plant growth [99]. The crop yields could be maintained at a higher level when the AP content was maintained at 10–40 mg kg−1. When the AP content in the plough layer was greater than 40 mg kg−1, the increase in the crop yield was not obvious, but the downward leaching of the soil AP was significantly enhanced [100]. Significantly, the AP content reached the maximum value (360 mg kg−1) after 35 years of cultivation in our study, and the risk of soil P leaching was higher (Figure 11h). The AK content reached the highest value of 600 mg kg−1 after 30 years of cultivation (Figure 11i). Excessive K fertilizer does not always enhance the grain yield, but rather promotes the loss of K leaching in the soil, resulting in resource waste and a low use efficiency [35,101]. Therefore, it is a win–win method of field management to reduce the chemical fertilizer and improve the yields [102]. On the other hand, the increased chemical fertilizer led to greenhouse gas emission problems [103]. As reduced chemical fertilizer use contributes to low carbon inputs and reduced greenhouse gas emissions, rational fertilizer contributes to the sustainability of agricultural development in the face of global warming.

4.3. Soil Texture and Its Modifying Effect on the Dynamics of Soil Chemical Properties over Long-Term Fertilization

The pH generally decreased in all the soil textures (Figure 6a–c). The increased pH was discovered in clayey soils after long-term fertilization (Figure 6c). This is most likely due to the presence of paddies in the dataset, where anaerobic conditions led directly to increased soil pH, for example, by ammonium production [104], or because of the commonly observed problem of poor drainage of clay soils, where the loss of basic cations due to leaching is limited.
There was a correlation (p < 0.05) between the soil texture and the SOC (Figure 6d–f) [105,106]. The increased SOC had the largest value (390%) after 19 years of cultivation in the sandy loam soils, earlier than that observed in the silt loam (26 years) and clay loam (25 years) soils (Figure 6d–f). The SOC in sandy loam soils decreased to 100% thereafter at a faster rate than the silt loam and clay loam soils over 28 years of cultivation (Figure 6d–f). Coarse textured soils may have a lower fertility, which results in a greater plant response to fertilizers [107] and an increase in biomass production and C input to the soil in the short term. On the other hand, a higher clay content enhances the SOM stability and soil resistance against erosion [108,109], leading to gradual SOC agglomeration, thus protecting SOC from biological mineralization [110]. Therefore, the C/N had a wide range in the clay loam soils, which was also related to the high water and nutrient retention capacity of clay (Figure 6i) [111]. The TN also significantly (p < 0.001) increased (−10% to 290%) with the cultivation duration in the sandy loam soils compared to silt loam and clay loam soils (Figure 6j–l). This is because sandy loam soils have a low resistance to wind erosion, which may lead to low soil nutrient contents [109]. Therefore, the TN content increased rapidly after fertilizer was applied to sandy loam soils.
The increased TP showed a continuous increase (p < 0.001) over the 35 years of cultivation in sandy loam soils but reached maximum values in the clay loam and silty loam soils after approximately 25 to 28 years (Figure 6m–o). TP can increase in sandy loam soils [112], especially in arid regions, where leaching is limited. In the studied soils, the accumulated TP in sandy soils was still lower than the maximum value in clay loam soils (Figure 6m–o). Since clay loam soils have better capacities for water and fertility retention than sandy soils [111,113], the TP reached the maximum value after 28 years of cultivation, in contrast to sandy loam soils, which was still far from the maximum value after 35 years of cultivation. The increased TK also showed the maximum value in clay loam soils compared to sandy loam and silt loam soils (Figure 6p–r). This is because of the higher K fixation capacity of hydrous mica, as clay minerals [114], as well as a relatively higher loss of K through leaching in sandy loam and silty loam soils [115].

4.4. Practical Fertilization Management for Sustainable Agriculture

A range of soil problems, such as acidification, nutrient loss and loss of biodiversity, occur due to unbalanced agricultural fertilization [7,17,116,117], leading to global concerns related to land degradation, food security and global warming [88]. We showed that natural (i.e., climatic conditions and soil texture) and anthropogenic (i.e., fertilizers, crop types and cultivation duration) factors influence soil chemical properties. By using boosted regression tree (BRT) analysis, we found that the cultivation duration was the best explanatory variable for the pH and TK, with values of 33% and 47%, respectively. The crop types were the best explanatory variable for the SOC and TN, with values of 36% and 37%, respectively, while the fertilizer explained 41% of the TP (Table 2). Furthermore, the HI and soil texture explained 12% and 19% of the soil pH, respectively (Table 2). In general, the anthropogenic factors, especially the cultivation duration, were more important for the observed changes in the soil chemical properties than the natural factors. This points to the fact that soils are developed through long-term agricultural practices [118], and the range of changes in the soil properties decreases or reaches a plateau over time (Figure 5). The initial soil properties or the climatic conditions may, however, control the period over which the changes in a given soil property reach a plateau.
Fertilizer strategies, such as the application of manure or straw along with mineral fertilizers instead of single fertilizers (e.g., only N), decrease the degradation of soil chemical properties (Figure 2 and Figure 7). For example, the work by retarding the acidification and increasing the SOC [119]. Therefore, the combination of fertilizer with organic fertilizers is a win–win strategy that can be used to improve the soil fertility and increase the yield, while preventing fast and degrading changes in the soil chemical properties.
All of these results clearly show that humans, through long-term agricultural practices, are the most causal factors in controlling the trajectories of changes in soil properties [118], although geographical and climatic conditions, as well as land management (e.g., the choice of crop, fertilizer strategy and irrigation), also control the rate of changes. Hence, attention should be given to the local climatic conditions, crop types and soil conditions before choosing a fertilizer management strategy, avoiding over-fertilization so as to prevent intense soil degradation and sustain crop production for a longer time.

5. Conclusions

The overuse of fertilizers causes reductions in the fertilizer use efficiency and various environmental problems, such as soil pollution, greenhouse gas emission and eutrophication, and threatens agricultural sustainability. To comprehensively study fertilization management over 35 years in China, our meta-analysis used 2058 data to reveal the effects of long-term fertilization on soil chemical properties (pH, SOC, TN, C/N, AN, TP, TK, and AK) depending on the fertilizer, climate, crop type, cultivation duration and soil texture. In our study, the NPKM (NPK fertilizer combined with manure) had the highest effects on the soil chemical properties, and the mineral N fertilizer had the lowest. The solely mineral fertilizers (i.e., N (pH decreased by 1 unit) and NPK (pH decreased by 0.55 units)) greatly and continuously decreased the soil pH over a period of approximately 35 years. However, NPKM increased the pH and reached the highest value (+0.2) between 26–30 years. The SOC and TN increased faster in soil treated with organic fertilizers compared to mineral fertilizers. Fertilizers in humid regions generally had the lowest effect on the increase in the SOC and TN, while the arid region showed the highest effect under NPKM. NPKM has a higher carbon sequestration potential in arid regions, where wheat was cultivated. The increase in the soil chemical properties was higher in unflooded crops, with the maximum value in the wheat–maize rotation, than flooded crops under NPKM. Fertilizers applied to sandy loam had a faster effect on the change in the SOC and TN. Fertilizers applied to clay loam had the highest and lowest effects on the changes in pH, C/N, TP and TK with the cultivation duration. The highest C sequestration potential was reached with the lowest increases in soil N in wheat and the lowest increases in the soil P and K in rice compared to the other crops. Therefore, a win–win field management strategy that reduces the use of mineral fertilizers and combines them with organic fertilizers (manure or straw), considering the plant demands, soil and crop types and climatic conditions, could be the best way of combatting agricultural soil deterioration (soil acidification, over-accumulation of N and P) after long-term cultivation in the face of global warming and environmental risks.

Author Contributions

Acquisition of data, analysis and interpretation of data, writing—original draft, visualization, S.J.; writing—review and editing, formal analysis, W.L., W.H., D.Y. and S.R.; funding acquisition, writing—review and editing, Y.K. and K.Z.; funding acquisition, writing—review and editing, conceptualization, resources, supervision, X.Z. All authors have read and agreed to the published version of the manuscript.

Funding

This research was funded by the National Natural Science Foundation of China (grant numbers 41877109, 42050410320 and 42150410386); the Jiangsu Specially Appointed Professor Project (grant number R2020T29); and the RUDN University Strategic Academic Leadership Program.

Data Availability Statement

Not applicable.

Conflicts of Interest

The authors declare that there are no known conflicts of interest that could affect this manuscript.

References

  1. FAO. Fao Databases. 2021. Available online: https://www.fao.org/faostat/en/#home (accessed on 5 June 2022).
  2. Roberts, T. The Role of Fertilizer in Growing the World’s Food. Better Crops 2009, 93, 12–15. [Google Scholar]
  3. Erisman, J.W.; Galloway, J.N.; Seitzinger, S.; Bleeker, A.; Dise, N.B.; Petrescu, A.R.; Leach, A.M.; de Vries, W. Consequences of Human Modification of the Global Nitrogen Cycle. Philos. Trans. R. Soc. B Biol. Sci. 2013, 368, 20130116. [Google Scholar] [CrossRef] [PubMed] [Green Version]
  4. Sánchez, P.A. Tripling Crop Yields in Tropical Africa. Nat. Geosci. 2010, 3, 299–300. [Google Scholar] [CrossRef]
  5. Liu, E.; Yan, C.; Mei, X.; Zhang, Y.; Fan, T. Long-Term Effect of Manure and Fertilizer on Soil Organic Carbon Pools in Dryland Farming in Northwest China. PLoS ONE 2013, 8, e56536. [Google Scholar] [CrossRef] [Green Version]
  6. Raza, S.; Miao, N.; Wang, P.; Ju, X.; Chen, Z.; Zhou, J.; Kuzyakov, Y. Dramatic Loss of Inorganic Carbon by Nitrogen-Induced Soil Acidification in Chinese Croplands. Glob. Chang. Biol. 2020, 26, 3738–3751. [Google Scholar] [CrossRef] [PubMed]
  7. Raza, S.; Zamanian, K.; Ullah, S.; Kuzyakov, Y.; Virto, I.; Zhou, J. Inorganic Carbon Losses by Soil Acidification Jeopardize Global Efforts on Carbon Sequestration and Climate Change Mitigation. J. Clean. Prod. 2021, 315, 128036. [Google Scholar] [CrossRef]
  8. Kuzyakov, Y.; Kuzyakova, I.; Raza, S.; Zhou, J.; Zamanian, K. To-the-Editor: Does Acidification Really Increase Soil Carbon in Croplands? How Statistical Analyses of Large Datasets Might Mislead the Conclusions. Geoderma 2021, 384, 114806. [Google Scholar] [CrossRef]
  9. Güsewell, S. N: P Ratios in Terrestrial Plants: Variation and Functional Significance. New Phytol. 2004, 164, 243–266. [Google Scholar] [CrossRef]
  10. Johnston, A.; Goulding, K.; Poulton, P. Soil Acidification During More Than 100 Years under Permanent Grassland and Woodland at Rothamsted. Soil Use Manag. 1986, 2, 3–10. [Google Scholar] [CrossRef]
  11. Lucas, R.; Klaminder, J.; Futter, M.; Bishop, K.H.; Egnell, G.; Laudon, H.; Högberg, P. A Meta-Analysis of the Effects of Nitrogen Additions on Base Cations: Implications for Plants, Soils, and Streams. For. Ecol. Manag. 2011, 262, 95–104. [Google Scholar] [CrossRef]
  12. Tian, D.; Niu, S. A Global Analysis of Soil Acidification Caused by Nitrogen Addition. Environ. Res. Lett. 2015, 10, 024019. [Google Scholar] [CrossRef]
  13. Guo, J.; Liu, X.; Zhang, Y.; Shen, J.; Han, W.; Zhang, W.; Christie, P.; Goulding, K.; Vitousek, P.; Zhang, F. Significant Acidification in Major Chinese Croplands. Science 2010, 327, 1008–1010. [Google Scholar] [CrossRef] [PubMed] [Green Version]
  14. Hao, T.; Zhu, Q.; Zeng, M.; Shen, J.; Shi, X.; Liu, X.; Zhang, F.; de Vries, W. Impacts of Nitrogen Fertilizer Type and Application Rate on Soil Acidification Rate under a Wheat-Maize Double Cropping System. J. Environ. Manag. 2020, 270, 110888. [Google Scholar] [CrossRef]
  15. Lu, X.; Mao, Q.; Gilliam, F.S.; Luo, Y.; Mo, J. Nitrogen Deposition Contributes to Soil Acidification in Tropical Ecosystems. Glob. Change Biol. 2014, 20, 3790–3801. [Google Scholar] [CrossRef] [Green Version]
  16. Yaduvanshi, N. Substitution of Inorganic Fertilizers by Organic Manures and the Effect on Soil Fertility in a Rice–Wheat Rotation on Reclaimed Sodic Soil in India. J. Agric. Sci. 2003, 140, 161–168. [Google Scholar] [CrossRef]
  17. Kinraide, T. Toxicity Factors in Acidic Forest Soils: Attempts to Evaluate Separately the Toxic Effects of Excessive Al3+ and H+ and Insufficient Ca2+ and Mg2+ Upon Root Elongation. Eur. J. Soil Sci. 2003, 54, 323–333. [Google Scholar] [CrossRef]
  18. Zamanian, K.; Zhou, J.; Kuzyakov, Y. Soil Carbonates: The Unaccounted, Irrecoverable Carbon Source. Geoderma 2021, 384, 114817. [Google Scholar] [CrossRef]
  19. Zamanian, K.; Kuzyakov, Y. Contribution of Soil Inorganic Carbon to Atmospheric Co2: More Important Than Previously Thought. Glob. Chang. Biol. 2019, 25, E1–E3. [Google Scholar] [CrossRef] [PubMed] [Green Version]
  20. Liu, S.; Wang, J.; Pu, S.; Blagodatskaya, E.; Kuzyakov, Y.; Razavi, B.S. Impact of Manure on Soil Biochemical Properties: A Global Synthesis. Sci. Total Environ. 2020, 745, 141003. [Google Scholar] [CrossRef]
  21. Ahmed, F.; Islam, M.; Rahman, M.M.; Bhuiyan, M.S.H.; Kader, M. Long Term Manuring and Fertilization Effect on Soil Properties in Terrace Soil. Asian Res. J. Agric. 2020, 13, 44–52. [Google Scholar] [CrossRef]
  22. Purakayastha, T.; Rudrappa, L.; Singh, D.; Swarup, A.; Bhadraray, S. Long-Term Impact of Fertilizers on Soil Organic Carbon Pools and Sequestration Rates in Maize–Wheat–Cowpea Cropping System. Geoderma 2008, 144, 370–378. [Google Scholar] [CrossRef]
  23. Powlson, D.; Bhogal, A.; Chambers, B.; Coleman, K.; Macdonald, A.; Goulding, K.; Whitmore, A. The Potential to Increase Soil Carbon Stocks through Reduced Tillage or Organic Material Additions in England and Wales: A Case Study. Agr. Ecosyst. Environ. 2012, 146, 23–33. [Google Scholar] [CrossRef]
  24. Zhao, X.; Othmanli, H.; Schiller, T.; Zhao, C.; Sheng, Y.; Zia, S.; Müller, J.; Stahr, K. Water Use Efficiency in Saline Soils under Cotton Cultivation in the Tarim River Basin. Water 2015, 7, 3103–3122. [Google Scholar] [CrossRef]
  25. Lee, S.B.; Lee, C.H.; Jung, K.Y.; Do Park, K.; Lee, D.; Kim, P.J. Changes of Soil Organic Carbon and Its Fractions in Relation to Soil Physical Properties in a Long-Term Fertilized Paddy. Soil Till Res. 2009, 104, 227–232. [Google Scholar] [CrossRef]
  26. Shen, H.; Cao, Z. Efrect of Long-Term Fertilization on Soil Available Carbon Pool and Available Ratio of Soil Carbon under Different Agroecosystems. Trop. Subtrop. Soil Sci. 1998, 7, 1–5, (In Chinese with English Abstract). [Google Scholar]
  27. Gong, W.; Yan, X.; Wang, J.; Hu, T.; Gong, Y. Long-Term Manuring and Fertilization Effects on Soil Organic Carbon Pools under a Wheat–Maize Cropping System in North China Plain. Plant Soil 2009, 314, 67–76. [Google Scholar] [CrossRef]
  28. Hai, L.; Li, X.; Li, F.; Suo, D.; Guggenberger, G. Long-Term Fertilization and Manuring Effects on Physically-Separated Soil Organic Matter Pools under a Wheat–Wheat–Maize Cropping System in an Arid Region of China. Soil Biol. Biochem. 2010, 42, 253–259. [Google Scholar] [CrossRef]
  29. Lou, Y.; Xu, M.; Wang, W.; Sun, X.; Liang, C. Soil Organic Carbon Fractions and Management Index after 20 Yr of Manure and Fertilizer Application for Greenhouse Vegetables. Soil Use Manag. 2011, 27, 163–169. [Google Scholar] [CrossRef]
  30. Cai, Z.; Qin, S. Dynamics of Crop Yields and Soil Organic Carbon in a Long-Term Fertilization Experiment in the Huang-Huai-Hai Plain of China. Geoderma 2006, 136, 708–715. [Google Scholar] [CrossRef]
  31. He, Y.; Zhang, W.; Xu, M.; Tong, X.; Sun, F.; Wang, J.; Huang, S.; Zhu, P.; He, X. Long-Term Combined Chemical and Manure Fertilizations Increase Soil Organic Carbon and Total Nitrogen in Aggregate Fractions at Three Typical Cropland Soils in China. Sci. Total Environ. 2015, 532, 635–644. [Google Scholar] [CrossRef] [PubMed]
  32. Zhang, W.; Xu, M.; Wang, B.; Wang, X. Soil Organic Carbon, Total Nitrogen and Grain Yields under Long-Term Fertilizations in the Upland Red Soil of Southern China. Nutr. Cycl. Agroecosyst. 2009, 84, 59–69. [Google Scholar] [CrossRef]
  33. Whalen, J.K.; Chang, C. Phosphorus Accumulation in Cultivated Soils from Long-Term Annual Applications of Cattle Feedlot Manure. J. Environ. Qual. 2001, 30, 229–237. [Google Scholar] [CrossRef] [PubMed]
  34. He, P.; Yang, L.; Xu, X.; Zhao, S.; Chen, F.; Li, S.; Tu, S.; Jin, J.; Johnston, A.M. Temporal and Spatial Variation of Soil Available Potassium in China (1990–2012). Field Crops Res. 2015, 173, 49–56. [Google Scholar] [CrossRef]
  35. Song, X.; Liu, F.; Wu, H.; Cao, Q.; Zhong, C.; Yang, J.; Li, D.; Zhao, Y.; Zhang, G. Effects of Long-Term K Fertilization on Soil Available Potassium in East China. Catena 2020, 188, 104412. [Google Scholar] [CrossRef]
  36. Ding, X.; Wei, C.; Wang, R.; Liao, X.; Li, S. Phosphorus Leaching Risk Assessment with Manure Fertilizer Application in South China. Bull. Environ. Contam. Toxicol. 2014, 93, 120–125. [Google Scholar] [CrossRef]
  37. Wei, K.; Bao, H.; Huang, S.; Chen, L. Effects of Long-Term Fertilization on Available P, P Composition and Phosphatase Activities in Soil from the Huang-Huai-Hai Plain of China. Agr. Ecosyst. Environ. 2017, 237, 134–142. [Google Scholar] [CrossRef]
  38. Ren, F.; Misselbrook, T.; Sun, N.; Zhang, X.; Zhang, S.; Jiao, J.; Xu, M.; Wu, L. Spatial Changes and Driving Variables of Topsoil Organic Carbon Stocks in Chinese Croplands under Different Fertilization Strategies. Sci. Total Environ. 2021, 767, 144350. [Google Scholar] [CrossRef]
  39. Su, Y.; Ma, X.F.; Gong, Y.M.; Li, K.H.; Han, W.X.; Liu, X.J. Responses and Drivers of Leaf Nutrients and Resorption to Nitrogen Enrichment across Northern China’s Grasslands: A Meta-Analysis. Catena 2021, 199, 105110. [Google Scholar] [CrossRef]
  40. Hedges, L.V.; Gurevitch, J.; Curtis, P.S. The Meta-Analysis of Response Ratios in Experimental Ecology. Ecology 1999, 80, 1150–1156. [Google Scholar] [CrossRef]
  41. Li, J.; Zou, B.Y.; Yeo, Y.H.; Feng, Y.M.; Xie, X.Y.; Lee, D.H.; Fujii, H.; Wu, Y.K.; Kam, L.Y.; Ji, F.P. Prevalence, Incidence, and Outcome of Non-Alcoholic Fatty Liver Disease in Asia, 1999–2019: A Systematic Review and Meta-Analysis. Lancet Gastroenterol. Hepatol. 2019, 4, 389–398. [Google Scholar] [CrossRef]
  42. Sha, Z.; Ma, X.; Wang, J.; Lv, T.; Li, Q.; Misselbrook, T.; Liu, X. Effect of N Stabilizers on Fertilizer-N Fate in the Soil-Crop System: A Meta-Analysis. Agr. Ecosyst. Environ. 2020, 290, 106763. [Google Scholar] [CrossRef]
  43. Barak, P.; Jobe, B.O.; Krueger, A.R.; Peterson, L.A.; Laird, D.A. Effects of Long-Term Soil Acidification Due to Nitrogen Fertilizer Inputs in Wisconsin. Plant Soil 1997, 197, 61–69. [Google Scholar] [CrossRef]
  44. Cai, Z.; Wang, B.; Xu, M.; Zhang, H.; He, X.; Zhang, L.; Gao, S. Intensified Soil Acidification from Chemical N Fertilization and Prevention by Manure in an 18-Year Field Experiment in the Red Soil of Southern China. J. Soils Sediments 2015, 15, 260–270. [Google Scholar] [CrossRef]
  45. Schroder, J.L.; Zhang, H.; Girma, K.; Raun, W.R.; Penn, C.J.; Payton, M.E. Soil Acidification from Long-Term Use of Nitrogen Fertilizers on Winter Wheat. Soil Sci. Soc. Am. J. 2011, 75, 957–964. [Google Scholar] [CrossRef]
  46. Stroia, C.; Morel, C.; Jouany, C. Nitrogen Fertilization Effects on Grassland Soil Acidification: Consequences on Diffusive Phosphorus Ions. Soil Sci. Soc. Am. J. 2011, 75, 112–120. [Google Scholar] [CrossRef]
  47. Aula, L.; Macnack, N.; Omara, P.; Mullock, J.; Raun, W. Effect of Fertilizer Nitrogen (N) on Soil Organic Carbon, Total N, and Soil Ph in Long-Term Continuous Winter Wheat (Triticum aestivum L.). Commun. Soil Sci. Plant Anal. 2016, 47, 863–874. [Google Scholar] [CrossRef]
  48. Divito, G.A.; Rozas, H.R.S.; Echeverría, H.E.; Studdert, G.A.; Wyngaard, N. Long Term Nitrogen Fertilization: Soil Property Changes in an Argentinean Pampas Soil under No Tillage. Soil Till. Res. 2011, 114, 117–126. [Google Scholar] [CrossRef]
  49. Cavallaro, N.; Padilla, N.; Villarrubia, J. Sewage Sludge Effects on Chemical Properties of Acid Soils. Soil Sci. 1993, 156, 63–70. [Google Scholar] [CrossRef]
  50. Eghball, B. Liming Effects of Beef Cattle Feedlot Manure or Compost. Commun. Soil Sci. Plant Anal. 1999, 30, 2563–2570. [Google Scholar] [CrossRef]
  51. Huang, S.; Zhang, W.; Yu, X.; Huang, Q. Effects of Long-Term Fertilization on Corn Productivity and Its Sustainability in an Ultisol of Southern China. Agr. Ecosyst. Environ. 2010, 138, 44–50. [Google Scholar] [CrossRef]
  52. Sun, R.; Zhang, X.; Guo, X.; Wang, D.; Chu, H. Bacterial Diversity in Soils Subjected to Long-Term Chemical Fertilization Can Be More Stably Maintained with the Addition of Livestock Manure Than Wheat Straw. Soil Biol. Biochem. 2015, 88, 9–18. [Google Scholar] [CrossRef]
  53. Zhong, W.; Gu, T.; Wang, W.; Zhang, B.; Lin, X.; Huang, Q.; Shen, W. The Effects of Mineral Fertilizer and Organic Manure on Soil Microbial Community and Diversity. Plant Soil 2010, 326, 511–522. [Google Scholar] [CrossRef]
  54. Jugsujinda, A.; Patrick Jr, W. Growth and Nutrient Uptake by Rice in a Flooded Soil under Controlled Aerobic-Anaerobic and Ph Conditions1. Agron. J. 1977, 69, 705–710. [Google Scholar] [CrossRef]
  55. Yang, Z.; Hu, Y.; Zhang, S.; Raza, S.; Wei, X.; Zhao, X. The Thresholds and Management of Irrigation and Fertilization Earning Yields and Water Use Efficiency in Maize, Wheat, and Rice in China: A Meta-Analysis (1990–2020). Agronomy 2022, 12, 709. [Google Scholar] [CrossRef]
  56. Dong, X.; Hao, Q.; Li, G.; Lin, Q.; Zhao, X. Contrast Effect of Long-Term Fertilization on Soc and Sic Stocks and Distribution in Different Soil Particle-Size Fractions. J. Soils Sediments 2017, 17, 1054–1063. [Google Scholar] [CrossRef]
  57. Sleutel, S.; De Neve, S.; Németh, T.; Tóth, T.; Hofman, G. Effect of Manure and Fertilizer Application on the Distribution of Organic Carbon in Different Soil Fractions in Long-Term Field Experiments. Eur. J. Agron. 2006, 25, 280–288. [Google Scholar] [CrossRef]
  58. Anastasiou, E.; Lorentz, K.O.; Stein, G.J.; Mitchell, P.D. Prehistoric Schistosomiasis Parasite Found in the Middle East. Lancet Infect. Dis. 2014, 14, 553–554. [Google Scholar] [CrossRef]
  59. Huang, F.; Ding, X.; Li, W.; Jia, H.; Wei, X.; Zhao, X. The Effect of Temperature on the Decomposition of Different Parts of Maize Residues in a Solonchak. Catena 2021, 201, 105207. [Google Scholar] [CrossRef]
  60. Jastrow, J.D.; Amonette, J.E.; Bailey, V.L. Mechanisms Controlling Soil Carbon Turnover and Their Potential Application for Enhancing Carbon Sequestration. Clim. Chang. 2007, 80, 5–23. [Google Scholar] [CrossRef]
  61. Zhao, B.; Chen, J.; Zhang, J.; Xin, X.; Hao, X. How Different Long-Term Fertilization Strategies Influence Crop Yield and Soil Properties in a Maize Field in the North China Plain. J. Plant Nutr. Soil Sci. 2013, 176, 99–109. [Google Scholar] [CrossRef]
  62. Bonanomi, G.; De Filippis, F.; Zotti, M.; Idbella, M.; Cesarano, G.; Al-Rowaily, S.; Abd-ElGawad, A. Repeated Applications of Organic Amendments Promote Beneficial Microbiota, Improve Soil Fertility and Increase Crop Yield. Appl. Soil Ecol. 2020, 156, 103714. [Google Scholar] [CrossRef]
  63. Van Eekeren, N.; De Boer, H.; Bloem, J.; Schouten, T.; Rutgers, M.; De Goede, R.; Brussaard, L. Soil Biological Quality of Grassland Fertilized with Adjusted Cattle Manure Slurries in Comparison with Organic and Inorganic Fertilizers. Biol. Fertil. Soils 2009, 45, 595–608. [Google Scholar] [CrossRef]
  64. Chaudhry, V.; Rehman, A.; Mishra, A.; Chauhan, P.S.; Nautiyal, C.S. Changes in Bacterial Community Structure of Agricultural Land Due to Long-Term Organic and Chemical Amendments. Microb. Ecol. 2012, 64, 450–460. [Google Scholar] [CrossRef]
  65. Liu, Q.; Xu, H.; Yi, H. Impact of Fertilizer on Crop Yield and C:N: P Stoichiometry in Arid and Semi-Arid Soil. Int. J. Environ. Res. Public. Health 2021, 18, 4341. [Google Scholar] [CrossRef]
  66. Choudhary, M.; Meena, V.S.; Panday, S.C.; Mondal, T.; Yadav, R.P.; Mishra, P.K.; Bisht, J.K.; Pattanayak, A. Long-Term Effects of Organic Manure and Inorganic Fertilization on Biological Soil Quality Indicators of Soybean-Wheat Rotation in the Indian Mid-Himalaya. Appl. Soil Ecol. 2021, 157, 103754. [Google Scholar] [CrossRef]
  67. Chai, Y.; Ma, S.; Zeng, X.; E, S.; Che, Z.; Li, L.; Duan, R.; Su, S. Long-Term Fertilization Effects on Soil Organic Carbon Stocks in the Irrigated Desert Soil of Nw China. J. Plant Nutr. Soil Sci. 2015, 178, 622–630. [Google Scholar] [CrossRef]
  68. Kukal, S.; Benbi, D. Soil Organic Carbon Sequestration in Relation to Organic and Inorganic Fertilization in Rice–Wheat and Maize–Wheat Systems. Soil Till. Res. 2009, 102, 87–92. [Google Scholar] [CrossRef]
  69. Tong, X.; Xu, M.; Wang, X.; Bhattacharyya, R.; Zhang, W.; Cong, R. Long-Term Fertilization Effects on Organic Carbon Fractions in a Red Soil of China. Catena 2014, 113, 251–259. [Google Scholar] [CrossRef]
  70. Zhao, X.; Hu, K.; Stahr, K. Simulation of Soc Content and Storage under Different Irrigation, Fertilization and Tillage Conditions Using Epic Model in the North China Plain. Soil Till. Res. 2013, 130, 128–135. [Google Scholar] [CrossRef]
  71. Singh Brar, B.; Singh, J.; Singh, G.; Kaur, G. Effects of Long Term Application of Inorganic and Organic Fertilizers on Soil Organic Carbon and Physical Properties in Maize–Wheat Rotation. Agronomy 2015, 5, 220–238. [Google Scholar] [CrossRef] [Green Version]
  72. Blair, N.; Faulkner, R.D.; Till, A.R.; Korschens, M.; Schulz, E. Long-Term Management Impacts on Soil C, N and Physical Fertility: Part Ii: Bad Lauchstadt Static and Extreme Fym Experiments. Soil Till. Res. 2006, 91, 39–47. [Google Scholar] [CrossRef]
  73. Huang, S.; Pan, X.; Guo, J.; Qian, C.; Zhang, W. Differences in Soil Organic Carbon Stocks and Fraction Distributions between Rice Paddies and Upland Cropping Systems in China. J. Soils Sediments 2014, 14, 89–98. [Google Scholar] [CrossRef]
  74. Li, Y.; Zhang, X.; Ren, F.; Sun, N.; Xu, M.; Xu, M. A Meta-Analysis of Long-Term Fertilization Impact on Soil Dissolved Organic Carbon and Nitrogen across Chinese Cropland Scientia. Agric. Sin. 2020, 53, 224–1233, (In Chinese with English Abstract). [Google Scholar]
  75. Hu, Y.; Wang, L.; Chen, F.; Ren, X.; Tan, Z. Soil Carbon Sequestration Efficiency under Continuous Paddy Rice Cultivation and Excessive Nitrogen Fertilization in South China. Soil Till. Res. 2021, 213, 105108. [Google Scholar] [CrossRef]
  76. Tian, K.; Zhao, Y.; Xu, X.; Hai, N.; Huang, B.; Deng, W. Effects of Long-Term Fertilization and Residue Management on Soil Organic Carbon Changes in Paddy Soils of China: A Meta-Analysis. Agr Ecosyst. Environ. 2015, 204, 40–50. [Google Scholar] [CrossRef]
  77. Li, P.; Li, Y.; Xu, L.; Zhang, H.; Shen, X.; Xu, H.; Jiao, J.; Li, H.; Hu, F. Crop Yield-Soil Quality Balance in Double Cropping in China’s Upland by Organic Amendments: A Meta-Analysis. Geoderma 2021, 403, 115197. [Google Scholar] [CrossRef]
  78. Zhang, T.; Chen, A.; Liu, J.; Liu, H.; Lei, B.; Zhai, L.; Zhang, D.; Wang, H. Cropping Systems Affect Paddy Soil Organic Carbon and Total Nitrogen Stocks (in Rice-Garlic and Rice-Fava Systems) in Temperate Region of Southern China. Sci. Total Environ. 2017, 609, 1640–1649. [Google Scholar] [CrossRef]
  79. Liang, Q.; Chen, H.; Gong, Y.; Fan, M.; Yang, H.; Lal, R.; Kuzyakov, Y. Effects of 15 Years of Manure and Inorganic Fertilizers on Soil Organic Carbon Fractions in a Wheat-Maize System in the North China Plain. Nutr. Cycl. Agroecosyst. 2012, 92, 21–33. [Google Scholar] [CrossRef]
  80. Cong, R.; Wang, X.; Xu, M.; Zhang, W.; Xie, L.; Yang, X.; Huang, S.; Wang, B. Dynamics of Soil Carbon to Nitrogen Ratio Changes under Long-Term Fertilizer Addition in Wheat-Corn Double Cropping Systems of China. Eur. J. Soil Sci. 2012, 63, 341–350. [Google Scholar] [CrossRef]
  81. Bolinder, M.A.; Andrén, O.; Kätterer, T.; de Jong, R.; VandenBygaart, A.J.; Angers, D.A.; Parent, L.E.; Gregorich, E.G. Soil Carbon Dynamics in Canadian Agricultural Ecoregions: Quantifying Climatic Influence on Soil Biological Activity. Agr. Ecosyst. Environ. 2007, 122, 461–470. [Google Scholar] [CrossRef]
  82. Li, Y.; Wu, J.; Shen, J.; Liu, S.; Wang, C.; Chen, D.; Huang, T.; Zhang, J. Soil Microbial C: N Ratio Is a Robust Indicator of Soil Productivity for Paddy Fields. Sci. Rep. 2016, 6, 1–8. [Google Scholar] [CrossRef] [Green Version]
  83. Tong, C.; Xiao, H.; Tang, G.; Wang, H.; Huang, T.; Xia, H.; Keith, S.J.; Li, Y.; Liu, S.; Wu, J. Long-Term Fertilizer Effects on Organic Carbon and Total Nitrogen and Coupling Relationships of C and N in Paddy Soils in Subtropical China. Soil Till. Res. 2009, 106, 8–14. [Google Scholar] [CrossRef]
  84. Huang, Y.; Zou, J.; Zheng, X.; Wang, Y.; Xu, X. Nitrous Oxide Emissions as Influenced by Amendment of Plant Residues with Different C: N Ratios. Soil Biol. Biochem. 2004, 36, 973–981. [Google Scholar] [CrossRef]
  85. Parham, J.; Deng, S.; Raun, W.; Johnson, G. Long-Term Cattle Manure Application in Soil. Biol. Fertil. Soils 2002, 35, 328–337. [Google Scholar]
  86. Nziguheba, G.; Merckx, R.; Palm, C.A.; Rao, M.R. Organic Residues Affect Phosphorus Availability and Maize Yields in a Nitisol of Western Kenya. Biol. Fertil. Soils 2000, 32, 328–339. [Google Scholar] [CrossRef]
  87. Mao, X.; Xu, X.; Lu, K.; Gielen, G.; Luo, J.; He, L.; Donnison, A.; Xu, Z.; Xu, J.; Yang, W. Effect of 17 Years of Organic and Inorganic Fertilizer Applications on Soil Phosphorus Dynamics in a Rice–Wheat Rotation Cropping System in Eastern China. J. Soils Sediments 2015, 15, 1889–1899. [Google Scholar] [CrossRef]
  88. Zhang, X.; Dong, W.; Dai, X.; Schaeffer, S.; Yang, F.; Radosevich, M.; Xu, L.; Liu, X.; Sun, X. Responses of Absolute and Specific Soil Enzyme Activities to Long Term Additions of Organic and Mineral Fertilizer. Sci. Total Environ. 2015, 536, 59–67. [Google Scholar] [CrossRef]
  89. Bi, L.; Zhang, B.; Liu, G.; Li, Z.; Liu, Y.; Ye, C.; Yu, X.; Lai, T.; Zhang, J.; Yin, J. Long-Term Effects of Organic Amendments on the Rice Yields for Double Rice Cropping Systems in Subtropical China. Agr. Ecosyst. Environ. 2009, 129, 534–541. [Google Scholar] [CrossRef]
  90. Zhang, Y.; Shen, H.; He, X.; Thomas, B.W.; Lupwayi, N.Z.; Hao, X.; Thomas, M.C.; Shi, X. Fertilization Shapes Bacterial Community Structure by Alteration of Soil Ph. Front Microbiol. 2017, 8, 1325. [Google Scholar] [CrossRef] [PubMed] [Green Version]
  91. Xie, J.; Zhou, J. History and Prospects of Potash Application in China. Electron. Int. Fertil. Corresp. 2012, 32, 19–27. [Google Scholar]
  92. Deng, L.; Peng, C.; Kim, D.-G.; Li, J.; Liu, Y.; Hai, X.; Liu, Q.; Huang, C.; Shangguan, Z.; Kuzyakov, Y. Drought Effects on Soil Carbon and Nitrogen Dynamics in Global Natural Ecosystems. Earth Sci. Rev. 2021, 214, 103501. [Google Scholar] [CrossRef]
  93. Cai, A.; Zhang, W.; Xu, M.; Wang, B.; Wen, S.; Shah, S.A.A. Soil Fertility and Crop Yield after Manure Addition to Acidic Soils in South China. Nutr. Cycl. Agroecosyst. 2018, 111, 61–72. [Google Scholar] [CrossRef]
  94. Mustafa, A.; Hu, X.; Abrar, M.M.; Shah, S.A.A.; Nan, S.; Saeed, Q.; Kamran, M.; Naveed, M.; Conde-Cid, M.; HongJun, G. Long-Term Fertilization Enhanced Carbon Mineralization and Maize Biomass through Physical Protection of Organic Carbon in Fractions under Continuous Maize Cropping. Appl. Soil Ecol. 2021, 165, 103971. [Google Scholar] [CrossRef]
  95. Xie, J.; Peng, B.; Wang, R.; Batbayar, J.; Hoogmoed, M.; Yang, Y.; Zhang, S.; Yang, X.; Sun, B. Responses of Crop Productivity and Physical Protection of Organic Carbon by Macroaggregates to Long-Term Fertilization of an Anthrosol. Eur. J. Soil Sci. 2018, 69, 555–567. [Google Scholar] [CrossRef]
  96. Xu, M.; Li, D.; Li, J.; Qin, D.; Kazuyuki, Y.; Hosen, Y. Effects of Organic Manure Application with Chemical Fertilizers on Nutrient Absorption and Yield of Rice in Hunan of Southern China. Agr. Sci. China 2008, 7, 1245–1252. [Google Scholar] [CrossRef]
  97. Albornoz, F. Crop Responses to Nitrogen Overfertilization: A Review. Sci. Hortic. 2016, 205, 79–83. [Google Scholar] [CrossRef]
  98. Wang, Z.; Li, S. Effects of Nitrogen and Phosphorus Fertilization on Plant Growth and Nitrate Accumulation in Vegetables. J. Plant Nutr. 2004, 27, 539–556. [Google Scholar] [CrossRef]
  99. Li, Y.; Niu, S.; Yu, G. Aggravated Phosphorus Limitation on Biomass Production under Increasing Nitrogen Loading: A Meta-Analysis. Glob. Change Biol. 2016, 22, 934–943. [Google Scholar] [CrossRef] [PubMed]
  100. Huang, S.; Guo, D.; Zhang, S. Effects of Long-Term Application of Organic Fertilizer and Superphosphate on Accumulation and Leaching of Olsen-P in Fluvo-Aquic Soil. Yingyong Shengtai Xuebao 2011, 22, 93–98, (In Chinese with English Abstract). [Google Scholar] [PubMed]
  101. Zhan, A.; Zou, C.; Ye, Y.; Liu, Z.; Cui, Z.; Chen, X. Estimating on-Farm Wheat Yield Response to Potassium and Potassium Uptake Requirement in China. Field Crops Res. 2016, 191, 13–19. [Google Scholar] [CrossRef]
  102. Zhang, H.; Wang, B.; Xu, M.; Fan, T. Crop Yield and Soil Responses to Long-Term Fertilization on a Red Soil in Southern China. Pedosphere 2009, 19, 199–207. [Google Scholar] [CrossRef]
  103. Ju, X.; Xing, G.; Chen, X.; Zhang, S.; Zhang, L.; Liu, X.; Cui, Z.; Yin, B.; Christie, P.; Zhu, Z. Reducing Environmental Risk by Improving N Management in Intensive Chinese Agricultural Systems. Proc. Natl. Acad. Sci. USA 2009, 106, 3041–3046. [Google Scholar] [CrossRef] [PubMed] [Green Version]
  104. Tian, D.; Gao, M.; Xu, C.; Tobacco, M.B. Effects of Soil Moisture and Nitrogen Addition on Nitrogen Mineralization and Soil Ph in Purple Soil of Three Different Textures. J. Soil Water Conserv. 2016, 30, 255–261, (In Chinese with English Abstract). [Google Scholar]
  105. Nichols, J. Relation of Organic Carbon to Soil Properties and Climate in the Southern Great Plains. Soil Sci. Soc. Am. J. 1984, 48, 1382–1384. [Google Scholar] [CrossRef]
  106. Plante, A.F.; Conant, R.T.; Stewart, C.E.; Paustian, K.; Six, J. Impact of Soil Texture on the Distribution of Soil Organic Matter in Physical and Chemical Fractions. Soil Sci. Soc. Am. J. 2006, 70, 287–296. [Google Scholar] [CrossRef]
  107. Alvarez, R. A Review of Nitrogen Fertilizer and Conservation Tillage Effects on Soil Organic Carbon Storage. Soil Use Manag. 2005, 21, 38–52. [Google Scholar] [CrossRef]
  108. Diekow, J.; Mielniczuk, J.; Knicker, H.; Bayer, C.; Dick, D.P.; Kögel-Knabner, I. Carbon and Nitrogen Stocks in Physical Fractions of a Subtropical Acrisol as Influenced by Long-Term No-Till Cropping Systems and N Fertilisation. Plant Soil 2005, 268, 319–328. [Google Scholar] [CrossRef]
  109. Liu, S.; Wang, T.; Qu, J. Soil Characteristics Changes in Desertification Processes in Hunshandake Sandy Land, Northern China. J. Desert Res. 2008, 28, 611–617, (In Chinese with English Abstract). [Google Scholar]
  110. Gami, S.K.; Lauren, J.G.; Duxbury, J.M. Influence of Soil Texture and Cultivation on Carbon and Nitrogen Levels in Soils of the Eastern Indo-Gangetic Plains. Geoderma 2009, 153, 304–311. [Google Scholar] [CrossRef]
  111. Tahir, S.; Marschner, P. Clay Addition to Sandy Soil: Effect of Clay Concentration and Ped Size on Microbial Biomass and Nutrient Dynamics after Addition of Low C/N Ratio Residue. J. Soil Sci. Plant Nut. 2016, 16, 864–875. [Google Scholar] [CrossRef] [Green Version]
  112. Zheng, Z.; Parent, L.; MacLeod, J. Influence of Soil Texture on Fertilizer and Soil Phosphorus Transformations in Gleysolic Soils. Can. J. Soil Sci. 2003, 83, 395–403. [Google Scholar] [CrossRef]
  113. Gu, H.; Chen, B.; Wang, Q. Effects of Phosphorus Application on Soil Phosphorus Availability and Phosphorus Fertilizer Utilization Rate in Different Cotton Fields. Soil Fertil. Sci. China 2019, 3, 100–108, (In Chinese with Engilsh Abstract). [Google Scholar]
  114. Dhaliwal, A.; Gupta, R.; Yadvinder, S.; Bijay, S. Potassium Fixation and Release Characteristics of Some Benchmark Soil Series under Rice–Wheat Cropping System in the Indo-Gangetic Plains of Northwestern India. Commun. Soil Sci. Plant Anal. 2006, 37, 827–845. [Google Scholar] [CrossRef]
  115. Rosolem, C.; Steiner, F. Effects of Soil Texture and Rates of K Input on Potassium Balance in Tropical Soil. Eur. J. Soil Sci. 2017, 68, 658–666. [Google Scholar] [CrossRef]
  116. Jeong, H.; Bhattarai, R. Exploring the Effects of Nitrogen Fertilization Management Alternatives on Nitrate Loss and Crop Yields in Tile-Drained Fields in Illinois. J. Environ. Manag. 2018, 213, 341–352. [Google Scholar] [CrossRef]
  117. Li, W.; Huang, F.; Shi, F.; Wei, X.; Zamanian, K.; Zhao, X. Human and Climatic Drivers of Land and Water Use from 1997 to 2019 in Tarim River Basin, China. Int. Soil Water Conserv. 2021, 9, 532–543. [Google Scholar] [CrossRef]
  118. Kuzyakov, Y.; Zamanian, K. Reviews and Syntheses: Agropedogenesis–Humankind as the Sixth Soil-Forming Factor and Attractors of Agricultural Soil Degradation. Biogeosciences 2019, 16, 4783–4803. [Google Scholar] [CrossRef] [Green Version]
  119. Mei, N.; Zhang, X.; Wang, X.; Peng, C.; Gao, H.; Zhu, P.; Gu, Y. Effects of 40 Years Applications of Inorganic and Organic Fertilization on Soil Bacterial Community in a Maize Agroecosystem in Northeast China. Eur. J. Agron. 2021, 130, 126332. [Google Scholar] [CrossRef]
Figure 1. Sixty−seven long-term fertilization experimental stations in China, presented according to HIs (humidity index) (HI = MAP/(MAT + 10)) and cultivation duration (triangle: HI ≤ 25, circle: 25 < HI < 50, inverted triangle: HI ≥ 50). The size of symbols corresponds the cultivation duration. The digital elevation model (DEM) is a digital simulation of the terrain using limited terrain elevation data. MAT represents the mean annual temperature; MAP represents the mean annual precipitation. The MAT−MAP inset shows the climatic conditions of the 67 study sites. The county map is based on the standard map released by Ministry of Natural Resources of the People’s Republic of China (No. GS(2019)1822).
Agronomy 12 02501 g001
Figure 2. Effects of fertilizers (N, NPK (phosphorus, potassium and nitrogen), NPKS (NPK with straw returning), NPKM (NPK with manure)) on the soil chemical properties (pH (a), SOC (b), TN (c), TP (d), AN (e), AK (f)) (SOC: soil organic carbon. TN: total nitrogen. TP: total phosphorus. AN: alkali−hydrolysable nitroge. AK: available potassium). Numbers of sampling data are in the rightmost column. Change and % change were compared to the control. Points and whiskers are mean values with the standard error.
Agronomy 12 02501 g002
Figure 3. Effects of fertilizers (N, NPK (phosphorus, potassium and nitrogen), NPKS (NPK with straw returning), NPKM (NPK with manure)) on the soil chemical properties (pH (ad), SOC (eh), TN (il), TP (mp), AN (qt), AK (ux)) in regions with different HIs (humidity index) (HI = MAP/(MAT + 10)) (SOC: soil organic carbon. TN: total nitrogen. TP: total phosphorus. AN: alkali−hydrolysable nitrogen. AK: available potassium. HI ≤ 25: arid region. 25 < HI < 50: semiarid region. HI ≥ 50: humid region). Numbers of sampling data are on the right. Points and whiskers are mean values with the standard error.
Agronomy 12 02501 g003
Figure 4. Effects of the crops (wheat−maize, wheat, maize, wheat−rice, rice) and fertilizer types (N, NPK (phosphorus, potassium and nitrogen), NPKS (NPK with straw returning), NPKM (NPK with manure)) on soil chemical properties (pH (ad), SOC (eh), TN (il), TP (mp), AN (qt), AK (ux)) (SOC: soil organic carbon. TN: total nitrogen. TP: total phosphorus. AN: alkali−hydrolysable nitrogen. AK: available potassium). Numbers of sampling data are on the right. Change and % change were compared to the control. Points and whiskers are mean values with the standard error.
Agronomy 12 02501 g004
Figure 5. The effects of mineral fertilizers (N, NPK (phosphorus, potassium and nitrogen)) and organic fertilizer (NPKS (NPK with straw returning), NPKM (NPK with manure)) on soil chemical properties (pH (a,b), SOC (c,d), TN (e,f), C/N (g,h), TP (i,j), AN (k,l), AK (m,n)) with the cultivation duration (SOC: soil organic carbon. TN: total nitrogen. C/N: organic carbon−nitrogen ratio. TP: total phosphorus. AN: alkali−hydrolysable nitrogen. AK: available potassium). Circle: N. square: NPK. triangle: NPKS. diamond: NPKM. The numbers near the points and whiskers indicate the data numbers. Change and % change were compared to the control. Points and whiskers are mean values with the standard error.
Agronomy 12 02501 g005
Figure 6. Effects of different soil textures (sandy loam soils, silty loam soils, clay loam soils) on soil chemical properties (pH (ac), SOC (df), C/N (gi), TN (jl), TP (mo) and TK (pr)) with the cultivation duration (SOC: soil organic carbon, C/N: organic carbon−nitrogen ratio, TN: total nitrogen, TP: total phosphorus, TK: total potassium). Change and % change were compared to the control.
Agronomy 12 02501 g006
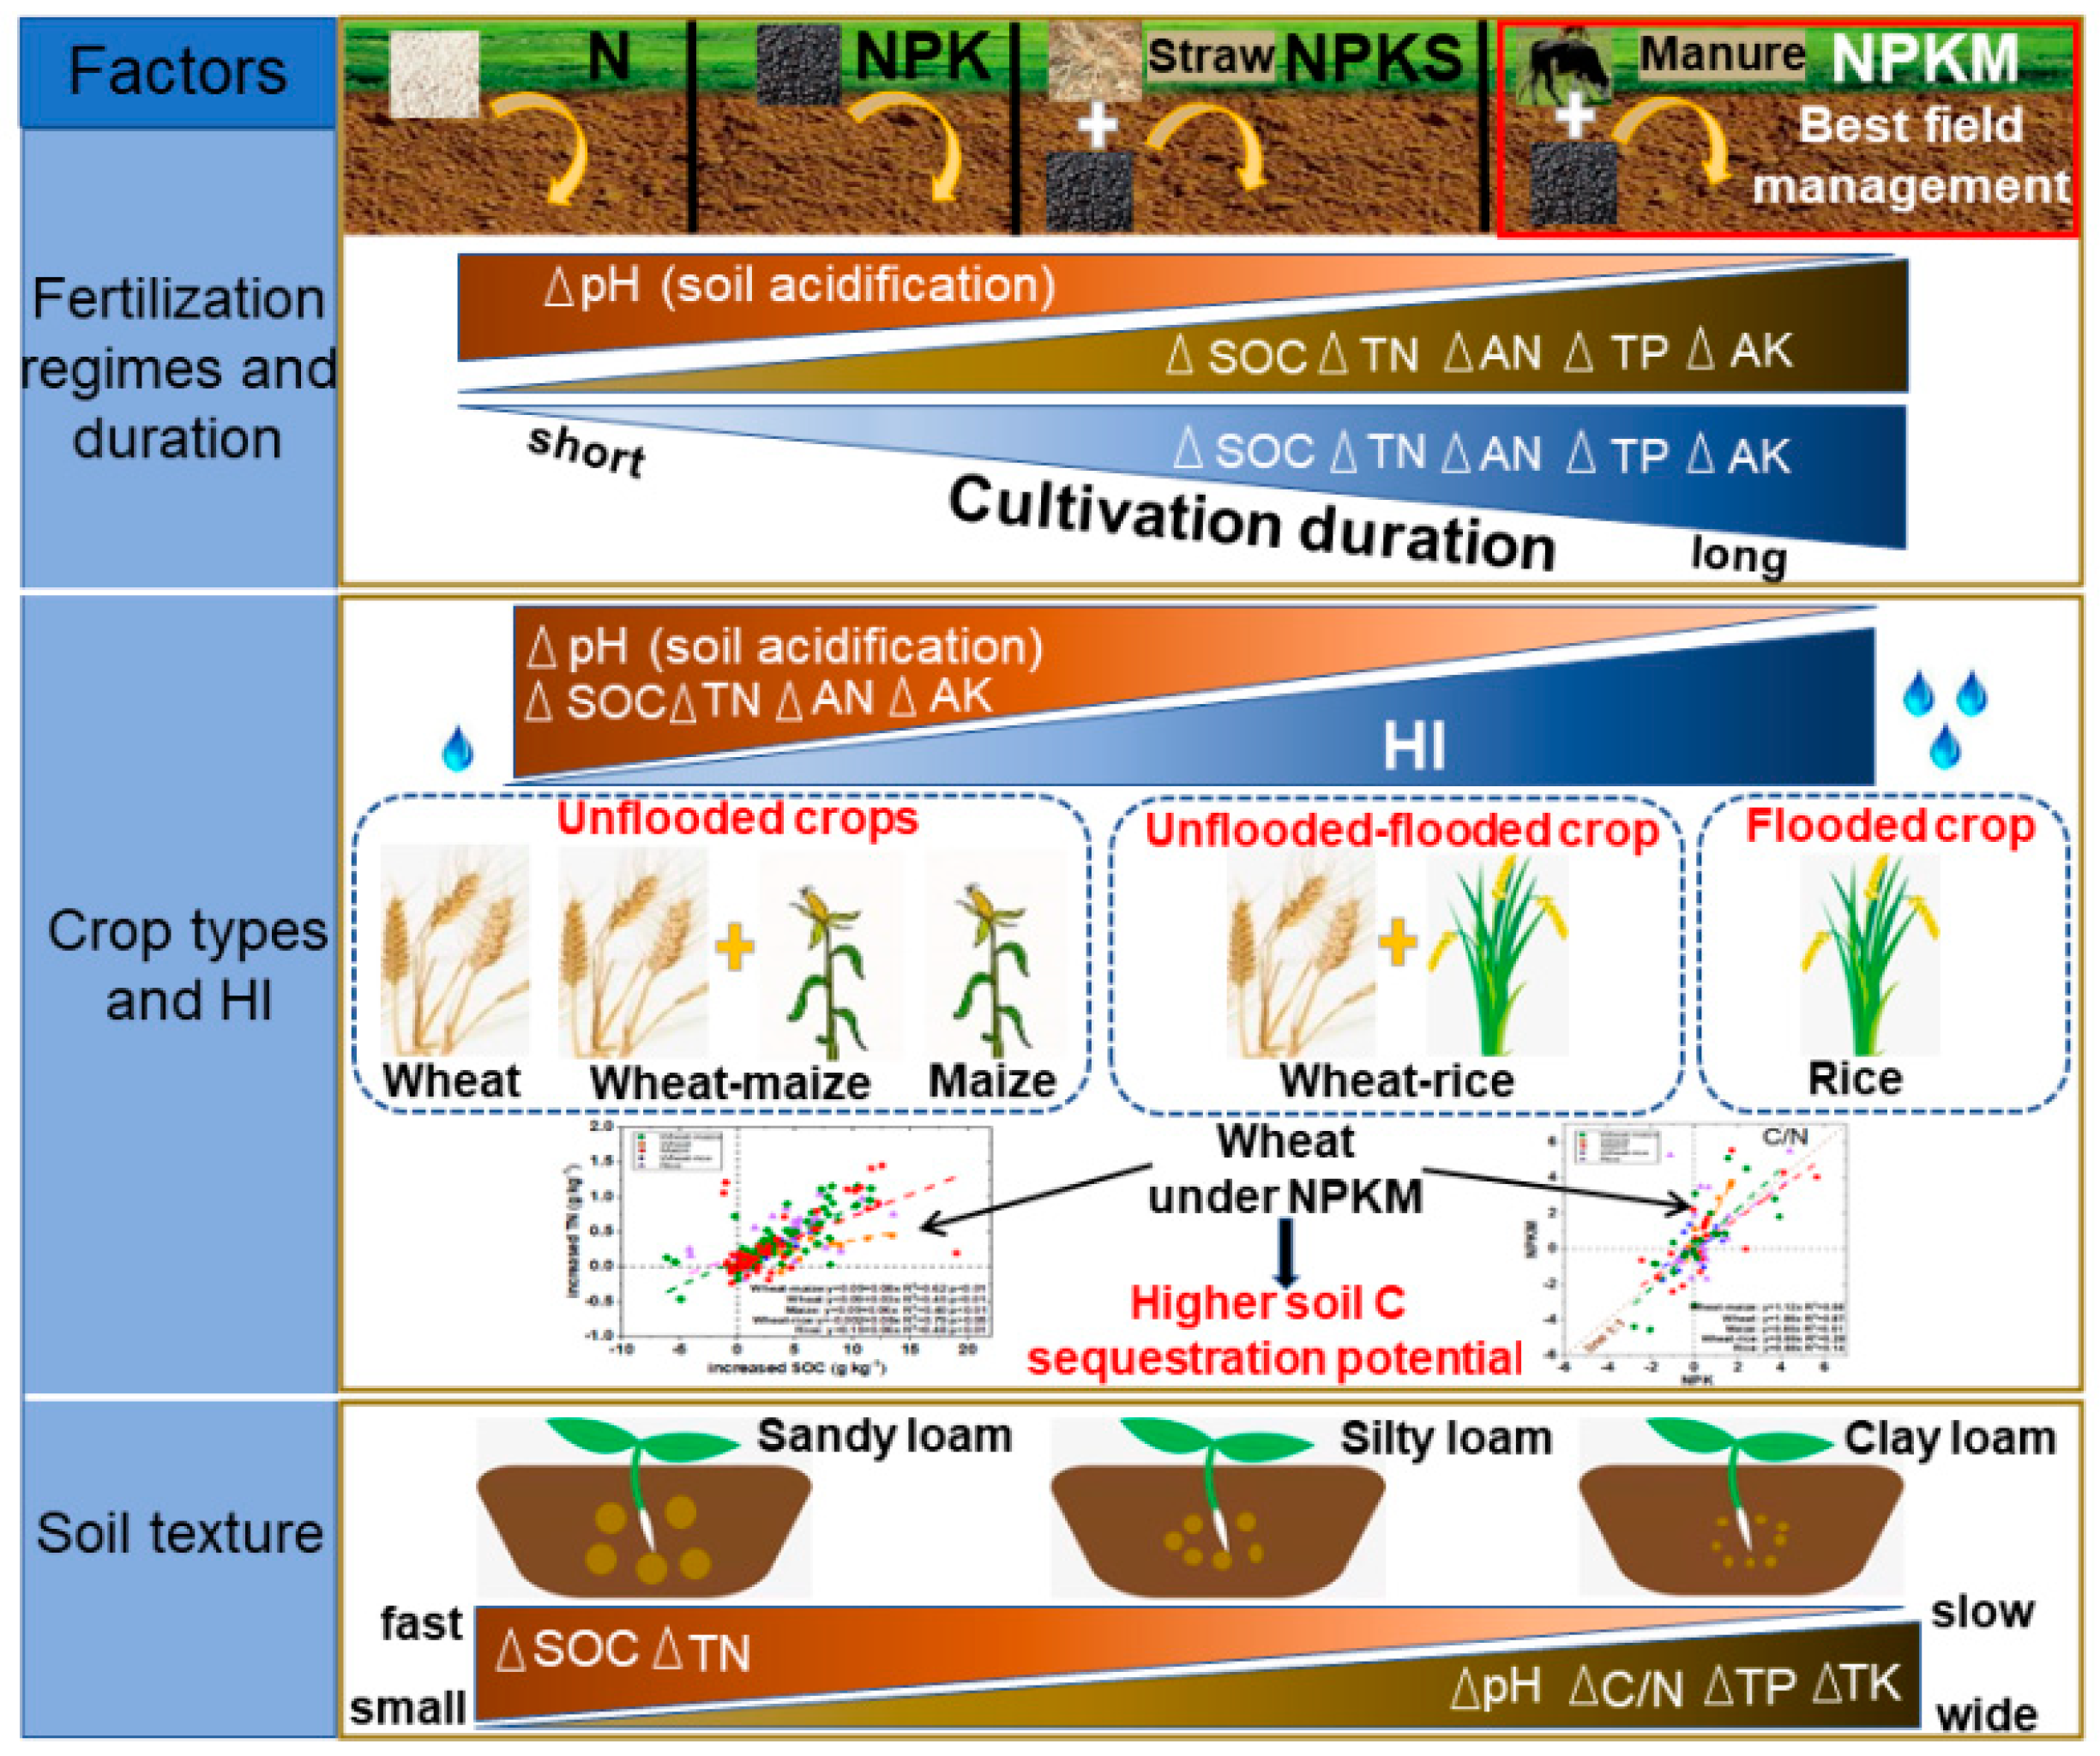
Figure 7. Fertilization−induced changes of soil chemical properties according to fertilizer regimes, crops, cultivation duration, climatic conditions, and soil texture. HI: humidity index = MAP/(MAT +10), Δ : percent change. SOC: soil organic carbon. C/N: organic carbon−nitrogen ratio. TN: total nitrogen. AN: alkali−hydrolysable nitrogen. TP: total phosphorus. AP: available phosphorus. TK: total potassium. AK: available potassium. MAT, mean annual temperature. MAP, mean annual precipitation.
Agronomy 12 02501 g007
Figure 8. The linear relationships (y = ax) between the responses of increased soil C/N ratios (SOC/TN) to NPK and NPKM depending on the HI (humidity index) (HI = MAP/(MAT + 10)) (a) and crop type (wheat−maize, wheat, maize, wheat−rice, rice) (b). The horizontal dotted line indicates y = 0 and the vertical dotted line indicates x = 0. The thin lines indicate 1:1 ratios and dashed lines reflect the linear regressions. All regression lines are significant at p < 0.05. SOC: soil organic carbon. TN: total nitrogen. HI ≤ 25: arid region. 25 < HI < 50: semiarid region. HI ≥ 50: humid region. MAT: mean annual temperature, MAP: mean annual precipitation.
Agronomy 12 02501 g008
Figure 9. Interactions between the increased SOC and increased TN (a,b), increased SOC and increased TP (c,d) and increased SOC and increased AK (e,f) depending on regions with different HIs (humidity index) (HI = MAP/(MAT + 10)) and crops (wheat−maize, wheat, maize, wheat−rice , rice). SOC: soil organic carbon. TN: total nitrogen. TP: total phosphorus. AK: available potassium. HI ≤ 25: arid region, 25 < HI < 50: semiarid region, HI ≥ 50: humid region. The horizontal dotted line indicates y = 0 and the vertical dotted line indicates x = 0. The dashed lines reflect the linear regressions. MAT: mean annual temperature, MAP: mean annual precipitation.
Agronomy 12 02501 g009
Figure 10. The relationship between soil TN (total nitrogen) and yield of maize (a), wheat (b) and rice (c). The lines represent range of crop yield changing with TN content.
Agronomy 12 02501 g010
Figure 11. Effect of fertilizer on soil chemical properties. SOC (a): soil organic carbon, C/N (b): organic carbon−nitrogen ratio, pH (c), TN (d): total nitrogen, TP (e): total phosphorus, TK (f): total potassium, AN (g): alkali−hydrolysable nitrogen, AP (h): available phosphorus, AK (i): available potassium) with different HIs (humidity index) (HI = MAP/(MAT + 10)) (triangle: HI ≤ 25, circle: 25 < HI < 50, inverted triangle: HI ≥ 50). MAT: mean annual temperature, MAP: mean annual precipitation.
Agronomy 12 02501 g011
Table 1. Spearman’s rank correlation coefficients between the responses of soil chemical properties and the explanatory variables (MAP, MAT, cultivation duration and HI).
Soil PropertiesExplanatory Variables
pHSOCTNC/NTPTKANAPAKMATMAPDurationHI
pH 0.18
**
290
0.13
*
220
0.16
*
116
0.31
**
14
0.29
**
151
0.15
**
343
SOC 0.70
**
212
0.33
**
220
0.71
**
107
0.28
**
99
0.47
**
125
0.54
**
147
0.07
*
687
−0.11
**
687
0.08
*
687
−0.17
**
687
TN −0.27
**
211
0.55
**
113
0.23
*
93
0.25
*
87
0.43
**
122
0.43
**
73
−0.13
**
400
−0.20
**
400
C/N 0.23
*
90
0.24
*
114
0.28
**
120
0.13
*
402
TP 0.45
**
66
0.73
**
79
0.63
**
84
0.23
**
269
0.25
**
269
−0.15
*
269
0.20
**
269
TK 0.51
**
77
AN 0.64
**
88
AP 0.53
**
150
AK 0.13
*
291
MAT 0.80
**
69
0.52
**
69
MAP 0.89
**
69
Duration
HI
* = p < 0.05, ** = p < 0.01. First line stands for the correlation coefficient, second line stands for the significance and third line stands for the sampling size. The hatched boxes indicate insignificant relations. Cells colored indicate the relation were positively (green) or negatively (orange) significant, respectively. MAT: mean annual temperature, MAP: mean annual precipitation. HI: humidity index (HI = MAP/(MAT +10)).
Table 2. Significance of the explanatory variables for the responses of soil chemical properties (pH, SOC, TN, TP and TK) according to BRT (boosted regression tree) analysis.
Explanatory
Variables
Variation Explained (%)
pHSOCTNTPTK
Fertilizers1523224115
HI1299104
Crop types2136371225
Cultivation duration3323273447
Soil texture199539
Publisher’s Note: MDPI stays neutral with regard to jurisdictional claims in published maps and institutional affiliations.