Article

Water Footprint Assessment of Green and Traditional Cultivation of Crops in the Huang-Huai-Hai Farming Region

1
Center for Agricultural Water Research in China, China Agricultural University, Beijing 100083, China
2
National Field Scientific Observation and Research Station on Efficient Water Use of Oasis Agriculture in Wuwei of Gansu Province, Wuwei 733009, China
3
College of Agronomy and Biotechnology, China Agricultural University, Beijing 100193, China
4
Department of Biological and Environmental Engineering, Riley-Robb Hall, Cornell University, Ithaca, NY 14853, USA
5
The UWA Institute of Agriculture, The University of Western Australia, Perth, WA 6001, Australia
*
Author to whom correspondence should be addressed.
Agronomy 2022, 12(10), 2494; https://doi.org/10.3390/agronomy12102494
Submission received: 19 September 2022 / Revised: 5 October 2022 / Accepted: 10 October 2022 / Published: 13 October 2022
(This article belongs to the Section Farming Sustainability)

Abstract

:
With the increasing consumer awareness and knowledge about safe and healthy food, it is imperative to develop ‘green’ crops with reduced fertilizer application for quality food production, environmental protection and sustainable agricultural development. This study systematically evaluated and compared the water footprint (WF) including WFblue, WFgreen and WFgrey of eight crops including wheat, maize, rice, sweet potato, soybean, millet, mung bean and sorghum under green and traditional cultivation in the Huang-Huai-Hai farming region. The data came from 252 onsite questionnaires conducted in 2018 for land under green and traditional cultivation by 19 green planting companies and farming cooperatives with green food production certification authorized by the government of China. The results revealed that, compared to traditional cultivation, green cultivation under reduced N fertilizer application (1) decreased crop yields by 3–13%; (2) reduced the average WFtotal by 29% to 1168 m3 t−1 and average WFgrey by 57% to 419 m3 t−1 with no significant differences in WFblue and WFgreen; (3) decreased the WFtotal of maize by 55%, rice by 41%, wheat by 27%, mung bean by 31%, sorghum by 24%, sweet potato by 19%, millet by 17% and soybean by 17%. The WFgrey proportion of WFtotal under green cultivation ranged from 27–57% and contributed the most to the decline in WFtotal. This study offers insight into the impact of green cultivation on water requirements and pollution relative to traditional cultivation. Precision N fertilizer application and improved N use efficiencies on-farm are important pathways to sustainable agricultural development.

Graphical Abstract

1. Introduction

China’s chemical fertilizer input has increased grain yields by 34% during the past decades [1]. Traditional agricultural cultivation involves large irrigation and nitrogen fertilizer application to increase crop productivity [2]. It has resulted in the over-exploitation of natural resources including severe groundwater depletion [3], greenhouse gas emissions [4] and widespread water pollution [5] such as acidification [6], eutrophication [7] and nitrate accumulation in groundwater [8]. Rethinking the use of chemical fertilizer is important to protect ecological health. Reducing the current chemical fertilizer use in crop production is an inherent aspect of sustainable agricultural development.
In the late 1980s, a new initiative was undertaken to highlight the environmental protection and quality of products by adopting the idea of pollution-free food production, which was later called green food [9,10]. The green cultivation of crops seeks to produce environmentally safe and healthy crop products [11]. The concept of green cultivation fostered by the China Green Food Development Center (CGFDC) focuses on the cultivation stage for green crops with reduced nitrogen fertilizer and pesticide application compared with traditional planting [12]. In 2016, the green-planting area had reached 1.1 × 10⁷ ha, accounting for 8.6% of the country’s total cultivated land [13], which reflects the increasingly significant attention given to green and healthy crop production by farms. The ‘No. 1 Central Document’ of China released in 2021 vigorously advocated for developing green agricultural products by reducing chemical fertilizer use and decreasing energy consumption to produce healthy, green food systems and develop sustainable ecological environments [14]. Therefore, accelerating the transition from traditional cultivation to green cultivation will lower the environmental footprint and improve crop product quality.
The Huang-Huai-Hai (H-H-H) farming region is one of the most important food production regions in China [15], accounting for 25% of national grain production, including 54% of the nation’s wheat, 24% of its maize, and large fractions of other key crops such as peanuts (42%), sweet potato (11%) and soybean (10%) [16]. However, its annual rainfall of 500–750 mm is not sufficient for the double cropping of winter wheat–summer maize. As a result, the groundwater table decreases by approximately 1 m each year [3]. Most crop production in this region still occurs under traditional cultivation, with excessive nitrogen application leading to serious water pollution [17,18]. The total N loss in crop production reached 51% in Quzhou county in the Hebei province of the H-H-H region from 1997 to 2017 [19]. Liu et al. [20] reported that the environmental footprint of green crop production was 40% lower than conventional planting. Since 2007, the green planting crop industry and farming cooperatives have paid attention to the green cultivation of crops with less fertilizer input [21]. By 2020, about 516 operational entities received green crop production certification and authorization from CGFDC for plants and products [22]. This magnitude makes it valuable to assess and quantify the effect of the green planting of crops and traditional planting on the water footprint.
The water footprint (WF) is an effective tool for evaluating the water use volume and water pollution of a product [23]. Crop water footprint (CWF) is the total amount of freshwater resources consumed and polluted by crops during their growing period and comprises three parts: blue water footprint (WFblue), green water footprint (WFgreen) and grey water footprint (WFgrey) [24]. WFblue is the evapotranspiration used for field irrigation, WFgreen is rainfall that evaporates or is incorporated into a crop product during its growing season and WFgrey is the amount of water needed to obtain a pollutant concentration below an acceptable level [25]. WFblue, WFgreen and WFgrey are related to crop irrigation water consumption, effective precipitation consumption and the water resources required to dilute released pollutants to below acceptable levels during the crop growth period, respectively [25,26,27]. Previous studies have been carried out to quantify the crop water footprint for different crops in different regions [28,29,30,31,32,33]. Mekonnen and Hoekstra [25] spatially quantified the global WF of 126 crops from 1996 to 2005 and found that WF varied between sugar crops (roughly 200 m3 t−1), roots and tubers (400 m3 t−1), cereals (1600 m3 t−1), oil crops (2400 m3 t−1) and pulses (4000 m3 t−1). Sun et al. [24] calculated the WF of major crops from 1960 to 2008 in the Hetao irrigation district, China, reporting an annual average WF of integrated-crop production of 3910 m3 t−1 (91% blue water and 9% green water). Wang et al. [34] calculated the WF of each grain crop in different regions of China for 2010 and found that rice had a WF at 1390 m3 t−1 while maize had 901 m3 t−1. Huang et al. [35] quantified the WF of field crops (wheat, maize, sweet potato, soybean and groundnut) in the Beijing area from 2006 to 2009, reporting that soybean had the highest WF (1816 m3 t−1) and wheat had the lowest (712 m3 t−1). Borsato et al. [36] assessed WFgrey for all field operation processes during a three-year crop rotation, revealing that precision chemical use (variable fertilizer and pesticide application rates) with soil conservation tillage systems can reduce WFgrey by 10%. Vale et al. [37] estimated the WFgrey of the pesticide mixture (herbicides) used in a sugarcane cultivation system in Pernambuco, Brazil, reporting that the WFgrey of sugarcane reached 1731 m3 t−1. Hossain et al. [32] quantified the WF and its components of eight horticultural crops in Australia and found that almond had the highest WF (6672 m3 t−1) and tomato had the lowest (212 m3 t−1). Most of the above studies assessed the WF of crops under traditional planting systems.
No study has systematically compared the WF of crops under both green cultivation and traditional cultivation in China. Hence, this study aimed to quantify and compare the WF and its components of eight crops (wheat, maize, rice, millet, sorghum, sweet potato, soybean and mung bean) in green cultivation and traditional cultivation systems in the H-H-H farming region. It provides important references for sustainable water management in the region’s crop production systems and elaborates on the environmental and water resource benefits of green crop planting.

2. Materials and Methods

2.1. Study Area

The H-H-H farming region is one of China’s major agricultural production areas, located from 31°14′–40°25′ N to 112°33′–120°17′ E (Figure 1). The region is in a semi-humid and semi-arid climate zone with rich solar energy resources, which can support the sequential harvests in one year of winter wheat and summer maize on the same field. Annual precipitation is 500–700 mm, with 60–70% occurring from June to September. Figure 2 shows the area sown to major crops in recent years [16]. The wheat and maize planting areas account for the largest proportion (46.89% and 43.41%, respectively), followed by rice (3.33%), sweet potato (2.70%), soybean (2.56%), millet (0.77%), mung bean (0.20%) and sorghum (0.13%). We selected these eight main field crops for this study to compare green cultivation and traditional cultivation systems. Figure 1 shows the location of 19 selected green-crop-planting companies and cooperatives where green cultivation and traditional cultivation for each crop were conducted in parallel.

2.2. Data Source

The daily meteorological data from 2018 for the 19 selected sites were obtained from the China Meteorological Data Service Center (CMDSC, http://cdc.cma.gov.cn/ accessed on 30 September 2019)) and included the average, maximum and minimum air temperature, average wind speed at 10 m height, precipitation, average relative humidity and bright sunshine hours at 2 m height. The main crop characteristics, including crop type, sowing date, harvesting date, planting area, type and amount of fertilizer (especially nitrogen application during the crop growing period) and yield per unit area under green cultivation and traditional cultivation conditions came from onsite questionnaires given to green-crop-cultivation companies and cooperatives. They all have obtained green food production certification authorized by the CGFDC affiliated with the Ministry of Agriculture and Rural Affairs of China (see Figure 1). Additional telephone surveys, online research, literature reviews and project reports supplemented the primary data from questionnaires. Crop information, including sowing and harvest dates, and the type and amount of nitrogen application, are in the Supplementary Materials Tables S1 and S2.

2.3. Water Footprint Calculations

(1)
Calculation of ETc and ETaw based on the SIMETAW model
The Simulation of Evapotranspiration of Applied Water (SIMETAW) model [38,39,40] was developed based on the Penman–Montieth equation and the crop coefficient (Kc) to calculate crop evapotranspiration (ETc) and simultaneous effective rainfall (Er) during the crop growing season using daily meteorological data combined with the localized crop and soil parameters. This model has been widely applied to calculate the water requirements of maize, wheat, cotton and soybean in the H-H-H farming region [35,41,42,43,44,45,46]. Parameter items for each crop and soil type were adjusted in the SIMETAW model according to the local questionnaire survey, literature review and government project reports. Crop evapotranspiration during the growing season (ETc, mm) was calculated as:
E T c = E T 0 × K c
where Kc is the crop coefficient stored in the SIMETAW model as recommended by FAO-56 [47,48]. The Kc values for each crop in this study are in Supplementary Table S3. ET0 is the reference crop evapotranspiration during the growing season, calculated using the Penman–Montieth Equation (2) with daily meteorological data by the SIMETAW model [40,47,49].
E T 0 = 0.408 Δ ( R n G ) + γ 900 T + 273 u 2 ( e s e a ) Δ + γ ( 1 + 0.34 u 2 )
where ET0 (mm d−1) is the reference crop evapotranspiration; Δ (kPa °C−1) is the slope of the saturation vapor pressure curve at mean air temperature; Rn (MJ m−2 d−1) and G (MJ m−2 d−1) are the net radiation at the crop surface and soil heat flux density; γ (kPa °C−1) is a psychrometric constant; T (°C) is daily mean temperature at 2 m height; u2 (m s−1) is the mean wind speed at 2 m height; es (kPa) is saturation vapor pressure; and ea (kPa) is actual vapor pressure.
The ETaw is the amount of irrigation water needed (beyond Er) to obtain crop yields not limited by water availability. The ETaw for each crop was calculated as:
E T a w = E T c E r , E T c E r > 0 0 , E T c E r 0
where ETc (mm) is crop evapotranspiration or water requirement during the growing season; Er (mm) is effective rainfall during the growing season, retained in the root zone long enough to meet the requirements for crop evapotranspiration and calculated by the SIMETAW model; and ETaw (mm) is the irrigation requirement during the growing season (when Er meets the crop water requirement no extra irrigation water is needed, and ETaw is set to zero; when Er does not meet the crop water requirement then ETaw makes up the difference).
(2)
Crop water footprint calculation
The total water footprint (WFtotal, m3 t−1) of crop growth is the sum of the blue water footprint (WFblue, m3 t−1), green water footprint (WFgreen, m3 t−1) and grey water footprint (WFgrey, m3 t−1) components, according to ‘The Water Footprint Assessment Manual: Setting the Global Standard’ [28,50]:
W F t o t a l = W F b l u e + W F g r e e n + W F g r e y
Crop WFblue and WFgreen are calculated as the blue and green water in crop water use (CWU) divided by crop yield (Y, t). The blue and green water values in CWU are equal to the daily accumulation of evapotranspiration over the crop growing period:
W F b l u e = C W U b l u e Y = 10 × E T b l u e Y
W F g r e e n = C W U g r e e n Y = 10 × E T g r e e n Y
where WFblue (m3 t−1) and WFgreen (m3 t−1) are the blue and green components, respectively, of crop WF; CWUblue (m3 ha−1) and CWUgreen (m3 ha−1) are the blue and green water consumed during the crop growing period; the factor 10 converts water depths (mm) into water volumes per land surface (m3 ha−1); and ETblue (mm) and ETgreen (mm) are blue and green water evapotranspiration during crop growth, calculated as.
E T b l u e = M a x 0 , E T a w
E T g r e e n = M i n ( E T c , E r )
In calculating WFgrey, the nitrogen fertilizer input was the most prominent fertilizer and insecticide component [51,52]. Soil phosphorus usually reacts with other minerals to form insoluble compounds, reducing water pollution [53]. Potassium ions can be attracted by soil colloidal ions and are not easily filtered, while nitrogen can easily flow in soil and pollute groundwater and surface water [54]. Therefore, WFgrey indicates the use of water to dilute pollution, which mainly results from nitrogen fertilizer use [55,56,57], calculated as:
W F g r e y = α × A R ( C max C n a t ) × Y
where AR (kg ha−1) is the amount of nitrogen application to the field per hectare; and α is the total nitrogen leaching factor (%), set as 6.04% at the average level in China [58]. Cmax (mg L−1) is the maximum allowable concentration of total inorganic nitrogen for a given water body, set at 3.1. The effectiveness of this threshold in quantifying total nitrogen has been widely proven [59,60,61], and Cnat (mg L−1) is the natural background concentration of total nitrogen, which is generally derived from the existing literature, set at 1.5 [59,60,62], and Y is crop yield per unit area (t ha−1).

3. Results

3.1. Water Requirements and Yield for Green and Traditional Crop Cultivation

Rice had the highest average ETc during the growing season in the H-H-H farming region (577 mm), followed by sweet potato (485 mm), wheat (438 mm), maize (350 mm), sorghum (346 mm), soybean (336 mm), millet (295 mm) and mung bean (225 mm) (Figure 3). The average Er was obviously different in different crops’ growing seasons, and the value of Er from highest to lowest in 2018 was that for sweet potato (245 mm), millet (205 mm), sorghum (195 mm), maize (176 mm), wheat (127 mm), rice and soybean (120 mm) and mung bean (59 mm) (Figure 3). ETaw is the difference between the crop water requirement and effective rainfall during the growing season when Er can not supply the entire ETc. Rice had the highest average ETaw (457 mm), followed by wheat (312 mm), sweet potato (240 mm), soybean (216 mm), maize (174 mm), mung bean (166 mm), sorghum (152 mm) and millet (91 mm) (Figure 3).
The average yields under green cultivation and traditional cultivation in the H-H-H farming region were 8.0 t ha−1 and 8.9 t ha−1 for maize, 5.5 t ha−1 and 6.6 t ha−1 for wheat, 8.6 t ha−1 and 9.9 t ha−1 for rice and 1.8 t ha−1 and 1.5 t ha−1 for mung bean, respectively. Green cultivation decreased average yields by 10%, 17%, 13% and 17% for maize, wheat, rice and mung bean, respectively, relative to traditional cultivation (Figure 4). Green cultivation did not significantly change the average yields of millet and sweet potato, with average yields of 3.9 t ha−1 and 12.6 t ha−1, respectively. The average yields of sorghum and soybean under green cultivation and traditional cultivation were similar due to manure application. In short, green cultivation with less N fertilizer application decreased crop yields by 3–13% relative to traditional planting (Figure 4).

3.2. Comparison of Crop Water Footprint between Green and Traditional Cultivation Crops

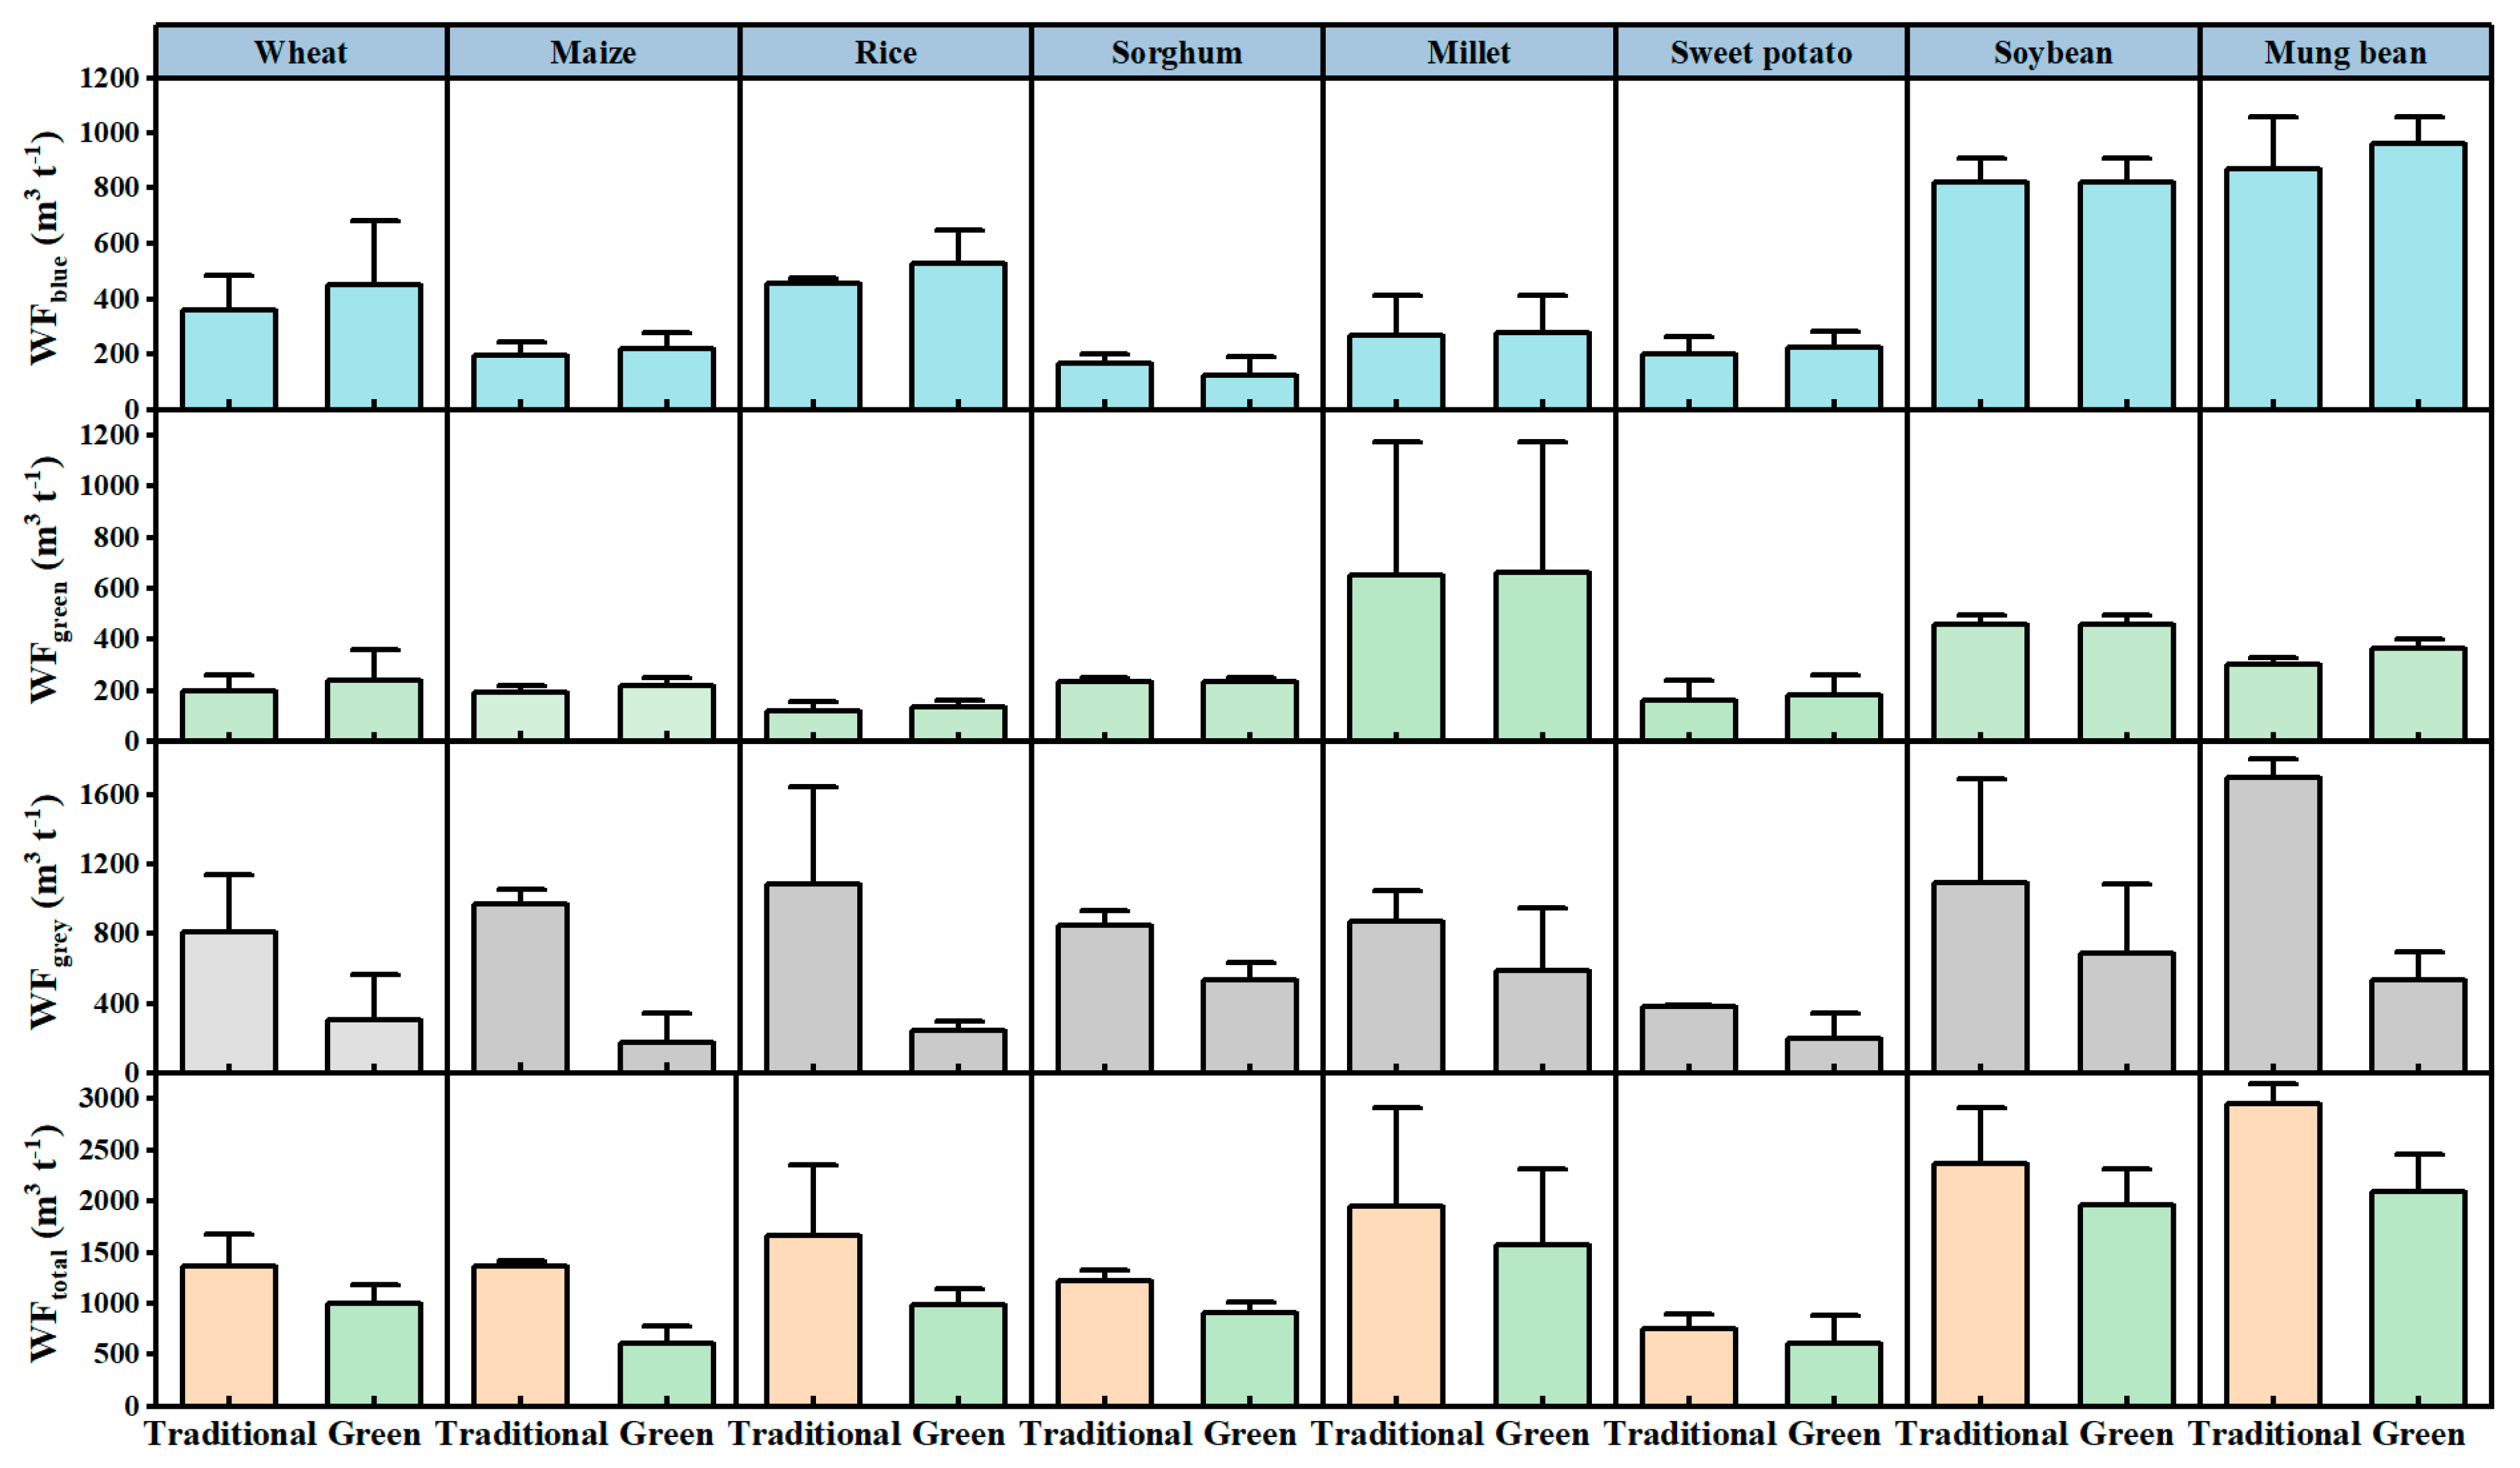
Figure 5 shows the water footprints including WFblue, WFgreen, WFgrey and WFtotal of green cultivation crops and traditional cultivation crops in the H-H-H farming region. The average WFtotal of the eight tested crops under green planting was 1168 m3 t−1, 29% less than that under traditional cultivation. The average WFgrey of the eight crops under green cultivation was 419 m3 t−1, 57% less than that of traditional cultivation. The average WFblue and WFgreen of the eight crops did not significantly differ between green and traditional cultivations (blue: 474 m3 t−1 vs. 433 m3 t−1 and green: 257 m3 t−1 vs. 249 m3 t−1, respectively) (Figure 5). The lower average yield of green cultivation crops than traditional cultivation crops contributed to the lower WFblue and WFgreen.
The detailed water footprint index of each crop under green cultivation and traditional cultivation in the H-H-H farming region is shown in Figure 6. The WFtotal of each crop under green cultivation followed a similar declining trend (17–55%) relative to traditional cultivation, which was largely attributed to the decline in WFgrey. (36–82%). The WFblue and WFgreen of each crop under green cultivation followed an increasing trend (8–25% and 3–21%, respectively) relative to traditional cultivation (Figure 6).
Under green cultivation, wheat had a WFtotal of 998 m3 t−1, WFgrey of 307 m3 t−1, WFblue of 452 m3 t−1 and WFgreen of 240 m3 t−1, which were 27% and 62% less than and 25% and 21% more than traditional cultivation, respectively. Maize had a WFtotal of 615 m3 t−1, WFgrey of 176 m3 t−1, and WFblue and WFgreen of 219 m3 t−1 under green cultivation, which were 55% and 82% less than and 11% more than traditional cultivation, respectively. Rice had a WFtotal of 982 m3 t−1, WFgrey of 318 m3 t−1, WFblue of 527 m3 t−1 and WFgreen of 136 m3 t−1 under green cultivation, which were 41% and 71% less than and 15% and 13% more than traditional cultivation, respectively (Figure 6).
Under green cultivation, millet had a WFtotal of 1208 m3 t−1, WFgrey of 232 m3 t−1, WFblue of 410 m3 t−1 and WFgreen of 211 m3 t−1, which were 17% and 73% less than and 15% and 13% more than traditional cultivation, respectively. Mung bean had a WFtotal of 2066 m3 t−1, WFgrey of 566 m3 t−1, WFblue of 1107 m3 t−1 and WFgreen of 393 m3 t−1 under green cultivation, which were 31% and 68% less than and 20% more than traditional cultivation, respectively. Sweet potato had a WFtotal of 606 m3 t−1, WFgrey of 200 m3 t−1, WFblue of 224 m3 t−1 and WFgreen of 182 m3 t−1 under green cultivation, which were 19% and 61% less than and 12% and 11% more than traditional cultivation, respectively. Under green cultivation, sorghum and soybean had a WFtotal of 901 m3 t−1 and 1967 m3 t−1, which were 24% and 17% lower than traditional cultivation, respectively, and WFgrey decreased by 36% and 37%, respectively, relative to traditional cultivation (Figure 6).

3.3. Water Footprint Composition of Green and Traditional Cultivation Crops

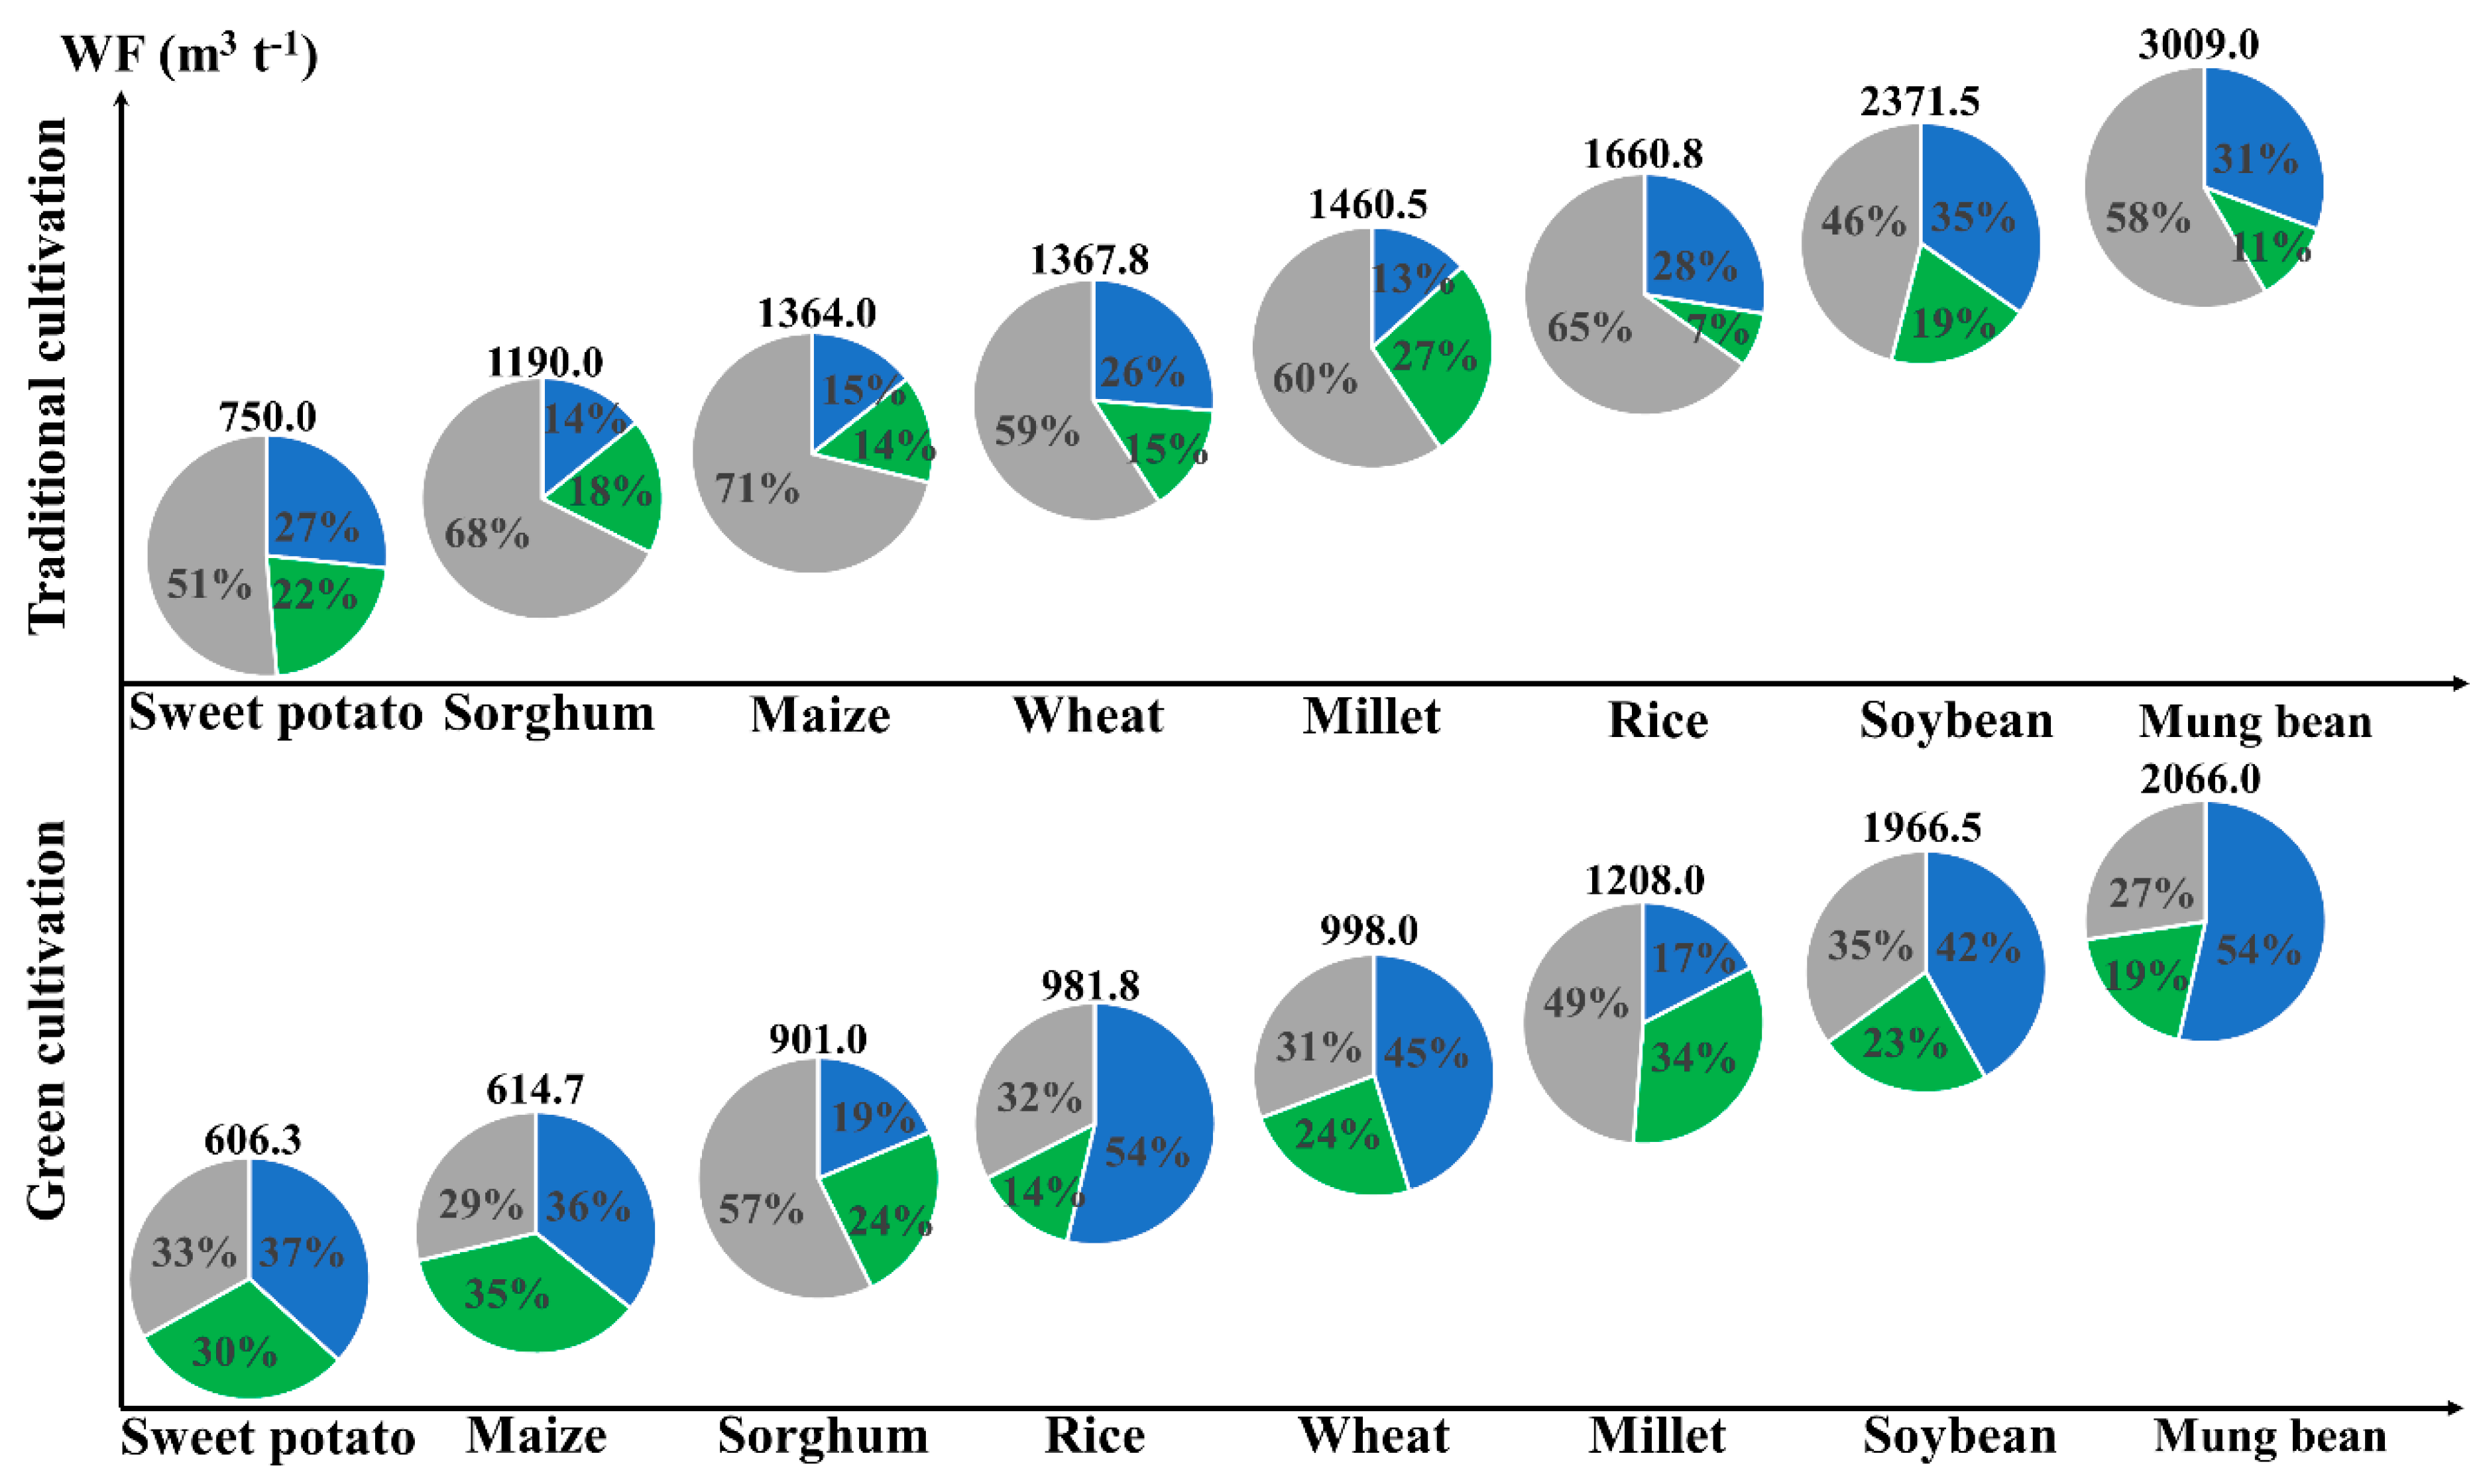
Figure 7 confirms that green cultivation decreased the WFtotal and especially the WFgrey of all the tested crops relative to traditional cultivation in the H-H-H farming region. Under green cultivation, mung bean had the highest WFtotal, while sweet potato had the lowest (sweet potato < maize < sorghum < rice < wheat < millet < soybean < mung bean). Under traditional cultivation, mung bean also had the highest WFtotal and sweet potato had the lowest (sweet potato < sorghum < maize < wheat < millet < rice < soybean < mung bean) (Figure 7).
Under green cultivation, the WFgrey proportion of WFtotal ranged from 27% to 57%, with 27% and 29% for maize and mung bean, respectively, 31–35% for wheat, rice, sweet potato and soybean, and 49% and 59% for millet and sorghum, respectively (Figure 7). Under green cultivation, the WFblue proportion of WFtotal ranged from 19% to 64%, with 54% for rice and mung bean, 36–45% for maize, sorghum, soybean and wheat, and 17% and 19% for millet and sorghum, respectively. Under green cultivation, the WFgreen proportion of WFtotal in each crop ranged from 14–35% (Figure 7).
Under traditional cultivation, the WFgrey proportion of WFtotal ranged from 46–71%, with 65–71% for rice, sorghum and maize, 51–60% for sweet potato, mung bean, millet and wheat and 46% for soybean. Under traditional cultivation, the WFblue proportion of WFtotal ranged from 13–35%, with 13–15% for millet, sorghum and maize, 26–28% for wheat, sweet potato and rice, 31% for mung bean and 35% for soybean. Under traditional cultivation, the WFgreen proportion of WFtotal ranged from 7–27%, with 7% for rice, 11–19% for mung bean, maize, wheat, sorghum and soybean, 22% for sweet potato and 27% for millet (Figure 7). In short, green cultivation crops had an 11–14% higher WFgrey proportion of WFtotal than traditional cultivation, which contributed to the decreased total WF of the green cultivation crops.
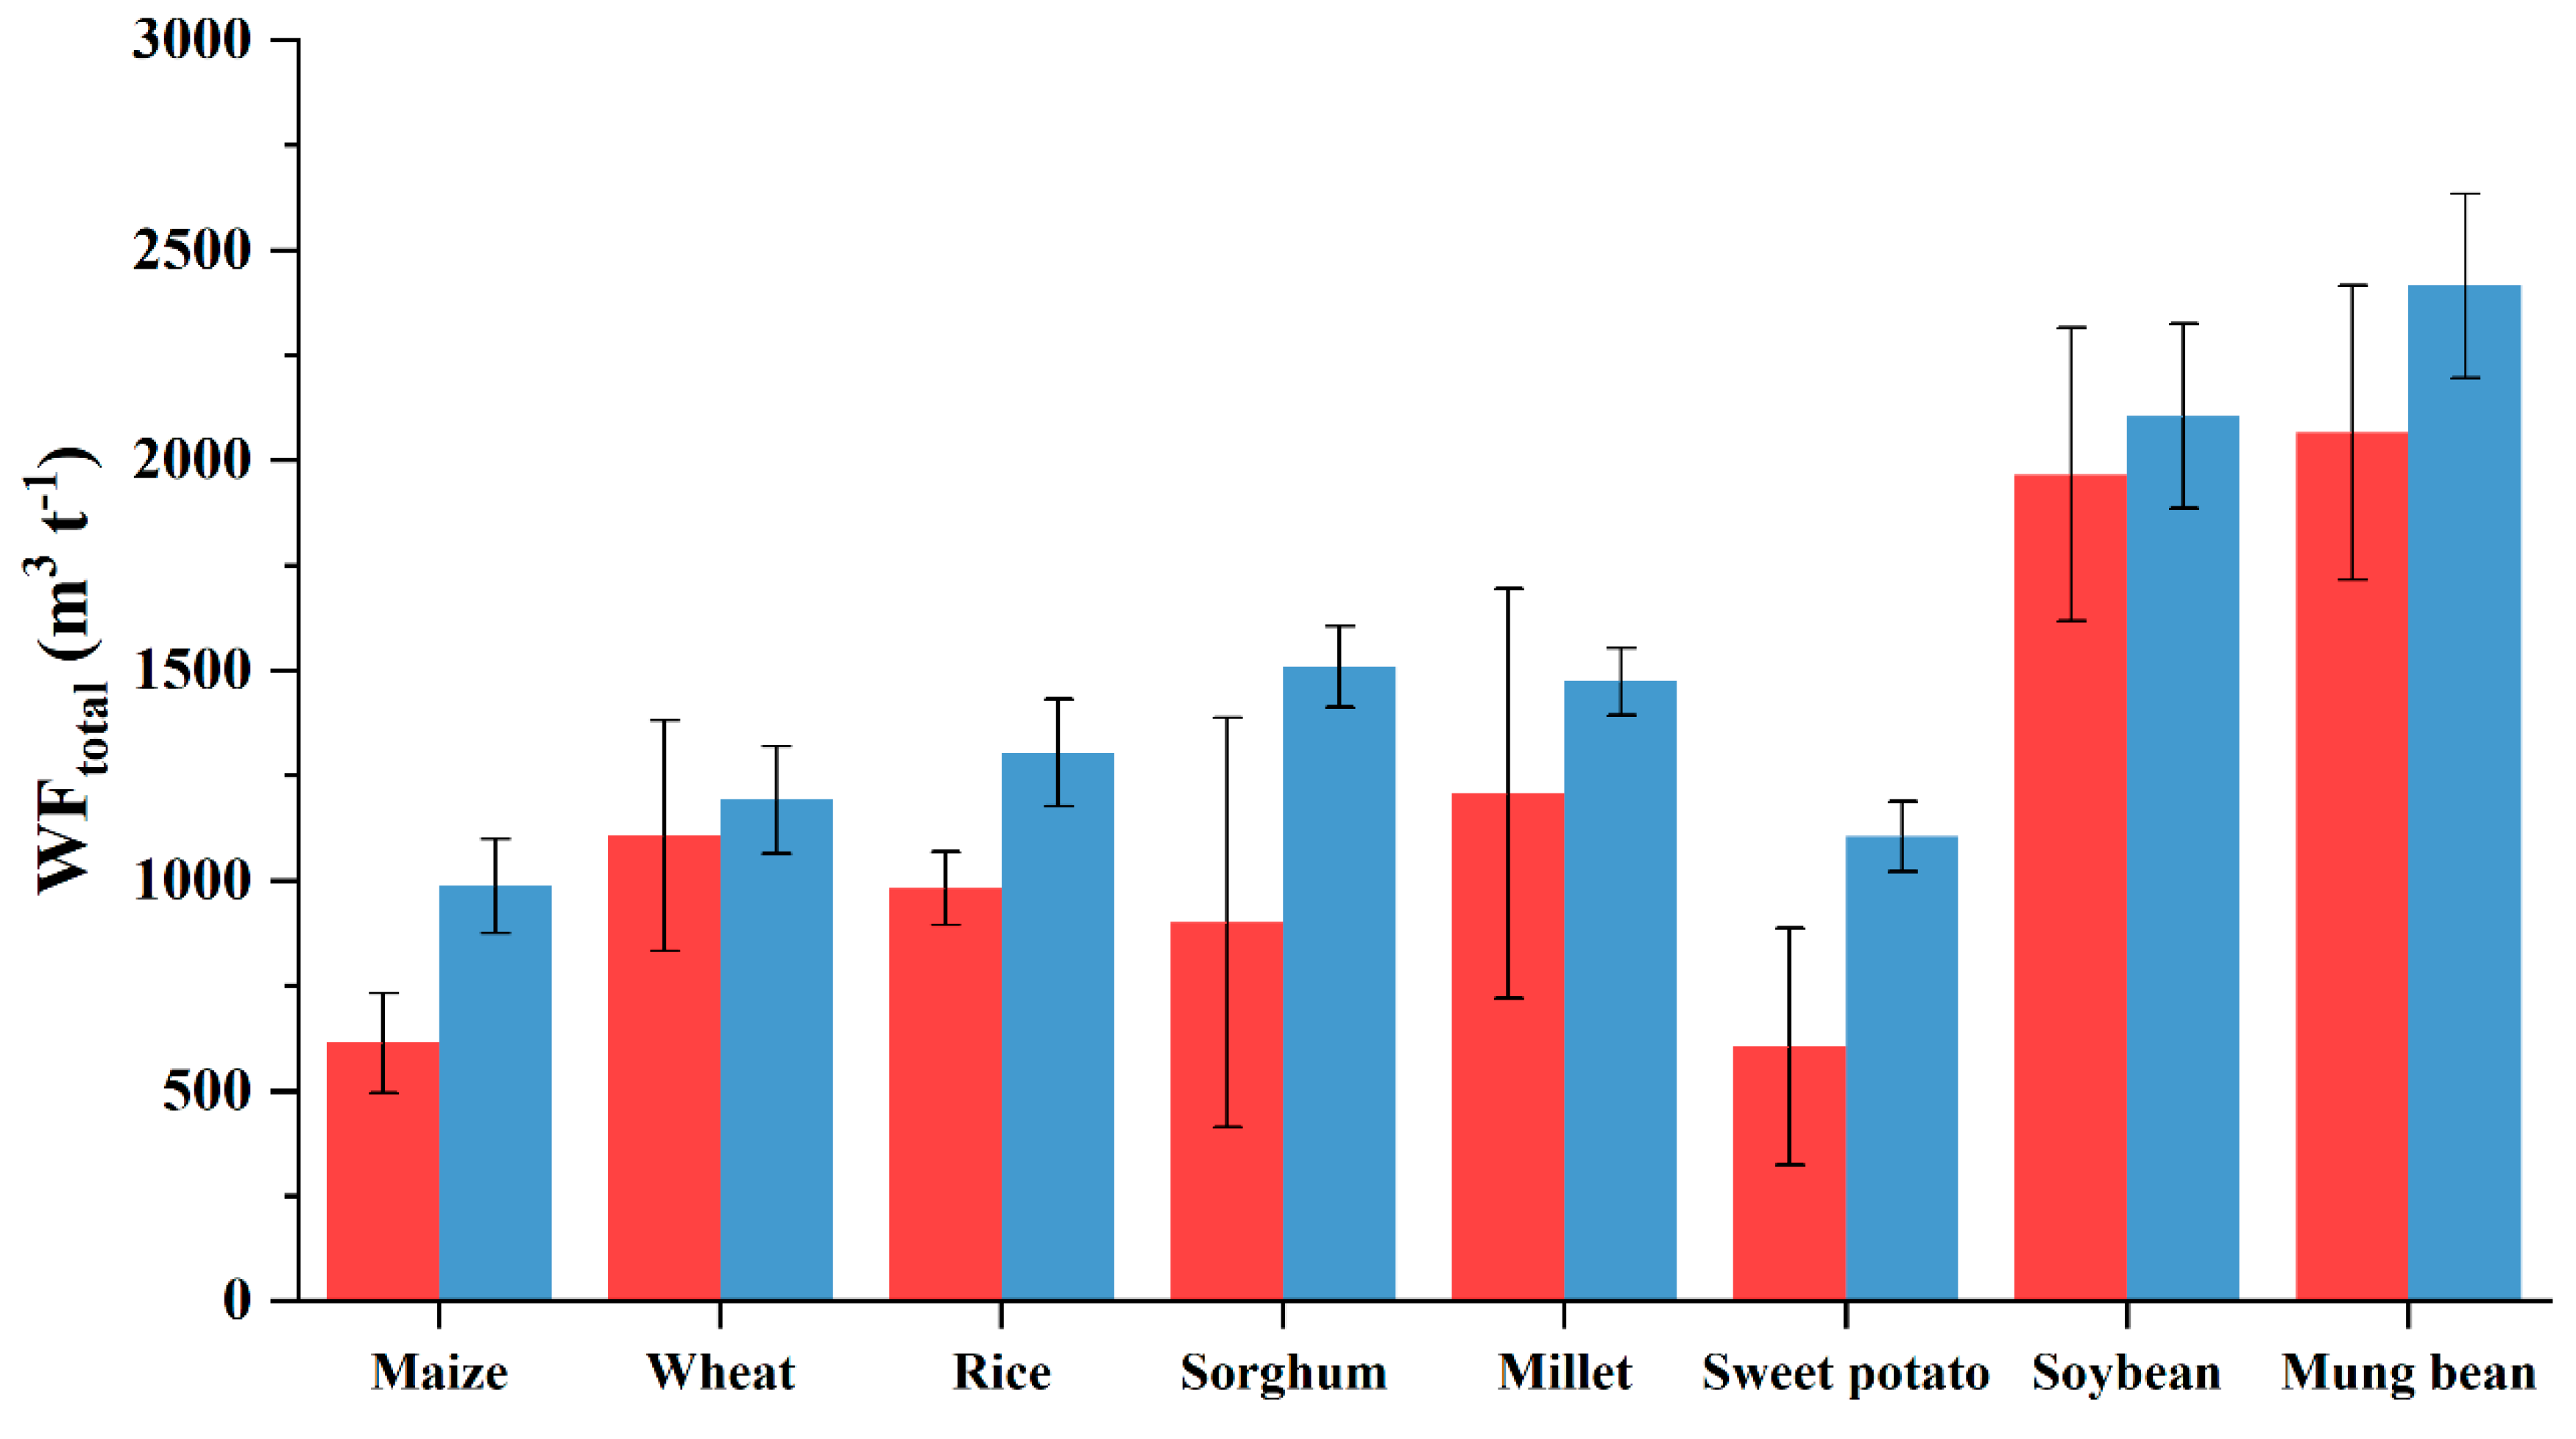
We further compared the WFtotal under green cultivation in this study with traditional cultivation data in previous studies in the same H-H-H farming region (Figure 8). The WFtotal of traditional crops in this study were at the same level and range as those from the previous studies. Under green cultivation, the eight tested crops had a 7–54% lower WFtotal than the traditional cultivations from previous studies, decreasing by up to 54% for sweet potato, 40% for sorghum, 38% for maize, 25% for rice, 18% for millet, 15% for mung bean, 7.2% for wheat and 6.6% for soybean. It indicated that the results from this study were robust and reliable to signify a crop water footprint decrease from traditional to green cultivation. It reinforced again that promoting green crop production had benefits in terms of environment impact.

4. Discussion

4.1. Water Requirements and Yield under Green and Traditional Cultivation Crops

ETc, Er and ETaw were calculated using the SIMETAW model to quantify WFblue and WFgreen of different crops under green and traditional cultivation conditions. Rice and wheat had higher ETc and ETaw values than the other crops, with higher water evapotranspiration and irrigation requirements during the growing season. The ETc and ETaw were about 438 mm and 311 mm for wheat, 350 mm and 174 mm for maize, 336 mm and 216 mm for soybean, 296 mm and 91 mm for millet and 225 mm and 166 mm for mung bean, respectively, which was consistent with previous studies. Ren et al. [68] reported ETc and irrigation rates for wheat in the H-H-H plain of 406 mm and 291 mm, respectively, using a remote-sensed surface energy balance system. Yan et al. [69] concluded that the ETc and irrigation amount for maize in a two-year field experiment were 362 mm and 110 mm, respectively. Paredes et al. [70] simulated an ETc of 327 mm for soybean in the North China Plain using the AquaCrop model. Yang et al. [44] reported an ETc for millet and mung bean of 218 and 288 mm, respectively, in the central and southern Hebei region using the SIMETAW model. The water requirements for each crop in this study were consistent with previous studies, strengthening the accuracy of the later crop WFblue and WFgreen calculation and assessment.
Green cultivation produced 3–13% lower yields than traditional cultivation, mostly due to the long-term use of organic fertilizers (such as manure, biogas slurry and bacterial fertilizer) to completely or partially replacing synthetic fertilizers, thus reducing soil nitrogen content [71]. Previous meta-analyses have demonstrated that organic farming produces 20–25% lower yields than conventional farming [72,73] due to the slow release of plant-available mineral nitrogen from organic fertilizers, which often does not keep up with high crop N demands during peak growth [74]. In a meta-analysis, Zhang et al. [75] reported that the partial substitution of manure for synthetic fertilizer significantly increased upland crop and rice yields by 7% and 3%, respectively, while full substitution significantly reduced yields (10% and 4%, respectively). Yang et al. [76] found that using organic fertilizer to replace 30–50% of urea improved winter wheat yields by 4–9%, which improved the soil microbial community [77]. Therefore, this study suggests the promotion of a combined application of organic and inorganic fertilizers to improve N use efficiency for enhancing crop productivity and quality.

4.2. Water Footprints under Green and Traditional Cultivation Crops

In the H-H-H farming region, blue water consumption was the major drive for winter wheat production, while summer maize mainly depended on green water consumption [78]. In this study, the ratio coefficients for WFblue and WFgreen in rice, mung bean, wheat and soybean under traditional and green cultivation reached 3.9, 2.8, 1.9 and 1.8, respectively, indicating that these crops relied heavily on irrigation. However, sorghum, millet, maize and sweet potato had WFblue to WFgreen ratios < 1, indicating they relied more on natural rainfall. The differences in the WFblue and WFgreen of the different tested crops resulted from the differences in meteorological data, crop charateristics and yields.
Under green cultivation, the eight tested crops had 36–82% lower WFgrey values than under traditional cultivation due to the reduced nitrogen application by using organic fertilizer or a combination of organic and chemical fertilizers; traditional cultivation is mainly based on synthetic nitrogen fertilizers, consistent with other studies [35,54]. Huang et al. [35] reported that the 33% lower N application from traditional practices did not significantly reduce yields but decreased the water eutrophication footprint by 52% and maintained the water scarcity footprint. Wang et al. [54] reported that a 15–30% reduction in fertilizer decreased WFtotal and increased maize yield in northeastern China.
Under green cultivation, the WFtotal of each crop followed a declining trend of 17–55% relative to traditional cultivation. The WFblue proportion of WFtotal in the tested crops increased from 13–35% under traditional cultivation to 17–54% under green cultivation, while the WFgreen proportion increased from 7–27% to 14–35%, and the WFgrey proportion deceased from 46–71% to 27–57%. That is, green cultivation improved blue and green water use and reduced the grey water needed to dilute N leaching to meet environmental quality standards relative to traditional cultivation and promoted the transition from the double dependence on water use amount and water pollution dilution to water quantity.
Sweet potato had the smallest WFtotal (606–750 m3 t−1) of the tested crops under green and traditional cultivation, while mung bean had the highest water footprint (2066–3009 m3 t−1), consistent with the results of previous studies. In one study, sweet potato had the smallest water footprint (630 m3 t−1), followed by sugarcane, sweet sorghum, maize and rice [29]. The WF results under traditional cultivation in our study were consistent with but slightly higher than the average global water footprints for these crops [28]. Mung bean had a 3–4 times larger WF than sweet potato and around double that of wheat under green and traditional cultivation, mainly due to its low yield. Similarly, mung bean had a WF of 1549–6445 m3 t−1 in Thailand and 6561 m3 t−1 [79] in northern Ethiopia [80].
This study compared the WF of eight crops under traditional and green cultivation in the H-H-H farming region based on first-hand data from field performance, establishing WF data for the main crops in this typical region and providing a reference for similar WF calculations in other areas. The absolute value for each crop water footprint changed with several factors, such as crop species, growth duration, planting date, soil parameters, climatic variability, season (irrigated or rainfed), spatial resolution of the datasets used and the simulation model employed. Wang et al. [34] calculated and compared the WF of grain crops in different regions of China in 2010 and also indicated that there were significant differences for the WF among different crops in the same area or among different areas for the same crop.
We used the actual production data from green cultivation farms and cooperatives in the H-H-H farming region with green crop certification authorized by CGFDC to assess the WF of eight crops. The field-data-based WF assessment is important for reducing the uncertainties in WF assessments in model simulations. Future research should consider more years of field data for a stronger statistical analysis to improve the interpretation of the results.

4.3. Implication for Green Cultivation

China is the largest N fertilizer user [81]; N leaching to groundwater increased by 1.5 times from 1980 to 2008, with about 40–50% from crop production [8]. Each year, about 14.5 Tg N is discharged into freshwater bodies in China, exceeding the safe N boundary by 170% and seriously degrading water quality [5]. Ju et al. [82] suggested reducing N leaching and runoff by optimally managing China’s main cropping systems. We also demonstrated that WFgrey under green cultivation can be reduced by more than half. Meanwhile, reducing WFgrey and adjusting the WFblue and WFgreen proportions in the agricultural product chain can enhance crop water productivity and reduce environmental impact. Therefore, it is recommended to promote the rational application of nitrogen fertilizer with organic fertilizers, livestock manure and other organic fertilizers and prioritize green cultivation technologies with low fertilizer requirements and exceptional environmental benefits to promote sustainable agricultural development. Extending this solution to other water-stressed agricultural regions could be an effective strategy in achieving a more sustainable food production system globally. China’s green food production has increased rapidly since the 1990s. Green food certification in China is well established, with the certification of 4422 firms and 10,093 green products in 2017 and 11,000 companies covering 26,000 green products prior to 2017 [10,21,83,84]. Green food development can serve as a driver of economic development, while green growth can expand agricultural performance. Green cultivation technologies can regulate excessive consumption and expenditure in terms of water, energy and chemical input and help reduce pressure on the environment. After decades of green food certification, assessing the policy of extension of green food in China is important. The government could serve as the monitoring body to strengthen the supervision of safe food production and regulate the certification system, which would help promote the reputation of safe food and further increase consumer trust. The economic benefits and incentives of stakeholders for the cost of green crop cultivation and targeted financial support should also be considered by policy makers.

5. Conclusions

Reducing N fertilizer application and improving N use efficiency are important for sustainable crop production systems driven by green products. This study analyzed and compared water footprint components in eight crops under green cultivation with reduced nitrogen and traditional cultivation in the H-H-H farming region. The WFtotal of the eight tested crops decreased by 17–55% under green cultivation relative to traditional cultivation, which was mainly attributed to the decline in WFgrey by 36–82%. Sweet potato had the lowest WF (606 m3 t−1 under green cultivation and 750 m3 t−1 under traditional cultivation), while mung bean had the highest WF (2066 m3 t−1 and 3009 m3 t−1). Under green cultivation, the crop water footprints were ranked mung bean > soybean > millet > wheat > rice > sorghum > maize > sweet potato. Green cultivation with reduced N fertilizer application could reduce the crop water footprint and make a favorable trade-off between water footprint and yield. Optimal nitrogen fertilizer application and improved N fertilizer use efficiency is an important pathway towards sustainable crop production.

Supplementary Materials

The following supporting information can be downloaded at: https://www.mdpi.com/article/10.3390/agronomy12102494/s1.

Author Contributions

X.Y. and T.D. designed the research; J.X. and F.L. performed the research and analyzed the data; X.Y. and J.X. wrote the original paper; S.P., T.S.S. and K.H.M.S. wrote, edited and revised the manuscript. All authors discussed the results. All authors have read and agreed to the published version of the manuscript.

Funding

This work was jointly financed by the National Natural Science Foundation of China (No. 32071975, 31601267, and 51861125103) and Hebei Province Key Research and Development Program of China (20326411D-1).

Data Availability Statement

Not applicable.

Conflicts of Interest

The authors declare no conflict of interest.

References

  1. Li, Y.X.; Zhang, W.F.; Ma, L.; Wu, L.; Shen, J.B.; Davies, W.J.; Oenema, O.; Zhang, F.S.; Dou, Z.X. An analysis of China’s grain production: Looking back and looking forward. Food Energy Secur. 2014, 3, 19–32. [Google Scholar] [CrossRef]
  2. D’Odorico, P.; Davis, K.F.; Rosa, L.; Carr, J.A.; Chiarelli, D.; Dell’Angelo, J.; Gephart, J.; MacDonald, G.K.; Seekell, D.A.; Suweis, S.; et al. The global food-energy-water nexus. Rev. Geophys. 2018, 56, 456–531. [Google Scholar] [CrossRef]
  3. Yang, X.L.; Wang, G.Y.; Chen, Y.Q.; Sui, P.; Pacenka, S.; Steenhuis, T.S.; Siddique, K.H.M. Reduced groundwater use and increased grain production by optimized irrigation scheduling in winter wheat–summer maize double cropping system—A 16-year field study in North China Plain. Field Crop Res. 2022, 275, 108364. [Google Scholar] [CrossRef]
  4. Xu, Z.; Chen, X.; Liu, J.; Zhang, Y.; Chau, S.; Bhattarai, N.; Wang, Y.; Li, Y.; Connor, T.; Li, Y. Impacts of irrigated agriculture on food-energy-water-CO2 nexus across metacoupled systems. Nat. Commun. 2020, 11, 5837. [Google Scholar] [CrossRef] [PubMed]
  5. Yu, C.Q.; Huang, X.; Chen, H.; Godfray, H.C.J.; Wright, J.S.; Hall, J.W.; Gong, P.; Ni, S.Q.; Qiao, S.C.; Huang, G.R.; et al. Managing nitrogen to restore water quality in China. Nature 2019, 567, 516–520. [Google Scholar] [CrossRef] [PubMed]
  6. Guo, J.H.; Liu, X.J.; Zhang, Y.; Shen, J.L.; Han, W.X.; Zhang, W.F.; Cristie, P.; Goulding, K.W.T.; Vitousek, P.M.; Zhang, F.S. Significant acidification in major Chinese croplands. Science 2010, 327, 1008–1010. [Google Scholar] [CrossRef] [Green Version]
  7. Li, A.; Strokal, M.; Bai, Z.; Kroeze, C.; Ma, L. How to avoid coastal eutrophication—A back-casting study for the North China Plain. Sci. Total Environ. 2019, 692, 676–690. [Google Scholar] [CrossRef]
  8. Gu, B.J.; Ge, Y.; Chang, S.X.; Luo, W.D.; Chang, J. Nitrate in groundwater of China: Sources and driving forces. Global Environ. Change 2013, 23, 1112–1121. [Google Scholar] [CrossRef]
  9. Sanders, R. A Market Road to Sustainable Agriculture? Ecological Agriculture, Green Food and Organic Agriculture in China. Dev. Change 2006, 37, 201–226. [Google Scholar] [CrossRef]
  10. Hassan, M.u.; Zhong, J.H.; Xu, J.L.; Wen, X.; Li, X.X. Development and challenges of green food in China. Front. Agric. Sci. Eng. 2020, 7, 56. [Google Scholar] [CrossRef]
  11. Boye, J.I.; Arcand, Y. Current trends in green technologies in food production and processing. Food Eng. Rev. 2013, 5, 1–17. [Google Scholar] [CrossRef] [Green Version]
  12. China Green Food Development Center (CGFDC). Interpretation of Green Food Production Materials; CGFDC: Beijing, China, 2014. [Google Scholar]
  13. China Green Food Development Center (CGFDC). Green Food Statistical Yearbook; CGFDC: Beijing, China, 2017. [Google Scholar]
  14. The State Council Information Office. Key Points of No. 1 Central Document; The State Council Information Office: Beijing, China, 2021.
  15. Liu, X.H.; Chen, F. Farming Systems in China; China Agriculture Press: Beijing, China, 2005. [Google Scholar]
  16. National Bureau of Statistics of China. China Statistical Yearbook; China Statistics Press: Beijing, China, 2021. [Google Scholar]
  17. Kong, X.B.; Zhang, X.L.; Lal, R.; Zhang, F.R.; Chen, X.H.; Niu, Z.G.; Han, L.; Song, W. Groundwater depletion by agricultural intensification in China’s HHH Plains, since 1980s. Adv. Agron. 2016, 135, 59–106. [Google Scholar] [CrossRef]
  18. Liu, M.; Min, L.; Wu, L.; Pei, H.; Shen, Y. Evaluating nitrate transport and accumulation in the deep vadose zone of the intensive agricultural region, North China Plain. Sci. Total Environ. 2022, 825, 153894. [Google Scholar] [CrossRef] [PubMed]
  19. Wang, F.F.; Wang, Y.H.; Cai, Z.C.; Chen, X. Environmental losses and driving forces of nitrogen flow in two agricultural towns of Hebei province during 1997-2017. Environ. Pollut. 2020, 264, 114636. [Google Scholar] [CrossRef] [PubMed]
  20. Liu, Y.F.; Sun, D.S.; Wang, H.J.; Wang, X.J.; Yu, G.Q.; Zhao, X.J. An evaluation of China’s agricultural green production: 1978–2017. J. Clean. Prod. 2020, 243, 118483. [Google Scholar] [CrossRef]
  21. Lin, L.; Zhou, D.Y.; Ma, C.X. Green food industry in China: Development, problems and policies. Renew. Agric. Food Syst. 2010, 25, 69–80. [Google Scholar] [CrossRef]
  22. China Green Food Development Center (CGFDC). Green Food Statistical Yearbook; CGFDC: Beijing, China, 2021. [Google Scholar]
  23. Hoekstra, A.Y. Water scarcity in the zambezi basin in the long-term future: A risk assessment. Integr. Assess. 2003, 4, 185–204. [Google Scholar] [CrossRef]
  24. Sun, S.; Wu, P.; Wang, Y.; Zhao, X.; Liu, J.; Zhang, X. The impacts of interannual climate variability and agricultural inputs on water footprint of crop production in an irrigation district of China. Sci. Total Environ. 2013, 444, 498–507. [Google Scholar] [CrossRef]
  25. Mekonnen, M.M.; Hoekstra, A.Y. The green, blue and grey water footprint of crops and derived crop products. Hydrol. Earth. Syst. Sci. 2011, 15, 1577–1600. [Google Scholar] [CrossRef] [Green Version]
  26. Tuninetti, M.; Tamea, S.; D’Odorico, P.; Laio, F.; Ridolfi, L. Global sensitivity of high-resolution estimates of crop water footprint. Water Resour. Res. 2015, 51, 8257–8272. [Google Scholar] [CrossRef]
  27. Zhang, L.L. Effects of Organic Material Returning on Carbon, Nitrogen and Water Footprint, Ecological Service Value of Winter Wheat; Henan Normal University: Henan, China, 2017. [Google Scholar]
  28. Hoekstra, A.Y.; Chapagain, A.K.; Aldaya, M.M.; Mekonnen, M.M. The Water Footprint Assessment Manual: Setting the Global Standard; Earthscan: London, UK, 2011. [Google Scholar]
  29. Su, M.H.; Huang, C.H.; Li, W.Y.; Tso, C.T.; Lur, H.S. Water footprint analysis of bioethanol energy crops in Taiwan. J. Clean. Prod. 2015, 88, 132–138. [Google Scholar] [CrossRef]
  30. Mohammad, B.; Tim, H.; Heather, S.; Sophie, U.; Joseph, G.J. Value propositions of the water footprint concept for sustainable water utilities. J. Am.Water Work Assoc. 2017, 109, 393–408. [Google Scholar] [CrossRef]
  31. Luan, X.B.; Wu, P.T.; Sun, S.K.; Wang, Y.B.; Gao, X.R. Quantitative study of the crop production water footprint using the SWAT model. Ecol. Indic. 2018, 89, 1–10. [Google Scholar] [CrossRef]
  32. Hossain, I.; Imteaz, M.A.; Khastagir, A. Water footprint: Applying the water footprint assessment method to Australian agriculture. J. Sci. Food Agric. 2021, 101, 4090–4098. [Google Scholar] [CrossRef]
  33. Rajakal, J.P.; Ng, D.K.S.; Tan, R.R.; Andiappan, V.; Wan, Y.K. Multi-objective expansion analysis for sustainable agro-industrial value chains based on profit, carbon and water footprint. J. Clean. Prod. 2021, 288, 125117. [Google Scholar] [CrossRef]
  34. Wang, Y.B.; Wu, P.T.; Engel, B.A.; Sun, S.K. Application of water footprint combined with a unified virtual crop pattern to evaluate crop water productivity in grain production in China. Sci. Total Environ. 2014, 497–498, 1–9. [Google Scholar] [CrossRef]
  35. Huang, J.; Zhang, H.-L.; Tong, W.-J.; Chen, F. The impact of local crops consumption on the water resources in Beijing. J. Clean. Prod. 2012, 21, 45–50. [Google Scholar] [CrossRef]
  36. Borsato, E.; Galindo, A.; Tarolli, P.; Sartori, L.; Marinello, F. Evaluation of the grey water footprint comparing the indirect effects of different agricultural practices. Sustainability 2018, 10, 3992. [Google Scholar] [CrossRef] [Green Version]
  37. Vale, R.L.; Netto, A.M.; Toríbio de Lima Xavier, B.; de Lâvor Paes Barreto, M.; Siqueira da Silva, J.P. Assessment of the gray water footprint of the pesticide mixture in a soil cultivated with sugarcane in the northern area of the State of Pernambuco, Brazil. J. Clean. Prod. 2019, 234, 925–932. [Google Scholar] [CrossRef]
  38. Snyder, R.L.; Geng, S.; Orang, M.N.; Matyac, J.S. A simulation model for ET of applied water. Acta Horticult. 2004, 664, 623–629. [Google Scholar] [CrossRef]
  39. Snyder, R.L.; Orang, M.N.; Matyac, S.G.J.S.; Sarreshteh, S. SIMETAW (Simulation of Evapotranspiration of Applied Water). Calif. Water Plan Update 2005, 4, 211–226. [Google Scholar]
  40. Snyder, R.L.; Geng, S.; Orang, M.; Sarreshteh, S. Calculation and simulation of evapotranspiration of applied water. J. Integr. Agric. 2012, 11, 489–501. [Google Scholar] [CrossRef]
  41. Kong, Q.X.; Zhang, H.L.; Chen, F.; Song, Z.W. Estimation of main crop water requirement in Beijing based on SIMETAW model. J. Chin. Agric. Univ. 2009, 14, 109–115. [Google Scholar]
  42. Yang, X.L.; Huang, J.; Chen, F.; Chu, Q.Q. Comparison of temporal and spatial variation of water requirements of corn in Huang-huai-hai. J. Chin. Agric. Univ. 2011, 16, 26–31. [Google Scholar]
  43. Yang, X.L.; Gao, W.S.; Shi, Q.H.; Chen, F.; Chu, Q.Q. Impact of climate change on the water requirement of summer maize in the Huang-Huai-Hai farming region. Agric. Water Manag. 2013, 124, 20–27. [Google Scholar] [CrossRef]
  44. Yang, X.L.; Liang, F.T.; Yan, J.P.; Chen, Y.Q.; Jia, X.L. Research on water requirements of diversified crop rotations in the middle and southern areas of Hebei Province. J. Chin. Agric. Univ. 2021, 26, 01–17. [Google Scholar]
  45. Hu, S.; Mo, X.G.; Lin, Z.H. Influence of possible changes in winter wheat planting regions on the profit and loss of agricultural water resources in the Huang-Huai-Hai region. Geogr. Res. 2017, 36, 861–871. [Google Scholar] [CrossRef]
  46. Jia, H.; Zhang, T.; Yin, X.G.; Shang, M.F.; Chen, F.; Lei, Y.D.; Chu, Q.Q. Impact of climate change on the water requirements of oat in Northeast and North China. Water 2019, 11, 91. [Google Scholar] [CrossRef] [Green Version]
  47. Allen, R.G.; Pereira, L.S.; Raes, D.; Smith, G. Crop Evapotranspiration—Guidelines for Computing Crop Water Requirements—FAO Irrigation and Drainage Paper 24; Food and Agriculture Organization of the United Nations: Rome, Italy, 1998. [Google Scholar]
  48. Doorenbos, J.; Pruitt, W.O. Crop Water Requirements—FAO Irrigation and Drainage Paper 56; Food and Agriculture Oragnization of the United Nations: Rome, Italy, 1977. [Google Scholar]
  49. Allen, R.G.; Walter, I.A.; Elliott, R.L.; Howell, T.; Itenfisu, D.; Jensen, M.E. The ASCE Standardized Reference Evapotranspiration Equation; University of Idaho: Moscow, ID, USA, 2005. [Google Scholar]
  50. Chapagain, A.K.; Hoekstra, A.Y. The blue, green and grey water footprint of rice from production and consumption perspectives. Ecol. Indic. 2011, 70, 749–758. [Google Scholar] [CrossRef]
  51. Wang, D.Y.; Li, J.B.; Ya, Y.Y.; Tan, F.F. An improved calculation method of grey water footprint. Int. J. Agric. Nat. Res. 2015, 30, 2120–2130. [Google Scholar]
  52. Wang, S.; Fu, G.; Ma, X.; Xu, L.; Yang, F. Exploring the optimal crop planting structure to balance water saving, food security and incomes under the spatiotemporal heterogeneity of the agricultural climate. J. Environ. Manag. 2021, 295, 113130. [Google Scholar] [CrossRef] [PubMed]
  53. Yang, F.; Zhang, S.S.; Song, J.P.; Du, Q.; Li, G.X.; Tarakina, N.V.; Antonietti, M. Synthetic humic acids solubilize otherwise insoluble phosphates to improve soil fertility. Angew. Chem. Int. Ed. Engl. 2019, 58, 18813–18816. [Google Scholar] [CrossRef] [PubMed] [Green Version]
  54. Wang, J.; Qin, L.; Cheng, J.; Shang, C.; Li, B.; Dang, Y.; He, H. Suitable chemical fertilizer reduction mitigates the water footprint of maize production: Evidence from Northeast China. Environ. Sci. Pollut. Res. Int. 2022, 29, 22589–22601. [Google Scholar] [CrossRef] [PubMed]
  55. Chapagain, A.K.; Hoekstra, A.Y. The blue, green and grey water footprint of rice from production and consumption perspectives. Ecol. Econ. 2011, 70, 749–758. [Google Scholar] [CrossRef]
  56. Yang, H.; Liu, L.J.; Liu, Z.J.; Shang, W.Q.; Qu, X.J. Analysis and suggestions of agricultural fertilizer application in China. J. Agr. Mech. Res. 2014, 36, 260–264. [Google Scholar] [CrossRef]
  57. Zhang, Y.; Li, Y.K.; Ouyang, Z.Y.; Liu, J.G. The grey water footprint of the winter wheat-summer mazie crop rotation system of the North China Plain. Acta. Ecol. Sin. 2015, 35, 6647–6654. [Google Scholar]
  58. Yang, W.X. Influencing Factors and Estimation of Nitrogen and Phosphorus from Farmlands in China; Nanjing Agricultural University: Nanjing, China, 2015. [Google Scholar]
  59. Liu, C.; Kroeze, C.; Hoekstra, A.Y.; Gerbens-Leenes, W. Past and future trends in grey water footprints of anthropogenic nitrogen and phosphorus inputs to major world rivers. Ecol. Indic. 2012, 18, 42–49. [Google Scholar] [CrossRef]
  60. Liu, W.F.; Antonelli, M.; Liu, X.C.; Yang, H. Towards improvement of grey water footprint assessment: With an illustration for global maize cultivation. J. Clean. Prod. 2017, 147, 1–9. [Google Scholar] [CrossRef]
  61. Feng, H.; Sun, F.; Liu, Y.; Zeng, P.; Deng, L.; Che, Y. Mapping multiple water pollutants across China using the grey water footprint. Sci. Total Environ. 2021, 785, 147255. [Google Scholar] [CrossRef]
  62. Yu, C.; Yin, X.; Li, H.; Yang, Z. A hybrid water-quality-index and grey water footprint assessment approach for comprehensively evaluating water resources utilization considering multiple pollutants. J. Clean. Prod. 2020, 248, 119225. [Google Scholar] [CrossRef]
  63. Zhao, Y.X.; Wang, L.; Lei, X.Y.; Wang, B.; Cui, J.X.; Xu, Y.N.; Chen, Y.Q.; Sui, P. Reducing carbon footprint without compromising grain security through relaxing cropping rotation system in the North China Plain. J. Clean. Prod. 2021, 318, 128465. [Google Scholar] [CrossRef]
  64. Han, Y.P.; Qu, C.; Jia, D.D. Analysis of water footprint and water consumption structure of major crops in Hebei province. J. Irrig. Drain. 2019, 38, 121–128. [Google Scholar] [CrossRef]
  65. Zhang, K.; Zhou, J.; Zhao, J.; Pei, K.; Wang, Z.M.; Hu, Y.G.; Zeng, Z.H. Agricultural groundwater footprint of the major cropping system in the North China Plain: A case study of Wuqiao County, Hebei Province. J. Chin. Agric. Univ. 2020, 25, 328–336. [Google Scholar] [CrossRef]
  66. Xie, P.X. Estimating Blue and Green Water Resources, Water Footprints and Water Scarcities in the Yellow River Basin; Northwest A&F University: Yangling, China, 2020. [Google Scholar]
  67. Dai, C.; Qin, X.S.; Lu, W.T. A fuzzy fractional programming model for optimizing water footprint of crop planting and trading in the Hai River Basin, China. J. Clean. Prod. 2021, 278, 123196. [Google Scholar] [CrossRef]
  68. Ren, P.P.; Huang, F.; Li, B.G. Spatiotemporal patterns of water consumption and irrigation requirements of wheat-maize in the Huang-Huai-Hai Plain, China and options of their reduction. Agric. Water Manag. 2022, 263, 107468. [Google Scholar] [CrossRef]
  69. Yan, Z.X.; Gao, C.; Ren, Y.J.; Zong, R.; Ma, Y.Z.; Li, Q.Q. Effects of pre-sowing irrigation and straw mulching on the grain yield and water use efficiency of summer maize in the North China Plain. Agric. Water Manag. 2017, 186, 21–28. [Google Scholar] [CrossRef]
  70. Paredes, P.; Wei, Z.; Liu, Y.; Xu, D.; Xin, Y.; Zhang, B.; Pereira, L.S. Performance assessment of the FAO AquaCrop model for soil water, soil evaporation, biomass and yield of soybeans in North China Plain. Agric. Water Manag. 2015, 152, 57–71. [Google Scholar] [CrossRef] [Green Version]
  71. Antošovský, J.; Prudil, M.; Gruber, M.; Ryant, P. Comparison of two different management practices under organic farming system. Agronomy 2021, 11, 1466. [Google Scholar] [CrossRef]
  72. Ponti, T.; Rijk, B.; van Ittersum, M.K. The crop yield gap between organic and conventional agriculture. Agric. Syst. 2012, 108, 1–9. [Google Scholar] [CrossRef]
  73. Ponisio, L.C.; M’Gonigle, L.K.; Mace, K.C.; Palomino, J.; de Valpine, P.; Kremen, C. Diversification practices reduce organic to conventional yield gap. Proc. Biol. Sci. 2015, 282, 20141396. [Google Scholar] [CrossRef] [Green Version]
  74. Seufert, V.; Ramankutty, N.; Foley, J.A. Comparing the yields of organic and conventional agriculture. Nature 2012, 485, 229–232. [Google Scholar] [CrossRef]
  75. Zhang, X.; Fang, Q.; Zhang, T.; Ma, W.; Velthof, G.L.; Hou, Y.; Oenema, O.; Zhang, F. Benefits and trade-offs of replacing synthetic fertilizers by animal manures in crop production in China: A meta-analysis. Glob. Change Biol. 2020, 26, 888–900. [Google Scholar] [CrossRef] [PubMed]
  76. Yang, X.Y.; Zhang, C.; Ma, X.L.; Liu, Q.J.; An, J.; Xu, S.J.; Xie, X.Y.; Geng, J.B. Combining organic fertilizer with controlled-release urea to reduce nitrogen leaching and promote wheat yields. Front. Plant Sci. 2021, 12, 802137. [Google Scholar] [CrossRef] [PubMed]
  77. Ji, L.F.; Wu, Z.D.; You, Z.M.; Yi, X.Y.; Ni, K.; Guo, S.W.; Ruan, J.Y. Effects of organic substitution for synthetic N fertilizer on soil bacterial diversity and community composition: A 10-year field trial in a tea plantation. Agric. Ecosyst. Environ. 2018, 268, 124–132. [Google Scholar] [CrossRef]
  78. Lu, Y.; Zhang, X.Y.; Chen, S.Y.; Shao, L.W.; Sun, H.Y. Changes in water use efficiency and water footprint in grain production over the past 35 years: A case study in the North China Plain. J. Clean. Prod. 2016, 116, 71–79. [Google Scholar] [CrossRef]
  79. Gheewala, S.; Silalertruksa, T.; Nilsalab, P.; Mungkung, R.; Perret, S.; Chaiyawannakarn, N. Water footprint and impact of water consumption for food, feed, fuel crops production in Thailand. Water 2014, 6, 1698–1718. [Google Scholar] [CrossRef]
  80. Gebremariam, F.T.; Habtu, S.; Yazew, E.; Teklu, B. The water footprint of irrigation-supplemented cotton and mung-bean crops in Northern Ethiopia. Heliyon 2021, 7, e06822. [Google Scholar] [CrossRef]
  81. International Fertilizer Industry Association. IFA Data. 2016. Available online: https://www.agropages.com/CompanyDirectory/Detail-10153.htm (accessed on 1 October 2019).
  82. Ju, X.T.; Xing, G.X.; Chen, X.P.; Zhang, S.L.; Zhang, L.J.; Liu, X.J.; Cui, Z.L.; Yin, B.; Christie, P.; Zhu, Z.L.; et al. Reducing environmental risk by improving N management in intensive Chinese agricultural systems. Proc. Natl. Acad. Sci. USA 2009, 106, 3041–3046. [Google Scholar] [CrossRef] [Green Version]
  83. Yu, X.; Gao, Z.; Zeng, Y. Willingness to pay for the “Green Food” in China. Food Policy 2014, 45, 80–87. [Google Scholar] [CrossRef]
  84. Jiang, Y.; Wang, H.; Jin, S.S.; Delgado, M. The promising effect of a green food label in the new online market. Sustainability 2019, 11, 796. [Google Scholar] [CrossRef]
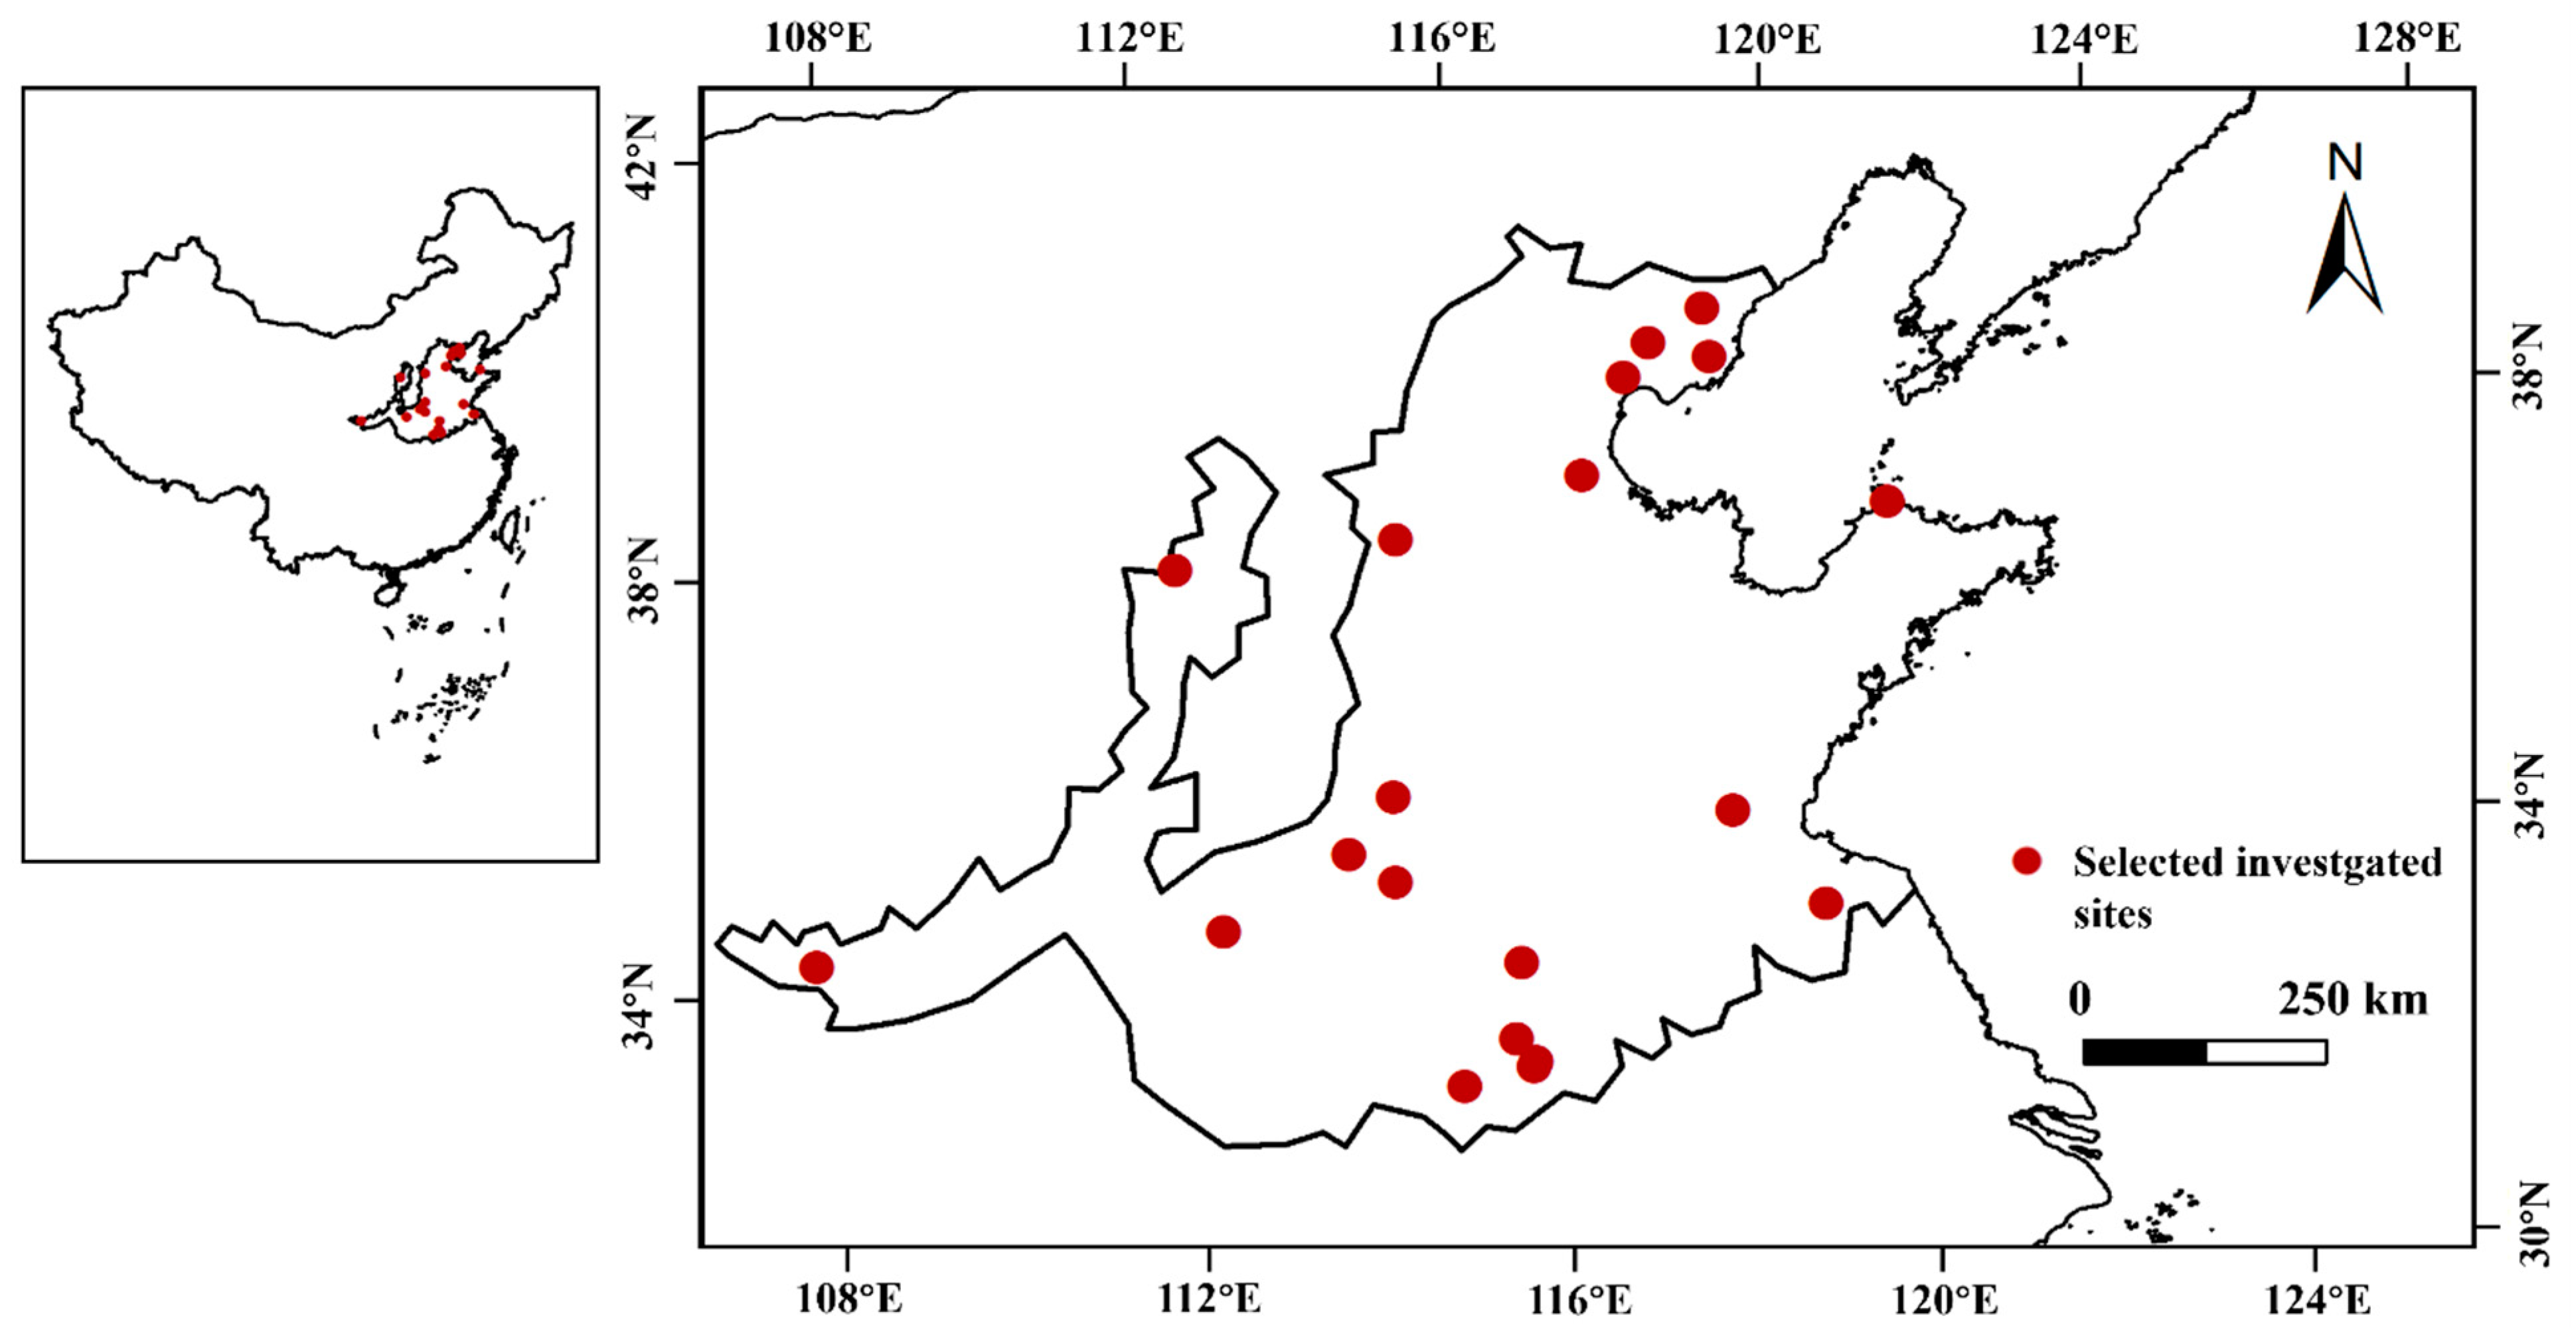
Figure 1. Location of the Huang-Huai-Hai farming region and 19 investigated sites. The investigated sites were in Leting, Lutai, Guanzhuang, Lulong, Gaocheng, Hua County, Xincai, Yuanyang, Xiangfu, Yichuan, Penglai, Hedong, Taihe, Yingquan, Yingzhou, Qiaocheng, Mei County, Guannan and Ninghe.
Agronomy 12 02494 g001
Figure 2. Planting area of main crops in the Huang-Huai-Hai farming region from 2014–2020.
Agronomy 12 02494 g002
Figure 3. Water requirement (ETc), effective rainfall (Er), and irrigation requirement (ETaw) of different tested crops under traditional cultivation in Huang-Huai-Hai farming region. The bar and whisker are the average value and standard deviation of each indicator for each crop across all the investigated sites, respectively.
Agronomy 12 02494 g003
Figure 4. Crop yields in (a) traditional cultivation and (b) green cultivation systems in the Huang-Huai-Hai farming region in 2018. The bar and whisker are the average value and standard deviation of yield for each crop across all the investigated sites, respectively. Sweet potato dry matter was converted from fresh weight using a coefficient of equivalent yield (0.23) [63].
Agronomy 12 02494 g004
Figure 5. Crop water footprint of green and traditional cultivations in the Huang-Huai-Hai farming region. Boxplots indicate the 25, 50 (median) and 75 percentiles with horizontal lines joined into a box covering the central 50% of the data. Vertical lines above and below the box extend to outlier cutoffs, which go above and below the box by 1.5 times the 75–25 percentile range. The squares in the box indicate the mean. Circles indicate individual data.
Agronomy 12 02494 g005
Figure 6. Comparison of the water footprint of each crop under green and traditional cultivations in the Huang-Huai-Hai farming region.
Agronomy 12 02494 g006
Figure 7. Composition of water footprint components in different crops under green and traditional cultivations. The value of blue, green and grey colors in each chart indicates the proportion of WFgreen, WFblue and WFgrey to WFtotal, respectively.
Agronomy 12 02494 g007
Figure 8. Comparison of WFtotal under green cultivation in this study (red) and traditional cultivation in previous studies (blue) in the Huang-Huai-Hai farming region. Blue bar data comes from Han et al. [64] Zhang et al. [65] Xie et al. [66] and Dai et al. [67].
Agronomy 12 02494 g008
Publisher’s Note: MDPI stays neutral with regard to jurisdictional claims in published maps and institutional affiliations.