Article

Automatic Estimation of Apple Orchard Blooming Levels Using the Improved YOLOv5

1
College of Mechanical and Electronic Engineering, Shandong Agricultural University, Tai’an 271018, China
2
Shandong Provincial Key Laboratory of Horticultural Machineries and Equipment, Tai’an 271018, China
*
Author to whom correspondence should be addressed.
Agronomy 2022, 12(10), 2483; https://doi.org/10.3390/agronomy12102483
Submission received: 4 September 2022 / Revised: 9 October 2022 / Accepted: 9 October 2022 / Published: 12 October 2022

Abstract

:
The estimation of orchard blooming levels and the determination of peak blooming dates are very important because they determine the timing of orchard flower thinning and are essential for apple yield and quality. In this paper, we propose an orchard blooming level estimation method for global-level and block-level blooming level estimation of orchards. The method consists of a deep learning-based apple flower detector, a blooming level estimator, and a peak blooming day finding estimator. The YOLOv5s model is used as the apple flower detector, which is improved by adding a coordinate attention layer and a small object detection layer and by replacing the model neck with a bidirectional feature pyramid network (BiFPN) structure to improve the performance of the apple flower detector at different growth stages. The robustness of the apple flower detector under different light conditions and the generalization across years was tested using apple flower data collected in 2021–2022. The trained apple flower detector achieved a mean average precision of 77.5%. The blooming level estimator estimated the orchard blooming level based on the proportion of flowers detected at different growth stages. Statistical results show that the blooming level estimator follows the trend of orchard blooming levels. The peak blooming day finding estimator successfully positioned the peak blooming time and provided information for the flower thinning timing decision. The method described in this paper is able to provide orchardists with accurate information on apple flower growth status and is highly automated.

1. Introduction

Flower thinning is beneficial to improving apple yield and fruit quality, and choosing a reasonable timing of flower thinning helps to reduce crop load levels, improve fruit tree disease resistance, reduce yield fluctuations, and improve bud quality [1,2,3]. Mechanical [4] and chemical [5] flower thinning has been widely used to improve the automation of the flower thinning process and reduce labor intensity, but the judgment of flower thinning timing has not achieved automation. Because apple flower growth levels are influenced by weather and temperature and natural environmental factors, the timing of flower thinning remains an unpredictable part of apple production with large variations within years and from year to year [6]. Generally, orchard blooming levels are monitored by growers counting a limited number of fruit trees in the orchard within a selected location, a method based on visual estimation that is not representative and time-consuming [7]. Computer vision and deep learning techniques can effectively gather information on orchard blooming levels to help farmers’ decision-making and reduce reliance on experience.
In the refinement of intelligent orchard management, apple flower/fruit identification and growth stage estimation based on image information have received considerable attention from many scholars. Meanwhile, computer vision techniques have been widely used in crop pest and disease identification [8], fruit detection [9], and automatic detection of flowering stages [10]. In early work on apple flower detection, traditional machine vision methods based on color and threshold were widely used. The authors of [11] analyzed flower density variation in orchards based on image processing methods that adjust color thresholds to determine the correlation between flower density and orchard yield. The authors of [12] developed a method for adjusting the hue, saturation, and brightness of the image in order to estimate the number of flower clusters of an individual fruit tree in a high-density apple orchard. However, the limitations of the above-mentioned color and threshold-based methods are the dependence on lighting conditions, poor robustness of the algorithm, and the manual-based adjustment of threshold parameters, which makes this method inapplicable in actual production practice [12]. Obviously, the use of manual feature extraction and color thresholding-based methods is challenging when it comes to distinguishing apple flowers with different phenological periods and shaped contours in complex natural environments. The application of UAV remote sensing images to analyze apple tree flowering intensity has recently received attention, and the authors of [13] explored the potential of UAV RGB high-resolution imagery to measure flowering intensity. Image segmentation techniques were used to segment the white pixels, which corresponded to apple blossoms in orthophotos and single photographs. The results showed a maximum correlation of 0.54 between white pixels and flower clusters for each tree. Those results show the complexity of using UAV images. The authors of [14] mapped the cluster density of apple flowering by processing unmanned aerial vehicle (UAV) images using binary classification and K-nearest neighbor algorithms, respectively. The results show that flower cluster detection is limited by various factors, such as weather, canopy volume, flowering phenology, intercropping, soil color, and the number of bands to be analyzed. The authors of [13] suggested that there are still other methods to be researched before discarding the use of UAV RGB images for estimating flowering intensity.
In agriculture, uncontrollable natural environmental conditions and complex backgrounds cause difficulties in the application of traditional machine vision methods. With the development of deep learning, convolutional neural networks (CNN) are widely used for classification [15], detection [16], and segmentation [17] of agricultural products for their efficient automatic feature extraction capability and high stability. In terms of estimating the phenological stages of flowers and fruits using deep learning techniques, the authors of [18] proposed an improved YOLOv3 model for detecting apples at three growth stages: young, swollen, and ripe in orchards with fluctuating illumination and complex backgrounds. The authors of [19] proposed a lightweight CNN named Fusion-YOLO (F-YOLO) and achieved the detection of tea chrysanthemum at three growth stages, budding, early flowering, and full-blooming, with the highest detection average accuracy of 89.53%. From the above work, it could be seen that the deep learning technique shows high accuracy and robustness in the detection of agricultural products at different phenological stages.
Therefore, deep learning algorithms are applied to the classification [20], detection [21], and segmentation [22,23,24] of apple flowers. The authors of [25] proposed a CNN+SVM-based model for segmenting apple flowers in images, which outperforms methods based on color analysis and verifies that the hierarchical features extracted by CNN can effectively combine color and morphological information. The authors of [26] implemented the Mask R-CNN algorithm to perform instance segmentation of apple flowers. Different image enhancement techniques were implemented, and it was verified that the implementation of image augmentation was essential to reduce the validation loss and improve the detection accuracy of the segmentation algorithm. The network achieved an average precision (AP) of 0.86 in the test dataset. The authors of [27] proposed the FCNs-Edge model for generating apple flower density mapping, and FCNs-Edge implemented a novel end-to-end apple flower segmentation algorithm, which was able to obtain pixel-level F1 scores of up to 85.6%. The authors of [28] used generative modules and various image preprocessing methods for data enhancement of the apple flower dataset. The pruning inference proposed by the authors can automatically deactivate part of the network structure according to different conditions and reduce the network parameters. The model can achieve 90.01%, 98.79%, and 97.43% in precision, recall, and mAP, respectively, in detecting the apple flowers. The authors of [29] proposed a weakly supervised flower/fruit counting network based on deep learning named CountNet, implementing flower and fruit counting of apples. The aforementioned work focuses on the segmentation of apple flowers at pixel level and object level detection at individual growth stages in fruit trees; however, this paper is more concerned with the estimation of blooming levels in orchards.
In previous work on apple orchard blooming level estimation, the authors of [30] proposed a system capable of estimating blooming intensity and peak blooming date from tree images. The system has three stages: a visual flower detector based on a deep convolutional neural network, followed by a blooming level estimator, and a peak blooming day finding algorithm. The trained detector was able to detect flowers on trees with an average precision score of 0.68. However, there is still much room for improvement in the performance of the apple blossom detector, and the ‘on-sight estimator’ for blooming intensity estimation, which uses the average blossom size as one of the explanatory variables, introduces instability into the estimator because the flower size in the image is affected by the angle and distance of the shot. The authors of [31] suggested that further segmentation of blossom areas could contribute to the extraction of detailed growth information of apple flowers. Therefore, the authors proposed an instance segmentation model that improved Mask Scoring R-CNN (MASU R-CNN) with a U-Net backbone for detecting and segmenting apple flowers in bud, semi-open, and fully open at three different growth statuses. Although instance segmentation of apple flowers for different growth states provides richer information on apple flower morphology, according to the discussion in [30], the estimation of blooming levels in global apple orchards is based on statistics of apple flowers at different growth stages. The authors of [7] proposed a CNN-based DeepPhenology model to implement an 8-stage apple flower phenology distribution estimation, which is able to effectively map apple flower distribution on an image-level, row-level, and block-level without labeling individual flower clusters. The results show an average Kullback–Leibler (KL) divergence value of 0.23 over all the validation sets. Since the input to the model is limited to a quadrangle, information on the flowering status of certain parts of the whole tree is lost.
Based on the above research and discussion, an algorithm that can capture information on the blooming level of apple flowers of the whole fruit tree at a larger scale and automatically and stably estimate the global or block-level blooming level of an orchard is needed for the production practice of orchard flowering management. Therefore, this paper proposes an automatic orchard blooming level estimation algorithm, which consists of three parts: an apple flower detector, a blooming level evaluator, and a peak bloom day finder. First of all, we improve the YOLOv5s model and use the improved model as an apple flower detector. Based on this, we tested the robustness of the apple flower detector under different light conditions and examined the interannual knowledge transfer ability of the apple flower detector using the apple flower datasets for the years 2021 and 2022. The blooming level estimator achieved block-level blooming level estimation in orchards, and the peak blooming date was pinpointed by the peak blooming day finding estimator. In the end, the detection results of the apple flower detection model before and after the improvement were analyzed, and the performance of the detection model proposed in this paper was compared with that of the baseline model.

2. Materials and Methods

2.1. Definition of Blooming Level

To achieve a block-level or global estimate of orchard blooming levels and to illustrate the inputs for the apple flower detection network, it is necessary to define blooming levels according to the morphology of apple flowers in different phenological periods. Generally, orchardists categorize the growth state of apple flowers into three stages: ‘Bud’, ‘Full Flowering’, and ‘Withered Flower’. However, this division does not provide a fine estimation of apple flower phenological distribution.
The buds of apple flowers are mixed buds that sprout in spring and produce a new section of tips. In the Yellow River basin, apple tree flowering is mostly concentrated in April, and the flowering period lasts for about 2–3 weeks. Based on the above growth characteristics of apple flowers and the way of dividing the phenological stages proposed by [7], we have adopted a definition of six stages of blooming levels, and the growth states of apple flowers at each blooming level are shown in Figure 1. Initially, the buds of apple flowers are small, dense, and green in color, which are called the ‘Spitting buds’ (Figure 1a). As the pedicels elongate and the buds gradually swell, the buds take on a white or pinkish globular shape. However, at this stage, each bud remains close together and the buds are generally spherical in shape, which is called ‘Tight Clusters’ (Figure 1b). In the next stage, the buds gradually spread out and swell, and each cluster of apple flowers will have 5–6 white or pink balloon-like buds, denoted the ‘Balloon Blossom’ stage (Figure 1c). Apple flowers in the ‘Balloon Blossom’ stage will soon enter the next stage, called the ‘King Bloom’ stage (Figure 1d). During the ‘King Bloom’ stage, the central flower in a cluster is fully bloomed, while the other flowers in the cluster remain in balloon-like buds and grow around the central flower. The next stage is the gradual opening of the bulb around the queen flower, which is called the ‘Full Bloom’ stage (Figure 1e). When there are faded petals in a cluster of apple flowers, this stage is called the ‘Petal Fall’ stage (Figure 1f). As opposed to [7], the flowering potential of the buds is unknown, considering the effect of the previous year’s thinning of fruits and flowers. Heavy fruiting can also partially or completely inhibit the formation of flower buds [32]. Meanwhile, the distinction between flower buds and leaf buds is commonly not obvious and hard to identify [20]. Therefore, the detection of buds at the stage before ‘SB’ was discarded in this study.

2.2. Image Collection and Dataset Building

2.2.1. Image Collection

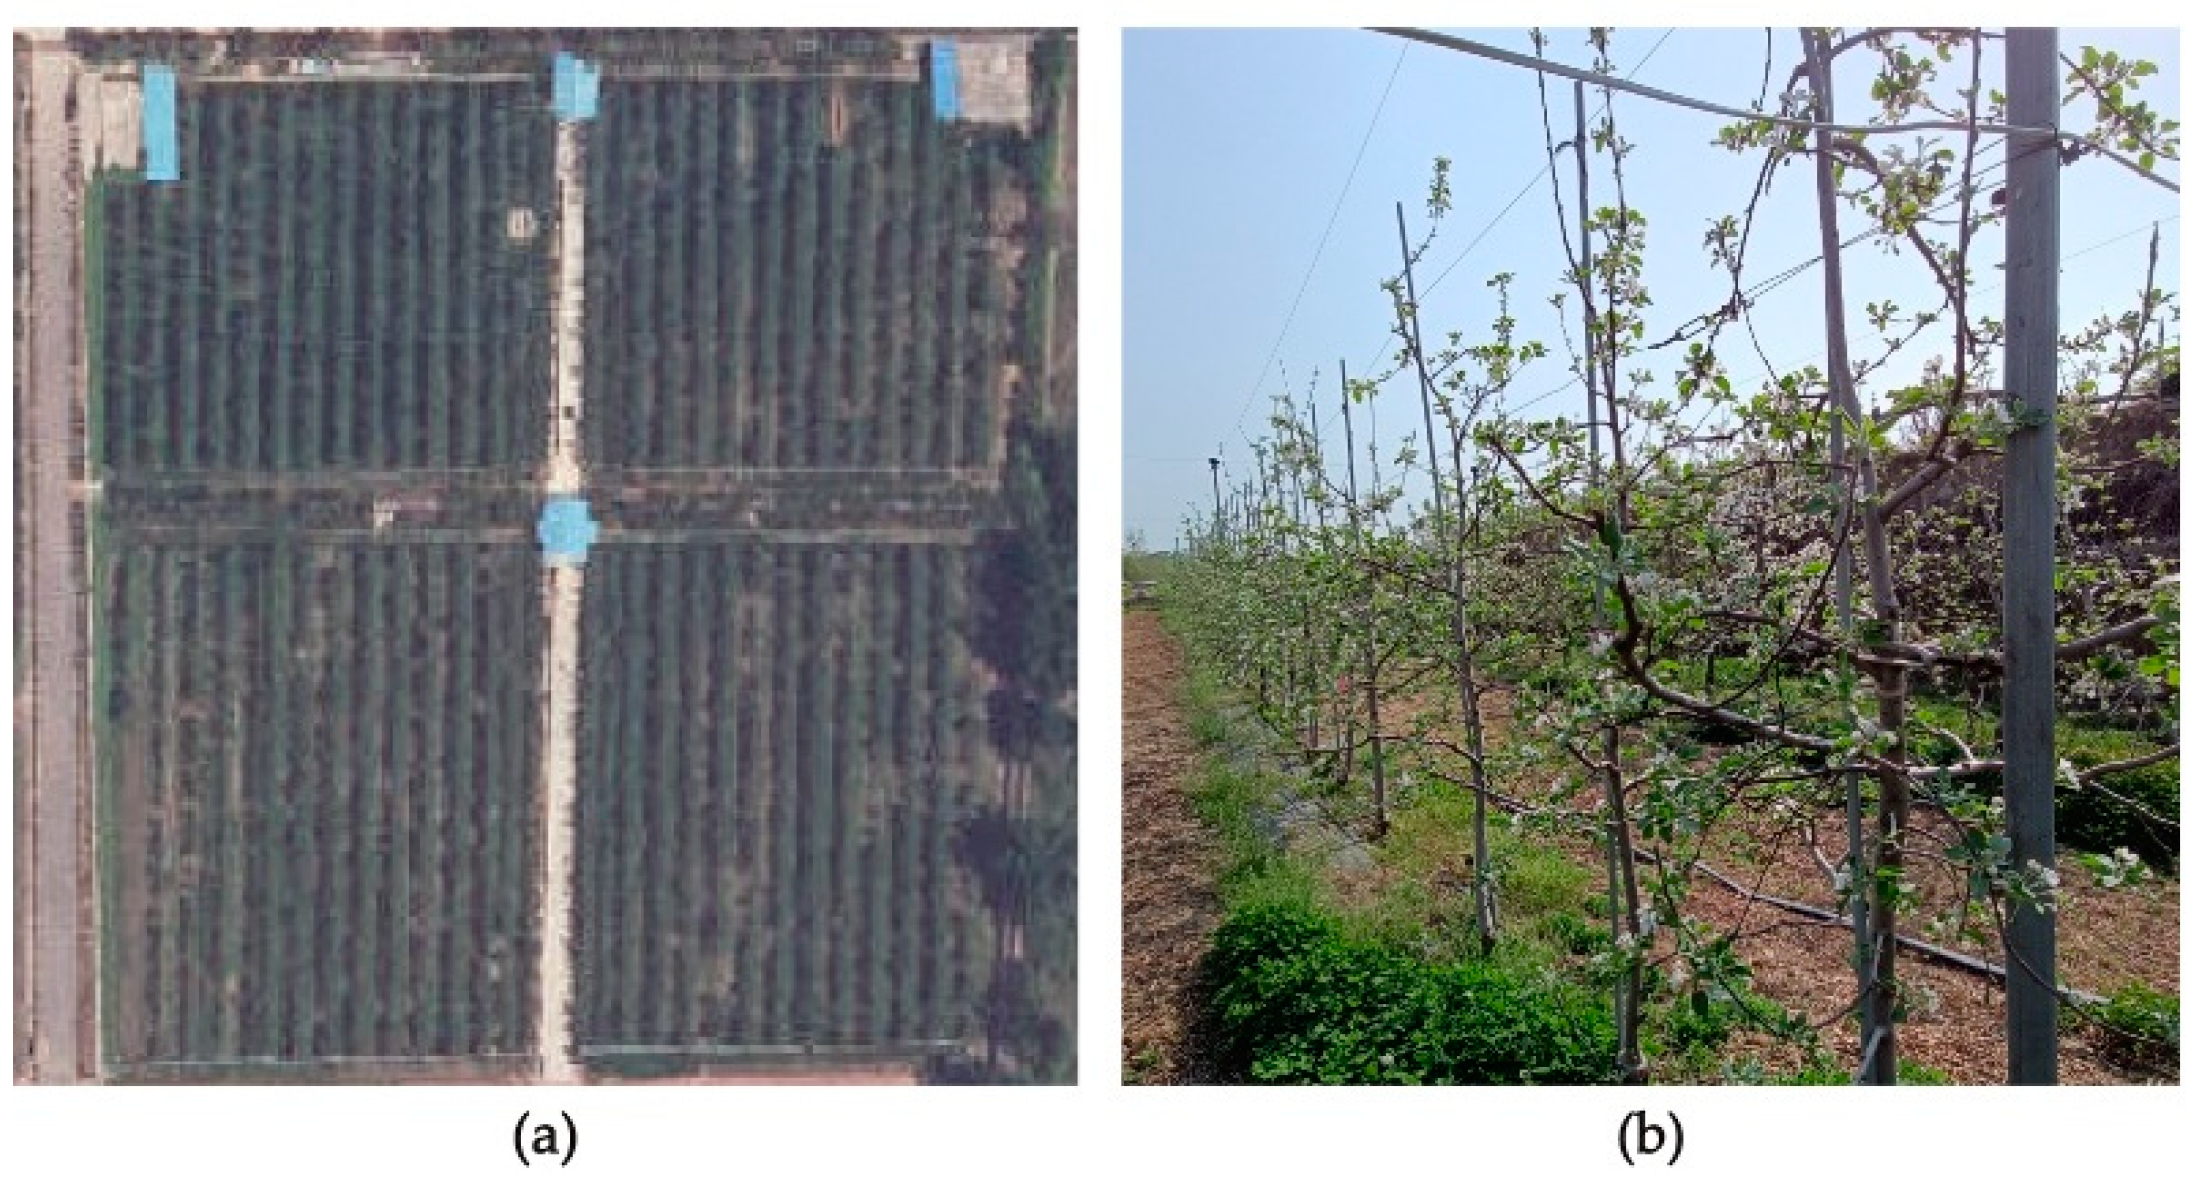
The data were collected at Tianping Lake Experimental Demonstration Base of Shandong Fruit Tree Research Institute (117°2′ E, 36°13′ N), as shown in Figure 2a. The varieties of fruit trees in the orchard are Gala, Fuji, and Wanglin, which are planted in a modern dwarf stock dense planting pattern with a row spacing of approximately 3.5 m and a tree spacing of approximately 1.2 m.
To accurately record and observe the morphological changes of apple flowers throughout their growth cycle, we built an apple flower image acquisition device. The working conditions of this device and the structure of this device are shown in Figure 3. The apple flower image acquisition device mainly includes the track, mobile platform, for data collection, a Dell G3 computer (Intel i5-8300 CPU USA, 12G memory, NVIDIA GeForce GTX 1050Ti GPU USA), and a ZED (Stereolabs) camera. The device was set up in an observation site in an orchard, and by moving the platform, images of 20 adjacent fruit trees in the observation site can be acquired. The computer, ZED camera, and other filming equipment were mounted on a mobile image collection platform, which could be moved along the guide track. The ZED camera is mounted at 1.68m from the ground and 0.8 m from the apple trees at an angle of 0°–30° from the horizontal ground. We recorded video using the ZED Explorer and saved it in SVO format, the camera initialization parameters for video recording were: 720P video mode, 60 frames per second, a monocular resolution of 1280 × 720 pixels, and a depth range of 0.5–20 m. We used the “ZED Depth Viewer” software to capture images with significant differences in the video to ensure that richer data were covered. In this study, we also captured apple flower images outside the observation site using an iPhone7Plus mobile phone, and the shooting working state was consistent with the data acquisition device, and the resulting image resolution was 3024 × 3024 pixels.
In this study, a two-year dataset was collected in 2021–2022, with data collected at the same locations. We collected 1000 images in April 2021, and most of these images were collected at the ‘Full Bloom’ stage as well as the ‘Petal Fall’ stage in the orchard. In April 2022, we collected image data of apple flowers from budding to wilting. Table 1 summarizes the collection time, orchard blooming level, number of images collected, and weather information for the dataset.

2.2.2. Dataset

Of the data collected in 2022, 1800 images were filtered and used for model training and validation, and the dataset is called ‘Apple Flower A’. We use the 2021 data for generalizability tests of the model for apple flower detection in different years, and this dataset is called ‘Apple Flower B’.
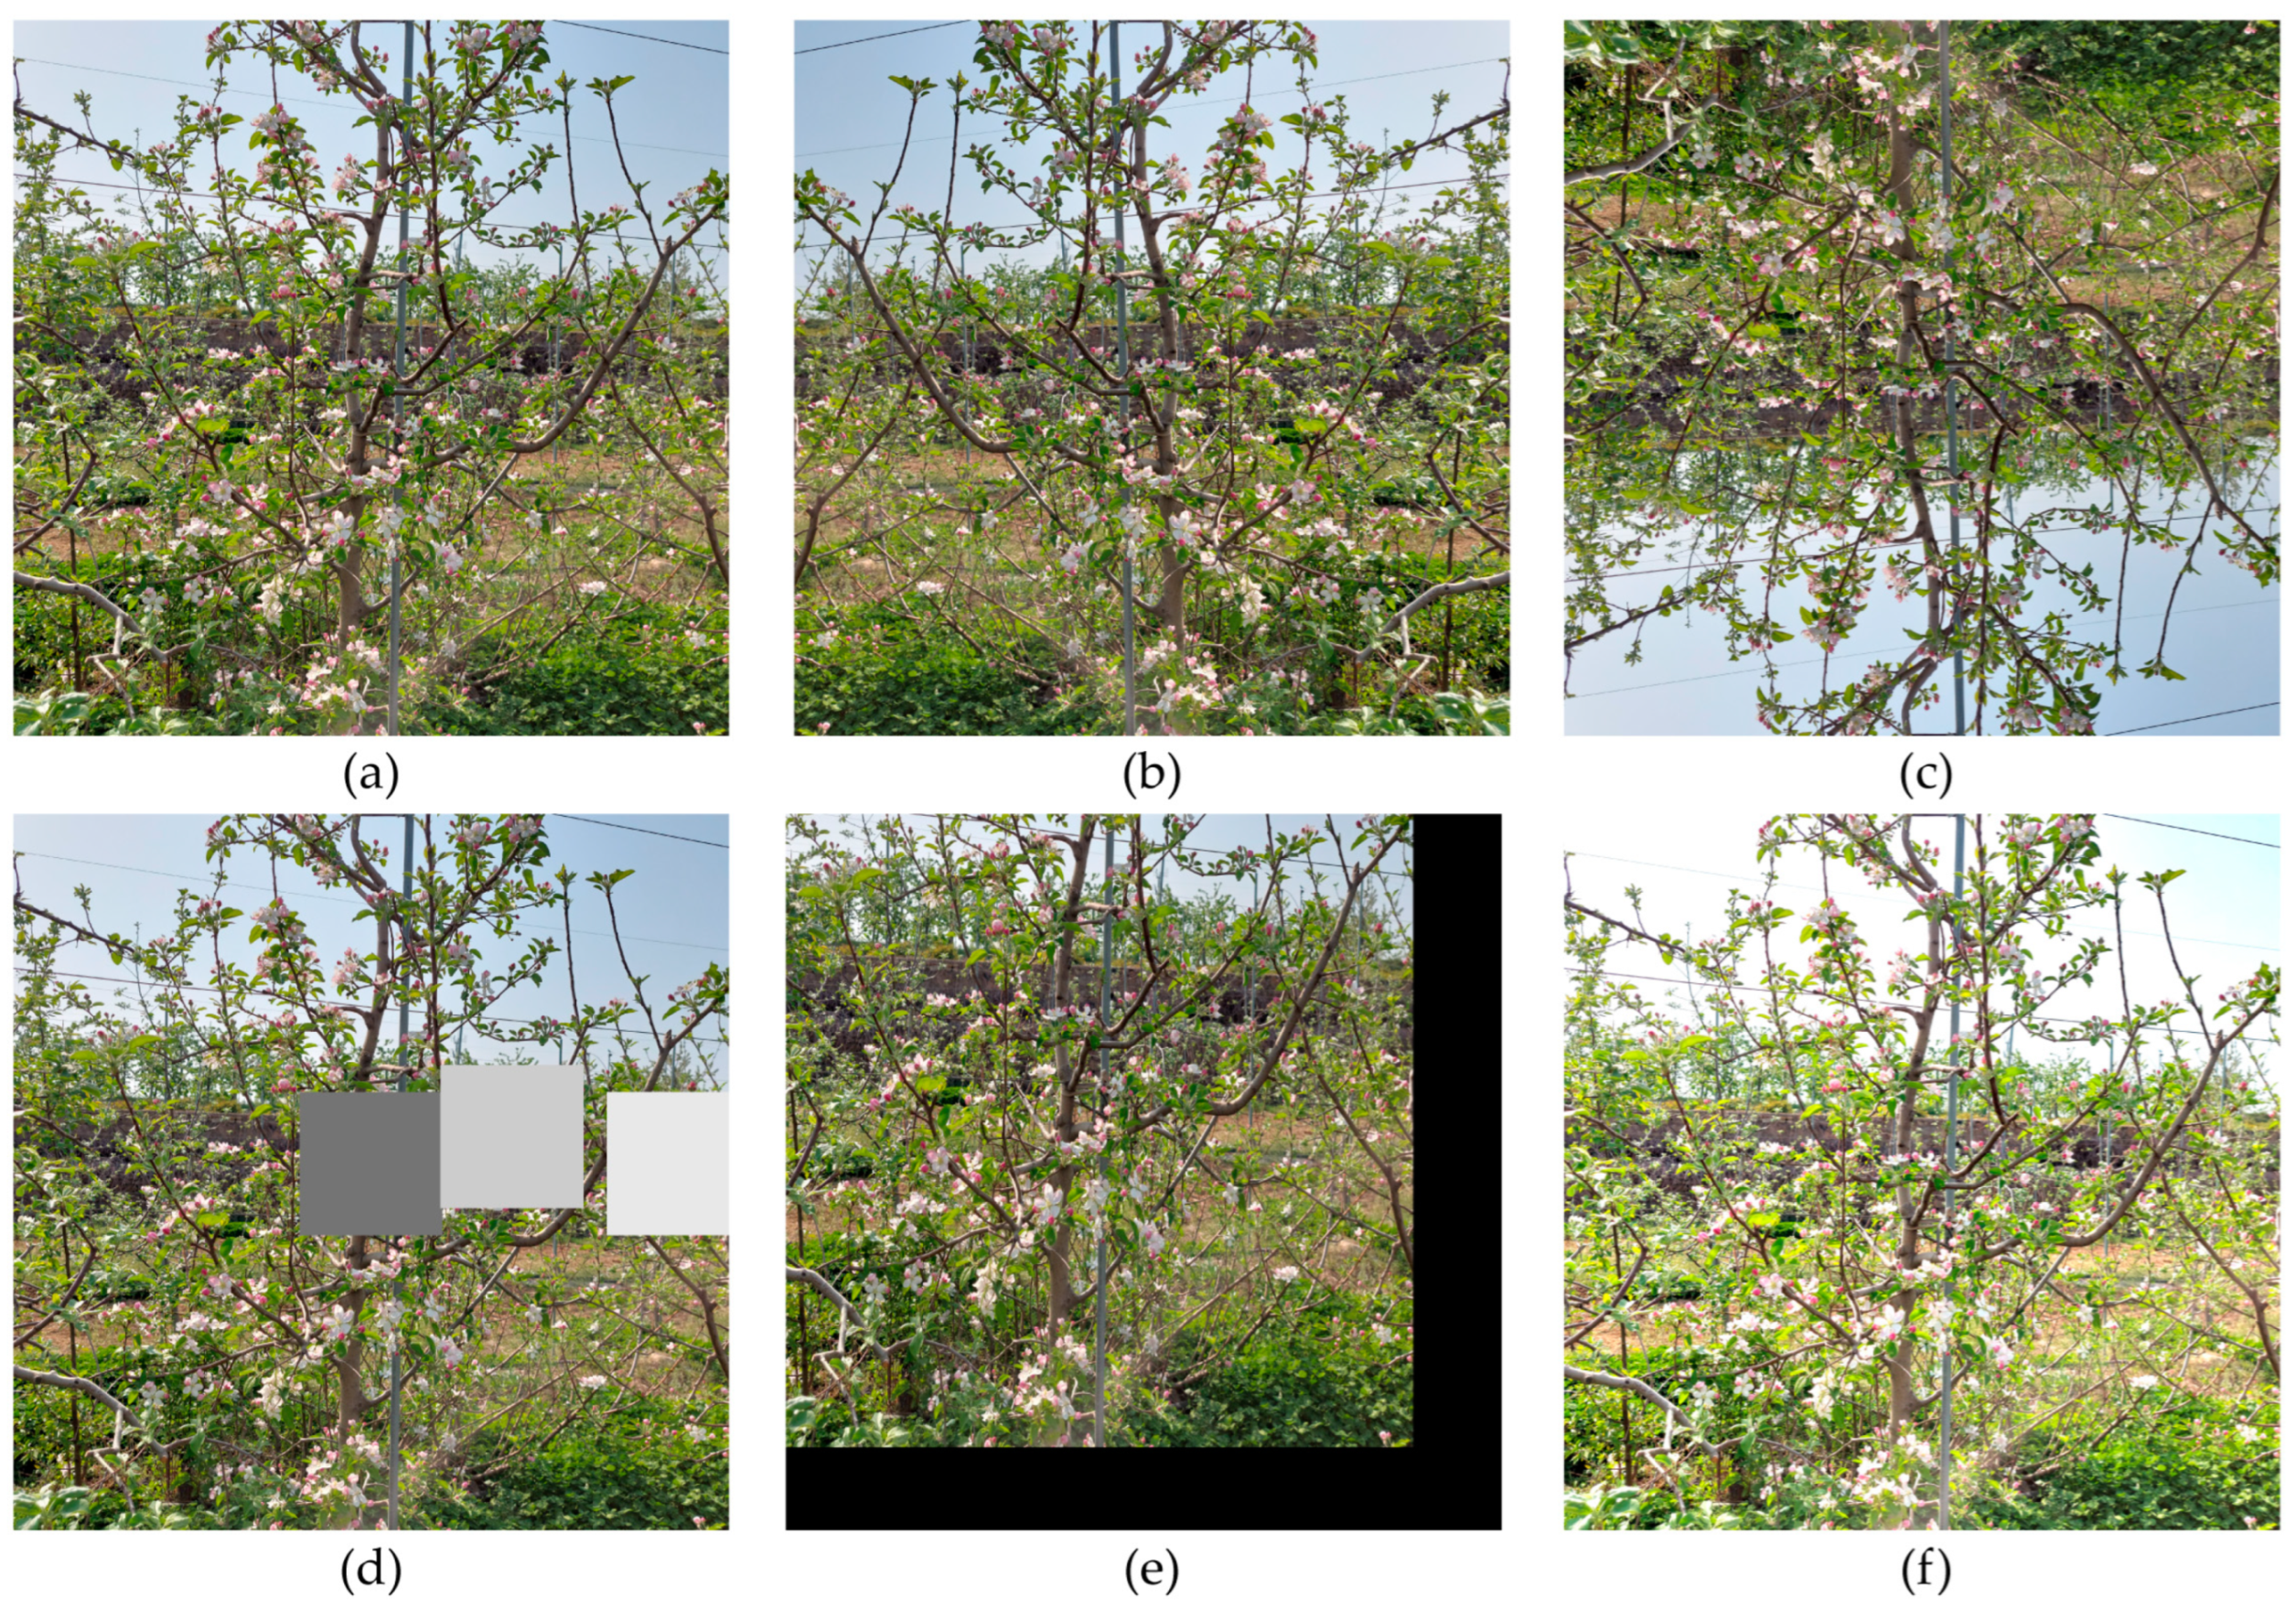
The large amount of image data helps to improve the performance of the apple flower detection model and enhance the feature extraction capability. Data augmentation can effectively expand the sample size of small-scale datasets while improving network generalization and avoiding overfitting. In this paper, the Apple Flower A dataset was divided into a training set and a validation set in a ratio of 8:2. The images in the training set data were adjusted using vertical flip, horizontal flip, random scaling, cutout, and brightness transformation. Finally, the training set image samples were expanded to 4000 images with no overlap between the training and validation sets. The augmented results are shown in Figure 4. The flower clusters were labeled using the LabelImg tool, in which the apple flowers in different growth stages and shading situations were surrounded by a minimum external rectangular box.
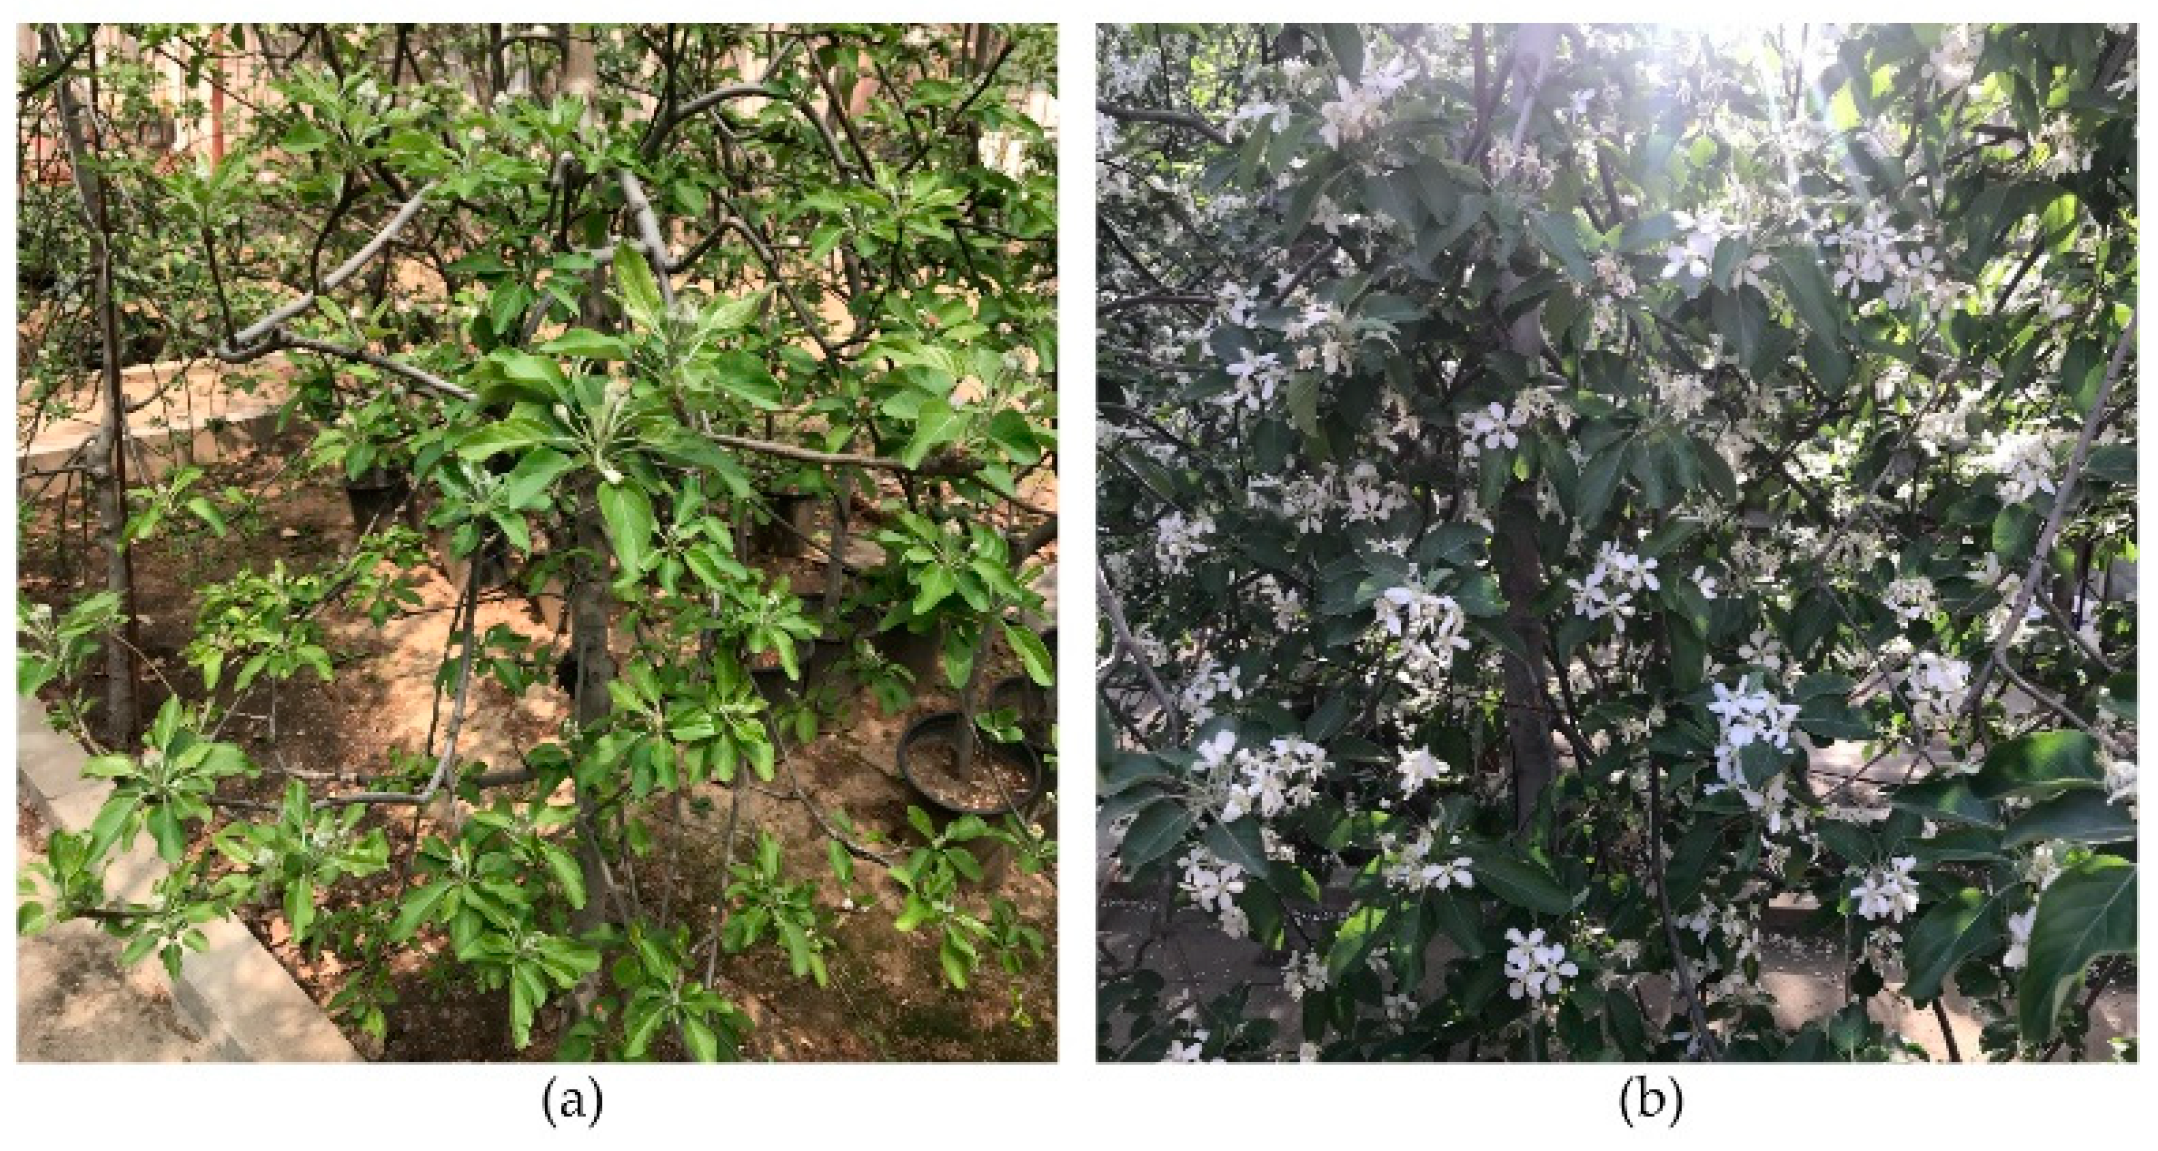
Figure 5 shows the apple flower image data collected in the natural environment. As can be seen in Figure 5, the background of apple flower images is complex, apple flowers in the ‘Spitting Buds’ and ‘Tight Clusters’ stages occupy few pixels in the images and are unclear features (Figure 5a). Flower clusters are heavily obscured by leaves and branches, and the uncertain lighting conditions in the orchard cause uneven image brightness in the dataset (Figure 5b).

2.3. Algorithm Process

Based on the apple tree blooming intensity and peak blooming date estimation systems proposed by [30], the apple flower growth state supervision algorithm in this study is divided into three parts: the apple flower detector, the blooming level estimator, and the peak blooming day finding estimator.
The results of the apple flower detector detection will be used as the input to the blooming level estimator and the peak blooming day finding estimator. For the apple flower detector, we improve the YOLOv5s model and use the improved model as the apple flower detector.
The blooming level estimator calculates the percentage of each blooming level stage to discriminate the apple flower growth status based on the results of the apple flower detector.
Finding the date of peak blooming is important because this date determines the timing of flower thinning and apple yield is affected by it. In current apple flower thinning practice, the peak blooming date is determined as the day when 80% of the trees in the entire orchard reach ‘King Bloom’ and ‘Full Bloom’ stage. The peak blooming date finder will make decisions for orchard thinning timing.

2.4. YOLOv5 Model

The performance of the apple flower detector directly affects the results of the blooming level estimator and orchard peak blooming day finder. Currently, the single-stage object detection algorithm YOLO [33,34,35,36] has been widely used in fruit and vegetable detection [37] and weed detection [38], which can balance speed and detection accuracy compared to the two-stage object detection algorithm. Therefore, in this study, the YOLOv5s model [39] was selected as the apple flower detection model in the v6.0 release of the YOLOv5 model.
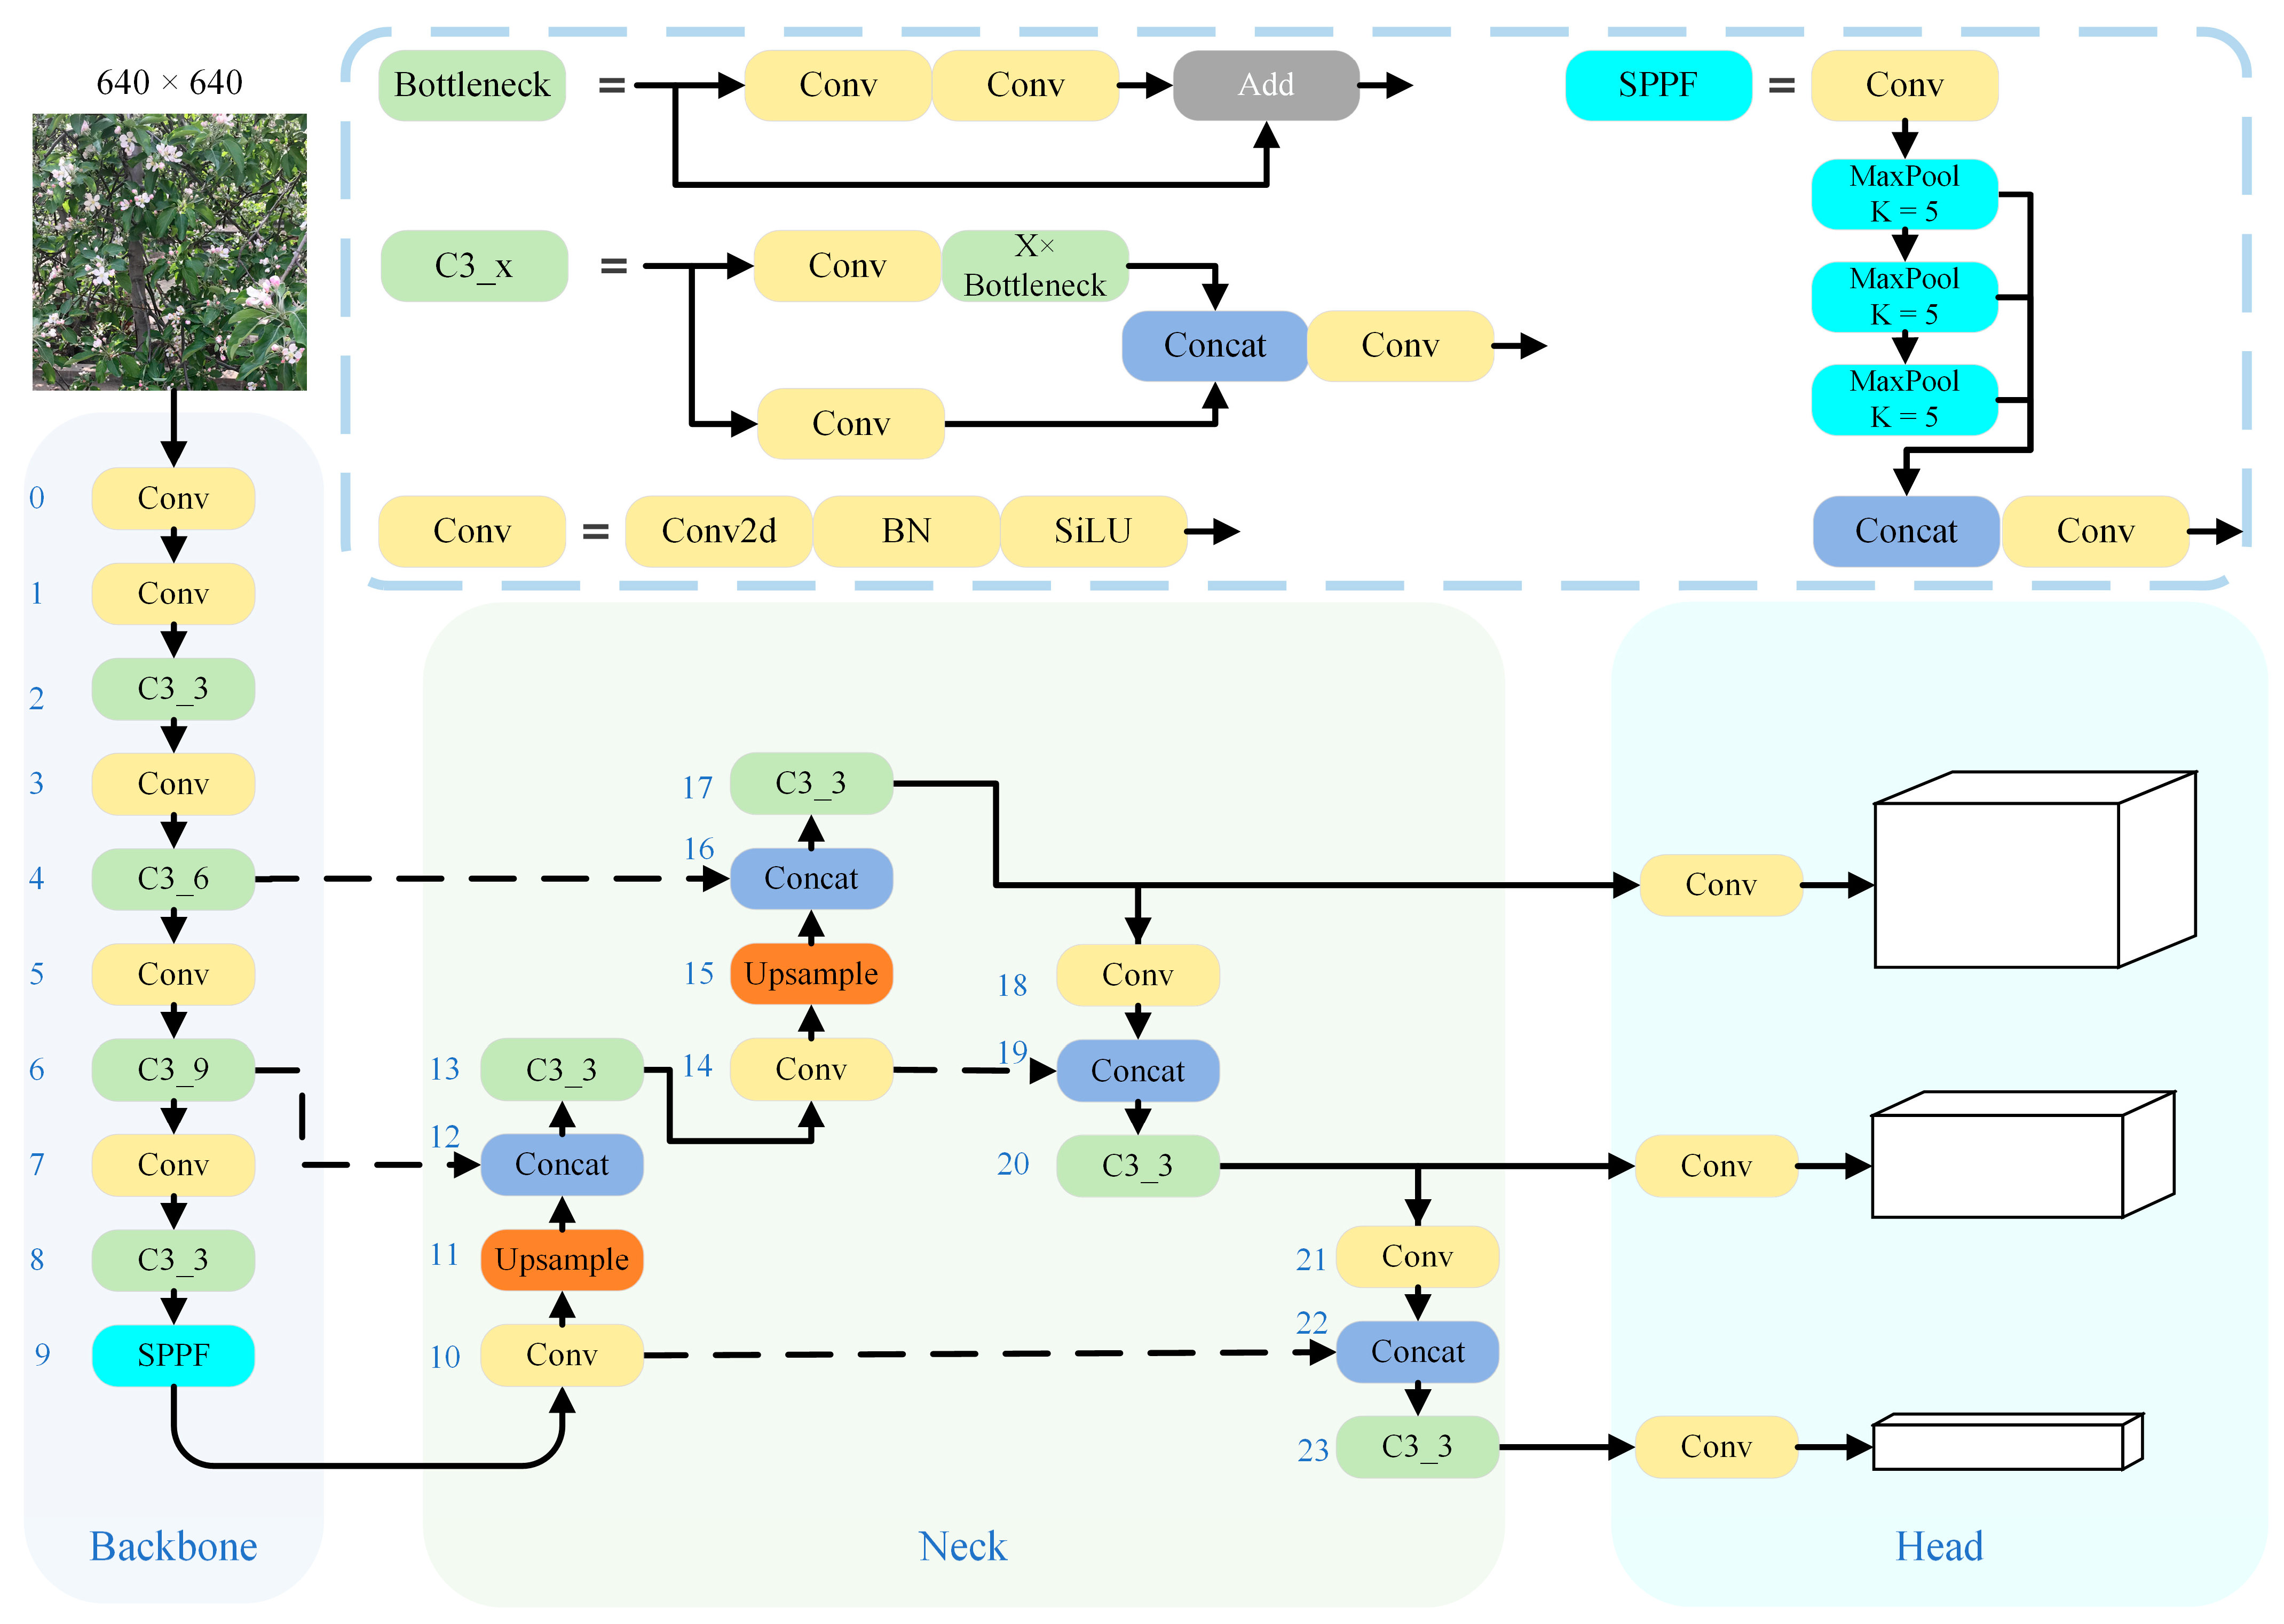
The structure of the YOLOv5s model is shown in Figure 6, which is mainly composed of the backbone, neck, and head. The backbone part uses CSPdarknet53 as the feature extraction network, the neck part uses the FPN+PAN structure, which achieves the fusion of backbone network features by up-sampling and down-sampling operations, YOLO head implements the decoding of the input features and the prediction of the object.

2.5. Apple Flower Detection Model

Although YOLOv5 already has excellent object detection capability, it is still challenging to detect apple flowers in the unstructured environment of orchards and under complex background and lighting conditions. Improving the detection performance of the apple flower detector for each growth stage can provide a reliable basis for the blooming level estimator and the peak blooming day finding estimator. Therefore, based on the characteristics of the data set in this paper, we improved the YOLOv5s model.

2.5.1. Coordinate Attention Layer

In the early stage of apple flower growth, the smaller buds morphologically resemble the ends of branches of fruit trees, and the green buds are surrounded by green leaves, which makes it difficult to distinguish the buds from the background. The attention mechanism can make the model attend more to the object of interest in the image during the training process and improve the efficiency of feature extraction. Consequently, we expect to improve the network’s ability to mine budding features through the attention mechanism.
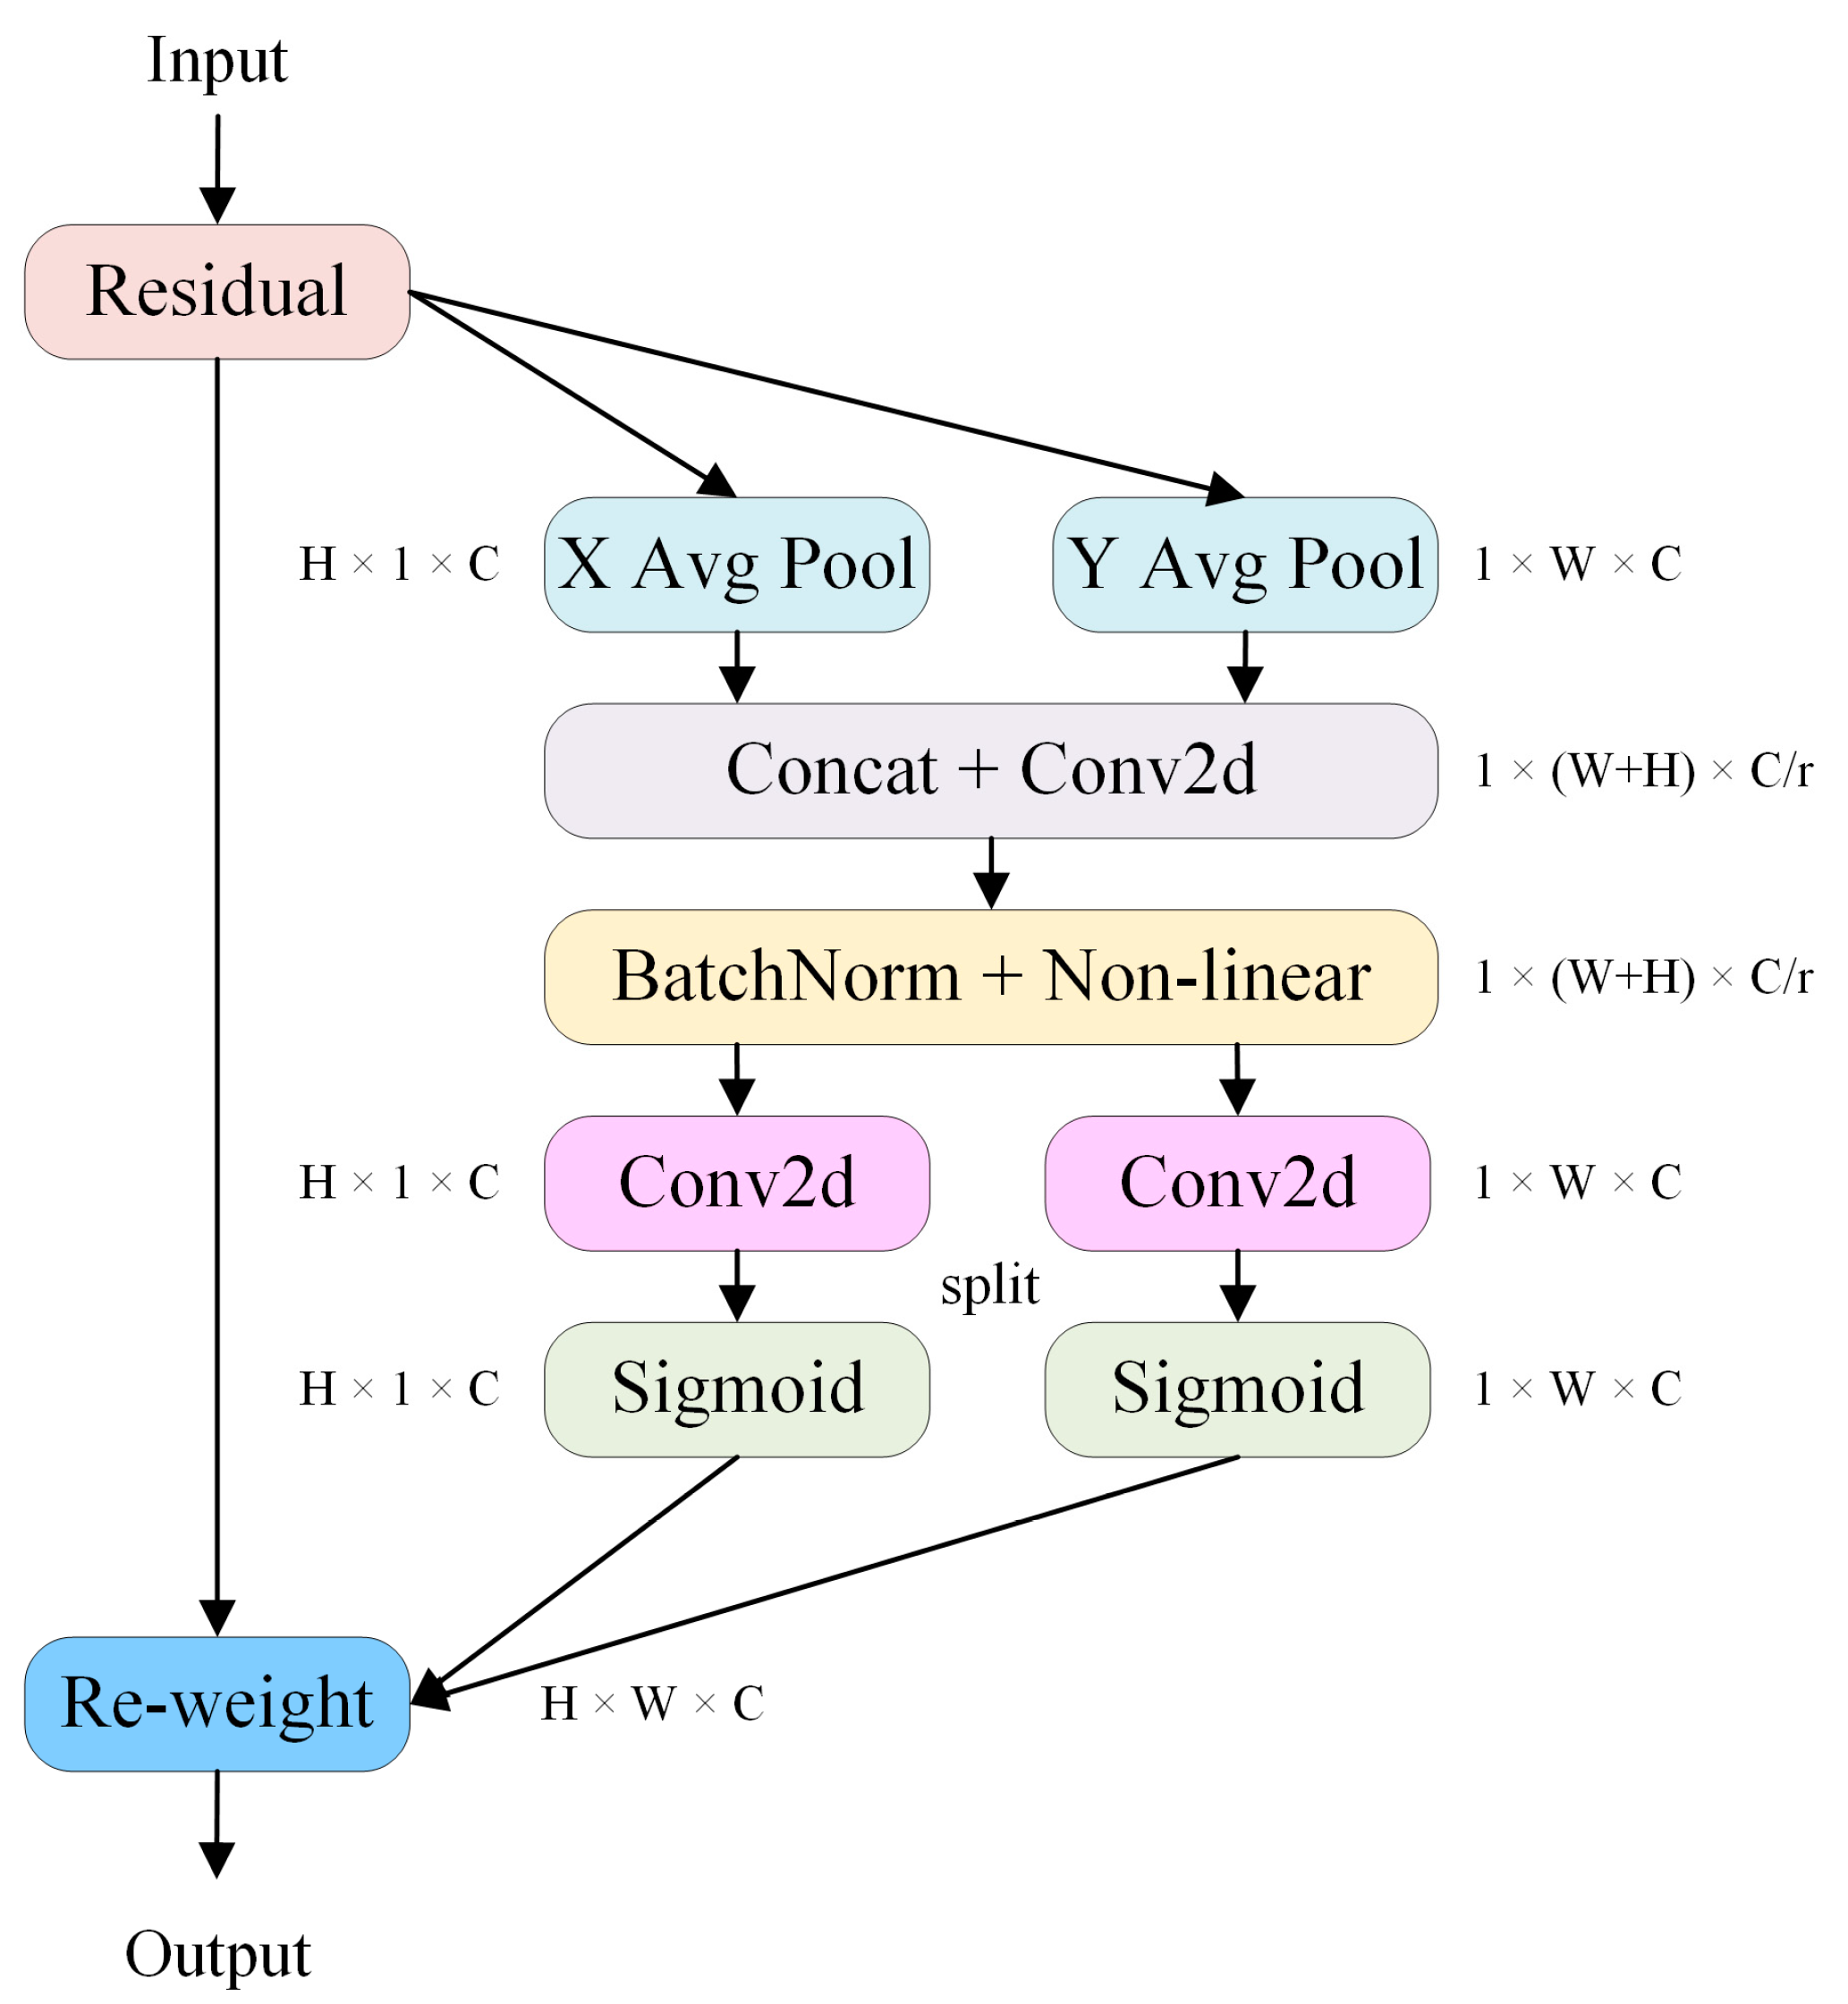
The coordinated attention (CA) mechanism [40] adds location information to the channel attention to allow the network to perform attention operations over a larger area, and to facilitate the attention module to capture spatial long-range dependencies with precise location information, this attention mechanism decomposes the global pooling into a pair of one-dimensional feature encoding operations to form direction-aware and position-sensitive attention feature maps to be complementarily applied to input features, the structure of which is shown in Figure 7.
The CA attention module is a flexible plug-and-play module that can improve network accuracy with a small overhead. The high-level features of the backbone network are rich in semantic information. To make the attention mechanism analyze the effective semantic information in the network, the CA attention module is inserted into the end of the backbone network in this paper.

2.5.2. Small Object Detection Head

Three scale feature layers exist in the YOLOv5s model. For the input image of size 640 × 640, feature maps of sizes 80 × 80, 40 × 40, and 20 × 20 are generated after 8×, 16× and 32× subsampled, respectively, and these feature maps are sent to the head section after feature fusion at the neck. The information of small object flowers in the image exists in the shallow features of the network. Obviously, too large a subsampled rate will destroy the flower features at the ‘Spitting Buds’ and ‘Tight Clusters’ stages, causing the model to detect less effectively.
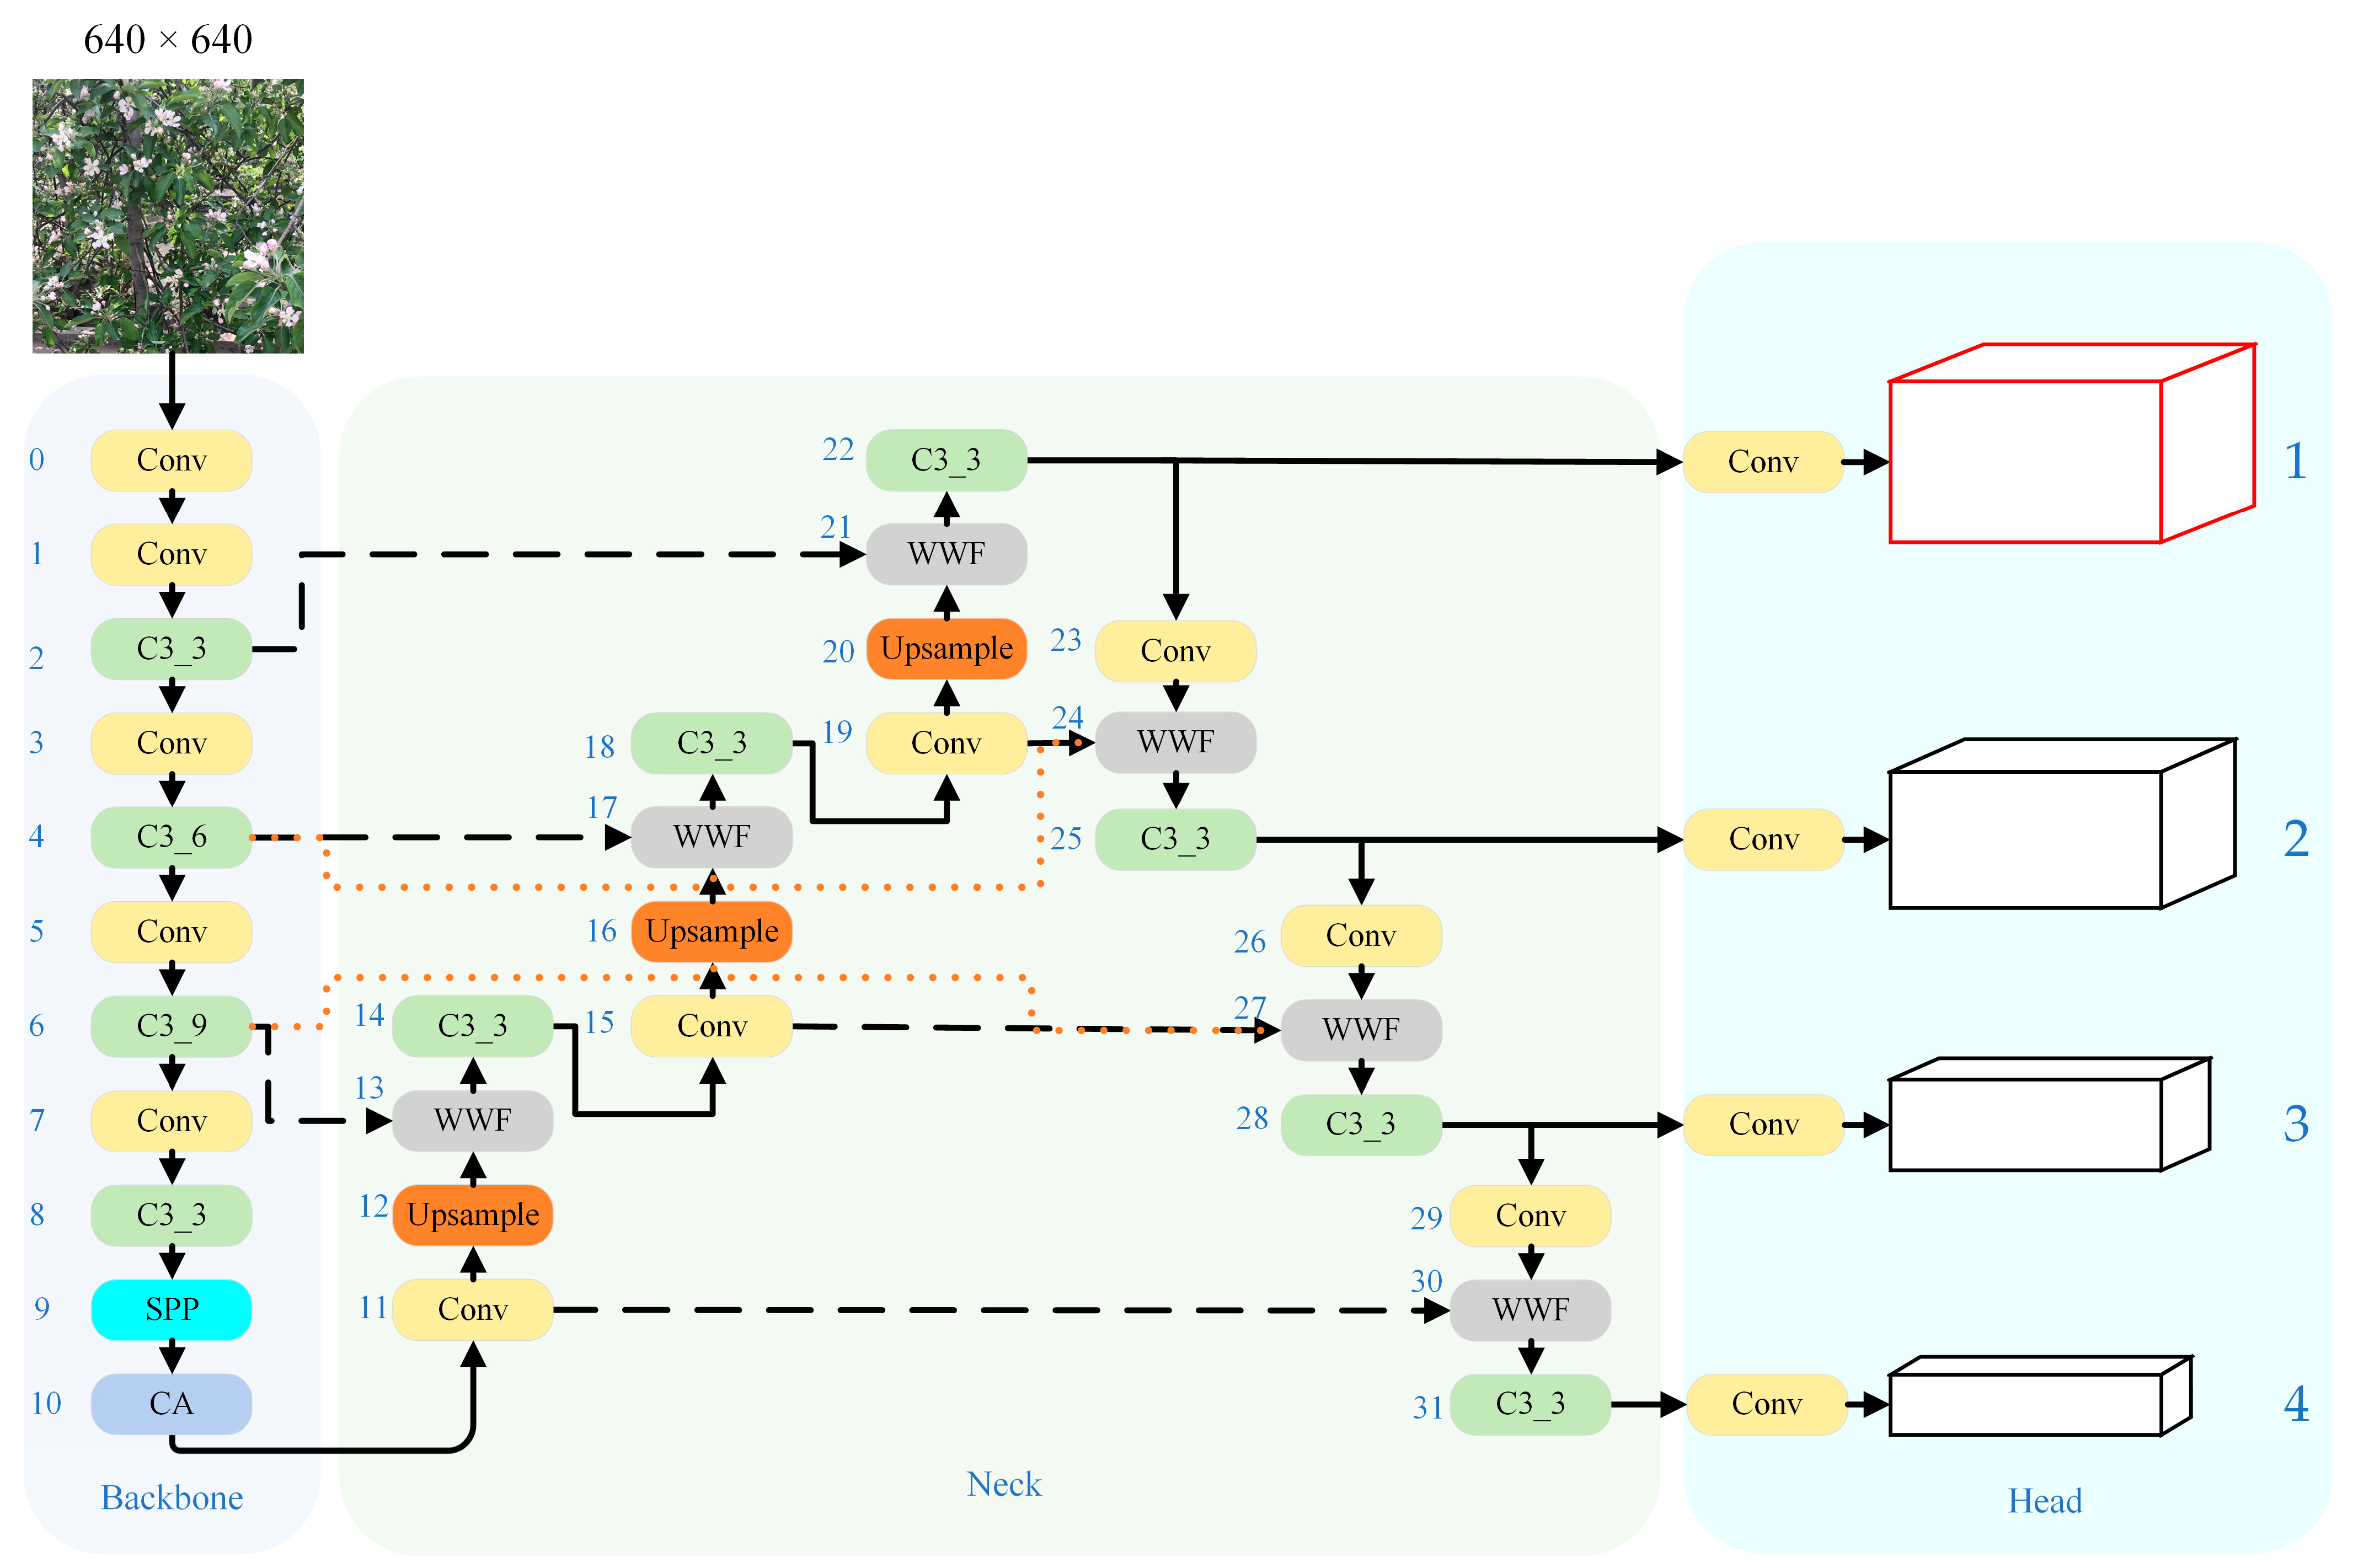
A larger feature map can reduce the receptive field of the feature map in the input image, reduce the distortion of shallow feature information in the network, and improve the small object detection performance. In this paper, a small object detection head is added to the YOLOv5s network, this four-head structure can ease the negative influence caused by the violent object scale variance [41]. The Conv module is linked in layer 18 of the network to integrate the semantic information brought by the deep structure and continues to upsample and expand the feature map. At layer 21, the up-sampled feature map of 160 × 160 size is fused with the layer 2 feature map in the backbone network in a Concat fusion operation to obtain more shallow feature information.

2.5.3. Improved Feature Fusion Structure

The feature fusion structure of the YOLOv5s neck is a PAN+FPN structure [36,42], which enables the fusion of feature information with stronger semantic relationships in the deeper layers of the network with the rich location information in the shallow layers. When detecting apple flowers that are in a complex background, we hope to fuse the valid information from the backbone part of the network at the neck of the network to reduce the interference of background information. However, the PAN+FPN structure does not emphasize the apple flower targets of interest in the image during the feature fusion process after upsampling and subsampling. The bidirectional feature pyramid network (BiFPN) structure [43] can compensate for the shortcomings of the above feature fusion structures, and this paper combines the BiFPN structure to optimize the neck of the YOLOv5s network.
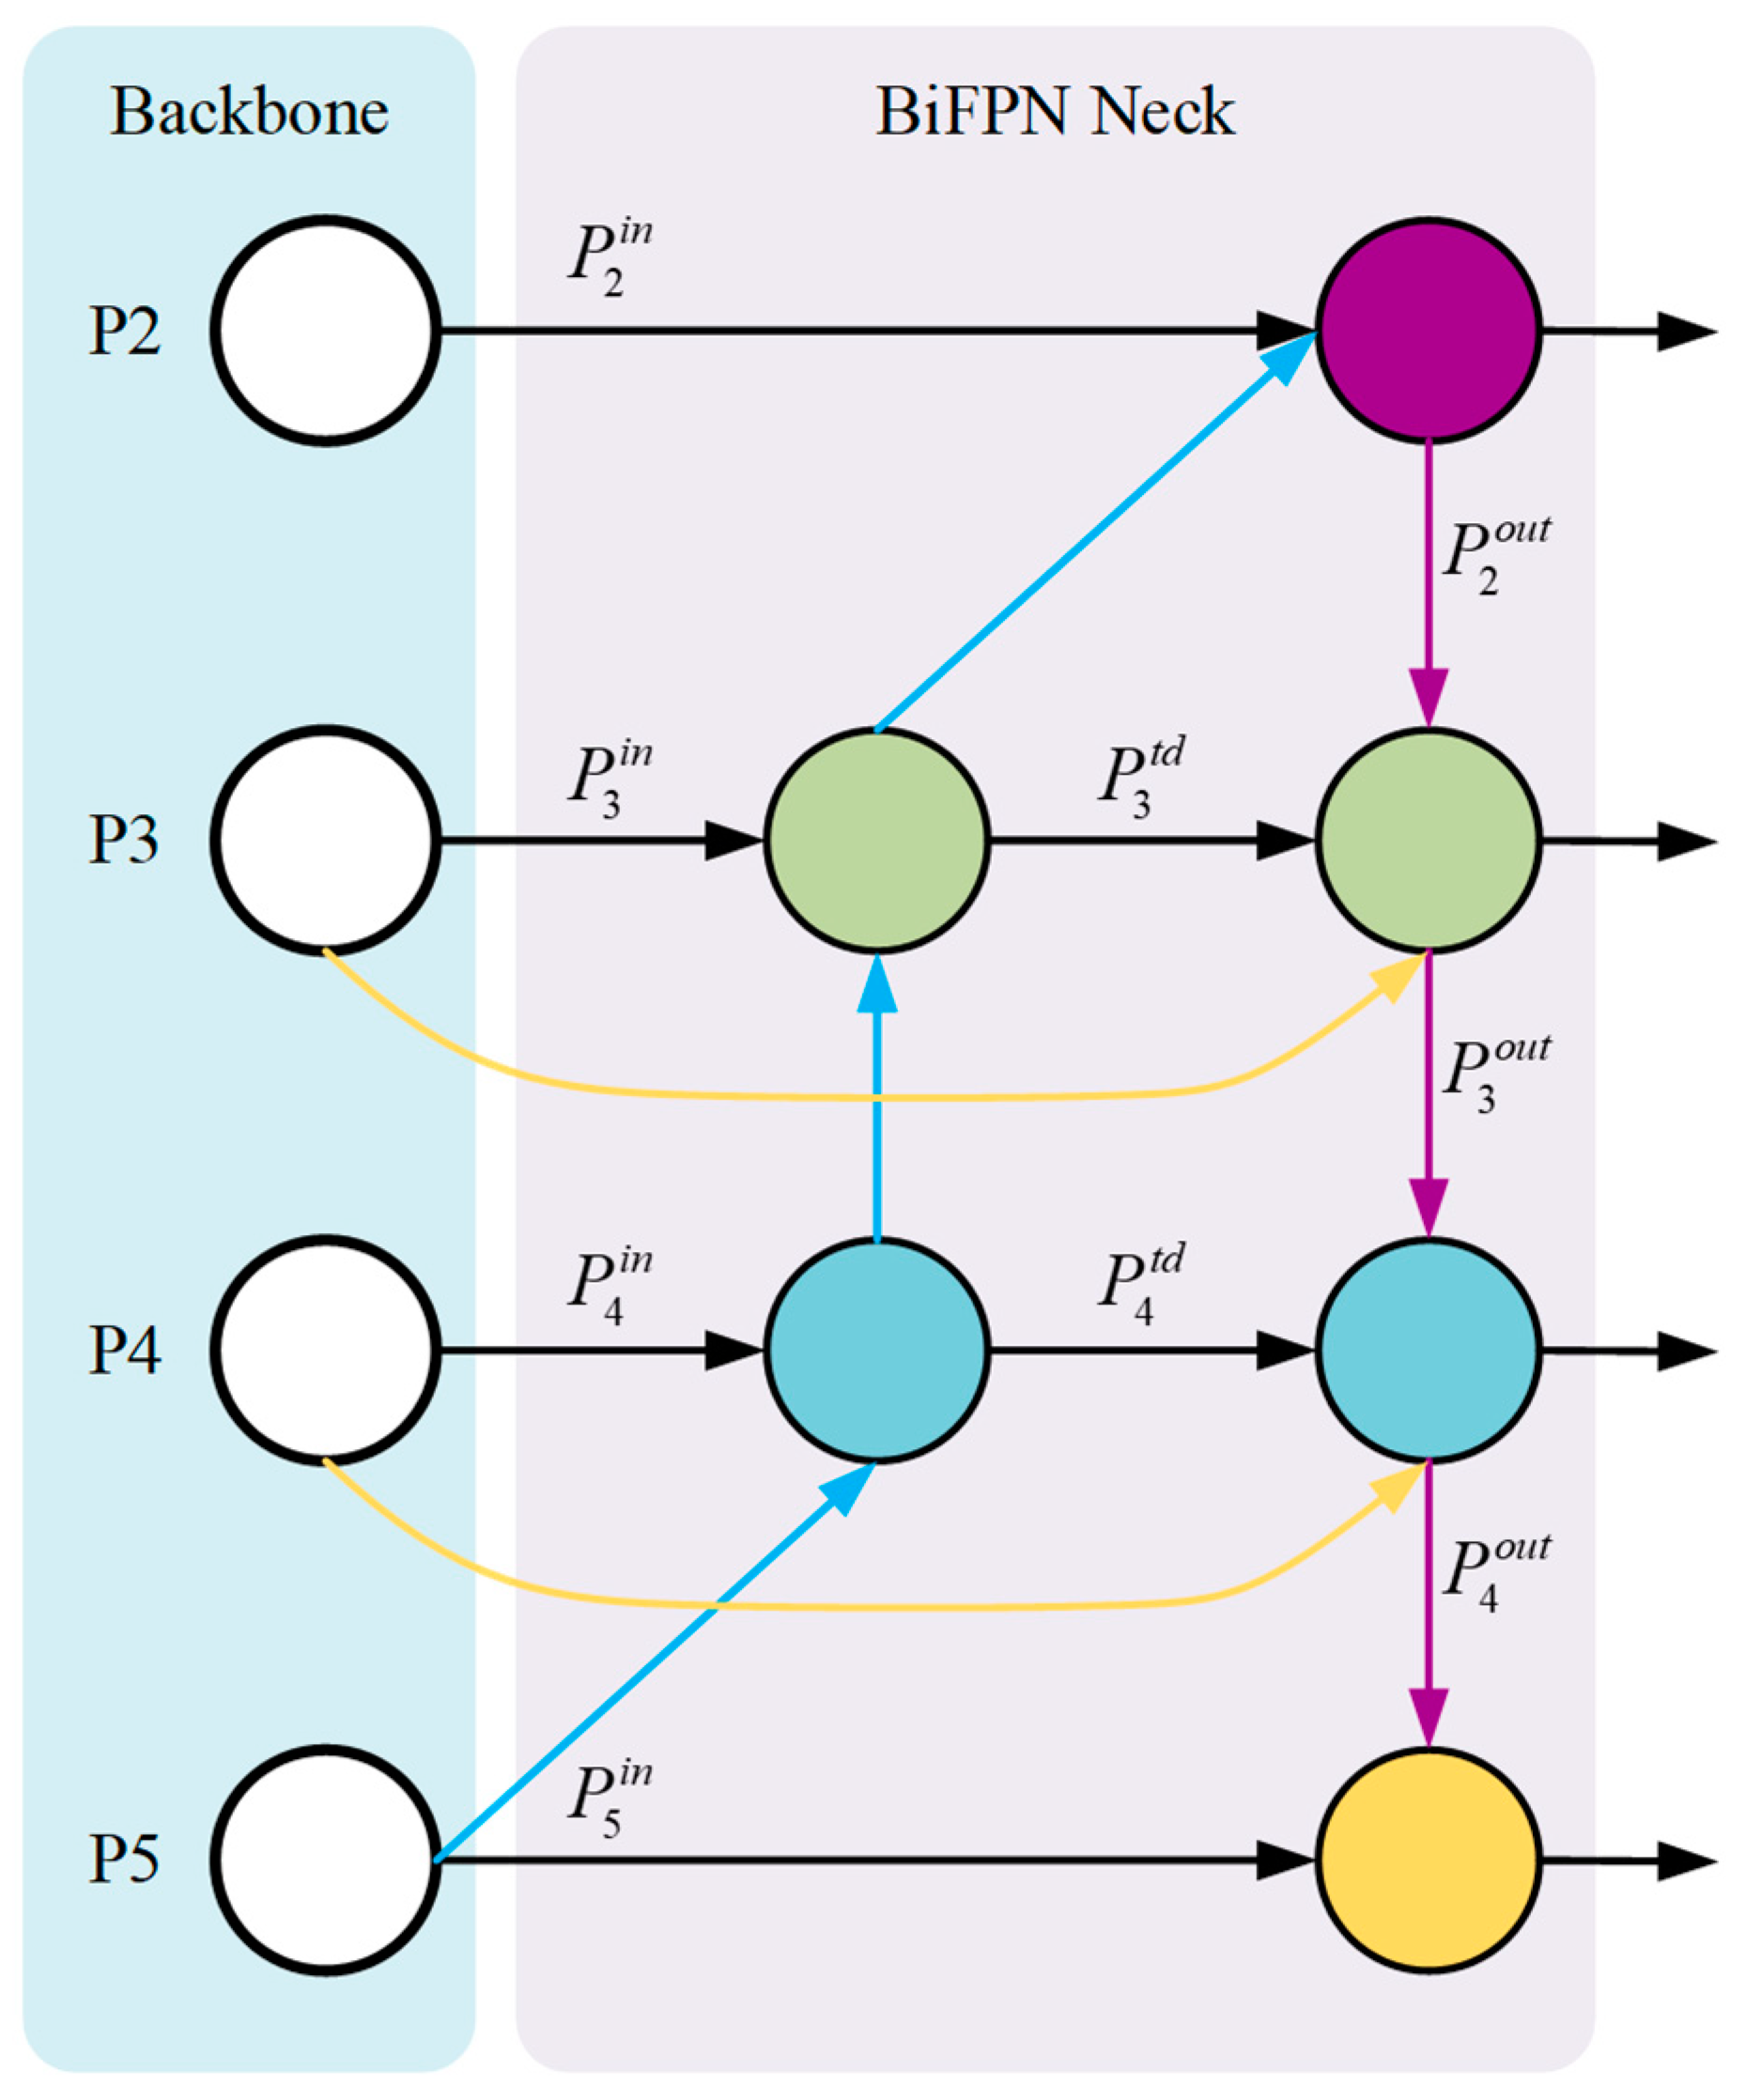
The BiFPN structure is shown in Figure 8. Compared with PAN+FPN, this structure removes nodes with only one input edge and adds an extra channel between the original input and output nodes at the same layer for more feature fusion. The traditional Concat fusion operation cannot pinpoint the features of interest and increases the number of parameters of the network. BiFPN introduces a simple and efficient weighted feature fusion mechanism, which introduces trainable weights to adjust the degree of contribution of different feature maps. BiFPN uses a fast normalization fusion strategy to normalize the weights to a value ranging from 0 to 1, improving the training efficiency. The weighted fusion method is shown in Equation (1).
O = i w i ε + j w j I i
where I i is the input feature map, w i and w j are the learnable weights of the input feature map, which are guaranteed to be greater than 0 by the ReLU activation function in each training, and ε = 0.0001 is added to the denominator to prevent numerical instability.
As shown in Figure 8 and Figure 9, after the addition of the small object detection layer of YOLOv5s, the feature fusion network takes the four different-scale feature maps output from layers 2, 4, 6, and 9 of the backbone network as the input to the BiFPN structure, respectively. With the improved neck, a path is added to layers P3 and P4 with cross-scale connections and weighted feature fusion at the feature fusion nodes. Equations (2) and (3) describe the two feature fusion processes in the P4 layer.
P 4 t d = C o n v ( w 1 P 4 i n + w 2 R e s i z e ( P 5 i n ) w 1 + w 2 + ε )
P 4 o u t = C o n v ( w 1 P 4 i n + w 2 P 4 t d + w 3 R e s i z e ( P 3 o u t ) w 1 + w 2 + w 3 + ε )
where C o n v is the convolution operation; R e s i z e is used for upsampling or subsampled operations for resolution matching.

3. Results

3.1. Model Training

The hardware platform for this paper is configured as follows: NVIDIA GeForce RTX 3070 GPU with 8 GB of video memory and 24 GB of memory. All models are run on the Ubuntu 20.04 operating system, PyTorch is the deep learning framework, Python is the programming language, and CUDA is used to accelerate the GPU.
The 2022 apple flower dataset was used for the training of the apple flower detector. Table 2 shows the detailed hyperparameter configuration during the model training. The input image is adjusted to 640 × 640 pixels and the batch size is set to 4. Experiments show that the loss of the model converges and smooths out after 160,000 iterations. The momentum, initial learning rate, and weight decay rate have been experimentally optimized.

3.2. Performance Evaluation of Flower Detectors

Detection of apple flowers in the natural environment requires consideration of the performance of the detection network for selecting the optimal detection model. The mean average precision (mAP) and average precision (AP) are used for model evaluation in this paper. mAP and AP are related to precision (P) and recall (R), and their relationships are shown in Equations (4)–(7).
P = T P T P + F P × 100 %
R = T P T P + F N × 100 %
A P = 0 1 P ( R ) d R × 100 %
m A P = 1 M k = 1 M A P ( k ) × 100 %
where T P , F P , and F N indicate the number of true positives, false positives, and false negatives in the model detection results; M is the total number of categories. Since the blooming level was divided into six stages, M = 6 in this study.

3.3. Apple Flower Detection in Natural Environment

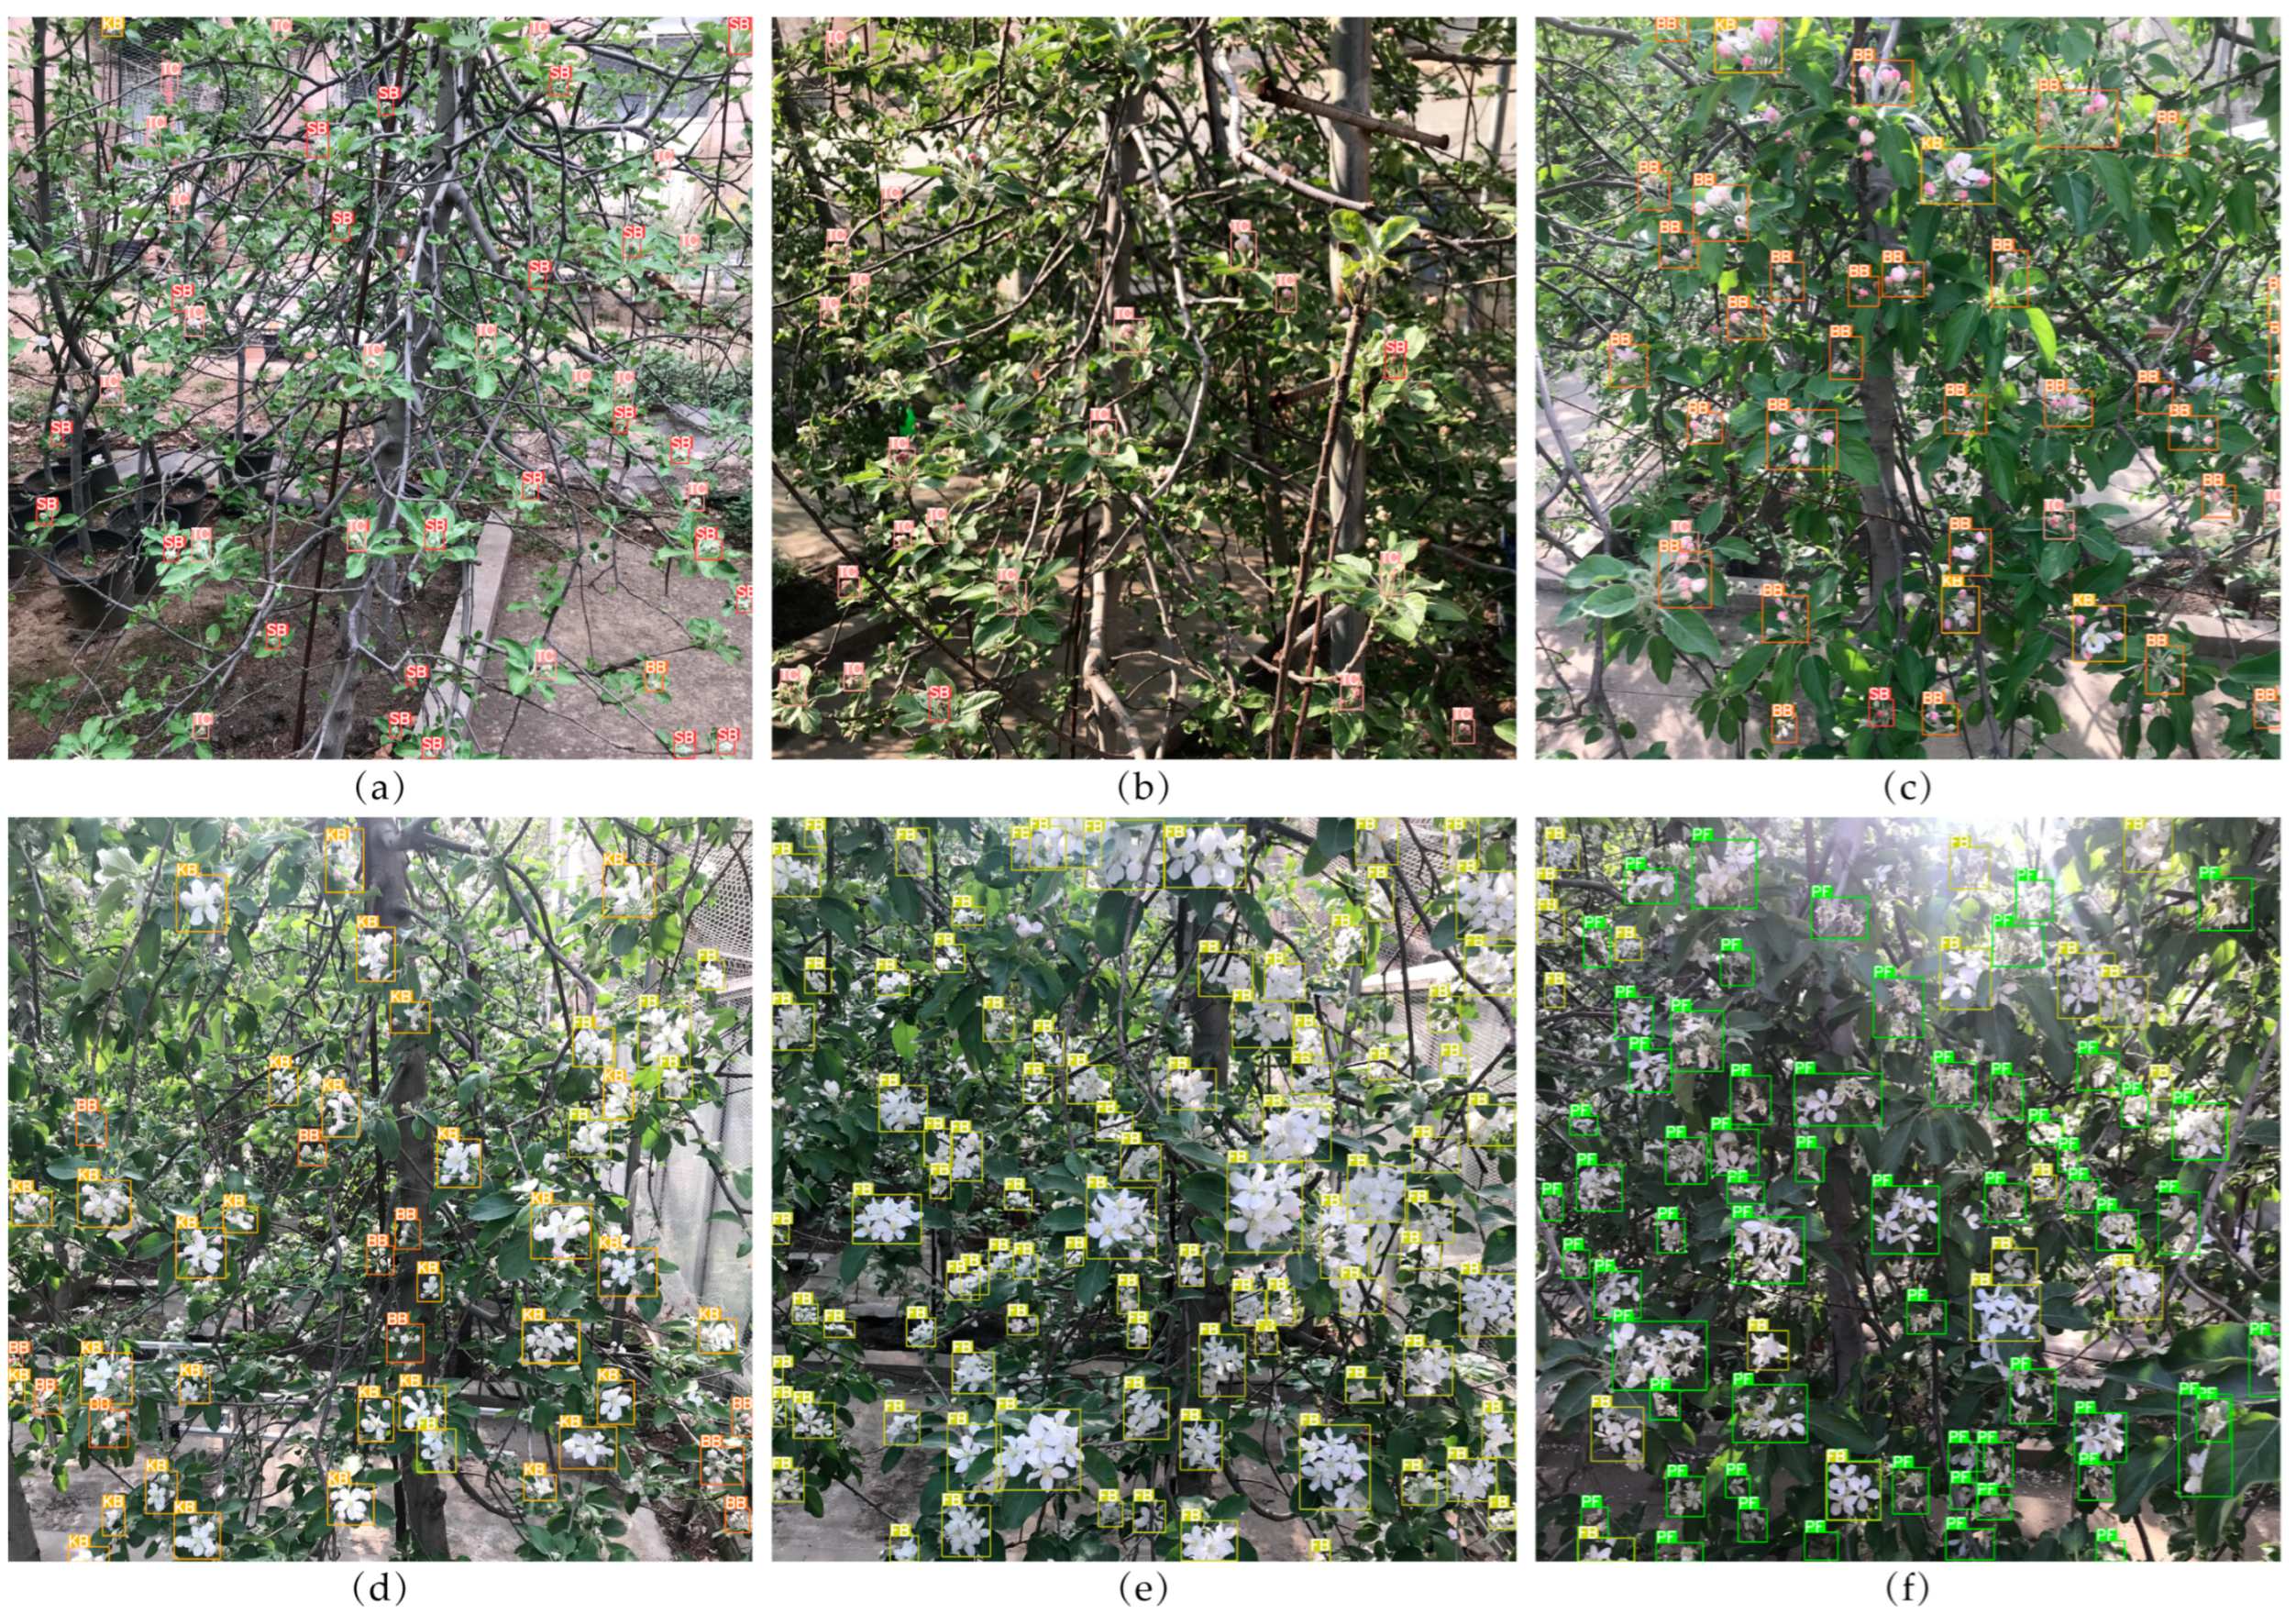
The light conditions of orchards in the natural environment are complex, and in the actual operation, the light conditions of orchards are influenced by the time of day, area, and weather, and uneven light can affect the apple flower detection model. Therefore, this study tested the performance of the optimized model on a dataset of apple flowers at various growth stages in different lighting environments. Figure 10 shows the detection results for six orchards with different blooming levels in a more illuminated environment. As can be seen from Figure 10, the model in this paper performs well in determining apple flowers at the ‘Full Bloom’ and ‘Petal Fall’ stages, and flowers disturbed by strong light are still successfully detected by the model even in images with strong light and drastic changes in light intensity. The flowers at the ‘Spitting Buds’ and ‘Tight Clusters’ stages are smaller and also have missed detection when they are obscured by branches and leaves, but most of them are still detected by the model.
At nightfall, the low light intensity in the orchard increased the difficulty of feature extraction. As can be seen in Figure 11, for apple flowers in the post-bud stage, the weaker light intensity had little effect on the detection results of the model, and the model still maintained high detection accuracy. However, detecting apple flowers at the ‘Spitting Buds’ and ‘Tight Clusters’ stages is challenging for the model. In Figure 11a,b, the number of missed detections by the model for apple flowers at the ‘Spitting Buds’ and ‘Tight Clusters’ stages increased with decreasing light intensity, and even false identifications occurred.
However, in general, the model proposed in this paper can provide accurate detection of apple flowers at all blooming levels with high robustness under different light, flower density, and occlusion conditions. The optimized model as an apple flower detector can meet the requirements of block-level or global blooming level estimation and peak blooming date finder for orchards.

3.4. Inter-Annual Knowledge Transfer

Different natural environmental conditions in different years can cause changes in the growth state of apple flowers, resulting in shifts in the distribution of image information in different years compared to the image data collected in 2022 in this study. Therefore, the ability to use a model trained in a specific year and to perform inference on the apple flower dataset from different years is important for the generalization of the model, which avoids retraining the model each year. This interannual knowledge transfer capability of the model is demonstrated by the generalizability of the model across years. In this paper, the apple flower detector trained on 2022 data was used to validate its effectiveness, using AP and mAP metrics to measure the model’s ability to generalize to different years of data.
We selected 200 images from each of the apple flower datasets in 2021 and 2022, respectively, for evaluation, and Table 3 shows the ability of the apple flower detector to generalize across years between 2021 and 2022. It is noteworthy that most of the images in the Apple Flower B dataset were collected after the ‘King Bloom’ stage. As can be seen from Table 3, the mAP values of the model in this paper are 86.4% and 86.6% in the detection results of 2021 and 2022, respectively, and the difference between the two is small. In 2021, the model obtained AP values of 87.2% and 85.6% in the ‘Full Bloom’ and ‘Petal Fall’ stages, respectively, which were almost the same as the test results of 87.5% and 85.8% in 2022. The test results showed that the apple flower detector was insensitive to apple flower data from different years and the model had good inter-annual knowledge transfer capability. However, the ability of the model to detect apple flowers at other blooming levels across years is unclear since apple flower data before the ‘FB’ stage are lacking in the 2021 dataset. Therefore, richer inter-annual data are needed to evaluate the performance of the model.

3.5. Blooming Level Estimation

In the practice of blooming level estimation, it is often more practical to estimate the global or block-level blooming level of an orchard than to detect flowering in individual fruit trees.
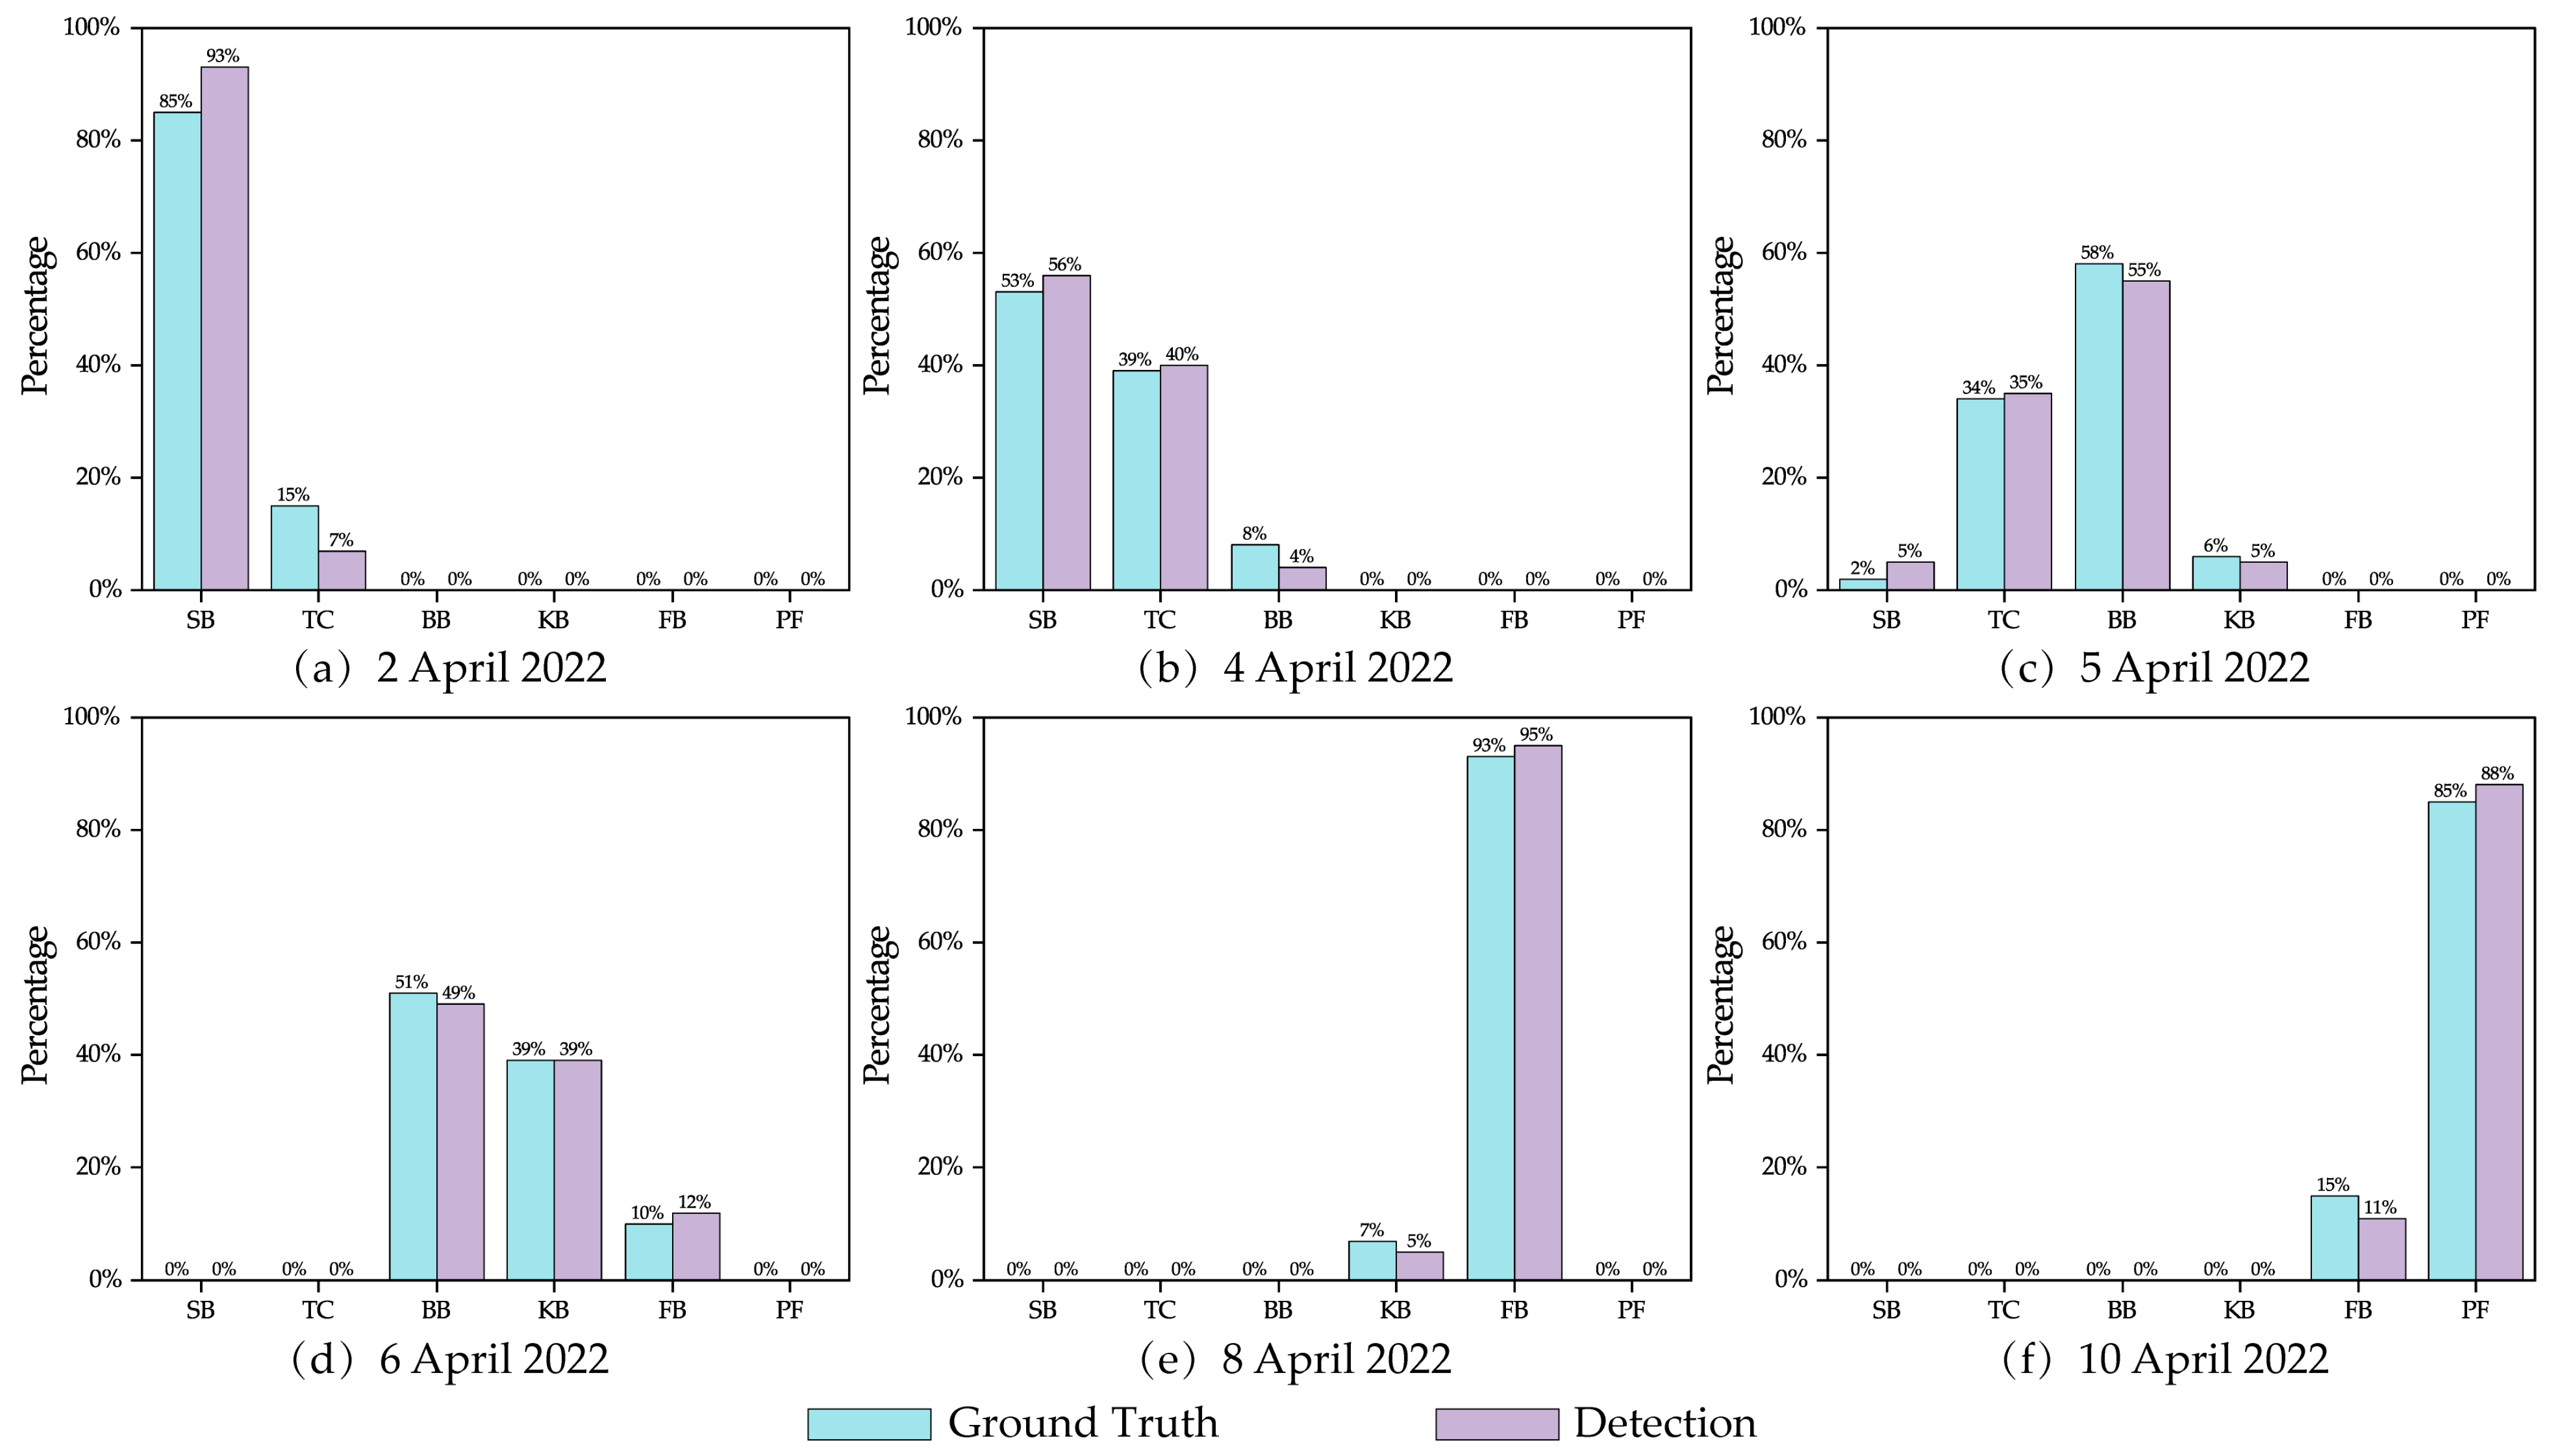
In this paper, apple flower blooming levels are considered independent events. The blooming level estimator counts the percentage of each blooming level stage based on the output of the apple flower detector at a given point in time. The percentage threshold for blooming level determination is set at 60% based on the experience of fruit farmers. Obviously, this blooming level estimation method is a higher challenge for the apple flower detector. To verify the effectiveness of the blooming level estimator, the data within the observation sites were collected and counted, and the estimated results were compared with the ground truth values of the percentage of each blooming level obtained by manual counting and statistics. Figure 12 shows the results of the apple flower detector compared with the ground truth for six time periods. From Figure 12, it can be seen that the results of the apple flower detector can accurately follow the trend of apple flower growth level for eleven days from 1 April to 11 April, which indicates that the blooming level estimation method is effective. It is noteworthy that the results from 2 April to 4 April differed from the ground truth values by 4–8%, which is a large difference compared to the results of the other blooming level stages. The reason for this is that apple flowers at the ‘Spitting Buds’ and ‘Tight Clusters’ stages during this period are less distinct and have fewer pixels, making them harder to detect by the detector. As the apple flowers grow, their features and differences with the environmental background gradually become obvious, so the difference between the detection results of this model and the real values decreases and converges.

3.6. Blooming Peak Day

Tracking the change in the number of apple flowers during the ‘King Bloom’ and ‘Full Bloom’ stages facilitates peak blooming date finding. The peak blooming curve graph (Figure 13) can be used as a peak blooming day finding estimator, and we plotted the curve using the output of the apple flower detector, with the detected images all coming from the observation site. It can be seen from Figure 13 that each blooming level curve will peak sequentially over time, and the interval between each peak is about one day, which indicates that the apple flower growth status changes greatly in a short period of time. ‘KB’ is a landmark stage of apple flower growth that has an important influence on flower pollination [44]. The timing of flower thinning is generally decided by the ratio of ‘King Bloom’ clusters and ‘Full Bloom’ clusters, therefore the distinction between ‘KB’ and ‘FB’ growth stages and merging them in the peak blooming day finding estimator helps farmers to have a more accurate picture of orchard blooming levels and make decisions. The ‘KB + FB’ curve in Figure 13 is the sum of the ‘King Bloom’ and ‘Full Bloom’ curves, and the horizontal coordinate point corresponding to the first intersection of this curve with the 80% peak blooming threshold line is the global peak blooming date in the orchard. The results show that the apple flowers in the observation site reached peak flowering around 6 April, which is highly consistent with the judgment of orchard management experts. Therefore, the peak blooming day finding estimator can be used to find the peak blooming date and provide a reliable basis for the determination of the day of flower thinning. Through the analysis in Section 3.4, the good inter-annual detection capability of the apple flower detector provides reliable support for the peak blooming day finding estimator, which made it possible to apply the peak date finder in the following year.

4. Discussion

4.1. Comparison of Improved Model with YOLOv5s

To further evaluate the apple flower detection model proposed in this paper, the Apple Flower A dataset was used for training the apple flower detection model and the YOLOv5s model, and the performance of both algorithms was evaluated using the same test set. The AP values and mean average precision of the test results for each blooming level stage are shown in Table 4. From the results in Table 4, it can be seen that the model proposed in this paper obtained 77.5% of mAP compared to the YOLOv5s model with an improvement of 1.7%. The contribution of the mAP enhancement comes from the improved detection capability of the model in this paper for small objects and objects with insignificant features. Compared with the YOLOv5s model, the AP of flowers at the ‘Spitting Buds’ and ‘Tight Clusters’ stages was improved by 4.8% and 1.8%, respectively.
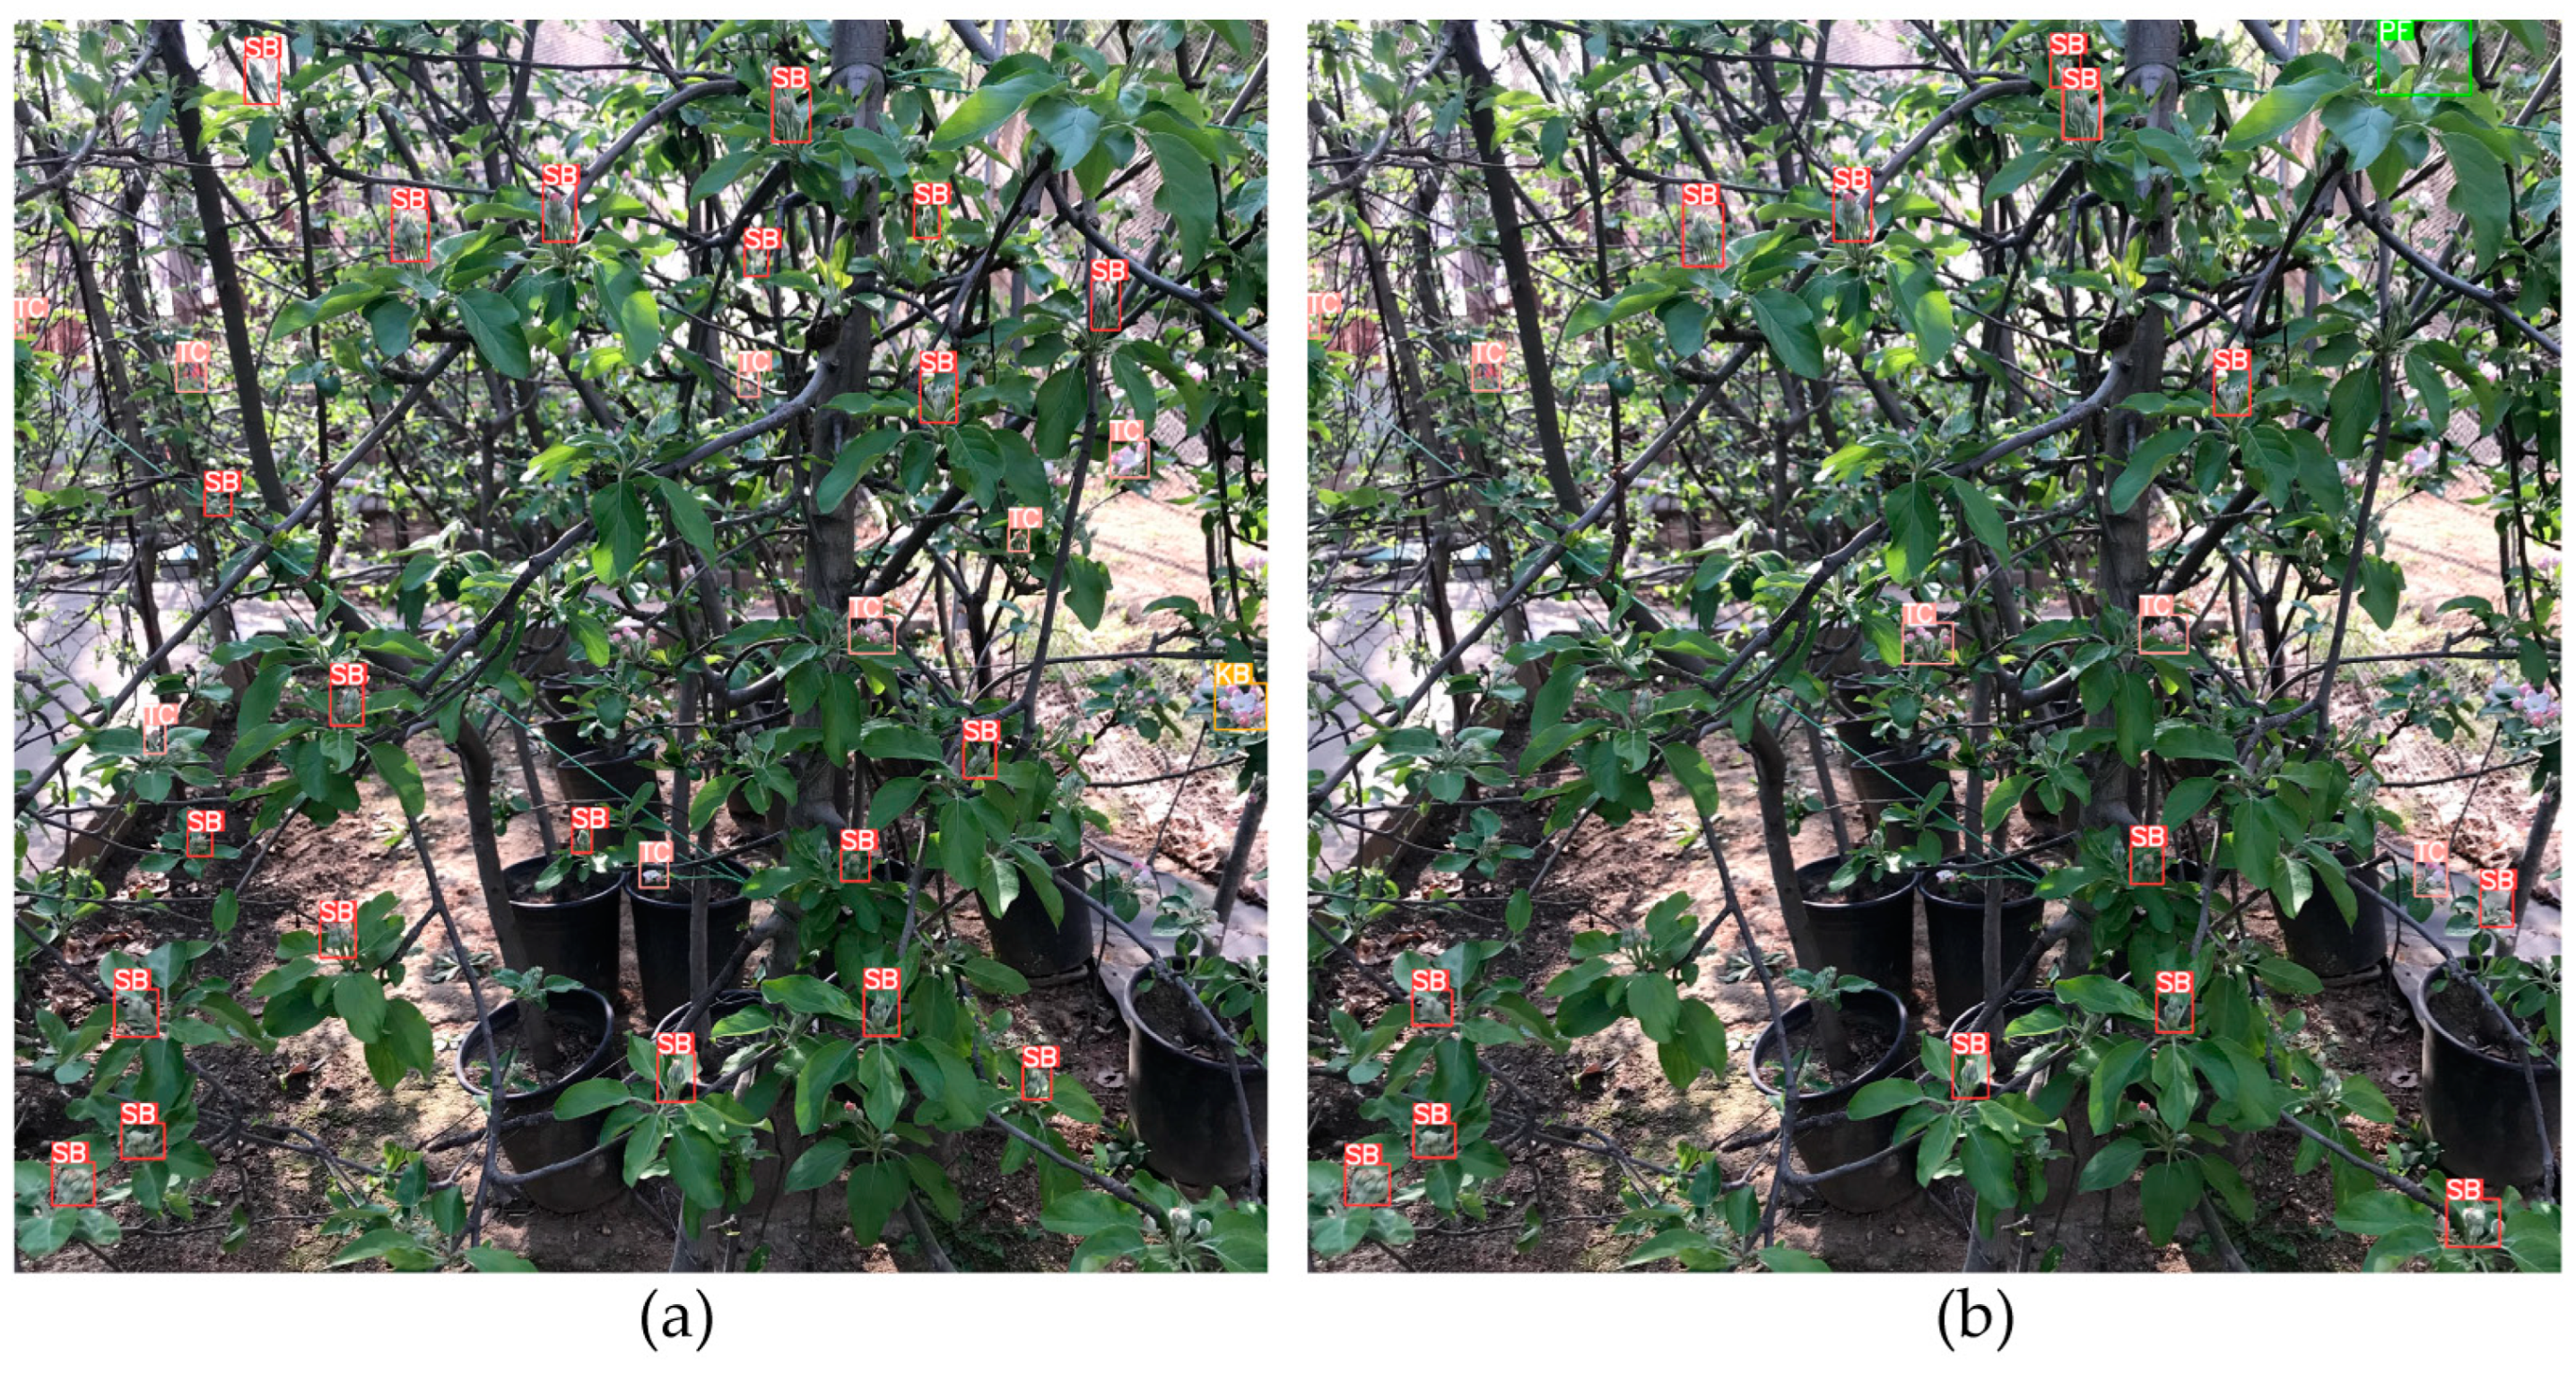
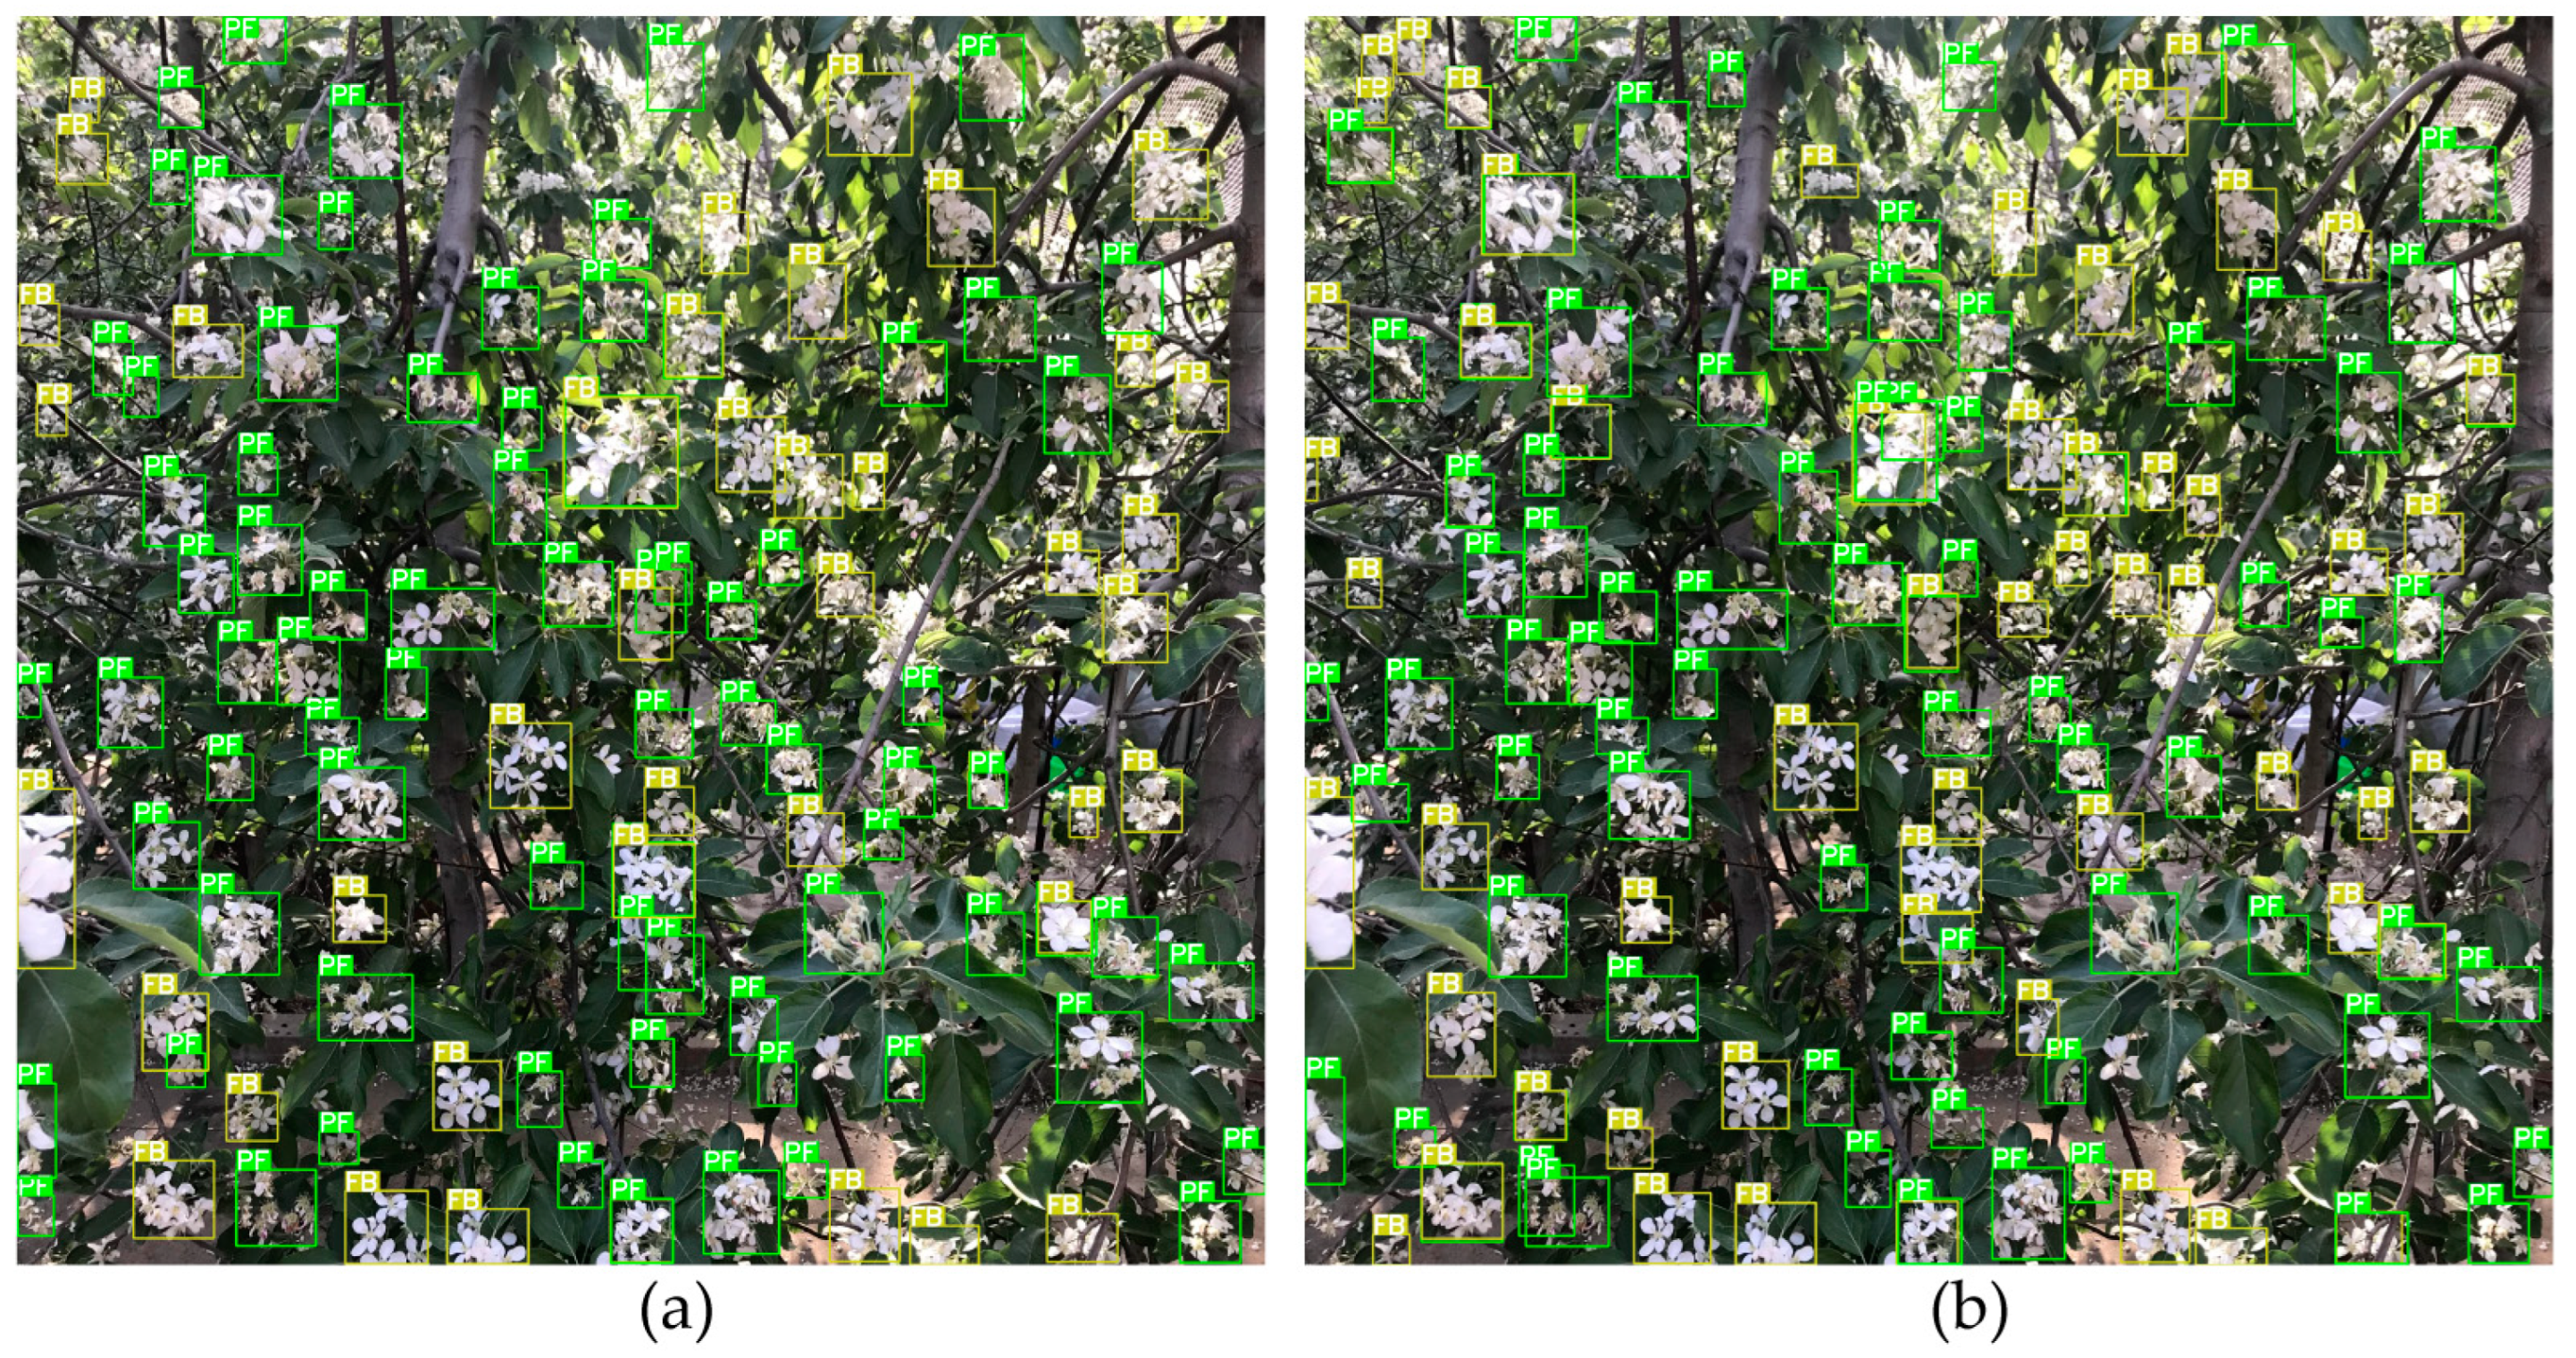
The detection results in Figure 14 show that many apple flowers at the ‘Spitting Buds’ and ‘Tight Clusters’ stages were not detected by the YOLOv5s model, but the model in this paper significantly reduced the phenomenon of missed detection of the flower bud. In Figure 15, the clusters in the ‘Petal Fall’ stage are messy, and apple flowers in the transition from ‘Full Bloom’ to the ‘Petal Fall’ stage are not easily distinguished from each other, which makes it difficult to determine the blooming level. The detection results of YOLOv5s show more false identifications and overlapping object boxes, but the model in this paper accurately determines the blooming level of the messy flower clusters, reducing the false detection of clusters and the duplicate identification of objects. From the above results, it can be seen that the apple flower detection model in this paper shows good classification and small-target bud detection performance in detecting apple flowers with different blooming levels.

4.2. Comparison of Proposed Model with Baseline Model

Comparison with the baseline models can reveal the patterns in the process of apple flower detection by different models and verify the effectiveness of the models in this paper. We selected three baseline object detection models, Faster R-CNN [45], YOLOv3 [35], and SSD [46], for experiments, respectively. These models were trained and tested on the Apple Flower A dataset. The experimental results of the baseline models and the models in this paper are shown in Table 5. The mAP of each baseline network fluctuated around 74%, and the YOLOv3 model among the baseline models achieved the highest mAP value of 74.6%, while the mAP of this paper’s model was 77.5%, which was 2.9% higher than that of the YOLOv3 model.
The APs of the present model for apple flower detection at the ‘Spitting Buds’ and ‘Tight Clusters’ stages were 44.8% and 76.7%. Compared with the baseline models of YOLOv3, which performed best for the detection of the above two blooming levels, the AP was improved by 4.4% and 3.8%, respectively. Compared with the evaluation results of other blooming levels, all tested models commonly got lower AP in the ‘SB’ stage for the reason that the network lost more unobvious small bud features in the subsampled process. Meanwhile, the too-small apple flower targets caused difficulties in manual labeling, and the missed labeling was regarded as a negative sample, which affected the training of the network. Moreover, the differences in apple flower morphology at the ‘SB’ stage caused by different varieties and the slowly evolving bud features from the ‘SB’ to ‘CB’ stage affected the classification ability of the network. Therefore, the apple flower detector based on the deep learning object detection model has much improved space for the detection of small target buds, and the negative influence of losing the object after resizing the image can be mitigated by sliding the detection window in large-sized images. At the blooming level with obvious apple flower features, the AP of this study model was higher by 1–4% compared with other baseline models. Based on the above theory and practice, it is demonstrated that the proposed apple flower detection model has advantages in apple flower detection at different blooming levels.

5. Conclusions

This study proposes an apple flower blooming level estimation method to provide guidance on the timing of flower thinning, which consists of three modules: an apple flower detector, a blooming level estimator, and a peak blooming day finding estimator. The apple flower blooming level was divided into six stages, and the distribution of apple flowers in different growth forms was used to determine the block-level or global blooming level of the orchard. Based on the natural environment and apple flower growth features, the improved YOLOv5s model was used as the flower detector in this paper. Through the training of the flower detector, the detector achieved the detection of apple flowers at each growth stage in the complex natural background, with different light intensities and different years of data. The experimental results show that the YOLOv5s model, which is added with a coordinated attention machine module and a small object detection layer, can effectively improve the detection performance of the detector for smaller buds in the images. The BiFPN structure effectively improves the complex feature extraction ability and reduces the false detection rate of apple flowers in the messy falling flower stage.
The blooming level estimator is based on statistics of the output of the apple flower detector, and the blooming level is considered an independent event. The flower detector obtained lower accuracy during the budding period of apple flowers, but the results of the blooming level estimator only fluctuated by 4–8%. The results show that the blooming level estimator reduces the sensitivity to miss and error detection by the apple flower detector. The peak blooming day finding estimator achieved the finding of peak blooming dates at the orchard block level, and the obtained results were recognized by orchard managers.
In this paper, a model for apple flower blooming level estimation is preliminarily discussed. We believe that this method can be easily generalized to the estimation of blooming levels in other species of fruit, such as peach and pear flowers. Furthermore, improving and studying the field estimation model of apple fruit set based on variety effects after flowering thinning is instructive for later fruit thinning and yield prediction. The performance of the global blooming level estimation in the orchard is to be tested, and the next step is to record the variation of apple flower growth status in different locations of the orchard. The development of an autonomous mobile robot with embedded data collection equipment makes it possible to capture global orchard images. Future work will map the distribution of blooming levels in the orchard to enable the selection of flower thinning timing in different areas of the orchard, which will help to provide more detailed management and decision information on the nutrient load balance of each fruit tree.

Author Contributions

Conceptualization, Z.C.; methodology, Z.C. and R.S.; software, R.S.; validation, Z.C., R.S. and G.C.; formal analysis, Z.C.; investigation, Z.C.; resources, J.W.; data curation, Z.C. and R.S.; writing—original draft preparation, Z.C. and R.S.; writing—review and editing, Z.C., R.S., Z.W., P.Y. and G.C.; visualization, Z.C. and R.S.; project administration, J.W. and Y.W.; funding acquisition, J.W. All authors have read and agreed to the published version of the manuscript.

Funding

This research was funded by the National Key Research and Development Project, grant number 2020YFD1000201; National Apple Industry Technology System Project, grant number CARS-27.

Data Availability Statement

Given that the data used in this study were self-collected, the dataset is being further improved. Thus, the dataset is unavailable at present.

Acknowledgments

The authors would like to thank the anonymous reviewers for their constructive suggestions, which comprehensively improved the quality of the paper.

Conflicts of Interest

The authors declare no conflict of interest.

References

  1. Link, H. Significance of flower and fruit thinning on fruit quality. Plant Growth Regul. 2000, 31, 17–26. [Google Scholar] [CrossRef]
  2. Aggelopoulou, K.D.; Wulfsohn, D.; Fountas, S.; Gemtos, T.A.; Nanos, G.D.; Blackmore, S. Spatial variation in yield and quality in a small apple orchard. Precis. Agric. 2009, 11, 538–556. [Google Scholar] [CrossRef]
  3. Suo, G.-D.; Xie, Y.-S.; Zhang, Y.; Cai, M.-Y.; Wang, X.-S.; Chuai, J.-F. Crop load management (CLM) for sustainable apple production in China. Sci. Hortic. 2016, 211, 213–219. [Google Scholar] [CrossRef]
  4. Solomakhin, A.A.; Blanke, M.M. Mechanical flower thinning improves the fruit quality of apples. J. Sci. Food Agric. 2010, 90, 735–741. [Google Scholar] [CrossRef]
  5. DeLong, C.N.; Yoder, K.S.; Cochran, A.E.; Kilmer, S.W.; Royston, W.S.; Combs, L.D.; Peck, G.M. Apple Disease Control and Bloom-Thinning Effects by Lime Sulfur, Regalia, and JMS Stylet-Oil. Plant Health Prog. 2018, 19, 143–152. [Google Scholar] [CrossRef]
  6. Greene, D.W. Chemicals, Timing, and Environmental Factors Involved in Thinner Efficacy on Apple. HortScience 2002, 37, 477–481. [Google Scholar] [CrossRef]
  7. Wang, X.; Tang, J.; Whitty, M. DeepPhenology: Estimation of apple flower phenology distributions based on deep learning. Comput. Electron. Agric. 2021, 185, 106123. [Google Scholar] [CrossRef]
  8. Mamat, N.; Othman, M.F.; Abdoulghafor, R.; Belhaouari, S.B.; Mamat, N.; Mohd Hussein, S.F. Advanced Technology in Agriculture Industry by Implementing Image Annotation Technique and Deep Learning Approach: A Review. Agriculture 2022, 12, 1033. [Google Scholar] [CrossRef]
  9. Sozzi, M.; Cantalamessa, S.; Cogato, A.; Kayad, A.; Marinello, F. Automatic bunch detection in white grape varieties using YOLOv3, YOLOv4, and YOLOv5 deep learning algorithms. Agronomy 2022, 12, 319. [Google Scholar] [CrossRef]
  10. Patrício, D.I.; Rieder, R. Computer vision and artificial intelligence in precision agriculture for grain crops: A systematic review. Comput. Electron. Agric. 2018, 153, 69–81. [Google Scholar] [CrossRef]
  11. Aggelopoulou, A.D.; Bochtis, D.; Fountas, S.; Swain, K.C.; Gemtos, T.A.; Nanos, G.D. Yield prediction in apple orchards based on image processing. Precis. Agric. 2010, 12, 448–456. [Google Scholar] [CrossRef]
  12. Hočevar, M.; Širok, B.; Godeša, T.; Stopar, M. Flowering estimation in apple orchards by image analysis. Precis. Agric. 2013, 15, 466–478. [Google Scholar] [CrossRef]
  13. Comas, A.T.; Valente, J.; Kooistra, L. Automatic Apple Tree Blossom Estimation from Uav Rgb Imagery. Int. Arch. Photogramm. Remote Sens. Spat. Inf. Sci. 2019, 42, 631–635. [Google Scholar] [CrossRef] [Green Version]
  14. Piani, M.; Bortolotti, G.; Manfrini, L. Apple orchard flower clusters density mapping by unmanned aerial vehicle RGB acquisitions. In Proceedings of the 2021 IEEE International Workshop on Metrology for Agriculture and Forestry (MetroAgriFor), Perugia, Italy, 3–5 November 2021; pp. 92–96. [Google Scholar]
  15. Petrellis, N.; Antonopoulos, C.; Keramidas, G.; Voros, N. Mobile Plant Disease Classifier, Trained with a Small Number of Images by the End User. Agronomy 2022, 12, 1732. [Google Scholar] [CrossRef]
  16. Wang, F.; Sun, Z.; Chen, Y.; Zheng, H.; Jiang, J. Xiaomila Green Pepper Target Detection Method under Complex Environment Based on Improved YOLOv5s. Agronomy 2022, 12, 1477. [Google Scholar] [CrossRef]
  17. Peng, Y.; Wang, A.; Liu, J.; Faheem, M. A Comparative Study of Semantic Segmentation Models for Identification of Grape with Different Varieties. Agriculture 2021, 11, 997. [Google Scholar] [CrossRef]
  18. Tian, Y.; Yang, G.; Wang, Z.; Wang, H.; Li, E.; Liang, Z. Apple detection during different growth stages in orchards using the improved YOLO-V3 model. Comput. Electron. Agric. 2019, 157, 417–426. [Google Scholar] [CrossRef]
  19. Qi, C.; Nyalala, I.; Chen, K. Detecting the Early Flowering Stage of Tea Chrysanthemum Using the F-YOLO Model. Agronomy 2021, 11, 834. [Google Scholar] [CrossRef]
  20. Xia, X.; Chai, X.; Zhang, N.; Sun, T. Visual classification of apple bud-types via attention-guided data enrichment network. Comput. Electron. Agric. 2021, 191, 106504. [Google Scholar] [CrossRef]
  21. Wu, D.; Lv, S.; Jiang, M.; Song, H. Using channel pruning-based YOLO v4 deep learning algorithm for the real-time and accurate detection of apple flowers in natural environments. Comput. Electron. Agric. 2020, 178, 105742. [Google Scholar] [CrossRef]
  22. Dias, P.A.; Tabb, A.; Medeiros, H. Multispecies Fruit Flower Detection Using a Refined Semantic Segmentation Network. IEEE Robot. Autom. Lett. 2018, 3, 3003–3010. [Google Scholar] [CrossRef] [Green Version]
  23. Mu, X.; He, L. Mask R-CNN Based King Flowers Identification for Precise Apple Pollination. In Proceedings of the 2021 ASABE Annual International Virtual Meeting, St. Joseph, MI, USA, 12–16 July 2021. [Google Scholar]
  24. Sun, K.; Wang, X.; Liu, S.; Liu, C. Apple, peach, and pear flower detection using semantic segmentation network and shape constraint level set. Comput. Electron. Agric. 2021, 185, 106150. [Google Scholar] [CrossRef]
  25. Dias, P.A.; Tabb, A.; Medeiros, H. Apple flower detection using deep convolutional networks. Comput. Ind. 2018, 99, 17–28. [Google Scholar] [CrossRef] [Green Version]
  26. Bhattarai, U.; Bhusal, S.; Majeed, Y.; Karkee, M. Automatic blossom detection in apple trees using deep learning. IFAC-Pap. 2020, 53, 15810–15815. [Google Scholar] [CrossRef]
  27. Wang, X.; Tang, J.; Whitty, M. Side-view apple flower mapping using edge-based fully convolutional networks for variable rate chemical thinning. Comput. Electron. Agric. 2020, 178, 105673. [Google Scholar] [CrossRef]
  28. Zhang, Y.; He, S.; Wa, S.; Zong, Z.; Liu, Y. Using Generative Module and Pruning Inference for the Fast and Accurate Detection of Apple Flower in Natural Environments. Information 2021, 12, 495. [Google Scholar] [CrossRef]
  29. Bhattarai, U.; Karkee, M. A weakly-supervised approach for flower/fruit counting in apple orchards. Comput. Ind. 2022, 138, 103635. [Google Scholar] [CrossRef]
  30. Farjon, G.; Krikeb, O.; Hillel, A.B.; Alchanatis, V. Detection and counting of flowers on apple trees for better chemical thinning decisions. Precis. Agric. 2019, 21, 503–521. [Google Scholar] [CrossRef]
  31. Tian, Y.; Yang, G.; Wang, Z.; Li, E.; Liang, Z. Instance segmentation of apple flowers using the improved mask R–CNN model. Biosyst. Eng. 2020, 193, 264–278. [Google Scholar] [CrossRef]
  32. Dennis, F., Jr. The history of fruit thinning. Plant Growth Regul. 2000, 31, 1–16. [Google Scholar] [CrossRef]
  33. Redmon, J.; Divvala, S.; Girshick, R.; Farhadi, A. You only look once: Unified, real-time object detection. In Proceedings of the IEEE Conference on Computer Vision and Pattern Recognition, Las Vegas, NV, USA, 26 June–1 July 2016; pp. 779–788. [Google Scholar]
  34. Redmon, J.; Farhadi, A. YOLO9000: Better, faster, stronger. In Proceedings of the IEEE Conference on Computer Vision and Pattern Recognition, Honolulu, HI, USA, 21–26 July 2017; pp. 7263–7271. [Google Scholar]
  35. Redmon, J.; Farhadi, A. Yolov3: An incremental improvement. arXiv 2018, arXiv:1804.02767. [Google Scholar]
  36. Bochkovskiy, A.; Wang, C.-Y.; Liao, H.-Y.M. Yolov4: Optimal speed and accuracy of object detection. arXiv 2020, arXiv:2004.10934. [Google Scholar]
  37. Wang, D.; He, D. Channel pruned YOLO V5s-based deep learning approach for rapid and accurate apple fruitlet detection before fruit thinning. Biosyst. Eng. 2021, 210, 271–281. [Google Scholar] [CrossRef]
  38. Pei, H.; Sun, Y.; Huang, H.; Zhang, W.; Sheng, J.; Zhang, Z. Weed Detection in Maize Fields by UAV Images Based on Crop Row Preprocessing and Improved YOLOv4. Agriculture 2022, 12, 975. [Google Scholar] [CrossRef]
  39. Ultralytics. YOLOv5: v6.0. Available online: https://github.com/ultralytics/yolov5 (accessed on 19 May 2022).
  40. Hou, Q.; Zhou, D.; Feng, J. Coordinate attention for efficient mobile network design. In Proceedings of the IEEE/CVF Conference on Computer Vision and Pattern Recognition, Nashville, TN, USA, 20–25 June 2021; pp. 13713–13722. [Google Scholar]
  41. Zhu, X.; Lyu, S.; Wang, X.; Zhao, Q. TPH-YOLOv5: Improved YOLOv5 based on transformer prediction head for object detection on drone-captured scenarios. In Proceedings of the IEEE/CVF International Conference on Computer Vision, Montreal, QC, Canada, 11–17 October 2021; pp. 2778–2788. [Google Scholar]
  42. Lin, T.-Y.; Goyal, P.; Girshick, R.; He, K.; Dollár, P. Focal loss for dense object detection. In Proceedings of the IEEE International Conference on Computer Vision, Venice, Italy, 22–29 October 2017; pp. 2980–2988. [Google Scholar]
  43. Tan, M.; Pang, R.; Le, Q.V. Efficientdet: Scalable and efficient object detection. In Proceedings of the IEEE/CVF Conference on Computer Vision and Pattern Recognition, Seattle, WA, USA, 13–19 June 2020; pp. 10781–10790. [Google Scholar]
  44. Losada, J.M.; Herrero, M. Flower strategy and stigma performance in the apple inflorescence. Sci. Hortic. 2013, 150, 283–289. [Google Scholar] [CrossRef] [Green Version]
  45. Ren, S.; He, K.; Girshick, R.; Sun, J. Faster r-cnn: Towards real-time object detection with region proposal networks. Adv. Neural Inf. Process. Syst. 2017, 39, 1137–1149. [Google Scholar] [CrossRef]
  46. Liu, W.; Anguelov, D.; Erhan, D.; Szegedy, C.; Reed, S.; Fu, C.-Y.; Berg, A.C. Ssd: Single shot multibox detector. In Proceedings of the European Conference on Computer Vision, Amsterdam, The Netherlands, 11–14 October 2016; pp. 21–37. [Google Scholar]
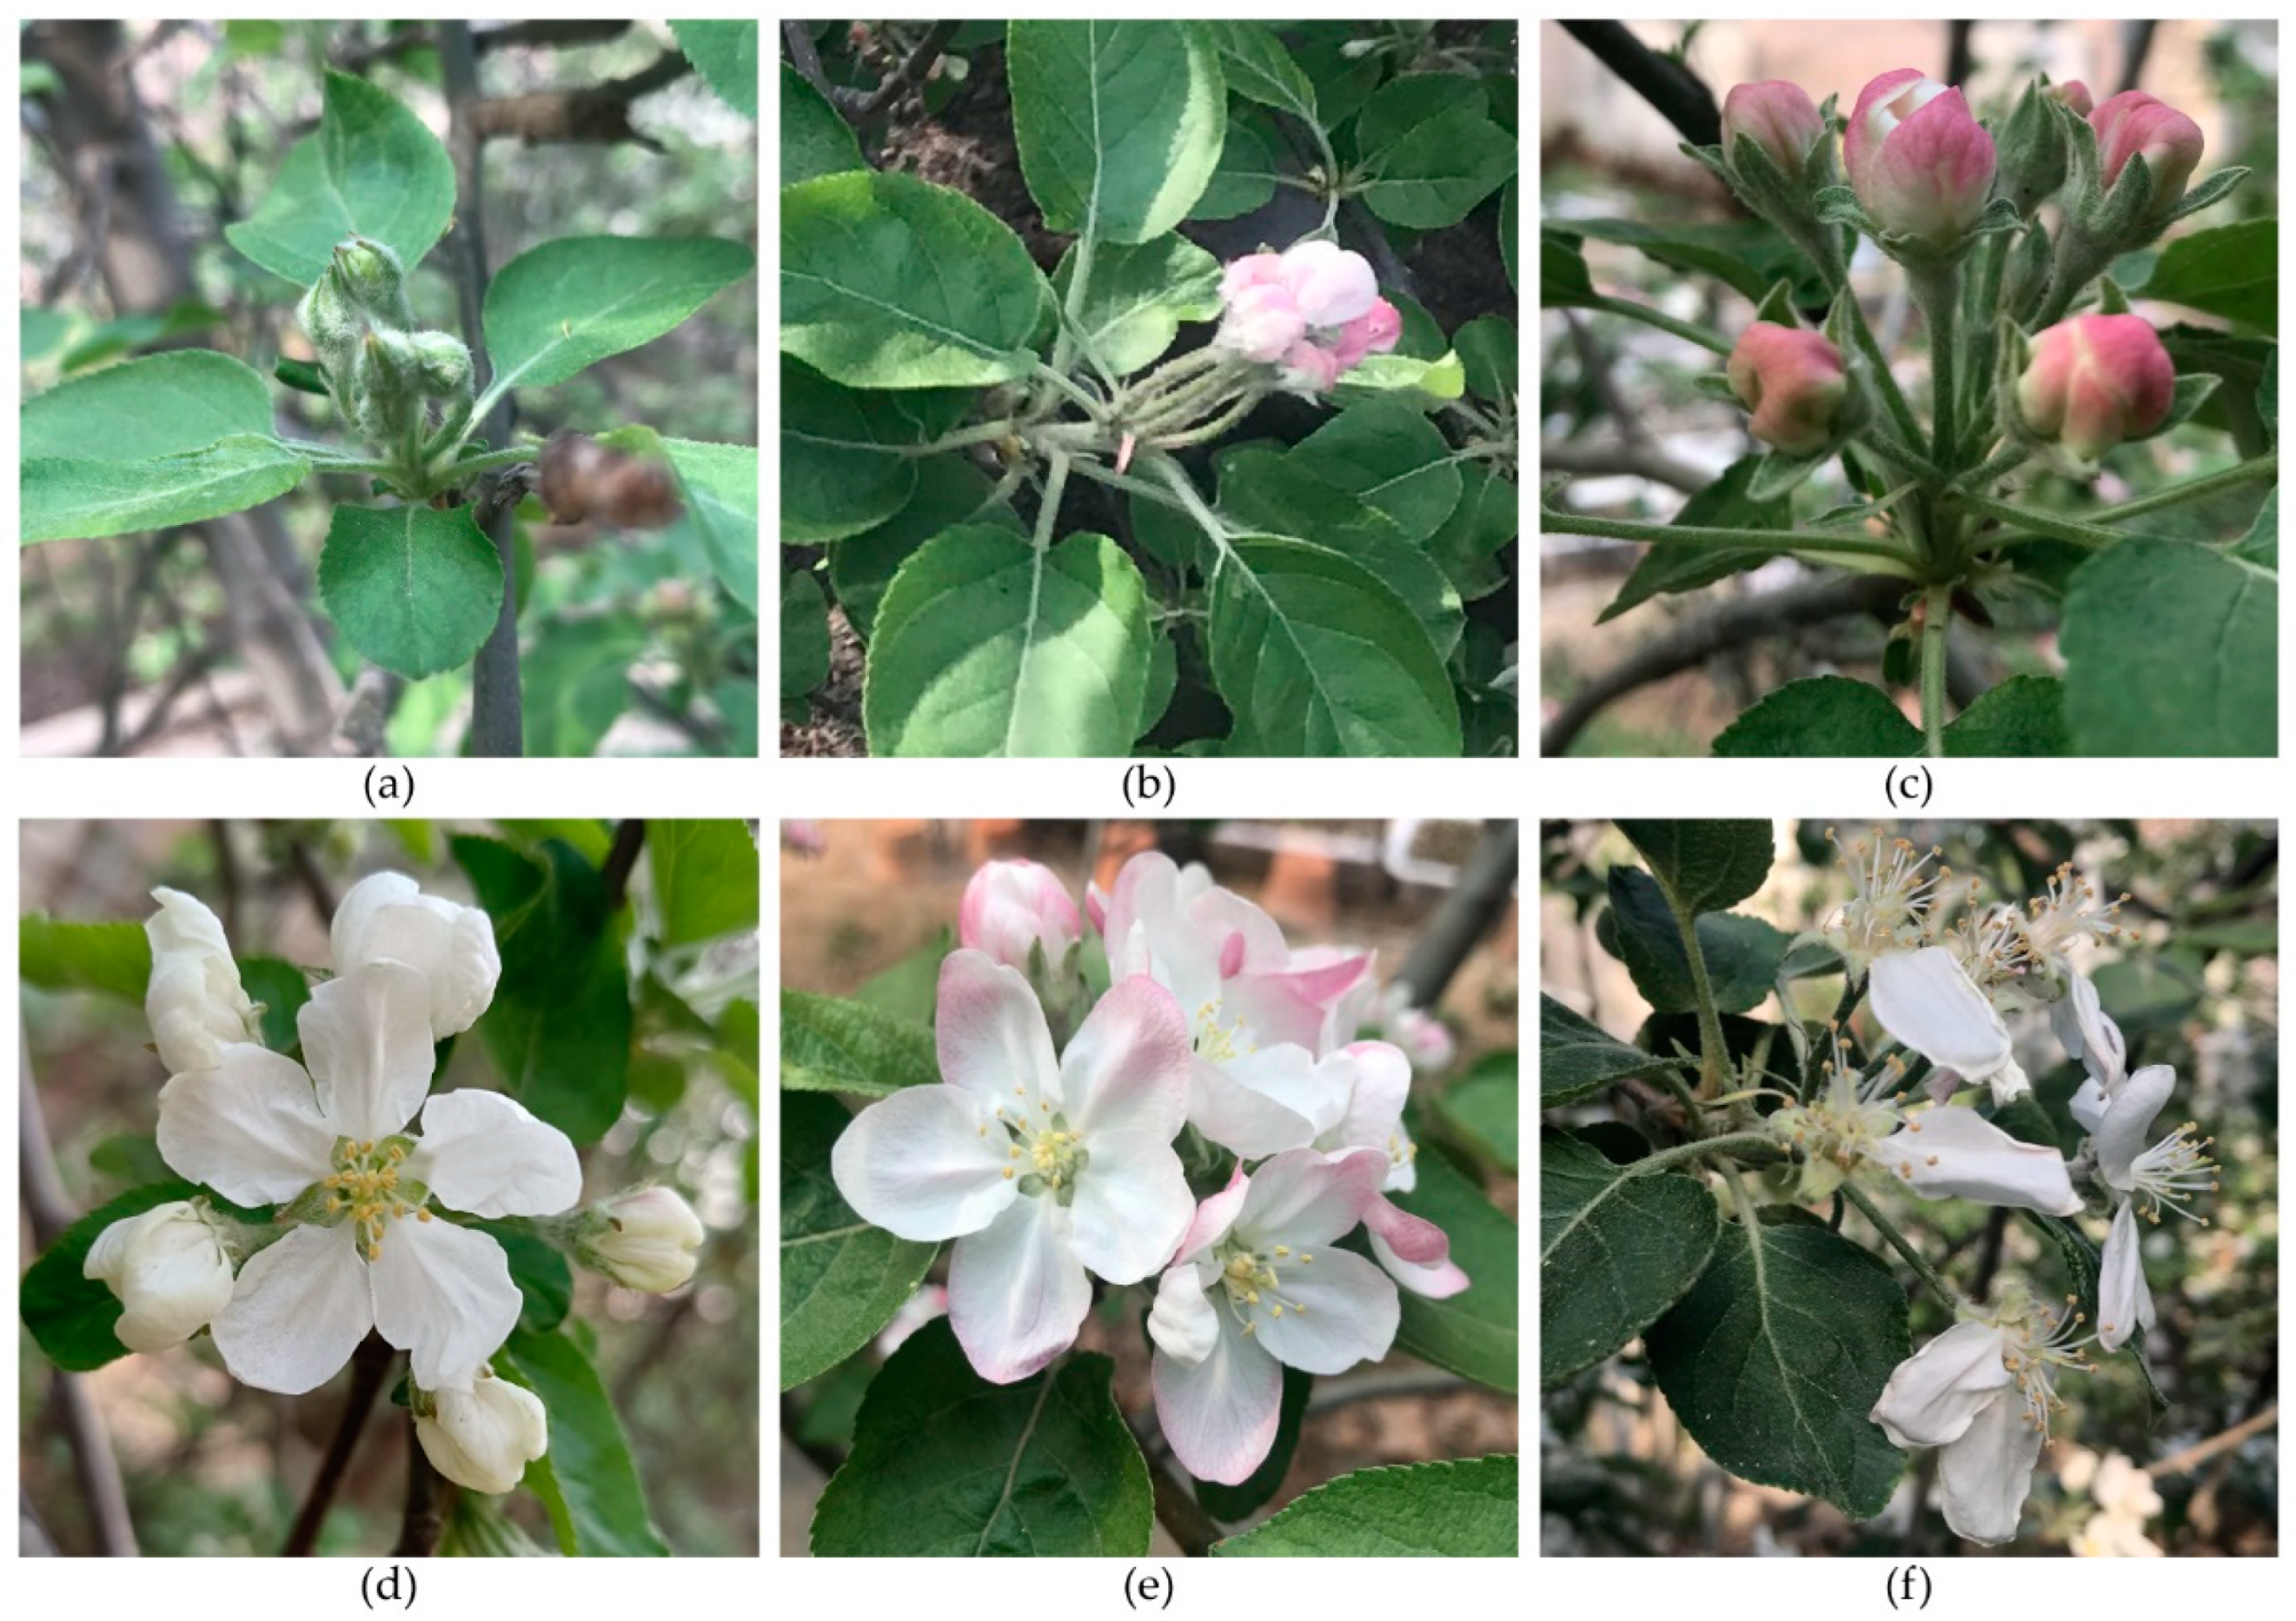
Figure 1. Apple flower blooming level. (a) Spitting Buds (SB); (b) Tight Clusters (TC); (c) Balloon Blossom (BB); (d) King Bloom (KB); (e) Full Bloom (FB); (f) Petal Fall (PF).
Agronomy 12 02483 g001
Figure 2. Data collection environment. (a) Data collection locations; (b) Modern orchards.
Agronomy 12 02483 g002
Figure 3. Image collection device and collection method.
Agronomy 12 02483 g003
Figure 4. Image augmentation methods. (a) Original image; (b) Vertical flip; (c) Horizontal flip; (d) Cutout; (e) Random scaling; (f) Brightness transformation.
Agronomy 12 02483 g004
Figure 5. Images of apple flowers in complex natural environments. (a) Unclear features of the buds; (b) Complex light conditions.
Agronomy 12 02483 g005
Figure 6. YOLOv5 model. The number to the left of each layer of the network is used to mark the number of the layer.
Agronomy 12 02483 g006
Figure 7. Coordinate Attention layer.
Agronomy 12 02483 g007
Figure 8. BiFPN structure.
Agronomy 12 02483 g008
Figure 9. Improved YOLOv5s network structure. The number to the left of each layer of the network is used to mark the number of the layer. The coordinate attention layer is inserted into the back end of the backbone network. A small object detection layer of size 80 × 80 is added, located in the 1st detection head. The features in layers 7 and 6 are weighted fused with the features in layers 24 and 27, respectively, and WFF denotes the weighted feature fusion operation.
Agronomy 12 02483 g009
Figure 10. Results of model detection of apple flowers at each blooming level under higher light intensity conditions. (a) Spitting Buds; (b) Tight Clusters; (c) Balloon Blossom; (d) King Bloom; (e) Full Bloom; (f) Petal Fall.
Agronomy 12 02483 g010
Figure 11. Results of model detection of apple flowers at each blooming level under low light intensity at nightfall. (a) Spitting Buds; (b) Tight Clusters; (c) Balloon Blossom; (d) King Bloom; (e) Full Bloom; (f) Petal Fall.
Agronomy 12 02483 g011
Figure 12. Results of blooming level estimation.
Agronomy 12 02483 g012
Figure 13. Peak blooming day finding.
Agronomy 12 02483 g013
Figure 14. Comparison of the improved model in this paper and the YOLOv5s model for the detection of apple flowers at the ‘Spitting Buds’ stage. (a) Our model; (b) YOLOv5s.
Agronomy 12 02483 g014
Figure 15. Comparison of the detection results of the model in this paper and the YOLOv5s model for apple flowers at the ‘Petal Fall’ stage. (a) Our model; (b) YOLOv5s.
Agronomy 12 02483 g015
Table 1. Summary of the dataset.
YearsDateBlooming LevelTotal ImagesWeather
202111 April 2021FB203Light Rain
12 April 2021FB452Cloud
13 April 2021FB/PF382Clear
14 April 2021PF462Cloud
20221 April 2022SB337Clear
2 April 2022SB/TC613Clear
3 April 2022TC221Clear
4 April 2022TC/BB493Clear
5 April 2022BB/KB297Clear
6 April 2022KB/FB321Clear
7 April 2022FB502Clear
8 April 2022FB236Clear
9 April 2022FB212Clear
10 April 2022FB/PF500Cloud
11 April 2022PF452Cloud
Notes: See Figure 1 for an explanation of the blooming level abbreviations.
Table 2. Model training parameters.
Training ParametersValues
Input Image Size640 × 640
Batch Size4
Iterations160,000
Momentum0.937
Weight Decay Rate0.0005
Initial Learning Rate0.01
Table 3. Results of evaluating the generalizability of flower detectors across years.
YearsmAP (%)AP (%)
FBPF
202186.487.285.6
202286.687.585.8
Table 4. Comparative experimental results of the improved model and the YOLOv5s model.
ModelmAP (%)AP (%)
SBTCBBKBFBPF
YOLOv5s75.840.074.984.682.287.285.7
Ours77.544.876.785.884.187.585.8
Table 5. The results of this paper’s apple flower detection model are compared with the baseline model.
ModelmAP (%)AP (%)
SBTCBBKBFBPF
Faster R-CNN73.437.071.483.179.684.684.5
SSD73.939.570.583.880.285.184.2
YOLOv374.640.472.983.681.385.084.7
Ours77.544.876.785.884.187.585.8
Publisher’s Note: MDPI stays neutral with regard to jurisdictional claims in published maps and institutional affiliations.